What is: Web Analytics – A Beginner’s Guide
November 19, 2015 by Editorial Team ( 450 ) under HIPAA Compliant Hosting
0 Comments
Target Audience
This article is a good starting point for website administrators wanting to learn about Web Analytics and some tools and methods for seeing how their sites perform.
.
Introduction
Traffic — it’s one thing nearly all website owners want. How can you tell if your site is thriving or anemic? Web analytics has the answers. When checked regularly, web analytics provides crucial feedback, giving you clear numbers that gauge the effectiveness of your site.
.
Web-based Reporting
Most web analytics software comes in the form of a web-based dashboard or control panel. By selecting options on a form in your browser, you can obtain a variety of reports that show the kinds of traffic your site has had. Since the analytics software is web-based, you can check on your site’s activity from nearly any Internet-connected PC or mobile device. Many of the reports have graphics that chart activity by time or geographic location.
Examples of analytic software include Google Analytics, Advanced Web Statistics, and Clicky. Many hosting providers also bundle an analytics program with their cloud hosting service.
.
Types of Web Analytics Software
.
Log File
The server that hosts your website has a log file that keeps track of every page it delivers. Among other information, the log records the date and time, the page requested, and the IP address of the requester. In addition to pages, log files keep track of graphics, PDFs, video and other files sent. A typical log file might contain thousands to millions of records–raw data that by itself makes for dull reading, but some analytics software can use it to generate highly-detailed, accurate reports.
.
Page Tagging
The page tagging approach to web analytics dispenses with log files, relying instead on programming code embedded in the pages themselves. The code passes data to an analytics server that logs the site’s activity in its own database. Page tagging can track information not found in the log file, such as items purchased or JavaScript buttons clicked. Because it doesn’t depend on the log file (which may be inaccessible to website administrators in some hosted environments), page tagging allows greater choice in analytics software. A possible downside to page tagging is slower website response time. The extra code may invoke lookups to additional domains, which can add to the load time of a page.
.
Web Analytics Metics
.
Quantifying Traffic
When a visitor goes to your website, that visitor’s browser requests files from your site’s server, and the server serves the requested files in response. Each request is called a hit–a hit counting as one page, graphic, or other content. A visit to a single page, then, involves the file for the page itself and any other files the page code refers to (scripts, images, videos, etc.). One page request may result in multiple hits per page. A single user session spanning many pages can generate hundreds or thousands of hits. Although hits are a significant number in web analytics, their ability to indicate traffic is somewhat vague. To give reports more detail, analytics software uses the visitor’s IP address or a data token called a cookie. All of a user’s hits are tied to this identifier, so analytics software can sort visits by this identifier and track the number of unique visitors per day, week, or month.
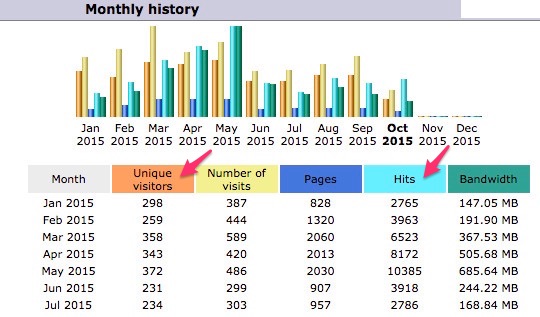
Hits and Unique Visitors
.
Page Statistics
Analytics software also generates statistics showing you which pages are most popular and those that see little traffic. This information is essential when you’re checking the effectiveness of a marketing campaign, for example; a spike in a page’s hit numbers can mean more people found it.
.
Geographic Statistics
The IP address can also indicate a visitor’s general geographic region, giving you a broad idea, for example, how much of your site’s traffic came from the US, Japan, or other countries.
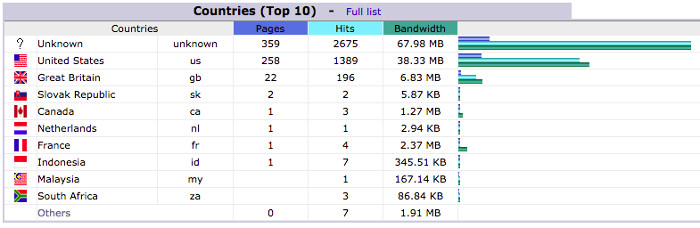
Visitors by Geographic Location
.
User Experience
Some Web analytics programs can show you the order in which visitors click through your pages. For example, a visitor begins a session on your home page, clicks on a “products” link, views several products, and then clicks a “support” link. If your site is a simple one with few pages, the page order is simple with few variations. On larger sites, page order can be more critical, especially if you expect visitors to take specific paths. Page order statistics can reveal interesting and unexpected information about your users’ behavior, giving you insight into how you might fine-tune your site to improve their experience.
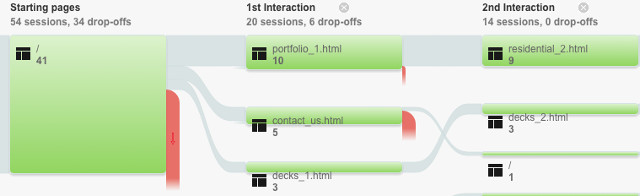
Simple Example of Page Order Tracking
.
Heat Maps
Heat maps are an innovative way of visualizing website performance. They display the most popular clickable areas of a page in “hot” colors such as red and yellow and low-activity areas in “cooler” greens and blues. Heat maps can be easier to grasp and quicker to evaluate than pages of dry statistics.
.
Referrers
An analytics report can also indicate how your visitors found your site, showing statistics for search engines and referring links on other sites.
.
Error Reporting
You can also get reports on errors with your site, such as pages not found. If the errors portion of your web analysis report has several problems, it may indicate your site is missing files or contains outdated links.
.
Conversion Rate
Conversion rate is another important metric measuring how many visitors purchase goods, sign up for a newsletter, or otherwise make a tangible commitment to what your site offers. To accurately measure conversion, analytics software tracks the user through the transaction pages, omitting incomplete actions such as abandoned shopping carts.
.
Bounce Rate
A website’s bounce rate is the fraction of web visitors who land on a page, and then leave the site without exploring it any further. This number gauges how well the site or a page holds a visitor’s interest.
.
Conclusion
These metrics are just a few of the ways you can get more insight into how well your site attracts, keeps, and engages visitors. We hope this introduction gives you a good start in how you can learn more about how your cloud hosted website performs. Learn more about our reliable HIPAA-compliant cloud hosting solutions.
.
.
Get a $250 Credit and Access to Our Free Tier!
Free Tier includes:
G3.2GB Cloud VPS a Free to Use for One Year
50 GB of Block Storage Free to Use for One Year
50 GB of Snapshots Free to Use for One Year