# Atlantic.Net
> Cloud Hosting by Atlantic.Net
### The Best Dedicated Hosting Providers in 2025
Businesses have several options to choose from when selecting a cloud hosting solution. Many organizations utilize shared hosting, where customers share hardware resources with other users. Most hosting providers also offer cloud hosting, which gives customers complete control over a virtual server within a shared physical machine.
Organizations with specific business requirements may opt for a dedicated hosting solution rather than share resources with other customers. The advantages of a dedicated hosting environment may come with a higher cost and additional client responsibilities regarding its management. We will examine the benefits of dedicated server hosting and identify some of the best dedicated hosting providers.
What Is Dedicated Server Hosting?
Dedicated server hosting is a type of web hosting where a single client rents and gains access to, as well as control of, a complete physical machine. Customers have dedicated resources, unlike shared or Cloud Hosting, in which multiple users share the same hardware and server resources. A shared hosting provider can host numerous websites on a single physical server, leveraging virtualization and shared resources.
Dedicated hosting plans are typically more expensive than shared hosting options. Decision-makers need to consider the costs when determining which type of hosting is most suitable for their needs. The dedicated hosting provider is responsible for maintaining the server, while the client is responsible for server setup, ensuring security, and updating the software. Companies may not require the use of a dedicated server to meet their objectives and can choose a more economical and less technically complex shared solution.
The Best Dedicated Hosting Providers in 2025
Decision-makers should not choose a dedicated server hosting solution without considering the quality of the provider. The following providers all exhibit the qualities expected from the top companies offering dedicated server hosting solutions.
Atlantic.Net
Atlantic.Net has been providing customers with hosting solutions for over 30 years. The company offers a wide range of dedicated hosting options, with customized server configurations designed to meet the specific needs of any business. Their dedicated servers are standalone hardware, running Intel Xeon Scalable and Intel Xeon E3 Series server processors, with discounts available for long-term contracts. Atlantic.Net employs U.S.-based support professionals who are available 24/7, 365 days a year. The provider's data center infrastructure is fully audited and compliant with PCI, HIPAA, and HITECH hosting requirements.
Amazon Web Services (AWS)
AWS EC2 Dedicated Hosts are physical servers dedicated to a single organization's use. The Dedicated Hosts leverage an organization's existing software licenses from Oracle and Microsoft, enabling a company to maintain flexibility and cost-effectiveness while benefiting from the resilience and elasticity of AWS. An AWS Dedicated Host provides customers with visibility and control over how instances are placed on the server, supplying a platform that facilitates meeting corporate compliance and regulatory requirements.
Microsoft Azure
Microsoft Azure provides customers with a reliable platform that enables users to exercise almost complete control over resource allocation. Azure Dedicated Host is a service that provides physical servers capable of hosting one or more virtual machines assigned to a single Azure subscription. Hardware isolation ensures security, allowing companies to run sensitive applications in the cloud. Customers can choose to accelerate specific workloads by sharing physical resources, such as memory and storage.
Google Cloud Platform (GCP)
Google offers sole-tenancy nodes, which provide a client with exclusive access to a physical Compute Engine server dedicated to their project's virtual machines. The hardware isolation of sole-tenant nodes offers enhanced security and control over resource management. The node can be used to provision multiple VMs or serve as a dedicated server to meet security or compliance requirements for workloads that need to be isolated from other activities.
Hostwinds
Hostwinds offers dedicated Windows and Linux servers that are entirely configurable to address unique requirements. Storage options range from RAID 0 to RAID 60, and each server has automatic backups to protect customer data. The company focuses on managed hosting and may not provide sufficient client control to meet the expectations of some customers. The web hosting provider allows clients to obtain up to 128 dedicated IP addresses for enhanced flexibility. HostWinds' team of experienced technical professionals is available 24/7 to resolve customer issues.
The Benefits of Dedicated Server Hosting
A dedicated server offers customers several benefits compared to shared hosting that may align with a company's business requirements and objectives. The following are the most impactful advantages of using a dedicated cloud server.
Full control and customization
Customers enjoy the same degree of control and customization with a cloud-hosted dedicated server as they would with traditional dedicated servers. The client can choose to run any operating system and suite of applications and software tools. There are no limitations on system customization like those that may be enforced with a shared server.
Clients must be prepared for the increased complexity that comes with complete control of the server. Customer teams are provided with root access to the hardware and must possess the technical skills necessary to configure and maintain their server and operating system. Companies without these skills may want to leverage the benefits of a dedicated server with a managed hosting solution.
Enhanced security
A dedicated server offers enhanced security due to its isolation from other users within the environment. There is no risk of cross-site contamination from cyberattacks or malware affecting other clients. Customers are not at risk from misconfigured security controls that may allow other tenants to access their data. Some companies may require the added security and privacy of a dedicated environment to meet regulatory compliance requirements.
Consistent and improved performance
Customers enjoy more consistent and improved performance by having access to the server's complete computing power. They need not be concerned about other tenants using system resources that may be required for peak performance of mission-critical workloads. Dedicated hosting eliminates the resource contention that may impact shared web hosting.
Scalability
Businesses may find that a dedicated server offers more flexibility through horizontal and vertical scaling, allowing them to address fluctuating requirements or high traffic spikes. Customers should be able to easily add storage and upgrade RAM, especially when opting for a bare-metal server option.
Dedicated IP address
Customers get a dedicated IP address with a dedicated hosting solution. A dedicated IP address provides businesses with several benefits, including enhanced security, increased reliability, and improved performance. Organizations can reduce the risk of blacklisting by not sharing an IP with other, potentially unscrupulous clients.
Long-term financial benefits
Companies may incur higher upfront costs with a dedicated server, but may reap some long-term financial benefits. Dedicated servers may be cost-effective at scale for businesses with predictable workloads and consistent, high-volume usage.
When Should Your Business Utilize a Dedicated Server?
Companies should strongly consider dedicated server hosting to address the following business requirements.
A company must meet regulatory compliance standards, such as HIPAA and PCI-DSS, when processing sensitive information. This data includes patient health records and financial information.
The organization seeks complete freedom to configure the system and security settings as they wish.
An organization has mission-critical applications that will benefit from the enhanced performance and reliability of a dedicated server.
Companies running custom software will benefit from root access and the ability to configure server resources to ensure optimal performance.
Qualities of Top Dedicated Server Hosting Companies
The best dedicated hosting providers share most of the following qualities.
High-performance servers - Providers must offer high-performance hardware to address complex and advanced workloads such as machine learning or analytics. Top-tier performance is crucial for high-traffic sites, such as ecommerce stores.
Excellent customer support - Top companies provide 24/7 customer support to address issues with their clients' dedicated server environments. The support team must be capable of quickly resolving any hardware or network issues that affect the customer's environment.
Uptime guarantee - Customers must be protected with a service level agreement (SLA) that guarantees at least 99.9% uptime. Clients with high-traffic websites can't afford outages and lost business opportunities.
Global server locations - Providers with geographically dispersed data centers may be able to deploy servers near a customer's location, resulting in reduced latency and improved site performance.
Customization - Top providers offer customization options, allowing clients to upgrade resources to address their unique requirements. They may also provide customers with access to add-ons, such as a control panel and automated backups.
Management options - The provider should have managed and unmanaged options, allowing customers to adopt a hands-off approach or leverage their technical expertise for more control over the environment.
Clear pricing plans - Customers should be able to clearly understand the costs of their hosting account and not be surprised by hidden fees, allowing them to budget accurately.
Outstanding reputation - The top providers demonstrate a proven track record and have built a strong reputation based on satisfied customers.
Conclusion
Dedicated hosting offers customers significant advantages over shared hosting, enabling them to address their business requirements and objectives more effectively. Decision-makers should consider the benefits of dedicated servers when selecting a web hosting solution. The companies listed above provide an excellent selection of viable dedicated hosting providers.
Get in touch with Atlantic.Net's dedicated hosting experts today to get started with a dedicated server tailored to your business needs.
### 8 of the Most Popular Machine Learning Tools in 2025
Machine Learning tools are very popular with data scientists; they are used to build, train, analyze, and forecast future outcomes based on historical and pre-existing data. ML tools are a big deal to the artificial intelligence community, especially as we are now seeing rapid adoption and AI integration into a wide range of business operations.
Selecting the right tool for an ML project is a critical. Making the wrong choice may lead to slow development cycles and models that are difficult to deploy, while the right choice can accelerate the entire workflow from data preparation to production.
This guide offers a practical look at new machine learning tools, including the top indispensable ML tools in 2025. We are focusing on tools that have been well-received by data scientists. We will explore the distinct personalities of each ML Tool, where they excel, and consider the practical trade-offs you may face when choosing one ML tool over the other for your next project.
What Defines a Machine Learning Tool?
Machine learning tools (ML tools) are the essential software kits that developers use to build, test, and understand artificial intelligence models. They provide all the fundamental components in one place, from pre-built algorithms and data-cleaning utilities to methods for evaluating a model's performance.
ML tools are the engines that drive AI development, enabling everything from systems that learn from examples to the complex trial-and-error learning used in robotics. Whether for a practical task like analyzing customer data or a creative one like generating images from text, these tools provide the core foundation needed to get the job done.
Top ML Tools
While there are many machine learning tools available, a small group has become the standard for professional use due to their power and reliability. This guide will explain the key features of these top tools and help you determine which one is best suited for your project's requirements.
#1: Scikit-learn
Scikit-learn is an open-source software library for the Python programming language. It is recognized for its broad set of machine learning algorithms. The library is built on top of other Python libraries such as NumPy and SciPy. It is designed for classic data mining and data analysis.
Advantages:
The platform offers a wide range of supervised and unsupervised learning algorithms, including versatile support vector machines for robust classification and anomaly detection.
Efficient tools are included for data preprocessing and model evaluation.
Extensive documentation and a large data science community offer strong support.
It is interoperable with the scientific Python ecosystem.
Disadvantages:
It is not optimized for deep learning or building neural networks.
Performance can be slow when processing large datasets without acceleration.
A graphical user interface is not natively supported.
Ideal For: Scikit-learn is ideal for individuals beginning their supervised learning journey, including those interested in computer vision . It is also well-suited for academic research and for building baseline models for problems not requiring deep learning.
#2: TensorFlow
Developed by Google, TensorFlow is a comprehensive, open-source ecosystem for building and deploying large-scale deep learning models into production environments, from cloud platforms to mobile devices.
Advantages:
Distributed computing is supported for model training on large datasets.
Robust options for model deployment are offered across servers, mobile devices, and web browsers.
The ecosystem includes powerful visualization tools like TensorBoard for model inspection.
Its flexible architecture is suitable for building complex algorithms and deep neural networks.
Disadvantages:
The learning curve can be steep for new users.
The static computation graph in older versions can feel less intuitive for rapid development.
Significant computational power is needed for training complex models.
Ideal For: TensorFlow is built for production-grade AI models and large-scale enterprise applications. It is a strong choice for projects that require dependable deployment solutions, especially those using google cloud's services.
#3: PyTorch
PyTorch was developed by Meta AI's research lab, and it is particularly effective for building deep learning models . It is another leading open-source machine learning framework. It is known for its flexibility and Python-first design, making it popular in the research community for deep learning.
Advantages:
A dynamic computation graph is used, which offers more flexibility during the model training process.
The API is considered intuitive and easy to use, providing a more Pythonic experience.
A strong and active community contributes to a growing number of tools and libraries.
Rapid development and experimentation are facilitated.
Disadvantages:
Model deployment tools were historically not as mature as TensorFlow's, though this gap is closing.
Native visualization tools are not as tightly integrated.
More manual configuration can be required for production environments.
Ideal For: PyTorch is preferred by data scientists in research and development. It is excellent for projects in natural language processing and computer vision that involve custom model architectures.
#4: Keras
Keras is an open-source library that acts as a high-level API for data visualization and artificial intelligence, enabling users to train models with minimal effort. It is designed to enable fast experimentation and to create machine learning models with minimal effort. The newest version, Keras 3.11.1, is multi-backend, which means it can run on top of TensorFlow, PyTorch, or JAX.
Advantages:
A very user-friendly interface is provided to simplify the process of building machine learning models.
Excellent documentation and a focus on user experience reduce the learning curve.
Multi-backend support allows for greater flexibility and model portability.
A selection of pre-built models is available for common tasks like object detection.
Disadvantages:
Less granular control is offered compared to using a backend framework directly.
Debugging can be more complex since issues may originate in the underlying backend.
It is primarily focused on deep learning and not general-purpose ML tasks.
Ideal For: Keras is excellent for beginners in deep learning. It is also a powerful tool for rapid prototyping of AI models and for teams that need to train models quickly without deep technical expertise.
#5: MLflow
MLflow is an open-source platform for managing the entire machine learning workflow and lifecycle. It was started by Databricks. It is designed to work with any ML library and language, making it a versatile tool for MLOps.
Advantages:
Experiments, code, and machine learning data are tracked to organize complex projects.
Code is packaged in a reproducible format to ensure consistent results.
A central model registry is included for versioning and managing learning models.
The process of model deployment to various production environments is simplified.
Disadvantages:
An additional tool is introduced into the technology stack, which can increase complexity.
The user interface can become cluttered when managing many experiments.
Disciplined adoption by the entire team is required for it to be effective.
Ideal For: MLflow is best for data science teams working on collaborative machine learning projects. It is also suited for enterprises that require governance, reproducibility, and a clear path to deploy high-quality models.
#6: NVIDIA cuML
NVIDIA cuML is a library of machine learning algorithms that leverages NVIDIA GPUs, making it particularly useful for handling various machine learning tasks. It is part of the RAPIDS suite of software libraries. It provides a Scikit-learn-like API, which enables users to take advantage of GPU acceleration for big data processing.
Advantages:
Significant performance gains are achieved for model training on large datasets.
A familiar API reduces the learning curve for data scientists already using Scikit-learn.
End-to-end data pipelines, from ETL to training, can be executed on GPUs.
It integrates with other data science and deep learning frameworks, including those for predictive analytics.
Disadvantages:
Specific NVIDIA GPU hardware is required.
The library does not yet have coverage for all machine learning algorithms found in Scikit-learn.
The environment setup can be more complex than CPU-only libraries.
Ideal For: cuML is designed for organizations that have access to NVIDIA GPUs and need to accelerate their data science workflows. It is particularly useful for handling various ML tasks that are too large or slow for traditional CPU-based tools.
#7: Apache Mahout
Apache Mahout is an open-source project designed to provide scalable machine learning algorithms for data mining tasks that run on distributed computing platforms. It is heavily focused on collaborative filtering, clustering, and classification, and is built to integrate with big data technologies like Apache Spark.
Advantages:
Designed for massive scalability to handle enterprise-level datasets.
Provides proven, powerful algorithms for building recommendation engines.
As an Apache project, it is fully open-source and vendor-neutral.
Its modern architecture allows it to use engines like Spark for efficient processing.
Disadvantages:
Requires familiarity with distributed systems, which comes with a steep learning curve.
The setup and configuration are more complex than standalone libraries.
It is a specialized tool not intended for general-purpose ML or deep learning.
Ideal For: Apache Mahout is built for large-scale data mining, particularly for companies creating sophisticated recommendation systems. It is best suited for teams already invested in the Apache big data ecosystem.
#8: Weka
Developed at the University of Waikato, Weka (Waikato Environment for Knowledge Analysis) is a collection of machine learning algorithms written in Java. Its most defining feature is a graphical user interface (GUI) that allows users to apply ML models and visualize results without writing code.
Advantages:
Accessible for beginners and non-programmers with an easy-to-use, user user-friendly interface
It provides a comprehensive suite of tools for data preparation, classification, regression, and clustering.
Excellent for educational purposes and for teaching core machine learning concepts.
Being Java-based, it can be directly incorporated into Java applications.
Disadvantages:
It struggles with very large datasets as it typically processes data in memory.
The user interface, while functional, can feel dated.
It is primarily a tool for analysis and learning, not for deploying production-grade services.
Ideal For: Weka is a perfect choice for students, academics, and researchers, thanks to its user-friendly interface. It is also valuable for anyone who wants to quickly experiment with different algorithms on a dataset without the overhead of programming.
Powering Your ML Tools with the Right Hardware
The most powerful machine learning software is only as effective as the hardware it runs on. For modern deep learning and large-scale data analysis, CPUs are often no longer sufficient. The parallel processing architecture of Graphics Processing Units (GPUs), especially those from NVIDIA, has become the industry standard for training complex tasks and models promptly.
This is where GPU hosting comes in. Instead of incurring the high capital expense and maintenance overhead of buying dedicated servers, services like Atlantic.Net GPU Hosting allow you to rent access to GPU-enabled hardware on demand.
This approach enables any developer or organization to:
Access enterprise-grade NVIDIA GPUs instantly.
Scale computational resources up or down based on project needs.
Avoid hardware maintenance and focus solely on building models.
Pay only for the resources you use, making cutting-edge AI more accessible.
Choosing the Best Machine Learning Tools
The best tool is always the one that fits the job. Scikit-learn is your go-to for foundational ML tasks. When you need to build scalable, production-ready deep learning systems, TensorFlow and PyTorch are the dominant contenders, with Keras offering a simpler way for less experienced users.
To maintain consistency across a collaborative project, MLflow is indispensable. And if raw speed on massive datasets is your main bottleneck, NVIDIA cuML and NVIDIA hardware are the most popular solutions here. For those of you who are heavily invested in Java, Weka provides an accessible entry point for analysis, while Apache Mahout offers a path to massive-scale data mining.
By understanding these core strengths and trade-offs in AI and machine learning models, you can equip yourself to build better, faster, and more impactful AI solutions.
Cutting-edge technologies and new AI tools, including those for generative AI, are constantly being developed. By understanding the key features of these popular machine learning tools, including their applications in predictive analytics, you can make an informed decision and start your machine learning journey today.
Ready to stop waiting and start building? Power up your ML workflows by deploying a high-performance GPU server from Atlantic.Net. Get started in minutes and give your tools the hardware they deserve.
### Top Dedicated Hosting Services for Optimal Performance and Reliability
Dedicated hosting provides a server environment that is completely reserved for a single business. In this arrangement, all server resources, including CPU, RAM, storage, and bandwidth, are allocated to only one client or organization. This helps eliminate the resource-sharing issues that are particular to shared hosting.
Dedicated servers are ideal for websites and applications that require reliable performance and continuous availability. They are often used by online stores and systems that handle critical tasks such as payment processing, inventory tracking, and customer data management. These servers offer ample resources and flexible setup options to meet different technical requirements.
Before examining some top dedicated hosting providers, it is essential to understand why businesses utilize these services. This helps in using them more effectively.
Why Use Dedicated Hosting?
Dedicated hosting has several practical benefits that support reliable, secure, and high-performance computing environments.
Consistent Resource Availability — In a dedicated hosting environment, all server resources are allocated exclusively to a single client. This ensures steady performance even during peak traffic.
High Operational Performance — Since the server is not shared with other users, websites and applications load faster, and response times remain stable, even under heavy use.
Strong Security — Since dedicated servers are isolated from other systems, security risks are reduced. Moreover, users can implement custom firewalls, encryption, and access control.
Full Administrative Control — Users have complete control over the server, including the ability to install software, configure system settings, and select the operating system of their choice.
Scalability and Flexibility — Hardware and software configurations can be adjusted as needed to meet the evolving business requirements, without impacting other systems.
Reliable Uptime — Absence of shared tenants reduces system conflicts and helps maintain service continuity.
Suitable for Advanced Applications — Dedicated servers provide sufficient power to support resource-intensive applications. These include machine learning systems, large databases, and platforms that process high volumes of user activity.
#1. Atlantic.Net
Atlantic.Net offers dedicated servers and cloud options with complete resource isolation, ensuring optimal performance and security. Its global data center provides fast connectivity and ensures continuous availability. Moreover, strict compliance standards make it suitable for organizations that must meet regulatory requirements.
Key Features
HIPAA, HITECH, SOC 2/3, and PCI-DSS compliance.
High-performance bare metal and cloud options.
Configurations support up to 104 CPU cores, 2 TB of RAM, and 90 TB of storage.
SSD and NVMe storage.
Global data center locations.
Encrypted VPN, intrusion protection, and automated backups.
24/7 support and optional managed services.
Pricing: From $266/month to $1,895/month; entry-level cloud VPS starts at $4/ 4/month.
Use Case: Atlantic.Net is well-suited for healthcare and financial organizations that handle sensitive data. Its secure and compliant infrastructure supports high reliability and consistent performance, even under demanding conditions.
#2. Namecheap
Namecheap provides developer-friendly dedicated servers with modern hardware configurations. Their plans are built on AMD EPYC processors, known for efficiently handling multi-threaded workloads, and offer NVMe SSD storage for fast performance.
Key Features
Up to 20 CPU cores (Dual Xeon Silver 4310T), 128 GB ECC RAM, and 4 TB NVMe SSD.
Webuzo or cPanel control panels; full root access.
24/7 customer support and optional server management.
Pricing: Up to $264.88/month
Use Case: Ideal for SaaS platforms, high-traffic websites, and businesses needing full control and scalability.
#3. HostGator
HostGator provides customizable dedicated hosting with options for Linux and Windows. It offers scalable infrastructure and good support.
Key Features
Up to 32 CPU cores, 128GB RAM, and 3TB NVMe.
RAID 6 storage, unmetered bandwidth.
DDoS protection, free migration.
24/7 support.
Pricing: Starts at $141.19/month.
Use Case: HostGator is a good option for agencies and small businesses that need reliable and fast hosting to manage multiple websites without service interruptions.
#4. IONOS
IONOS is known for its affordable pricing and secure data centres. It offers dedicated hosting with flexible billing and ISO-certified infrastructure.
Key Features:
ISO 27001-certified centers.
No long-term contracts.
AMD and Intel Xeon CPUs.
Up to 64 cores, 1TB RAM, and 48TB storage.
Unlimited traffic at 1 Gbps.
Advanced firewalls and monitoring.
Pricing: From $70/month.
Use Case: Ideal for startups that require affordable and reliable hosting to run SaaS tools or data platforms with consistent performance and continuous availability as their workloads expand.
#5. Hostwinds
Hostwinds provides flexible hosting with multiple customization options. Both managed and unmanaged plans are available to suit different levels of user expertise.
Key Features
Customizable Intel CPUs.
Linux/Windows support.
RAID 0–60 options, IPMI access.
1 Gbps outbound, unmetered inbound.
Nightly backups, proactive monitoring.
Pricing: From $122/month.
Use Case: Hostwinds is well-suited for technical teams that require stable, high-performance hosting with complete control, making it a dependable choice for testing environments and custom server setups.
Quick Comparison of Top Dedicated Hosting Providers
Provider
CPU / RAM / Storage
Network Throughput
Compliance / Data Centre
Strengths
Atlantic.Net
Up to 104 cores / 2TB RAM / 90TB SSD
10 Gbps (bare metal)
Tier III+ (U.S., U.K., Asia); HIPAA, PCI-DSS
High-compliance, multi-region, resource-isolated infrastructure
Namecheap
Up to 20 cores / 128GB / 4TB NVMe SSD
Unmetered bandwidth
U.S.-based; no formal tier rating
Ideal for SaaS platforms and high-traffic websites
HostGator
Up to 32 cores / 128GB / 3TB NVMe SSD
Unmetered bandwidth
RAID 6; U.S. data centres
Affordable and scalable for small businesses
IONOS
Up to 64 cores / 1TB RAM / 48TB SSD
1 Gbps standard
ISO 27001-certified (EU & U.S.)
Budget-friendly with strong security, uptime not SLA-enforced
Hostwinds
Custom Intel CPUs / Up to 128GB RAM
1 Gbps outbound/unmetered in
RAID-configurable with IPMI access
Highly customizable; best for experienced users managing their servers
The Bottom Line
Performance and reliability are the most important factors when choosing a dedicated hosting provider.
Every hosting provider specializes in a certain vertical and helps with various objectives depending on the use case and requirements of every organization. Ultimately, the best provider is one that consistently delivers stable performance and dependable service.
Atlantic.Net offers strong uptime guarantees, secure infrastructure, and compliance-ready solutions, making it a highly dependable option for critical systems and sensitive applications.
Atlantic.Net: Power, Performance, and Security in Dedicated Server Hosting
For businesses that require the highest level of performance, control, and security, bare metal servers are the very best hosting solution available. When your applications need dedicated resources without compromise, selecting the right provider is a critical decision. At Atlantic.Net, we stand ready to assist you with all your dedicated server hosting needs.
With a history dating back to 1994, Atlantic.Net has a long-standing reputation for providing reliable and powerful infrastructure. Our dedicated hosting solutions are built for businesses that need the full capacity and unrivaled security of a physical server, without the overhead of virtualization layers or the potential for "noisy neighbors."
This architecture guarantees your most demanding workloads operate with stable, predictable performance.
A Look at Atlantic.Net's Key Offerings
Now, let's look at the key features of the Atlantic.Net Dedicated Hosting service.
Feature
Description
Processor
All servers are from SuperMicro or Dell and feature the latest Intel Xeon processors for breakneck performance
Storage
We use SSDs as standard across the entire Atlantic.Net platform. Dedicated servers also have optional high-speed NVMe SSDs or SATA SSDs. All are configurable to various RAID configurations
RAM
All dedicated servers utilize ECC memory, ranging from 32GB to a massive 1TB of RAM. Available in DDR4 and DDR5 configurations.
Bandwidth
All our server plans come with generous inbound and outbound allowances, with options for unmetered inbound traffic. This will ensure your applications are always accessible to your users.
Data Centers
Atlantic.Net provides hosting services from across the United States, Canada, the United Kingdom, and Asia.
Security
A comprehensive suite of security features is available, including managed firewalls, DDoS protection, and intrusion prevention services.
Compliance
We are independently audited and certified for HIPAA, HITECH, and PCI compliance. If you need compliance hosting, make Atlantic.Net your number 1 choice.
Dedicated Performance for Heavy Workloads
Dedicated hosting is great for those looking for raw server performance. By getting exclusive access to the server, the CPU, RAM, Storage, and Network, your essential business applications will have the resources available to operate at peak efficiency 24x7x365.
Dedicated servers are well-suited for a variety of uses, including:
Popular Websites / E-commerce: Manage large volumes of traffic even in peak hours with ease.
Databases and BI analytics: Run an entire enterprise database with room to spare, process large datasets quickly and securely to give you unique insights into your business.
Deploy Resource-Hungry Apps: Run any software you need, whether it's for video rendering, scientific computing, AI, or machine learning. The experience is seamless with zero slowdown or unexpected bottlenecks.
Create a Private Cloud: Build your private cloud with the security and control that only dedicated hosting provides.
Don't just take our word for it; the customer reviews frequently praise our performance benchmarks. This highlights our commitment to speed, security, compliance, and reliability. Third-party tests evidence this: Network tests reveal impressive throughput with high download and upload speeds, demonstrating Atlantic.Net high performance network infrastructure. All backed by a 100% uptime SLA, to give you further confidence that your services will remain online.
Security and Compliance You Can Depend On
Atlantic.Net has built its security and compliance services with a strong focus on protecting your data integrity. All of our data centers are SOC 2 and SOC 3 certified, and offer a range of managed security services to help secure your servers.
For businesses in the healthcare and financial sectors, Atlantic.Net's compliance-ready hosting is a major advantage. We are one of the providers that will sign a Business Associate Agreement (BAA) for HIPAA compliance, showing our commitment to safeguarding sensitive information. This makes Atlantic.Net a trusted partner for organizations that handle Protected Health Information (ePHI) or other confidential data.
### How to Find the Top Cloud Hosting Providers
Organizations leverage cloud hosting services for multiple reasons. Cloud computing services can address business requirements and objectives that companies cannot meet with on-premises data centers.
Companies want to work with a reputable cloud service provider, regardless of the reason behind their move to the public cloud. This article examines how to find a top cloud hosting partner for your business.
Top Cloud Hosting Providers for Your Business
Companies need to choose a reliable cloud provider that aligns with their business strategy. The following cloud hosting providers offer excellent service portfolios designed to help your business meet its goals.
#1. Atlantic.Net
Atlantic.Net's cloud platform delivers customers fast and fault-tolerant performance to meet their evolving business needs. The company offers a wide range of all-inclusive pricing options for cloud-hosted Windows and Linux systems. Clients can choose from shared and dedicated server options supported by a full suite of managed services.
Atlantic.Net currently has data centers in eight regions, including the U.S., Canada, and Europe. The company has over three decades of experience and offers 24/7/365 access to a team of expert technicians to resolve any customer issues.
#2. IBM Cloud Services
IBM Cloud Services are designed to support hybrid environments and advanced AI workloads. The company offers a resilient cloud platform that can meet the stringent requirements of regulated industries. The cloud infrastructure can seamlessly scale to support dynamic and processor-intensive AI applications. IBM backs its cloud hosting services with 24/7 customer support and operates data centers worldwide.
#3. Alibaba Cloud
Alibaba is a major player in the cloud hosting ecosystem, offering an extensive portfolio of solutions tailored to address your business needs. The company provides pricing options that include pay-as-you-go and subscription plans. Alibaba operates worldwide data centers and focuses on delivering secure and compliant cloud hosting solutions. They provide 24/7 customer support to keep your environment running efficiently.
#4. Oracle Cloud Services
Oracle offers a wide range of options to its customers, supporting multicloud, hybrid, public, and dedicated server solutions. The Oracle Cloud features over 150 distinct cloud services in each cloud region. The company has data centers located worldwide and offers 24/7 customer support. Customers can easily automate workflows for new and existing applications using Oracle's cloud servers. Foundational services such as storage and networking are available through special pricing plans to minimize costs.
#5. Dell Technologies Cloud
The Dell Technologies Cloud is designed to simplify cloud server management. Dell offers customers a hyperconverged infrastructure (HCI) platform and software components that facilitate deployment and lifecycle management of hybrid cloud servers. The company has a worldwide data center footprint and provides clients with 24/7 support. Dell Cloud services can help companies streamline migration from on-premises to cloud hosted solutions.
What Is Cloud Hosting?
Cloud hosting is an IT solution where customers obtain computing resources from physical or virtual machines housed in a third-party provider's data center. Hosting clients may opt for control over cloud computing power or choose a managed cloud solution. Cloud hosting provides cost-effective business solutions and access to advanced technology.
What Are the Benefits of Public Cloud Hosting?
Numerous advantages are available to companies that adopt cloud hosting solutions. The following are the most common benefits of working with a reliable cloud service provider.
Cost savings
Customers can enjoy multiple types of cost savings by engaging a cloud provider to address specific business needs.
Reduced upfront costs - It is typically less expensive to obtain cloud hosting resources than to build new infrastructure components to meet changing business requirements and market trends.
Pay for actual resource usage - Cloud service providers offer pay-as-you-go solutions where customers only pay for resources they use. This model eliminates the cost of overprovisioning resources to handle fluctuating requirements.
Scalability
Companies can save money and better address business initiatives by easily scaling cloud computing services up or down on demand. Scalability is closely tied to the potential for cost savings in the cloud, enabling customers to add or remove resources as needed to accommodate seasonal or varying usage patterns.
Access to advanced technology
Reputable cloud service providers offer their customers advanced technology solutions that may not be feasible to implement in their current data centers. Organizations can gain a substantial competitive advantage by leveraging advanced AI and analytical capabilities of the cloud infrastructure.
Enhanced security
A reliable cloud service provider implements cutting-edge security measures to protect customer data and systems. For example, a cloud web hosting solution can utilize multi-factor authentication and end-to-end encryption to enhance security.
Regulatory Compliance
Many providers offer cloud hosting plans on servers that have been certified to comply with regulatory standards such as PCI-DSS or HIPAA. Companies can simplify compliance and avoid non-compliance penalties with a dedicated hosting solution available from the top cloud service providers.
Data protection
Customers can typically take advantage of the provider's built-in backup and data protection solutions. This feature of cloud services protects data without requiring an in-house backup infrastructure.
Disaster recovery
Providers offer disaster recovery services that enable a business to get up and running quickly after a disaster. Disaster recovery is an essential feature that supports a company's business continuity strategy.
Common Cloud Hosting Usage Scenarios
Organizations typically engage a cloud service provider to address business requirements that they cannot meet with their current on-premises or cloud resources. Common use cases for cloud hosting include the following scenarios.
Application and website hosting
Companies can use cloud web hosting plans to launch websites or online business portals efficiently. The costs of a cloud hosting package can offer substantial savings over provisioning on-premises resources. Organizations can focus on their core business by leveraging managed web hosting services.
Development and test environments
Teams can utilize the virtual servers available in cloud computing services to create development and test environments away from production systems. Virtual machines offer more flexibility and are less expensive than physical servers, supporting a dynamic development community that drives innovation.
Content delivery
Organizations can use cloud hosting to make content available to anyone with an internet connection. Businesses can create content delivery networks (CDNs) to deliver content to customers or employees. Cloud security measures help manage data securely and prevent unauthorized access to the CDN.
Streamlined disaster recovery and data protection
Most providers feature integrated backup, data protection, and disaster recovery services. Customers can leverage these services to achieve a high level of data protection and business continuity without the capital expenditures associated with building an on-premises solution.
Machine learning, AI, and advanced analytics
Modern businesses often require access to advanced computing power to run machine learning, AI, and analytical applications, enabling them to compete effectively in the market. Cloud hosting services allow them to acquire advanced capabilities quickly and with minimal financial investment.
Characteristics of Top Cloud Service Providers
The cloud infrastructure market encompasses numerous players offering customers a diverse range of services and solutions. The top cloud service providers share several key characteristics that distinguish them from their competitors.
Geographically distributed data centers
A top cloud service provider has geographically distributed data centers for several vital reasons. Multiple data centers located in different regions provide enhanced resiliency in the event of a major disaster. Organizations can reduce latency and improve performance by utilizing managed cloud or web hosting services delivered from a location closer to their physical location.
Reliability and performance guarantees
The best cloud hosting companies offer customers service level agreements (SLAs) to guarantee availability and performance levels. Customers will be more confident that the provider can meet their expectations when there are financial implications associated with the failure to perform.
Extensive service portfolio
A top provider will offer a wide variety of services designed to meet its customers' business needs. You don't want a provider with a one-size-fits-all approach to cloud services. Provided services may range from simple VPS hosting to fully managed cloud hosting solutions. Comprehensive cloud hosting services should include backup and disaster recovery options.
Scalable services
The provider should offer scalable services that help control cloud costs while maintaining high performance. Customers must be able to effortlessly scale up and down to address changing requirements and traffic patterns.
Automation, AI, and advanced services
Top cloud hosting providers offer advanced solutions designed to give customers the tools they need to thrive in today's competitive market. Cloud hosting clients should expect features such as automation, advanced analytics capabilities, and AI support.
Strong customer support
Superior customer support is essential for addressing current client concerns and cultivating long-term relationships. All top cloud providers offer 24/7 support to help customers optimize their environment. The support may include dedicated tools to help control cloud costs.
Hybrid and multi-cloud support
Your provider should offer support for private cloud, hybrid cloud, and on-premises environments. They should be willing to support part of an integrated environment involving multiple cloud providers that aligns with your IT and business objectives.
Companies can address their evolving business requirement by working with a cloud hosting provider. The providers discussed above can help you maximize the value of your IT investment and support innovative technology solutions so you can successfully compete in today’s challenging business landscape.
### Best Dedicated Server Hosting Providers in the USA
Choosing the right dedicated server hosting provider can make or break your business operations. When your website demands consistent performance, solid security, and complete control over server resources, shared hosting simply won't meet your needs.
This decision can have a significant impact on your business. Your hosting provider directly impacts page loading speeds, customer trust, and your ability to scale. In today's competitive market, even one second of delay can cost sales, and a single security breach can destroy years of reputation building. In this blog post, we've researched the top dedicated server hosting providers in the United States to help you make this critical choice.
#1. Atlantic.Net - Compliance and Customization Leader
Website: https://www.atlantic.net/dedicated-server-hosting/
Atlantic.Net brings over 30 years of hosting experience to the table. They specialize in custom-built servers designed for specific client needs. Their infrastructure spans five strategic US locations including New York, Dallas, Ashburn, San Francisco, and Orlando.
What sets Atlantic.Net apart is their focus on compliance requirements. This makes them invaluable for healthcare and financial organizations that must meet strict regulatory standards like PCI, HIPAA, and HITECH.
Key Features:
Fully customizable server configurations (CPU, memory, storage)
Complete root access with dedicated IP and SSL certificate
Latest Intel Xeon processors for maximum performance
Comprehensive managed services including DDoS protection
24/7 US-based support in English and Spanish
Atlantic.Net eliminates setup fees and offers significant discounts for longer commitments. They back their service with a 100% SLA and maintain SOC 2 and SOC 3 certifications. For regulated industries requiring custom configurations, Atlantic.Net provides the expertise and infrastructure needed to meet complex requirements.
#2. HostGator - Proven Support and Scalability
Website: https://www.hostgator.com
Texas-based HostGator has nearly 20 years of experience hosting over 2 million websites. They have a reputation for providing exceptional customer support and reliable infrastructure.
Technical Specifications:
Up to100GB SSD storage
NVMe storage from 1TB to 3TB
Can handle up to 400K visitors per month
Free SSL, Maleware detection and removal and DDoS protection
HostGator provides complete server control with instant scalability options. They guarantee high uptime through Tier 3 data centers and offer free migration for cPanel-based servers. Their guided setup process and rebootless security patches minimize technical complexity. HostGator works particularly well for growing businesses needing reliable hosting with excellent support.
#3. Namecheap - Affordable
Website: https://www.namecheap.com
Namecheap hosting has earned recognition for reliable performance and affordable options. Their hosting infrastructure is built around Intel Xeon and AMD EPYC processors, ECC RAM, and SSD/NVMe storage options.
Core Capabilities:
Storage up to 2x2TB
RAM up to 128GB DDR4 RAM
Dual Xeon Silver 4310T, Dual Xeon Gold 5218, or Dual AMD EPYC 7313.
500GB Free Backup Storage
Up to 3 dedicated IP addresses
Namecheap delivers high uptime and performance. Their data centers operate in the USA.
Namecheap is known for offering flexible server management tiers, including fully managed options. They can handle resource-intensive applications while keeping administrative overhead low.
#4. InterServer – Customizable Power & Global Reach
Website: https://www.interserver.net
InterServer Hosting has built their reputation on delivering customized dedicated servers to provide full control and high performance. Their plans range from entry-level Xeon E3 setups to high-end AMD EPYC and dual Xeon configurations with up to 24 cores and 256 GB RAM. Their US-based data centers prioritize rapid page loading and application response times.
Performance Features:
SSD and SATA storage options from 250 GB to 1.76 TB.
RAM up to 256GB DDR4 RAM
Intel Xeon E3/E5 and AMD EPYC 7402P (up to 24 cores).
Up to 5 dedicated IP addresses
10 TB monthly transfer.
InterServer is ideal for businesses needing scalable, secure, and affordable dedicated hosting with rapid deployment and global data center options.
#5. IONOS - Cost-Effective Features
Website: https://www.ionos.com
IONOS provides high-performance dedicated hosting at competitive prices. Their configurable servers and ISO 27001 certified data centers provide enterprise-level solutions without enterprise costs.
Infrastructure Details:
Intel Xeon and AMD Ryzen/EPYC processors
Storage options up to 48TB with RAID protection
Unlimited traffic with 1 Gbps bandwidth
Comprehensive security suite including IP firewall and DDoS protection
IONOS offers better price-to-performance ratios than virtual alternatives while maintaining enterprise security standards. Their personal consultant support and flexible configurations make them attractive for startups and low budget businesses.
#6. Hostwinds - Fully Managed Customization
Website: https://www.hostwinds.com
Hostwinds specializes in fully managed dedicated servers with extensive customization capabilities. Their global data center presence and dedicated resource offerings are well-suitable for demanding applications requiring consistent performance.
Customization Options:
Configurable RAM, CPU, and RAID configurations
Multiple data centers in Seattle, Dallas, and Amsterdam
100% resource ownership for consistent performance
Full IPMI access for comprehensive management
Hostwinds is particularly suited for resource-intensive applications like machine learning, gaming, and big data processing where performance consistency is crucial.
Provider
Best For
Price range (per month)
Key Strength
Atlantic.Net
Regulated industries
$247 – 317
Full root control, HIPAA compliance, enterprise performance, expert support
HostGator
Growing businesses
$141.19 – 343.79
Proven scalability, full root control
Namecheap
Affordable
$44.88 - $264.88
Beginner-friendly dedicated hosting with flexible management tiers
InterServer
Customizable
$70 - $363
Ideal for resource-intensive applications
IONOS
Cost-effective
From $70
Customizable hardware and unlimited traffic
Hostwinds
Resource-intensive apps
$122 – 380
Full customization, dedicated resources, redundant reliability
Making the Right Choice
The best dedicated server provider depends on your specific business requirements, technical needs, and budget. Consider your compliance requirements, expected traffic levels, in-house technical expertise, and growth projections when evaluating these options.
For regulated industries, Atlantic.Net's compliance expertise makes them the clear choice.
Each provider on this list has demonstrated their ability to deliver reliable dedicated hosting services. The key is to match their specific strengths with your business needs to ensure optimal value and performance for your investment.
If you are looking for the best Dedicated Server Hosting Provider in the USA, Atlantic.Net stands ready to assist you. With always available phone support, and a full suite of Managed Services, get the best of all worlds with 100% SLA, and high-performance server hosting in five data center regions in the USA.
### Top Dedicated Hosting for Small Businesses in 2025
Small businesses face unique challenges when choosing dedicated hosting. They need reliable performance without breaking the bank. They want professional support without paying enterprise prices. Most importantly, they need hosting that grows with their business.
Dedicated hosting gives small companies complete control over their server environment. Unlike shared hosting, you get all the resources to yourself. This means faster loading times, better security, and more reliability for your customers. Choosing the right provider is crucial, as selecting the wrong one can hinder business growth and waste the budget.
To help with this task, we have formulated a list of dedicated hosting providers, specifically designed for small businesses. This guide covers the top dedicated hosting providers that cater to the needs of small businesses. To compile this list, we considered factors such as pricing, customer support, server performance, and ease of use.
Why Small Businesses Need Dedicated Hosting
Small businesses often start with shared hosting or basic VPS hosting plans. These work fine at first. But as companies grow, they need more power and control than shared hosting or VPS hosting can provide.
Dedicated hosting offers several key advantages. It provides dedicated resources that are never shared with other websites. This will allow the company's dedicated servers to maintain consistent performance even during traffic spikes. The company can get complete root access to install any software the business needs.
Security becomes much stronger with dedicated server hosting. The company can control access to its dedicated server by implementing custom security measures tailored to its specific business needs. This feature is significant for businesses that handle customer data or payments.
Dedicated server hosting enables business websites to load faster and applications to run more smoothly. As a result, the business gets enhanced and noticeable performance. Better server response times also enable the business team to work more efficiently.
Key Features to Look For
When selecting a dedicated hosting provider, it's important to prioritize certain features that are particularly crucial for small businesses. Start with server reliability. Select a provider that guarantees at least 99.9 % uptime. Downtime can result in significant financial losses and damage to the business's reputation. A reliable provider keeps the business running smoothly.
The quality of customer support is another essential factor to consider. Small businesses require responsive and knowledgeable support teams. It is vital to search for providers that offer 24/7 support across multiple channels. It is also essential to test their response times before making a decision.
Scalability options let your hosting grow with your business. The web hosting provider should enable the company to upgrade resources without significant disruptions. Good providers offer flexible plans that adapt to changing needs.
It's also important to note that the quality of hardware has a direct impact on dedicated server performance and longevity. Modern processors, fast SSD storage, and sufficient RAM can significantly enhance performance. On the other hand, outdated hardware can lead to slower performance and more frequent issues.
Data center locations can also impact the efficiency of the dedicated hosting. It is essential to find a provider with data centers near the target audience, as this can boost the speed of the company's website. Multiple locations can give flexibility as the business expands.
Top Dedicated Hosting Providers for Small Business
1. Atlantic.Net
Atlantic.Net stands out as the best dedicated hosting choice for small businesses. With a history of serving businesses since 1994, the company has built a strong reputation for consistent performance and exceptional customer care.
They deliver dedicated servers with impressive specifications at competitive prices. They offer the latest Intel processors, SSD storage options, and high bandwidth allowances. Clients benefit from full root access, complimentary server management, and enterprise-grade security.
Their billing options are flexible. Businesses can opt for monthly billing instead of being locked into long-term contracts. This flexibility enables small businesses to manage their cash flow more effectively than with annual commitments. Additionally, they offer scalability options that allow companies to upgrade resources as their business grows.
Atlantic.Net is known for its impressive customer service. They provide 24/7 customer support with skilled technicians who understand technical challenges. Their response times are consistently fast, which is crucial when a business website goes down.
The company's data centers are sited at strategic locations across the United States. This distribution is beneficial for businesses operating inside the US, as it significantly boosts loading speeds of their websites. The company also offers free migration services, making it easy to transition from any other hosting provider. Their network infrastructure delivers consistent performance across all their data centers.
The company provides robust security features, including DDoS protection, firewall configuration, and regular backups. These are often expensive add-ons with other web hosting providers, but Atlantic.Net includes them as standard features.
2. HostGator
HostGator offers a reliable dedicated hosting service, specifically tailored for web hosting customers. The company offers both unmanaged and managed dedicated server hosting options. This flexibility allows businesses to choose the level of support they need.
HostGator plans include unmetered bandwidth, three dedicated IPs, and advanced DDoS protection.
Dedicated servers are powered by AMD EPYC processors and DDR5 RAM, offering configurations that range from 8-core CPUs with 32 GB RAM to 32-core CPUs with 128 GB RAM. They offer dedicated servers with SSD and NVMe storage. Users can choose between Linux and Windows operating systems. HostGator also provides free migrations, guided setup, and 99.9% uptime backed by Tier 3 data centers
HostGator’s 24/7/365 support team is available via chat and phone, and their services are tailored to web professionals and agencies that need robust hosting with room to scale. Their infrastructure includes a fully redundant network with multiple bandwidth providers.
3. Namecheap
Namecheap emphasizes on high performance and customizable dedicated hosting solutions. They use enterprise-grade hardware, including Intel and AMD processors, ECC RAM, and SSD storage. Users can choose Linux or Windows servers with both managed and unmanaged options. This flexibility accommodates different business software requirements. They provide root access and complete control over dedicated server configurations.
Their hosting plans include free site migration and SSL certificates. They also offer optional server management services for businesses that prefer professional maintenance and support. Their team can handle updates, security patches, and performance optimization.
The company provides a 99.99% commitment backed by service level agreements. They continuously monitor servers and respond quickly to any issues that arise. Their proactive approach helps prevent problems before they affect your business.
4. Hostwinds
Hostwinds provides customizable dedicated hosting solutions designed to meet the specific needs of businesses. They offer both preconfigured servers and fully customizable options.
Their dedicated servers include free nightly backups and basic server monitoring. These features are particularly useful for business owners who are concerned about data loss or server issues.
Hostwinds provides both managed and unmanaged hosting options. Their managed services include server administration, security updates, and technical support. This allows business owners to focus on their core operations instead of server management.
They offer flexible billing with monthly, quarterly, and annual payment options. This flexibility enables small businesses to manage hosting costs in line with their cash flow patterns, without incurring any long-term commitments.
Hostwinds' customer support is also highly effective. They avoid outsourcing support to maintain quality and knowledge levels. Their response times are typically fast for both technical and billing questions.
Making Your Decision
Choosing the right dedicated hosting provider requires careful consideration of your business needs and growth plans. Begin by assessing your current needs and projected growth over the next two years.
Consider your technical expertise and available resources. If you lack technical staff, managed hosting services provide valuable support. If you have technical capabilities, unmanaged hosting offers more control and lower costs.
Budget considerations should include not just monthly hosting costs but also potential growth expenses. Select a provider that offers seamless upgrade paths without significant disruptions to your business operations.
Test customer support quality before making your final decision. Contact potential providers with technical questions and evaluate their response times and knowledge levels.
The hosting provider you choose today will impact your business success for years to come. Take time to research options thoroughly and choose a partner that understands your business needs and growth objectives.
The Atlantic.Net Difference
When you purchase bare metal servers from Atlantic.Net, you are investing in more than just hardware. You are partnering with a web hosting company that has a proven, decades-long history of delivering high-level performance, robust security, and expert support.
With a wide range of configurations, each of which can be tailored to your specific needs and requirements, it is hugely beneficial. We maintain a sharp focus on compliance, so you can build your infrastructure with confidence.
For businesses that need top performance from their hosting, Atlantic.Net presents a very strong option.
To explore the full range of our Dedicated Hosting Solution, email us at sales@atlantic.net or visit https://www.atlantic.net/dedicated-server-hosting/
### Top GPU Hosting Providers for AI and Machine Learning
The demand for powerful GPU hosting is increasing due to AI and machine learning. Advanced AI models, such as large language models (LLMs) and generative AI, require the appropriate GPU hosting to ensure high performance and efficiency. Whether training models, running simulations, or processing large datasets, the infrastructure determines the success of an AI project.
In 2025, GPU providers offer GPUs capable of managing the most demanding workloads. With advancements in hardware, scalability, pricing, and compliance, businesses can better meet their AI needs. This article examines the top GPU hosting providers of 2025 and their suitability for AI and ML operations.
1. Atlantic.Net
Website: https://www.atlantic.net
Atlantic.Net is a U.S.-based company that provides secure and compliant cloud infrastructure. It is known for supporting industries like healthcare and finance, which require strict regulations. The company offers both cloud-based and dedicated GPU servers. These servers use advanced NVIDIA H100 NVL and L40S GPUs. This makes them ideal for AI and machine learning tasks.
Why Choose Atlantic.Net?
Compliance-Ready: Meets HIPAA, HITECH, and PCI compliance standards.
Flexible Deployment: Offers cloud GPUs for burst workloads or dedicated servers for sustained high-performance needs.
Customizable: Provides dedicated GPU servers tailored to specific requirements, with options for managed support, private networking, and SSD storage.
Scalable: Cloud GPU solutions that can scale to dedicated hardware as project demands increase.
Strong Support: Includes optional managed services, with expert assistance for compliance.
Use Case
Suppose a healthcare provider needs to train a deep learning model for medical images while adhering to HIPAA and HITECH standards. Atlantic.Net’s HIPAA-compliant infrastructure ensures secure handling of patient data. It also offers the flexibility to scale resources as needed.
2. OVHcloud
Website: https://www.ovhcloud.com/
OVHcloud is a leading European cloud provider. The company is known for strong data sovereignty, GDPR compliance, and competitive pricing. Its dedicated GPU servers use NVIDIA H100, L40S, and L4 GPUs. OVHcloud also offers customizable hardware configurations and anti-DDoS protection.
Why Choose OVHcloud?
EU Focus: Tailored for European businesses with a strong emphasis on GDPR-compliant infrastructure.
Customizable Hardware: Offers both pre-configured and fully customizable server builds to meet specific needs.
Transparent Pricing: Provides affordable and predictable monthly billing, ensuring cost clarity.
Integration: Works well with OVHcloud's object storage and Kubernetes ecosystem, ensuring smooth service operations.
Use Case
Suppose a European SaaS company requires a GPU hosting solution for training AI models that can handle customer and research data with full compliance with GDPR. OVHcloud offers GDPR-compliant infrastructure and affordable GPU hosting with flexible custom hardware configurations.
3. Hetzner
Website: https://www.hetzner.com/
Hetzner is a prominent German hosting provider known for its affordable, high-performance, dedicated servers. They offer GPUs like NVIDIA RTX 3080, 3090, and A100, which are ideal for a wide range of AI and ML workloads.
Why Choose Hetzner?
Cost-Effective: Offers some of the lowest prices for dedicated GPU servers in Europe.
Performance: Provides powerful GPUs like NVIDIA RTX 3080, 3090, and A100, perfect for AI training and inference.
Data Centre Locations: With data centres in Germany and Finland, Hetzner ensures strong privacy protections and complies with GDPR standards.
Use Case
Suppose a machine learning startup needs GPU hosting to train a deep learning model for image recognition. Hetzner's affordable GPU servers, like the NVIDIA RTX 3080 and 3090, can help the startup reduce infrastructure costs while ensuring high performance for training complex tasks.
4. Lambda
Website: https://lambdalabs.com/
Lambda provides GPU cloud and on-premises hardware designed specifically for deep learning workloads. Their cloud platform offers powerful NVIDIA A100, H100, and RTX 6000 GPUs, pre-installed ML frameworks and support for JupyterLab environments.
Why Choose Lambda?
Deep Learning Focus: Optimized for frameworks like TensorFlow and PyTorch, making it perfect for machine learning tasks.
Flexible Pricing: Choose from hourly or monthly billing depending on the project’s needs.
Collaboration: Supports multi-user JupyterLab environments, ideal for team-based AI/ML research.
Use Case
Suppose an AI research team is working on a natural language processing (NLP) model and needs on-demand GPU access for training and testing. Lambda provides the required NVIDIA A100 and H100 GPUs and JupyterLab support, thus enabling the scaling of resources.
5. CoreWeave
Website: https://www.coreweave.com/
CoreWeave is a cloud provider focused on AI and machine learning. They offer large-scale NVIDIA GPUs across North America and Europe, including H100, A100, L40, L40S, and GH200. CoreWeave supports bare-metal instances, cloud VMs, and fully managed Kubernetes for serverless AI applications. Using InfiniBand and NVIDIA GPUDirect fabrics, their high-performance networking is perfect for distributed AI workloads and large model training.
Why Choose CoreWeave?
Massive Scale: Supports large AI and machine learning workloads with powerful GPUs.
Flexible Deployment: Offers bare-metal servers, cloud VMs, and serverless options with Kubernetes.
High-Performance Networking: Ideal for large model training and distributed AI workloads.
Use Case
Suppose a research team is developing a machine-learning model for autonomous vehicle navigation. CoreWeave’s high-performance GPUs and scalable infrastructure enable the team to process vast amounts of sensor data and train complex models efficiently, ensuring fast and reliable training across multiple nodes.
6. PhoenixNAP
Website: https://phoenixnap.com/
PhoenixNAP offers dedicated GPU servers designed for AI, machine learning, deep learning, and high-performance computing. Their GPU options include NVIDIA Tesla V100 and P40. PhoenixNAP provides custom configurations, DDoS protection, and global data centres. This makes it ideal for businesses that need flexible deployment and strong support.
Why Choose PhoenixNAP?
High Performance: Optimized for AI, ML, and deep learning tasks.
Global Reach: US, Europe, and Asia data centres ensure worldwide service availability.
Robust Security: Includes DDoS protection and remote management for secure and reliable operations.
Use Case
Suppose a research team is working on a machine-learning model to predict disease outbreaks. PhoenixNAP’s high-performance Tesla V100 GPUs allow the team to handle large datasets and run complex simulations, while global data centres ensure fast access from multiple regions.
7. Genesis Cloud
Website: https://genesiscloud.com/
Genesis Cloud provides a high-performance GPU cloud platform for AI, machine learning, and rendering. It uses NVIDIA HGX H100 GPUs, perfect for running large AI models. Genesis Cloud focuses on being sustainable, EU-compliant, and offering cost-effective solutions. It is excellent for tasks like fine-tuning LLMS, generative AI, and scientific computing.
Why Choose Genesis Cloud?
Sustainability: They use green data centres, which means they care about the environment.
EU Compliance: Their European data centres follow the EU's data residency rules and regulations.
High Performance: The platform is built for AI and ML workloads that need much computing power.
Use Case
Suppose a large enterprise is developing generative AI models and needs to deploy AI systems that meet EU data residency rules. Genesis Cloud provides EU-compliant infrastructure with NVIDIA HGX H100 GPUs, making it ideal for tasks like large-scale LLMs and scientific computing in regulated environments.
Table 1: Comparison Table of GPU hosting providers
Provider
GPU Types
Compliance
Price (Starting)
Managed Services
Atlantic.Net
NVIDIA H100 NVL, L40S
HIPAA, HITECH, PCI
$1.57/hr (L40S)
Optional full management
OVHcloud
NVIDIA H100, L40S, L4
GDPR
$1.80/hr (L40S)
Minimal
Hetzner
RTX 3080, 3090, A100
GDPR (EU)
€0.50/hr (RTX 3080)
Minimal
Lambda
H100, A100, RTX 6000
None official
$1.29/hr (A100 PCIe)
JupyterLab, ML tooling
CoreWeave
H100, A100, L40, GH200
SOC, HIPAA, SecNumCloud
$1.80/hr (L40S)
Kubernetes, serverless
PhoenixNAP
Tesla V100, P40
HIPAA, PCI, SOC (select)
Custom pricing
Remote access, DDoS protection
Genesis Cloud
HGX H100, H200 NVL72
EU AI Regulations, Green DC
$2.19/hr (H100)
Networking, storage inclusive
Choosing the Right GPU Hosting Provider for AI and ML: When and Why
When selecting a GPU hosting provider for an AI or ML project, consider these key factors:
For Compliance & Security: Atlantic.net stands out for projects in healthcare and finance, ensuring HIPAA compliance.
For European Businesses: OVHcloud and Hetzner offer strong GDPR-compliant infrastructure in the EU.
For Flexibility & Research: Lambda offers flexible pricing and support for AI researchers, though it lacks official compliance certifications.
For Large-Scale AI Workloads: CoreWeave is ideal for massive workloads, providing high-performance GPUs and networking for distributed AI tasks.
For Cost-Conscious Projects: Hetzner offers the most affordable pricing, making it great for startups.
For High-Performance Computing: PhoenixNAP excels in high-performance tasks, particularly for scientific simulations.
For Sustainability & EU Compliance: Genesis Cloud is ideal for sustainable, EU-compliant AI workloads.
The Bottom Line
Choosing the right GPU hosting provider depends on the project's specific needs. Atlantic.net is ideal for top compliance, scalability, security, and competitive pricing, particularly for healthcare and finance. For cost-effective solutions, Hetzner offers affordable options.
Likewise, OVHcloud is perfect for European businesses needing GDPR compliance. Lambda provides great value for flexible needs and AI research. CoreWeave is best for large-scale AI tasks.
Ultimately, the best GPU hosting provider will depend on the balance between cost, compliance, and performance that best fits the needs of the organization interested in GPU resource procuring for AI or machine learning projects.
### What Is Quantum Computing?
Quantum computing is an emerging form of computing. It utilizes the principles of quantum mechanics, a branch of physics that studies the behavior of tiny particles, such as atoms and photons. Unlike classical computers that use bits to represent information as either 0 or 1, quantum computers use quantum bits or qubits.
Qubits can exist in multiple states at the same time. This characteristic is known as superposition. It enables quantum computers to process many possibilities simultaneously. In contrast, classical computers use bits that can only be in one state, either 0 or 1,at a time. Due to this fundamental difference quantum computers perform certain complex calculations more quickly and efficiently.
Quantum computers are expected to tackle problems that classical computers cannot handle or solve quickly enough. For example, tasks that would take classical supercomputers years to solve could be solved in minutes or hours using quantum computers. According to McKinsey, the quantum computing sector is projected to reach an estimated value of around USD 1.3 trillion by 2035 due to substantial investments by large tech firms.
Although quantum computing is still in development, it has the potential to revolutionize various industries, including cybersecurity, automotive, life sciences, and logistics. In the near future, quantum computers will address problems that are currently unsolvable with today’s technology, thereby bringing new opportunities across various fields.
The Basics of Quantum Computing
Below are the key concepts that explain how quantum computing works:
Qubits and Superposition
In classical computing, a bit is like a light switch that can only be on (1) or off (0) at a certain time. However, in quantum computing, a qubit behaves more like a spinning coin While it is spinning, it shows both heads and tails at the same time. Similarly, a qubit can represent 0, 1, or both at once. This property is known as superposition. It enables quantum computers to carry out multiple calculations at the same time, making them highly efficient for certain tasks.
The number of qubits directly affects the number of possibilities a quantum computer can handle. With n qubits, the system can represent 2ⁿ different states at once. For example, two qubits can represent four possible combinations (00, 01, 10, 11) at the same time. As more qubits are added, the number of possible states increases rapidly. This exponential growth is what gives quantum computers their strength in solving complex problems
Example: Finding the Best Route for a Delivery Truck
Suppose a delivery truck needs to visit 8 different locations and return to its starting point. This type of problem is called the Travelling Salesman Problem (TSP). A classical computer would need to examine all possible routes (40,320 in the case of 8 stops) to find the shortest one. As the number of stops increases, the number of possible routes grows very quickly. For 15 stops, there are more than 1.3 trillion possible combinations.
Quantum computers approach this problem differently. They use qubits to represent many possible routes at the same time. They also apply algorithms like the Quantum Approximate Optimization Algorithm (QAOA) or quantum annealing. These methods help focus on the most promising solutions and reduce the chances of less effective ones. This way quantum systems find good solutions much faster, particularly when the number of stops increases.
Although quantum computers may not always find the exact shortest route, they are very effective at identifying near-optimal routes in a short amount of time. This makes them well-suited for real-world applications like logistics. Companies such as DHL are already exploring how quantum computing can improve delivery routes and reduce fuel consumption and delivery time.
Entanglement
Another key feature that adds to the power of quantum computing is entanglement. When two qubits are entangled, the state of one is directly linked to the state of the other. If one qubit is changed, the other responds instantly, even if they are far apart.
Due to this strong connection quantum computers handle problems involving many related variables more efficiently. As a result, entanglement helps quantum systems perform certain tasks much faster than classical computers.
Quantum Gates and Circuits
Just as classical computers use logic gates like AND, OR, and NOT to operate on bits, quantum computers use quantum gates to control qubits. These gates change the state of qubits to create effects such as superposition and entanglement.
Quantum gates are arranged in sequences to form quantum circuits. These circuits function like programs but are designed to work with qubits instead of bits. Since qubits can represent multiple states at once, quantum circuits can process many possibilities simultaneously. This ability forms the basis of quantum algorithms and makes quantum computers effective for solving complex problems.
What Quantum Computing Can Do That Classical Computing Cannot
Quantum computers are designed to solve problems that classical computers find difficult or time-consuming. One key area is the simulation of complex systems. For example, modeling how molecules behave is very challenging for classical computers. They need a lot of time and processing power. On the other hand, quantum computers can perform these simulations more efficiently and accurately. This could help in developing new medicines, better materials, and improved battery technologies.
Quantum computing is also useful for solving optimization problems. These problems involve finding the best solution among many options. They appear in fields like logistics, finance, and manufacturing. Classical computers check each option one by one, which takes time as the number of options increases. Quantum computers can evaluate many options at once, making the process faster. This can improve things like delivery routes, investment planning, and city traffic management.
In cryptography, quantum computing brings both risks and benefits. It could break current encryption systems. However, it also supports new types of encryption that are safer from quantum attacks. These quantum-resistant methods will protect sensitive data in the future.
It is important to note that quantum computers are not meant to replace devices like laptops or smartphones. They are specialized tools used for specific, complex problems. Tasks such as weather prediction, protein folding, and financial modeling can benefit from their unique power.
The Current State of Quantum Computing in 2025
In 2025, quantum computing is moving from research to real-world use. The technology is still developing, but it is already available through cloud services. This enables companies and researchers to access quantum computing without needing to own expensive hardware, which can be complex to maintain.
Big companies, such as IBM, Google, Microsoft, and Amazon, are leading the way. They are developing quantum processing units (QPUs) and offering them through cloud platforms. Startups are also entering the field, focusing on various quantum computing technologies, including photonic qubits, trapped ions, and superconducting qubits.
Governments worldwide are investing heavily in quantum technology. In the United States, the National Quantum Initiative funds research and development. Similarly, in Europe, the Quantum Flagship program supports various projects across member states. China is making significant progress, particularly in quantum communication and the development of satellite-based quantum networks. Other countries, such as Japan and South Korea, are also increasing their focus on quantum research. These global investments reflect the growing importance of quantum technology for national security, economic growth, and technological leadership. As a result, the pace of quantum advancements is expected to accelerate, creating new challenges and opportunities.
Although quantum computing is not yet ready to replace classical computers, steady progress is being made in this field. With continued funding and open access, practical applications will likely emerge in the years to come.
Challenges and Limitations of Quantum Computing
Quantum computing has great potential, but it still faces numerous challenges before it can be widely adopted.
One major issue is error correction. Qubits are very sensitive. Small changes in the environment, like heat, noise, or electromagnetic signals, can cause them to lose their state. This makes it challenging to maintain accurate results. To fix this, scientists use error correction methods. However, these methods require many extra qubits to protect just one working qubit. This makes quantum computers more complex and more challenging to build.
Another problem is qubit stability. Most quantum systems require operation at temperatures close to absolute zero, approximately -273°C. To achieve this, researchers use large and expensive cooling machines. These machines are difficult to maintain, and add to the cost. Finding ways to make qubits function at higher temperatures is still an area of active research.
Scaling up is also a challenge. Many current quantum computers have fewer than 100 usable qubits. This is insufficient to address significant, real-world problems. Experts believe that thousands or even millions of stable qubits are needed for meaningful applications. Reaching this goal will require time and new engineering solutions.
Moreover, quantum computers cannot run classical algorithms. They need algorithms designed for quantum logic. Developing these quantum algorithms is still in the early stages.
Lastly, there is a shortage of skilled workers. Few people understand both quantum physics and computer science. Many countries are investing in education and training, but the talent gap is a serious concern.
These challenges must be addressed before quantum computing can be applied in everyday industries. Until then, it remains a powerful but early-stage technology.
The Future of Quantum Computing
The future of quantum computing is bright, but its development will happen in stages. Within the next 2 to 5 years, we can expect the emergence of hybrid quantum-classical systems. Quantum processors will work alongside classical supercomputers for tasks such as simulations in finance and chemistry.
Over the next 5 to 10 years, quantum computers may become fault-tolerant with built-in error correction, thereby increasing their reliability. This could lead to innovations in material science and drug discovery, though it could also challenge current encryption methods. Therefore, businesses will need to adapt to new security standards.
Over the next 10 years or more, large-scale quantum computers are expected to revolutionize fields such as climate modelling, artificial intelligence, and physics. Quantum technology will solve problems that classical computers cannot handle. This progress will impact industries such as healthcare, energy, and finance, bringing breakthroughs that are not possible with current technology.
The Bottom Line
In conclusion, quantum computing is an exciting and rapidly growing field with the potential to solve some of the most complex problems in science, industry, and society. Although it is still in its early stages, the progress made so far shows that it could address challenges that classical computers cannot handle.
Quantum computing could bring major changes to areas like logistics, healthcare, and cybersecurity. It offers new possibilities that were once considered out of reach. However, there are still important challenges to overcome, such as qubit stability, error correction, and scaling up the technology. With ongoing research and better technology, quantum computing may become a major step forward in the coming years. It could change how we approach difficult problems and open the door to new ideas and innovations.
### Top Cloud Hosting Solutions for Developers
Modern software development demands infrastructure that is agile, scalable, and capable of handling global traffic. Traditional hosting solutions often struggle to meet these requirements.
Cloud hosting has become a vital part of the development process. It removes the limitations of physical hardware and eliminates the need for manual scaling. This allows development teams to focus on building quality products and improving user experiences, rather than managing servers and infrastructure.
This guide outlines the essential features developers should consider when selecting a cloud hosting provider. It also highlights some of the leading platforms in the market today. Whether you're launching an MVP for a new startup or growing a large-scale enterprise application, choosing the right cloud hosting service can play a critical role in your success.
What Developers Need from Cloud Hosting
A strong cloud hosting platform should support every step of the development process. Here are the key features to consider when making a choice.
Automatic Scalability
Developers need hosting that can automatically scale up during busy periods and scale down when things are quiet. This means both adding power to current servers and spinning up new servers as needed. Platforms that can adjust resources on the fly help keep apps running smoothly, even with heavy traffic or large teams.
Seamless Tool Integration
Modern development relies on continuous integration and delivery pipelines. An effective platform provides easy integration with DevOps tools such as Jenkins, GitLab CI/CD, and Azure DevOps. This integration allows developers to build, test, and deploy from a single environment. Browser-based access to development environments, such as Visual Studio Code, eliminates the "works on my machine" problem.
Smart Cost Management
Flexible, pay-as-you-go pricing is important for teams with changing needs. Features like auto-hibernation for idle environments help developers avoid paying for unused resources. This allows developers to keep costs under control while maintaining performance.
Built-In Security and Compliance
For regulated industries, security is a must-have requirement. Essential security features include role-based access control, encryption, and comprehensive audit logging. Besides, it requires the platform's compliance with standards such as GDPR, ISO 27001, and HIPAA.
Expert Support and Global Performance
Access to technical support could be crucial for resolving technical issues to minimize downtime. For international applications, distributed data centers and intelligent load balancing ensure fast performance worldwide.
Top Cloud Hosting Providers
Atlantic.Net
Atlantic.Net delivers stable, high-performance infrastructure to developers who need robust and managed hosting without complexity. The platform is designed to support a range of development lifecycles, from MVPs for startups to established business applications. Their infrastructure is built with fast SSD instances and RAID-10 storage to ensure rapid response times and minimal downtime. The "Scale Up Servers Anytime" capability allows dynamic resource adjustment without complex migrations. Their pricing mechanism is transparent, starting at $10 per month on demand for general-purpose workloads.
Atlantic.Net's emphasis on human-centered support sets them apart from other platforms. Their experienced cloud support team provides personalized guidance for complex issues. For regulated industries, they offer HIPAA-compliant hosting that meets stringent security standards. This makes them a suitable choice, especially for HealthTech projects.
The platform easily handles large-scale CI/CD pipelines and containerized applications. A startup developing microservices would benefit from Atlantic.Net's robust infrastructure, which supports frequent deployments, container management, and fast storage for testing.
Amazon Web Services
Amazon Web Services (AWS) remains the largest cloud provider, offering an extensive catalogue of services for developers working on complex, enterprise-level applications. The ecosystem includes foundational services such as EC2, S3, and CloudFront, while advanced offerings include managed databases, Lambda serverless computing, and comprehensive AI/ML tools.
The platform provides a development toolchain including CodeCommit for source control, CodeBuild for continuous integration, and CodeDeploy for automated deployments. These tools are integrated with existing development workflows and support a wide range of programming languages and frameworks. The global reach of AWS data centers ensures low latency, regardless of the location of users.
However, AWS comes with significant complexity. With numerous services and optimizations which require considerable expertise, the learning curve can be steep for developers new to cloud infrastructure. The pricing model, while comprehensive, can be challenging to predict and optimize. AWS works best for large development teams with dedicated DevOps resources who can fully benefit from its extensive feature set. Smaller teams might find the complexity counterproductive to their development goals.
Google Cloud Platform
Google Cloud Platform is a suitable choice in areas where Google has natural advantages, particularly artificial intelligence, machine learning, and data analytics. For developers working with these technologies, GCP provides highly valuable solutions to support the development process.
Key services include BigQuery for data analytics, Vertex AI for machine learning, and App Engine for building, deploying, and scaling applications without managing infrastructure. Other services include Cloud Build, Cloud Functions, and Google Kubernetes Engine. Cloud Build provides continuous integration and deployment that easily integrates with Google's development ecosystem. Cloud Functions allows serverless computing for event-driven applications. The Kubernetes Engine enables container orchestration based on Google's original Kubernetes development.
GCP's global network infrastructure delivers high performance, often matching or surpassing AWS in benchmark tests. Its pricing is typically more competitive, especially for compute-heavy workloads. However, GCP's market share is smaller than AWS, which means there are fewer third-party integrations and community resources available. This can make it more difficult to find solutions to specific challenges.
Microsoft Azure
Azure is a popular cloud platform that offers a wide range of services, especially for businesses already using Microsoft products. It works well with Visual Studio, .NET, and other Microsoft development tools. This makes it a natural fit for organizations that rely on Windows or are part of the Microsoft ecosystem.
Azure DevOps gives developers tools for project management, source control, and deployment. If they are already using Microsoft Office 365 or other Microsoft services, Azure makes it easy to connect everything. This helps them with identity management and sharing data across different systems.
Azure’s key services include virtual machines, web hosting, and advanced AI tools. It also offers powerful options for containers and serverless computing, such as Azure Kubernetes Service and Azure Functions. Security is strong, with certifications like HIPAA and ISO 27001.
One of Azure’s biggest advantages is its hybrid cloud support. Developers can keep some of your infrastructure on-premises while using the cloud, which is helpful if you have existing Windows Server setups or face rules that don’t allow full cloud adoption.
Azure’s pricing is competitive, especially when bundled with other Microsoft products. However, Azure is most suited to Windows-based solutions. If your team mainly works with Linux or open-source tools, Azure may not be the best fit.
Linode
Linode is a good option for developers who want cloud hosting that’s simple and easy to use. The platform gives developers reliable virtual private servers, clear pricing, and excellent documentation. Linode also includes helpful tools like the Linode Kubernetes Engine, App Platform for cloud-native apps, APIs, command-line tools, and Terraform support.
Linode has an active developer community and plenty of practical guides and tutorials. Its dashboard is easy to use, so developers can focus on building their apps instead of struggling with complicated cloud setups.
Linode’s simple and developer-friendly approach makes it an attractive option for startups and small to medium businesses. Teams working on SaaS products can get their projects up and running quickly, even if they don’t have deep experience with cloud infrastructure.
Choosing the Right Cloud Hosting Solution
Selecting the right cloud hosting provider involves evaluating several essential factors. Consider the scale and complexity of your project before making a choice. Simple MVPs (Minimum Viable Products) have different requirements than large-scale enterprise applications designed for a global audience.
The expertise of the development team is also a key factor to consider when choosing a platform. If your team has strong DevOps capabilities, you might prefer a cloud provider that offers more control over configurations and management. On the other hand, teams with limited experience in infrastructure may benefit from highly managed cloud services.
Budget is another crucial factor to consider. You must decide whether a predictable pricing model or a flexible pay-as-you-go approach is suitable for your project. Features such as automatic hibernation can help optimize costs.
Security should also be a top priority, especially for applications dealing with sensitive data. You must ensure that your cloud provider complies with relevant standards, such as HIPAA or GDPR, to safeguard your data.
Finally, it's important to recognize that the geographic distribution of your platform can significantly impact performance. Choosing a provider with data centers near your target audience helps ensure faster load times and lower latency.
### Top Accessibility Companies in 2025
Organizations across various industries must maintain digital accessibility to ensure their content is usable by people with disabilities. Many countries have legal requirements regarding accessibility compliance, making it essential for companies to adhere to these standards. Companies may require assistance in resolving accessibility issues to avoid financial and reputational penalties.
A focus on accessibility not only benefits the segment of the population with physical or cognitive impairments but also improves usability for everyone accessing a company's digital content. Companies that provide equal access to their digital products benefit from enhanced brand reputation and extend their market reach. True accessibility also enhances SEO, enabling organizations to reach a broader audience.
This article examines the role of accessibility companies in helping organizations meet their digital accessibility compliance requirements. We will explore who should be concerned about maintaining accessibility and identify some of the best partners that can help your business address any accessibility challenges it may face.
What Is an Accessibility Company?
Accessibility companies help organizations ensure that their digital assets, such as websites, documents, applications, and utilities, are usable by people with disabilities.
Services offered by an accessibility company
Customers can typically leverage the following services to address common accessibility issues.
Accessibility audits - Teams will conduct manual testing of the customer's digital assets, such as mobile apps and websites, to verify compliance. The objective is to identify issues affecting accessibility, such as screen reader compatibility problems or missing alternative text (alt text).
Remediation services - Accessibility testing companies will fix the obvious or subtle accessibility issues found during the audit. For example, application accessibility may require development teams to update code or redesign user interfaces to ensure optimal usability. Web accessibility can be improved by including captions or adjusting contrast to make the content more usable for people with physical or cognitive impairments.
Automated accessibility testing - The company may offer customers tools that perform automated scans to verify that digital content is meeting accessibility requirements. Businesses can conduct ongoing monitoring to identify and resolve new accessibility issues before releasing the content to the public. Automated digital accessibility testing streamlines development by identifying issues early in the process.
Training and consultation - Customers can obtain training in accessibility practices to help limit further development issues. Content creation teams can receive education regarding accessibility features and adopt a comprehensive approach to development that ensures disability inclusion.
Compliance Support - Companies with strategic accessibility expertise can provide support and help customers ensure compliance with relevant standards and regulations. Their experienced teams can help clients create documentation to demonstrate compliance with accessibility guidelines and minimize the risk of lawsuits.
What Are Accessibility Standards?
Accessibility standards are rules and technical specifications that define how companies design and develop digital properties to ensure that everyone, including users with various disabilities, has level access. The standards guide organizations in creating inclusive experiences and complying with legal requirements.
The standards outline specific measures that companies should follow in their development processes. These measures include:
Providing keyboard navigation for individuals who cannot use a mouse;
Furnishing users with captions and alt text for images and videos to assist users with vision issues;
Designing digital content like websites and applications compatible with standard screen readers;
Ensuring adequate color contrast for users with impaired vision.
Multiple standards have been established to ensure that digital artifacts are accessible to individuals with physical disabilities. The following are some of the key sets of standards that organizations must emulate. Some standards are globally acknowledged, while others are specific to certain countries or geographic regions.
WCAG (Web Content Accessibility Guidelines)
The WCAG is globally recognized and is considered the most widely adopted standard for accessibility. Companies in the U.S., UK, EU, Canada, and Australia follow these guidelines. The WCAG was developed by the World Wide Web Consortium (W3C) and defines three accessibility levels for websites, digital documents, and mobile apps.
A - These are the minimum requirements that all digital content should implement.
AA - This level represents industry standards for legal compliance.
AAA - The third level is optional for most companies and strives for maximum accessibility for all users.
U.S. specific standards
Companies operating in the U.S. must adhere to two additional sets of regulations.
Section 508 applies to federal agencies and was developed based on the WCAG 2.0 AA standards. All federal agencies and their vendors must make software, hardware documents, and multimedia IT artifacts accessible to everyone.
The Americans with Disabilities Act (ADA) is a civil rights law enforced through WCAG. ADA compliance applies to websites and mobile apps as well as public accommodations and brick-and-mortar businesses.
EU-specific standards
Organizations in the European Union must comply with EN 301 549. The regulations are compatible with WCAG 2.1 AA and are required for mobile apps and public sector websites. Compliance is required by the EU Web Accessibility Directive.
PDF and document standards
Additional accessibility requirements include PDF Universal Accessibility and EPUB Accessibility, ensuring that digital documents are equally accessible to all users.
Who Needs to Meet Accessibility Compliance Standards?
Organizations in the following sectors that offer digital products or services to the public typically must meet accessibility compliance standards. Failure to adhere to the guidelines may result in lawsuits, damage to organizational reputation, and the loss of contracts and customers.
Government agencies - All public sector entities must meet the standards or face legal repercussions. Specific standards for this sector include Section 508 in the U.S. and EN 302 549 in the EU.
Educational institutions - Public and private schools must comply with standards such as the ADA to guarantee that websites, online course materials, and learning platforms are accessible to individuals with disabilities.
Private organizations open to the public - Private businesses that serve the public, such as healthcare providers, financial institutions, retail websites, and entertainment platforms in the U.S., must follow the standards defined by the ADA.
Employers - Companies must make digital workplace tools accessible to employees with disabilities. Organizations may face discrimination claims if they present internal applications demonstrating accessibility barriers to people with disabilities.
Tech and e-commerce companies - Businesses in the tech and e-commerce sector must comply with WCAG 2.1 Level AA to avoid legal risks and expand their reach by promoting an inclusive reputation.
Top Accessibility Companies
The following are some of the top companies that provide services and solutions designed to help companies achieve digital accessibility.
Skynet Technologies
Skynet Technologies is a digital accessibility company that offers comprehensive solutions to make websites, apps, and digital assets accessible and compliant with global standards, including WCAG, ADA, Section 508, and other relevant standards, such as EAA EN 301 549. They have 10 years of experience in the digital accessibility industry, delivering a suite of website accessibility services that include automated and manual audits, managed website accessibility remediation, ongoing monitoring, document accessibility, training, consulting, and support.
As a W3C member, Skynet Technologies is committed to helping businesses of all sizes build inclusive digital experiences. The company has developed an AI-powered platform called All in One Accessibility®, which supports over 140 languages to cater to global audiences as well as a wide range of assistive technology solutions. Skynet's digital accessibility services are ideal for State and Federal governments, educational and university websites, banking institutions, non-profits, and businesses of all sizes, as well as the public sector.
Deque Systems
Deque Systems offers customers proven accessibility testing solutions and a range of services to support accessibility compliance with global standards. The company's Accessibility Awareness Lab is designed to help your team understand how people with disabilities experience and use technology. Deque University is a training resource that includes on-demand reference materials for every level and area of expertise in digital accessibility. Customers can deploy the Axe DevTools Browser Extension to automatically catch accessibility issues with the click of a button.
Level Access
Level Access supports digital accessibility with AI-powered solutions designed to empower every user. They offer audit and digital accessibility testing with automated scans and expert analysis. Customers can quickly identify and fix accessibility issues with the company's AI-powered tools. Level Access provides customers with accessibility conformance reports to verify they meet requirements such as the ADA and WCAG.
EqualWeb
EqualWeb provides a hybrid accessibility solution that leverages AI-powered technology with a fully managed team of experts who audit a customer's website and fix all issues related to WCAG. The company levels up your website to the highest accessibility standards and protects you from lawsuits and legal action. EqualWeb offers its prospective customers a free consultation to discuss their accessibility needs.
Siteimprove
Siteimprove helps team optimize their reach, reputation, revenue, and returns with AI-powered content intelligence. The company's solutions integrate accessibility, digital governance, analytics, and search engine marketing in a unified platform. Siteimprove's goal is to help businesses maximize the quality, performance, and accessibility of their websites.
Partner with a Reliable Cloud Provider
Atlantic.Net offers its customers reliable cloud hosting solutions to address any size business or usage scenario. Your company can leverage advanced processors and cutting-edge technology to meet business requirements and maintain a consistent, high-performing web presence. Atlantic.Net has been in business for over 30 years and has a proven track record of successfully providing cost-effective hosting solutions.
Companies can meet their accessibility goals by partnering with Atlantic.Net and engaging a specialized company to address accessibility barriers. Contact the team at Atlantic.Net to learn how our cloud hosting solutions can help your business thrive in today's competitive business landscape.
### Top LLM Development Tools and Platforms for 2025
The use of large language models (LLMs) has grown significantly since ChatGPT was released on November 30, 2022. The impact LLMs have had on our everyday lives is massive, and in just a few short years, everything we know about LLMs has changed. Businesses are investing huge amounts of cash into research and development to make every new iteration of an LLM the strongest yet.
LLM systems are a core component of modern software releases. Search engines are continually implementing LLM integration at higher rates; businesses are relying on chatbots built on LLMs. Nearly all major software releases have some form of AI baked into the product, or at the very least, an LLM is on the application roadmap for imminent release.
The creation of LLM-powered applications requires specialized LLM development tools. These tools help manage everything from data handling to the deployment of machine learning models. To create LLM-powered applications, companies can use different resources, including software tools like MLOps platforms and specialized frameworks, as well as service providers like development agencies that build custom AI applications for you.
This article provides an overview of key companies and platforms in the LLM development space. It is designed to help you choose the right solution for your needs, enabling your business to build an effective and scalable intelligent system.
A Look at LLM Development Tools
LLM development tools are used to build, train, and deploy large language models. The technology is built upon the transformer architecture, which enables powerful natural language understanding in modern AI. If you are not familiar with the term transformer, think of it like an encoder-decoder system. The encoder "reads" and "understands" the input sentence, and the decoder "writes" the output sentence based on that understanding.
Several types of development tools exist, including:
Frameworks: Frameworks are code toolkits that connect and manage all the components of an LLM application.A popular Python library like LangChain or LlamaIndex provides a structure for creating LLM-based applications. They offer a simple interface that can accomplish complex tasks in just a few lines of code. These frameworks simplify connecting to different model providers and assets from hubs like the Hugging Face Model Hub, and can often be run on a local machine for development.
Vector Databases: A Vector database is a library for information based on its meaning, not just keywords. For applications that use retrieval augmented generation, a vector database is essential. Many teams opt for an open-source vector database to store vector data created by embedding models. These databases allow for fast similarity search and support hybrid search, combining vector capabilities with traditional keyword search on structured data.
MLOps Platforms: MLOps platforms provide an end-to-end production line for managing the entire lifecycle of a machine learning model.These platforms support the complete lifecycle of machine learning models, from initial data loading to the final process of deploying machine learning models. They assist with tuning model parameters, monitoring performance, and often integrate with cloud services. These platforms are becoming essential for managing not just LLMs, but also multimodal models and those improved with reinforcement learning, though they are often geared toward advanced users.
Development Partners: A development partner is an expert team you hire to build your application when you lack the internal resources.For organizations without in-house expertise, development companies provide the skills needed to build custom AI models and applications. They manage the entire process, from ideation to final deployment.
These components work together to enable the creation of sophisticated applications that perform natural language processing tasks, from simple question answering systems to complex systems that use function calling to interact with other software.
Top 5 LLM Development Tools and Platforms
Now that we've covered the core components of a generative ai application, let's look at the top-tier tools and platforms that developers are using to build them. Selecting the right components for your development stack is a critical decision, as each platform offers a unique set of capabilities for different project needs and scales.
#1: Hugging Face
Hugging Face is the definitive hub for the open-source AI community. More than just a repository, it is a comprehensive platform providing tens of thousands of pre-trained deep learning models, including many specialized for tasks like language translation. It supports diverse data types and data formats, making it the essential starting point for nearly any team working with language models.
Advantages:
Unparalleled access to a massive library of open-source models, perfect for running machine learning experiments.
Industry-standard libraries that simplify model interaction and training.
Strong community support and extensive documentation for countless use cases.
Provides tools for the entire workflow, including inference endpoints and model evaluation.
Disadvantages:
The sheer number of choices can be overwhelming for beginners.
While core use is free, enterprise-grade features like private hubs and dedicated inference come with hosting costs.
Relies on community contributions, which can mean variable quality in models and documentation.
Ideal For:
Any development team that wants to leverage the power of open-source AI. It is indispensable for experimentation, building with a wide variety of models, and following community-driven best practices.
#2: LangChain
LangChain is the premier open-source framework for orchestrating the components of an LLM application. It acts as the "glue," providing a modular structure to connect language models with external data sources, APIs, and other integration tools. It enables developers to easily build complex machine learning workflows, and its ability to parse and manage language model outputs makes it invaluable for creating reliable agents.
Advantages:
Drastically simplifies the creation of complex application logic.
An enormous ecosystem of third-party integrations, supporting virtually every popular model, database, and API.
Actively maintained with a strong community and rapid feature development.
Its declarative structure makes it easier to manage and modify complex chains.
Disadvantages:
The framework's rapid evolution can lead to breaking changes and occasionally outdated documentation.
Adds a layer of abstraction that can sometimes make debugging underlying issues more difficult.
Ideal For:
Developers building any application that requires more than a single call to an LLM. It is the go-to tool for creating applications that are context-aware, data-driven, and interactive.
#3: Pinecone
Pinecone is a leading managed vector database, a critical component for any application using Retrieval-Augmented Generation (RAG). It allows applications to perform incredibly fast vector similarity search. This technology, pioneered by open-source libraries like Facebook AI Similarity Search (FAISS), is now available in a highly scalable managed service through Pinecone, enabling an LLM to pull in relevant information before generating a response.
Advantages:
Fully managed service eliminates the need to handle complex database infrastructure.
Engineered for high performance and low latency, making it suitable for real-time applications.
Simple API makes it easy to integrate into any application stack.
Serverless architecture scales automatically with usage, handling billions of vectors.
Disadvantages:
As a proprietary service, it can lead to vendor lock-in compared to open-source alternatives.
Costs can escalate quickly for very large datasets or applications with high query volume.
Offers less configuration control than a self-hosted vector database.
Ideal For:
Businesses building production-grade RAG applications, which are a cornerstone of modern deep learning systems, that require high performance and reliability without managing database infrastructure.
#4: Databricks
Databricks provides a unified Data and AI platform designed to handle the entire machine learning lifecycle at an enterprise scale. It allows teams to manage everything from data preparation (handling many data types) and governance to model training, fine-tuning, and the ability to deploy models into production. This unified approach is a core principle of modern machine learning operations (MLOps).
Advantages:
A single, integrated platform for all data and AI workloads, reducing tool complexity.
Excellent for ensuring data governance, security, and lineage, which is critical for enterprises.
Provides scalable compute for demanding tasks like training foundation models from scratch.
Strong integration between data processing and machine learning tools like MLflow, which provides robust capabilities for model monitoring.
Disadvantages:
The platform is powerful but complex, with a significant learning curve.
Can be very expensive, making it less accessible for smaller companies or projects.
May be overkill for teams whose needs don't involve massive-scale data engineering.
Ideal For:
Large enterprises with established data teams that need a robust, secure, and governable platform to manage the end-to-end LLM lifecycle at scale.
#5: OpenAI Platform
The OpenAI Platform provides API access to some of the world's most advanced and widely recognized language models, including the GPT series. Beyond just offering models, it is a complete development platform that allows developers to easily integrate state-of-the-art generative AI capabilities into their applications. Tools like the Assistants API and fine-tuning capabilities enable the creation of highly sophisticated and specialized solutions.
Advantages:
Direct access to cutting-edge, state-of-the-art proprietary models.
Extremely easy to get started with, thanks to a clean and well-documented API.
Consistently high performance on a wide range of general-purpose reasoning and generation tasks.
Continuously updated with new features and models.
Disadvantages:
The models are "black boxes," which can make their behavior difficult to explain or debug.
Reliance on a single, proprietary provider creates vendor lock-in and dependency.
Data privacy and usage policies may be a concern for organizations with sensitive information.
Ideal For:
Teams that need the best-in-class general performance with the fastest time-to-market. It is excellent for prototyping and for building applications where access to the most powerful models is a competitive advantage.
Key Features in Modern LLM Tooling
Remember that when evaluating LLM development tools, certain key features are essential for building effective AI applications. It's important to ensure that your chosen LLM development tools feature:
Fine-Tuning and Model Customization: Dev tools with the ability to perform fine-tuning on pre-trained models are critical. This process adjusts a general model, like a Generative Pre-trained Transformer (GPT), using a specific dataset. This improves performance on specific bespoke tasks and makes the model great at specific data analysis. Businesses often train models on proprietary company data to make the LLM an expert in their business model.
Retrieval Augmented Generation (RAG): RAG enhances LLM models by connecting them to external data sources. This is often achieved with a vector database. When a query is made, the system performs a similarity search to find relevant information, which is then provided to the LLM as context. This process of data retrieval helps reduce errors and allows the model to use current information.
Function Calling: Modern language models can now use function calling. This allows the model to interact with external APIs and tools. For example, an LLM could use a function to get current weather data or book a meeting. This feature transforms generative models into active agents that can perform tasks. Most AI agents use this feature, and the technology enhances the capabilities of LLMs and allows for greater customization.
LLM Observability: An LLM observability platform is used to monitor model performance. It tracks performance metrics, logs inputs and outputs, and helps teams understand how their LLM applications are being used. This is essential for maintaining quality and identifying areas for improvement.
Conclusion
When it comes to LLM development tools, the choice is no longer just about which language model to use, but about selecting a complete dev environment based on various frameworks, databases, and operational platforms.
Choosing the right approach—whether it is a full-service development partner or an in-house MLOps solution—depends on internal expertise, project scope, and business goals. By focusing on LLM tools that support critical features like fine-tuning, retrieval augmented generation (RAG), and comprehensive model observability, organizations can build effective and scalable intelligent systems.
Ultimately, the effectiveness of these software tools is dependent on the power and reliability of the underlying hardware. The process of deploying machine learning models, especially for tasks that require real-time inference, demands the very latest cloud infrastructure. This is where a provider like Atlantic.Net can help, offering the GPU-accelerated cloud services that are essential for powering demanding AI applications.
By matching the right LLM development tools with a high-performance infrastructure, organizations can build effective and scalable systems that provide real value.
To learn more about Atlantic.Net GPU hosting solutions, powered by NVIDIA, contact our team today or deploy a dedicated A100 or H100 GPU server in seconds to power your AI applications.
### Scaling AI Workloads: Why Hybrid Cloud Infrastructure Is the Future of Enterprise AI
Enterprise AI is currently undergoing a significant transformation. Businesses are transitioning from basic tools like chatbots and automation to advanced artificial intelligence (AI) models to gain a competitive edge and real business value. However, this change also brings new challenges, especially related to traditional IT infrastructures. Reports show that many companies abandon AI projects because their infrastructure cannot handle computational requirements of AI. Traditional on-premises setups fail to handle sudden demands, and full cloud solutions bring challenges about rising costs and data control. This gap has created space for a new approach: hybrid cloud infrastructure.
Understanding AI Workloads and Their Unique Demands
AI applications today are far more demanding than most IT teams expected. Training a large language model can require thousands of GPUs running for weeks. Computer vision systems need to process millions of images in real time. Recommendation engines must analyze user behavior patterns across massive datasets.
These workloads share common characteristics that make them particularly challenging. They require enormous amounts of computing power for short periods. They generate and consume vast amounts of data. They need specialized hardware like GPUs and TPUs. Most importantly, they are unpredictable in their resource demands. Take a retail company that uses a demand forecasting model as an example. During normal operations, the system might use modest computing resources to generate daily predictions. But when training new models on seasonal data, it suddenly needs 50 times more processing power. Traditional infrastructure cannot efficiently adapt to these changing requirements.
Why Cloud-Only Solutions Fall Short
Many organizations initially assume that public cloud services will solve their AI infrastructure challenges. Cloud providers offer impressive AI services and apparently unlimited computing power. However, reality often proves more complicated than expected.
Cost becomes the first major hurdle. Running large AI workloads continuously in the cloud can generate excessive bills. The CEO’s guide to generative AI report states that every single organization has cancelled or postponed at least one gen AI initiative due to high compute cost.
Data movement is also a key challenge. AI models need access to enormous datasets, often measured in terabytes or petabytes. Moving this data to and from cloud services creates bottlenecks and additional costs. Network latency can also slow down training processes significantly.
Compliance and security concerns further complicate the process, particularly for industries subject to strict regulations like GDPR and HIPAA. Many industries have strict requirements about where data can be stored and processed. Healthcare companies cannot easily move patient data to public clouds. Financial institutions face similar restrictions with customer information.
The Hybrid Cloud Advantage
Hybrid cloud infrastructure combines the best practices of on-premises systems and public cloud services. Organizations keep sensitive data and predictable workloads on their own servers while using cloud resources for variable demands and specialized tasks.
This approach solves several problems simultaneously. Companies maintain control over their most critical data while gaining access to virtually unlimited computing power when needed. They can optimize costs by using their own infrastructure for baseline workloads and cloud services for peak demands.
A manufacturing company illustrates this approach well. They run their quality control AI models on local servers to maintain low latency and data security. When they need to train new models on historical data, they employ cloud resources for additional computing power. This strategy reduces their AI infrastructure costs while improving performance.
Flexibility in Resource Management
Hybrid cloud infrastructure provides flexibility in managing AI workloads. Organizations can match their infrastructure choices to specific use cases rather than forcing everything into a single model.
Edge computing becomes possible when AI models need to operate close to data sources. For example, a logistics company can deploy route optimization models directly in their warehouses while using cloud services for training and updates. This hybrid approach reduces latency and improves reliability.
Seasonal businesses benefit enormously from this flexibility. For instance, an e-commerce company can scale up their recommendation systems during holiday shopping seasons using cloud resources. During slower periods, they can scale back to their on-premises infrastructure. This elasticity would be impossible with traditional approaches.
Data Management and Security
As data is crucial for building AI systems, data management has become an important part of AI development and deployment. Hybrid cloud infrastructure provides better options for managing data. Organizations can implement data governance policies that keep sensitive information secure while enabling AI innovation.
Data residency requirements are easier to manage in hybrid environments. A multinational bank can keep customer data in specific countries while using cloud services for model training and development. They can comply with local regulations while still benefiting from global AI capabilities.
Backup and disaster recovery become more robust with hybrid approaches. Critical AI models and data can be replicated across both on-premises and cloud environments. This redundancy ensures business continuity even during major outages.
Performance Optimization
Hybrid cloud infrastructure enables performance optimization strategies that are impossible with single-environment approaches. Organizations can place workloads where they perform better while maintaining overall system efficiency.
GPU sharing becomes more effective in hybrid environments. Companies can aggregate GPU resources across on-premises and cloud environments, ensuring these expensive assets stay busy. A research organization can share GPU clusters between multiple AI projects, automatically shifting workloads to available resources.
Network optimization plays a crucial role in hybrid performance. Organizations can minimize data movement by placing AI workloads close to their data sources. This reduces both latency and bandwidth costs.
Cost Management Strategies
Hybrid cloud infrastructure has changed cost management from a reactive task to a strategic process. It allows organizations to gain visibility and control over their AI spending while maintaining performance. On one side, the reserved capacity of on-premises infrastructure helps organizations manage predictable workloads at lower costs. On the other hand, variable cloud resources manage peak demand without the need for costly upgrades to on-premises systems. This combination helps optimize both operational and capital expenses.
Automated scaling policies ensure that costs are kept in check while also ensuring sufficient performance. For example, a healthcare AI system can automatically move workloads between environments based on demand. This automation reduces the need for manual management, while effectively controlling expenses.
Implementation Challenges
Deploying hybrid cloud infrastructure for AI workloads brings several challenges that organizations must handle carefully. Complexity increases significantly when managing resources across multiple environments.
Managing hybrid environments effectively requires specialized skills, which can be difficult to find. Organizations need experts who understand both on-premises infrastructure and cloud services, as well as how to coordinate workloads across these environments.
Integration becomes a challenge when connecting on-premises and cloud systems. Data synchronization, security policies, and performance monitoring are more complicated in hybrid environments. Organizations require strong management tools to manage these complexities.
The Path Forward
Hybrid cloud infrastructure is the future of enterprise AI because it addresses real business needs rather than theoretical possibilities. Organizations can maintain control while gaining flexibility. They can optimize costs while ensuring performance. Most importantly, they can adapt their infrastructure as their AI needs evolve.
The successful deployment of this approach requires careful planning and gradual implementation. Organizations should start with pilot projects that demonstrate the benefits of hybrid clouds. They should invest in training teams and implementing proper management tools. They should also develop clear policies for workload placement and data governance.
Companies that adopt hybrid cloud infrastructure for AI will gain a competitive edge. They will be able to deploy AI solutions faster, operate them more efficiently, and scale them more effectively than competitors using traditional methods.
Conclusion
The future of enterprise AI relies on infrastructure that can adapt to evolving needs while ensuring security, performance, and cost control. Hybrid cloud infrastructure offers this adaptability by combining the strengths of both on-premises and cloud environments.
Organizations that recognize this shift will be better positioned for success in an AI-driven future. Hybrid cloud infrastructure allows businesses to utilize the full potential of artificial intelligence while maintaining the control and flexibility required for their operations. The key question is not whether to adopt hybrid cloud infrastructure for AI, but how quickly organizations can make the transition effectively.
### Dedicated Hosting - In-Depth Buyer's Guide
The IT industry often feels overly focused on cloud hosting, so much so that it’s easy to overlook another type of powerful and dependable hosting solution: the dedicated server. While shared hosting is suitable for small projects and cloud hosting offers flexibility, dedicated hosting provides a level of performance, security, and control that is unmatched. It is the top-tier choice for businesses with demanding applications that require the full, undivided resources of a physical server.
A dedicated server is exactly what it says on the tin: a physical server that is entirely yours. You don't share its CPU, RAM, or storage with any other customer. This eliminates the chance of suffering the "noisy neighbor" problem sometimes found on older shared or cloud environments, where another user's activity can slow down your application. Dedicated hosting is a straightforward, powerful solution for serious business needs.
This guide is for business owners, IT managers, and developers who are considering a dedicated server. We will explain what it is, when you need one, what to look for in a provider, and what hardware to choose. We aim to provide all the information you need to make an informed decision as to whether a dedicated server is the right choice for your business.
Understanding Dedicated Hosting: What It Is and Who It's For
A dedicated server is a single physical computer in a data center that you rent from a hosting provider. You have exclusive use of all its resources. The provider owns the hardware and is responsible for maintaining it and ensuring it has power and a network connection. You are typically responsible for the software, from the operating system up to your application.
Dedicated hosting is fundamentally different from other types of hosting:
Compared to Shared Hosting: On a shared server, you are one of hundreds or even thousands of customers on the same machine. It's cheap, but performance is inconsistent, and security risks are higher.
Compared to Cloud Hosting: Cloud hosting is a partitioned section of a dedicated server. You have your own operating system, but you still share the underlying physical hardware with other cloud customers.
Who Is Dedicated Hosting For?
High-Traffic Websites: Sites that receive hundreds of thousands or millions of visitors per month and need the consistent power of a dedicated machine.
Large E-commerce Stores: Online stores with large product catalogs and high transaction volumes that require a fast, secure, and reliable server to process orders and protect customer data.
Resource-Intensive Applications: This includes big data processing, machine learning, large databases, video transcoding, or game servers that need every bit of available CPU and RAM.
Businesses with Strict Security or Compliance Needs: Having your own server gives you complete control over its security configuration and helps meet strict compliance standards like HIPAA or PCI DSS by ensuring no one else's data resides on the same machine.
What to Look for in a Dedicated Hosting Provider
Choosing a dedicated hosting provider is a long-term commitment. You are renting a physical piece of equipment from a provider's data center facility. It is an investment that requires careful consideration.
Here are the most important factors to evaluate.
Hardware Quality and Options
Since you are renting a physical machine, the quality of its components is critical.
Processor (CPU) Choices: Look for providers that offer modern, enterprise-grade processors from Intel (like the Xeon series) or AMD (like the EPYC series). A provider that still offers decade-old CPUs is not investing in their infrastructure. The ability to choose from a range of processors allows you to match the server's power to your specific needs.
RAM Quality: The server's memory should be ECC (Error-Correcting Code) RAM. This type of memory can detect and correct common kinds of internal data corruption, which is essential for server stability. Non-ECC RAM is for desktops, not business servers.
Storage Technology: A good provider will offer a choice of storage drives. This can include traditional mechanical Hard Disk Drives (HDDs) for mass storage, faster Solid State Drives (SSDs) for general use, and ultra-fast NVMe (Non-Volatile Memory Express) SSDs for applications that need the absolute lowest latency, like large databases. SSDs are usually standard on dedicated servers.
Providers like Atlantic.Net offer a full range of these storage solutions, from cost-effective SATA HDDs for backups to the fastest NVMe SSDs for demanding database applications, allowing for a fully customized setup.
Data Center and Network Infrastructure
The server's physical location and its connection to the internet are just as important as the hardware itself.
Data Center Specifications: A reputable provider will be transparent about their data centers. Look for details on their power redundancy (e.g., N+1 or 2N UPS systems), cooling systems, and physical security measures (e.g., on-site staff, video surveillance, biometric access). These features protect your server from physical threats and outages.
Network Performance: Ask about the provider's network capacity and their connections to major internet backbones. A provider with multiple, high-quality connections will offer better speed and reliability. Look for a provider that offers at least a 99.9% network uptime guarantee in their Service Level Agreement (SLA). Atlantic.Net in fact provides a 100% uptime SLA, backed by our robust, audited data center infrastructure, ensuring superior reliability for your critical services.
Built-in DDoS Protection: Distributed Denial of Service (DDoS) attacks are a common threat that can knock your server offline. Good providers include DDoS protection as a standard feature to detect and block these attacks before they affect your service.
Support and Service Level Agreements (SLAs)
When a physical server has a problem, you are completely dependent on the provider to fix it.
24/7 On-Site Support: Your provider must have skilled technicians physically present at the data center 24/7. A hardware failure at 3 AM needs to be addressed immediately, not when the office opens the next morning.
Hardware Replacement SLA: The SLA should clearly state how long it will take the provider to replace a failed component like a hard drive, a power supply, or a stick of RAM. A good SLA will guarantee replacement within a few hours, not a few days. A top-tier provider like Atlantic.Net guarantees a one-hour hardware replacement SLA, which means a critical component failure is resolved swiftly by on-site engineers, day or night
Managed vs. Unmanaged Support: Understand the level of support you are buying. With an unmanaged server, the provider is only responsible for the hardware and network. You handle all software issues. If you lack a dedicated IT team, choosing a managed service from a provider like Atlantic.Net is a strategic move. They can handle crucial tasks like OS updates, security patching, and server administration, allowing you to focus on your business.
Pricing, Contracts, and Setup
The pricing structure for dedicated servers is more traditional than the cloud's pay-as-you-go model.
Contract Length: Most providers offer discounts for longer contract terms. A month-to-month plan will be the most expensive, while a one or two-year contract will be cheaper. Be sure you are ready for a long-term commitment before signing.
Setup Fees: Some providers charge a one-time fee to set up the server. This fee covers the cost of racking the machine and installing the initial operating system. Sometimes these fees are waived for longer contracts.
Customization Options: A good provider will let you customize your server before you order it. You should be able to choose the exact CPU, amount of RAM, and number and type of hard drives you need. It is recommended to reach out to the provider to discuss any custom options you may need.
This is where a provider like Atlantic.Net truly stands apart from hyperscalers, specializing in creating custom server configurations tailored to your specific workload and budget requirements.
What to Buy: Server Hardware and Services
Choosing the right components for your dedicated server is a balancing act between performance and cost.
Processor (CPU)
The CPU is the brain of your server. The choice often comes down to the number of cores and the clock speed of each core.
Cores vs. Clock Speed: A higher number of cores is good for running many different tasks at once (parallel processing), like a busy web server handling hundreds of simultaneous visitors. A higher clock speed is better for tasks that rely on the speed of a single thread, like certain database operations or older applications.
Memory (RAM)
RAM is your server's short-term memory. Not having enough RAM is one of the most common causes of poor performance.
How Much RAM? This depends heavily on your application. A simple web server might be fine with 16-32 GB of RAM. A server running multiple virtual machines, a large database, or in-memory caching (like Redis or Memcached) will need 64 GB, 128 GB, or even more. Always choose ECC RAM.
Storage and RAID Configuration
Your storage choice affects both speed and reliability.
Drive Types:
SATA HDD: Slowest but cheapest. Good for backups or storing large, infrequently accessed files.
SAS HDD: Faster and more reliable than SATA HDDs. A good mid-range choice.
SATA SSD: Much faster than any HDD. The standard choice for operating systems and most applications.
NVMe SSD: The fastest storage available, connected directly to the CPU. Use this for your main database files or any application where storage latency is a critical bottleneck.
RAID Configuration:
RAID (Redundant Array of Independent Disks) uses multiple drives to protect your data from a single drive failure.
RAID 1 (Mirroring): Two drives that are exact copies of each other. If one fails, the server keeps running on the other. It's simple and reliable.
RAID 5/6 (Parity): Uses three or more drives and provides a balance of performance and protection. It can survive one (RAID 5) or two (RAID 6) drive failures.
RAID 10 (Stripe of Mirrors): The best of both worlds, combining the speed of striping (RAID 0) and the protection of mirroring (RAID 1). It requires at least four drives and offers the best performance and reliability, but it is also the most expensive.
Bandwidth and Network
Bandwidth is the amount of data your server can send and receive.
Port Speed: Most providers offer a 1 Gbps port as standard. For very high-traffic applications, you may need a 2.5, 5, or 10 Gbps port.
Data Transfer Allowance: Unlike cloud providers who often charge per gigabyte, most dedicated server providers include a large amount of monthly data transfer (e.g., 10-30 TB) for a flat fee. This makes costs more predictable. Make sure you know if there are any additional charges incase exceed your allowance.
Why You Should Use Dedicated Hosting
Why should you choose a physical machine instead of a cloud instance? The reasons are clear and compelling.
Unmatched Performance
With a dedicated server, 100% of the CPU, RAM, and disk I/O are yours. There is no virtualization layer overhead and no "noisy neighbors" competing for resources. This leads to the most consistent and predictable high performance possible, which is critical for demanding applications.
Complete Control
You have full root or administrator access to the machine. You can install any operating system you want, customize the kernel, and configure the software stack exactly to your needs. This level of control is not possible in shared, cloud hosting, or most PaaS cloud environments.
Enhanced Security and Privacy
Since you are the only customer on the server, you have a physically isolated environment. This greatly reduces the attack surface and lowers the risk of security breaches compared to what can affect shared platforms. You have full control over your firewall rules and security updates, and you can be confident that no one else's data resides on your machine. This is a key requirement for many compliance standards.
Predictable Costs
The monthly cost of a dedicated server is generally fixed. You pay a set price for the hardware and bandwidth options you choose. This makes budgeting much simpler than the variable, pay-as-you-go model of the cloud, which can lead to surprise bills if not carefully managed.
The Good Points and Bad Points of Dedicated Hosting
Dedicated hosting is powerful, but it may not be the right choice for everyone.
The Good:
Performance: You get the full, uninterrupted power of a physical server.
Control: Full root access allows for complete customization of the software environment.
Security: Physical isolation provides a more secure environment than shared platforms.
Predictable Billing: A fixed monthly cost makes budgeting easy.
No "Noisy Neighbors": Another customer's traffic spike will never affect your performance.
The Bad:
Cost: It is more expensive than shared, cloud hosting, or entry-level cloud hosting.
Management Responsibility: Unless you pay for a managed service, you are responsible for all software updates, security, and administration.
Lack of Flexibility: You are renting a physical machine. You can't instantly scale up or down like you can in the cloud. Upgrading requires physical work by a technician and usually involves downtime.
Long-Term Commitment: The best pricing often requires signing a one or two-year contract.
What to Decide Before You Buy
Before you sign a contract for a dedicated server, make sure you have clear answers to these questions.
Your Technical Needs:
What exact operating system and software will you run?
What are the CPU, RAM, and storage requirements of your application? Run performance tests if you are unsure.
How much monthly traffic do you realistically expect? Check your current analytics.
Do you need a RAID configuration for data protection? (The answer is almost always yes.)
Your Budget:
What is your maximum monthly budget for the server and any software licenses?
Have you accounted for a potential setup fee?
Have you compared the cost of a one-year contract versus a month-to-month plan?
Your Technical Skills:
Who on your team has the skills to set up, secure, and manage a server?
Who will be responsible for responding to security alerts or software problems at 3 AM?
If you don't have this expertise in-house, have you budgeted for a managed service plan?
Setting Yourself Up for Success
A dedicated server provides a powerful and stable foundation for your applications. By planning, you can ensure a smooth and successful experience from day one.
Here’s how to proactively address key considerations:
Strategy: Ensure Uninterrupted Service with Hardware Redundancy
Even the highest quality components can fail. To ensure your operations continue without interruption, it's crucial to plan for hardware resilience.
Solution: Always configure your server with a RAID array. A RAID 1 (mirroring) or RAID 10 configuration creates an exact copy of your data on a separate drive. If one drive fails, the server continues to run seamlessly from the other, giving the provider ample time to replace the faulty component with zero downtime for your application. When choosing a provider, confirm they offer a strict hardware replacement Service Level Agreement (SLA).
Strategy: Match Resources to Your Ambitions
One of the greatest advantages of a dedicated server is having ample resources. The key is to accurately forecast your needs to avoid performance bottlenecks as your business grows.
Solution: Before purchasing, thoroughly analyze your current application's performance metrics. Review your CPU and RAM usage graphs, especially during peak traffic. Choose a server configuration that comfortably handles your current peak load with significant headroom for future growth. A good rule of thumb is to ensure your expected peak usage stays below 50-60% of the server's total capacity.
Strategy: Build a Secure Foundation
On an unmanaged dedicated server, you have complete control over your security posture. This is a significant advantage, and it's essential to implement security best practices from the start.
Solution: Treat server security as a fundamental part of your setup process. This includes diligently keeping the operating system and all installed software updated with the latest security patches. Implement a robust firewall, only opening the network ports that are necessary for your application to function. If you don't have in-house security expertise, investing in a managed service plan is the most effective way to protect your server.
Strategy: Maintain Flexibility as Your Business Evolves
Your business needs will inevitably change over time. Your hosting agreement should be an asset to your growth, not a restriction.
Solution: If your business is young or you are uncertain about future requirements, begin with a month-to-month contract. While the initial cost may be slightly higher, the flexibility to adapt is invaluable. Once you are confident that the server configuration will meet your needs for the foreseeable future, you can commit to a longer-term contract to benefit from lower pricing.
Atlantic.Net vs. Hyper Scale Providers
The dedicated server market has many large, volume-focused providers who offer cheap servers in fixed configurations. They are the factory assembly lines of the hosting world. A provider like Atlantic.Net operates more like a custom workshop, which offers significant advantages for serious businesses.
Many large providers limit your choices to a handful of pre-built servers. If you need a specific combination of CPU, RAM, and storage that isn't on their menu, you are out of luck. Atlantic.Net specializes in working with clients to build custom servers that precisely match their workload and budget. This can involve ordering specific hardware components or creating complex network setups. This flexibility ensures you get the exact tool for the job.
The other major difference is support. With a hyper-scale provider, you are often just an account number. Getting expert help can be a frustrating process. Atlantic.Net provides direct access to its senior engineers who understand server hardware and software deeply. This is invaluable when you have a complex problem that requires more than a simple reboot. For a business whose revenue depends on its server, having that level of expert support can be a game-changer.
Questions for a Subject Matter Expert
Here are some questions you can ask a dedicated hosting expert:
When should a business choose a dedicated server over a cloud instance?
What is the single most common mistake people make when ordering a dedicated server?
In terms of hardware, what is one component that people often under-spec, causing performance issues later?
How can a business with little IT experience successfully use a dedicated server?
What's the real-world difference between a cheap dedicated server from a budget provider and a premium one?
What is one security practice that is essential for anyone managing a dedicated server?
For RAID, is RAID 10 always worth the extra cost over RAID 1 or RAID 5?
What are some signs that a business has outgrown its current hosting and needs to move to a dedicated server?
Beyond the hardware, what managed service from a provider adds the most value to a dedicated hosting plan?
### Sign Language Recognition Using Machine Learning on Ubuntu 24.04 GPU Server
Sign language is a vital means of communication for millions of people in the deaf and hard-of-hearing communities. However, the language barrier between sign language users and non-signers can create significant communication challenges. To bridge this gap, we can use machine learning techniques to automatically recognize hand gestures and translate them into readable text or speech.
In this tutorial, you’ll learn how to build a real-time American Sign Language (ASL) recognition system using machine learning.
Prerequisites
An Ubuntu 24.04 server with an NVIDIA GPU.
A non-root user or a user with sudo privileges.
NVIDIA drivers are installed on your server.
Step 1: Set Up Python Environment
First, ensure that Python 3 and related tools are installed on your system.
apt update -y
apt install -y python3 python3-pip python3-venv
Create a Python virtual environment.
python3 -m venv asl-ml-env
source asl-ml-env/bin/activate
Next, upgrade pip and install all required Python libraries.
pip install --upgrade pip
pip install kaggle tensorflow opencv-python matplotlib scikit-learn flask
Here’s a brief description of what we’re installing:
tensorflow: Core library for building and training our CNN model.
opencv-python: For handling images and capturing webcam input.
matplotlib: For plotting training metrics.
scikit-learn: For additional utilities if needed.
flask: A Lightweight web framework for creating web interfaces.
kaggle: CLI tool for downloading datasets from Kaggle.
Step 2: Download ASL Alphabet Dataset from Kaggle
You’ll need your Kaggle API key for this step.
1. Go to your Kaggle account settings.
2. Create and download an API token (a kaggle.json file).
3. Place kaggle.json in ~/.kaggle/.
4. Download the ASL dataset.
kaggle datasets download -d grassknoted/asl-alphabet
5. Unzip the downloaded dataset.
unzip asl-alphabet.zip
The dataset folder asl_alphabet_train will contain images for training and validation.
Step 3: Model Development
Now that our environment is ready and the dataset is downloaded, it’s time to build, train, and save the machine learning model that will recognize American Sign Language (ASL) letters from images.
1. Let’s create a Python script to define and train the CNN model.
nano train_model.py
Add the following code:
import os
import tensorflow as tf
from tensorflow.keras.preprocessing.image import ImageDataGenerator
from tensorflow.keras import layers, models
import matplotlib.pyplot as plt
# Dataset directory path
DATA_DIR = "asl_alphabet_train/asl_alphabet_train"
# Parameters
IMG_HEIGHT, IMG_WIDTH = 64, 64
BATCH_SIZE = 32
EPOCHS = 10
# Data augmentation and preprocessing
datagen = ImageDataGenerator(
rescale=1./255,
validation_split=0.2
)
train_generator = datagen.flow_from_directory(
DATA_DIR,
target_size=(IMG_HEIGHT, IMG_WIDTH),
batch_size=BATCH_SIZE,
class_mode='categorical',
subset='training'
)
val_generator = datagen.flow_from_directory(
DATA_DIR,
target_size=(IMG_HEIGHT, IMG_WIDTH),
batch_size=BATCH_SIZE,
class_mode='categorical',
subset='validation'
)
# CNN model architecture
model = models.Sequential([
layers.Conv2D(32, (3, 3), activation='relu', input_shape=(IMG_HEIGHT, IMG_WIDTH, 3)),
layers.MaxPooling2D((2, 2)),
layers.Conv2D(64, (3, 3), activation='relu'),
layers.MaxPooling2D((2, 2)),
layers.Conv2D(128, (3, 3), activation='relu'),
layers.MaxPooling2D((2, 2)),
layers.Flatten(),
layers.Dense(128, activation='relu'),
layers.Dense(len(train_generator.class_indices), activation='softmax')
])
# Compile model
model.compile(optimizer='adam',
loss='categorical_crossentropy',
metrics=['accuracy'])
# Train the model
history = model.fit(
train_generator,
validation_data=val_generator,
epochs=EPOCHS
)
# Save the trained model
model.save("asl_sign_model.h5")
2. Run the script to start training.
python3 train_model.py
This will take a few minutes, depending on your GPU. After training completes. The model will be saved as asl_sign_model.h5
Step 4: Model Evaluation
After training the model, it’s essential to evaluate its performance to ensure that it generalizes well to unseen data. In this section, we’ll test the saved model on the validation dataset and display key metrics, such as validation loss and accuracy.
1. Let’s create a new script to load the trained model and run evaluation.
nano evaluate_model.py
Add the following code:
import tensorflow as tf
from tensorflow.keras.models import load_model
from tensorflow.keras.preprocessing.image import ImageDataGenerator
# Load trained model
model = load_model('asl_sign_model.h5')
# Dataset directory
DATA_DIR = "asl_alphabet_train"
# Parameters
IMG_HEIGHT, IMG_WIDTH = 64, 64
BATCH_SIZE = 32
# Prepare test/validation dataset again
datagen = ImageDataGenerator(rescale=1./255, validation_split=0.2)
val_generator = datagen.flow_from_directory(
DATA_DIR,
target_size=(IMG_HEIGHT, IMG_WIDTH),
batch_size=BATCH_SIZE,
class_mode='categorical',
subset='validation'
)
# Evaluate on validation dataset
loss, accuracy = model.evaluate(val_generator)
print(f"Validation Loss: {loss:.4f}")
print(f"Validation Accuracy: {accuracy:.4f}")
2. Run the evaluation script.
python3 evaluate_model.py
Example output might look like this:
Validation Loss: 2.2038
Validation Accuracy: 0.7276
This means our model achieves ~72% accuracy on validation data after just 10 epochs, which is a promising result for a basic implementation.
Step 5: Web Application Development
Now that we have a trained model ready, it’s time to build a web application that allows users to interact with the model in real-time via their webcam. We’ll use Flask as the backend framework and HTML/JavaScript for the frontend to display webcam video and show predictions.
1. First, set up the necessary files and folders for our web app.
mkdir templates
2. Create the HTML frontend.
nano templates/index.html
Add the below code:
ASL Recognition Web App
ASL Sign Language Recognition
Prediction: ...
Explanation:
Captures webcam video
Every second, takes a snapshot from the video feed
Sends the snapshot to our Flask backend for prediction
Displays the prediction result below the video
2. Now create the Flask application that serves the HTML page and handles prediction requests.
nano app.py
Add the following code.
import base64
import io
import numpy as np
from PIL import Image
from flask import Flask, render_template, request, jsonify
from tensorflow.keras.models import load_model
from tensorflow.keras.preprocessing.image import img_to_array
# Load model
model = load_model('asl_sign_model.h5')
# Define parameters
IMG_HEIGHT, IMG_WIDTH = 64, 64
# Initialize Flask app
app = Flask(__name__)
# Labels map from training
class_labels = list('ABCDEFGHIJKLMNOPQRSTUVWXYZ') + ['del', 'nothing', 'space']
@app.route('/')
def index():
return render_template('index.html')
@app.route('/predict', methods=['POST'])
def predict():
data = request.get_json()
if 'image' not in data:
return jsonify({'error': 'No image data'}), 400
image_data = data['image'].split(',')[1]
image_bytes = base64.b64decode(image_data)
image = Image.open(io.BytesIO(image_bytes)).convert('RGB')
image = image.resize((IMG_WIDTH, IMG_HEIGHT))
img_array = img_to_array(image) / 255.0
img_array = np.expand_dims(img_array, axis=0)
preds = model.predict(img_array)
predicted_class = np.argmax(preds[0])
predicted_label = class_labels[predicted_class]
return jsonify({'prediction': predicted_label})
if __name__ == '__main__':
app.run(host='0.0.0.0', port=5000, debug=True)
The above code accepts image data from the browser, preprocesses it, predicts the gesture, and sends back the prediction as JSON.
Step 6: Running the Web App
1. Now that we have built the Flask backend and front-end interface, let’s run the application and test the real-time sign language recognition system.
python3 app.py
This will start the Flask server on port 5000, and you should see output like:
* Running on http://0.0.0.0:5000/ (Press CTRL+C to quit)
* Restarting with stat
2. If you’re running this on a remote server, use SSH port forwarding so you can access it locally.
ssh -N -f -L 5000:localhost:5000 root@your-server-ip
3. Open your web browser and access the Flask App using the URL http://localhost:5000.
4. The browser will prompt you for camera access permission. Click “Allow” to let the app use your webcam.
5. Once the webcam feed is running, choose one of the ASL signs, such as the letters A, B, or C, from the image below.
6. Hold your hand steady and clearly within the webcam’s field of view.
7. The app will capture frames every 1 second and send them to the backend for prediction. The predicted letter or gesture will appear in real-time below the video feed.
Conclusion
In this tutorial, you built a real-time American Sign Language (ASL) recognition system using machine learning on an Ubuntu 24.04 GPU server. You set up the development environment, downloaded and prepared the ASL Alphabet dataset from Kaggle, and built a Convolutional Neural Network (CNN) that classifies American Sign Language (ASL) hand gestures. After training and evaluating the model, you integrated it into a Flask web application that allows real-time interaction using a webcam.
### Importance of SOC Type 2, HIPAA, and GDPR Compliance in Website Accessibility
Ensuring a website’s accessibility not only refers to its conformance level with Web Content Accessibility Guidelines (WCAG) but also to safeguarding privacy, security, and the rights of each user. Every sector, including healthcare, finance, and SaaS, requires compliance with critical frameworks like SOC 2, HIPAA, and GDPR.
These standards play a vital role in making a website inclusive. Their implication for digital accessibility is important in order to provide a safe space from data theft.
So, when it comes to an inclusive digital environment, SOC 2, HIPAA, and GDPR compliance are equally crucial as WCAG.
Read along to know more about these three crucial facets of digital compliance.
Understanding These Compliance Frameworks
What is SOC 2 and SOC Type 2?
SOC 2 (System and Organization Controls 2) is a framework developed by the American Institute of CPAs (AICPA). It evaluates how well a service provider manages customer data based on five Trust Services Criteria: security, availability, processing integrity, confidentiality, and privacy.
SOC Type 2 specifically assesses the operational effectiveness of a company’s systems over a period (typically 3-12 months), making it highly relevant for SaaS platforms and cloud-based service providers.
What is HIPAA?
The Health Insurance Portability and Accountability Act (HIPAA) regulates how healthcare providers, insurers, and their business associates handle Protected Health Information (PHI). It requires safe data storage, user authentication, encryption, and breach notification.
HIPAA also necessitates that the digital systems – including websites and patient portals – are accessible to users with disabilities.
What is GDPR?
The General Data Protection Regulation (GDPR) governs data protection and privacy for individuals in the European Union. It mandates explicit consent for data processing, the right to access and delete personal data, and robust data protection measures.
For accessible websites, GDPR means ensuring that privacy controls are usable by everyone, including those using screen readers or alternative navigation tools.
The Link Between Compliance and Accessibility
Accessibility and data privacy go hand-in-hand
An accessible website must also be a secure and private environment for every user. For instance, visually impaired users may use screen readers that read out sensitive data – like account numbers or health records. If privacy measures are poorly implemented, such sensitive information could be inadvertently exposed in public or unsafe environments. (Best practice: auto-reading can be paused if not required).
Trust and user confidence
If a user with a disability tries to book a doctor’s appointment online, they need a safe, accessible website. Inaccessible environments make them feel insecure and they might end-up not completing their task.
On the other hand, a secure and accessible platform builds trust, encouraging engagement and repeat visits – especially when sensitive information is involved.
Inclusive design meets secure design
SOC 2 and GDPR both emphasize the importance of secure architecture and user control. These principles naturally align with accessible design. For example, GDPR requires that cookie consent pop-ups are understandable and operable. When accessibility is part of security planning, the result is a more resilient and user-friendly system.
Role of third-party accessibility tools
Many organizations turn to third-party accessibility solutions to support compliance and enhance user experiences. These tools – such as accessibility overlays, AI-driven screen reader support, automated testing tools, and real-time remediation widgets – can offer quick solutions and help identify gaps.
However, while these tools are useful, they ought to also comply with data protection and security standards. For example:
A widget that gathers user interactions must follow GDPR consent requirements.
Any tool handling form validation or login data must meet SOC Type 2 security controls.
In healthcare, integrations must be HIPAA-compliant if they process or store PHI.
Organizations should carefully vet third-party vendors for both accessibility performance and compliance alignment.
Benefits of Aligning Website Accessibility with Compliance Standards
When accessibility and compliance are approached together, organizations unlock a range of strategic, operational, and reputational advantages:
Stronger legal protection
Meeting both accessibility and regulatory standards significantly lowers the risk of legal penalties, complaints, or lawsuits. It demonstrates a proactive stance toward inclusivity and user rights.
Wider market reach
Accessibility opens a website to a broader audience, including people with disabilities and elderly users. When layered with GDPR and HIPAA compliance, organizations can confidently serve international and healthcare-sensitive markets.
Improved SEO and performance
Accessible websites generally have cleaner code, faster load times, and structured content, which align with SEO best practices. Security and privacy enhancements from compliance also contribute to better system performance and uptime (SOC 2 benefit).
Cost-efficiency through unified strategy
By building security, privacy, and usability into the development process from the start, organizations save money on retrofits, fines, and patchwork fixes.
Consequences of Non-Compliance
Legal and financial repercussions
HIPAA violations can lead to fines up to $1.5 million per year per violation category.
GDPR fines can go up to €20 million or 4% of global turnover, whichever is higher.
(Source: Non-compliance - 8 regulations have high penalties?)
SOC 2 audit failure may not result in fines but can destroy customer trust and lead to loss of enterprise contracts.
If a site is both inaccessible and non-compliant, it is exposed to dual risks: legal action and user abandonment.
Damage to brand reputation
Companies that fail to provide secure and accessible digital experiences may encounter backlash, especially from advocacy groups and consumers on social media. Lawsuits and news coverage can quickly erode years of brand equity.
Best Practices to Achieve Accessibility and Compliance!
Conducting regular audits
Perform automated manual accessibility audits alongside compliance assessments. Look for overlaps - such as how authentication systems or data forms function for assistive tech users.
Choosing the right tools and vendors
Work with vendors that prioritize privacy, security, and accessibility. Whether it’s a CMS, analytics provider, or payment processor, ensure their tools meet SOC 2, HIPAA, and GDPR requirements and are accessible.
Invest in training and governance
Train teams – especially developers and content creators – on the intersections of accessibility and compliance. Maintain clear internal policies that include both accessibility checklists and data privacy/security requirements.
Transparency through privacy policies and statements
Include accessibility statements, privacy policies, and terms of use that clearly articulate the compliance efforts of organizations. Make sure these documents are easy to read and accessible.
Wrapping up
Accessibility is a continuous effort toward inclusion, privacy, and trust. Frameworks like SOC Type 2, HIPAA, and GDPR provide the foundation for secure and ethical digital experiences – but without accessibility, their reach remains limited.
By treating compliance and accessibility as complementary goals, organizations can build digital platforms that not only meet legal standards but also empower every user – regardless of their abilities.
Make compliance inclusive and accessibility secure. That’s the future of digital trust!
This thought leadership article was contributed by Skynet Technologies.
Skynet Technologies is a worldwide leader in digital accessibility compliance solution. Skynet Technologies offers an WCAG, ADA, European Accessibility Act.(EAA) accessibility widget - All in One Accessibility®, which supports HIPAA, and GDPR compliant, and They are SOC Type 2 compliant.
### Fake News Detection Using Machine Learning on Ubuntu 24.04 GPU Server
Fake news has become a major challenge in today’s digital age, where false information spreads quickly across social media and online platforms. With the growing influence of news on public opinion, it’s essential to detect and stop misinformation before it goes viral.
Traditional methods for manually verifying news are no longer practical due to the sheer volume of content published daily. This is where Machine Learning (ML) plays a critical role — by automatically analyzing patterns in news articles to classify them as real or fake based on their content.
In this guide, we will show you how to build a Fake News Detection system using Machine Learning on an Ubuntu 24.04 GPU server.
Prerequisites
An Ubuntu 24.04 server with an NVIDIA GPU.
A non-root user or a user with sudo privileges.
NVIDIA drivers are installed on your server.
Step 1: Set up Python Environment
First, update your system and install Python 3 along with essential tools.
apt update -y
apt install -y python3 python3-pip python3-venv build-essential
2. Create and activate a virtual environment.
python3 -m venv fakenews-venv
source fakenews-venv/bin/activate
3. Now, install all required Python packages using pip.
pip install numpy pandas scikit-learn flask
4. We also install PyTorch libraries, which are not directly used in this project but can enable GPU acceleration for future improvements.
pip install torch torchvision
5. We’ll use the Kaggle CLI tool to download the dataset directly from Kaggle.
pip install kaggle
Step 2: Download and Prepare the Dataset
Now that your environment is ready, we’ll download the dataset and prepare it for model training.
1. Go to your Kaggle account settings.
2. Create and download an API token (a kaggle.json file).
3. Place kaggle.json in ~/.kaggle/.
4. Download the dataset from Kaggle.
kaggle datasets download -d emineyetm/fake-news-detection-datasets
5. Once the download completes, unzip the dataset.
unzip fake-news-detection-datasets.zip
6. You should see a folder called News _dataset containing two CSV files.
ls News\ _dataset/
Output.
Fake.csv True.csv
7. Let’s move the dataset files into the current working directory for convenience.
mv News\ _dataset/*.csv .
Step 3: Prepare and Train Data
In this section, we’ll prepare the dataset and train a machine learning model to classify news as real or fake.
1. Create a Python script.
nano prepare_and_train_data.py
Add the following code.
import pandas as pd
import re
from sklearn.model_selection import train_test_split
from sklearn.feature_extraction.text import TfidfVectorizer
# Step 1: Load and label data
fake = pd.read_csv('Fake.csv')
true = pd.read_csv('True.csv')
fake['label'] = 0
true['label'] = 1
data = pd.concat([fake, true]).sample(frac=1).reset_index(drop=True)
# Step 2: Preprocess text
def clean_text(text):
text = re.sub(r'[^a-zA-Z ]', '', text)
text = text.lower()
return text
data['text'] = data['title'] + " " + data['text']
data['text'] = data['text'].apply(clean_text)
# Step 3: Feature extraction
X = data['text']
y = data['label']
X_train, X_test, y_train, y_test = train_test_split(
X, y, test_size=0.2, random_state=42
)
vectorizer = TfidfVectorizer(stop_words='english', max_df=0.7)
X_train_tfidf = vectorizer.fit_transform(X_train)
X_test_tfidf = vectorizer.transform(X_test)
# Step 4: Train model
from sklearn.linear_model import LogisticRegression
from sklearn.metrics import accuracy_score, classification_report
# Train the Logistic Regression model
model = LogisticRegression(max_iter=1000)
model.fit(X_train_tfidf, y_train)
# Make predictions on the test set
y_pred = model.predict(X_test_tfidf)
# Print accuracy and a classification report
print("Accuracy:", accuracy_score(y_test, y_pred))
print("Classification report:\n", classification_report(y_test, y_pred))
# Step 5: Save the model
import joblib
# Save the trained model
joblib.dump(model, 'fakenews_model.pkl')
# Save the TF-IDF vectorizer
joblib.dump(vectorizer, 'tfidf_vectorizer.pkl')
print("Model and vectorizer saved successfully!")
This script loads and cleans fake and genuine news data, converts the text into numerical features using TF-IDF, and splits it into training and test sets. It trains a Logistic Regression model to classify news as fake or true, evaluates its performance, and saves both the trained model and vectorizer for future use.
2. Run the script to train and save the model.
python3 prepare_and_train_data.py
Expected output.
Accuracy: 0.9867483296213808
Classification report:
precision recall f1-score support
0 0.99 0.99 0.99 4705
1 0.99 0.99 0.99 4275
accuracy 0.99 8980
macro avg 0.99 0.99 0.99 8980
weighted avg 0.99 0.99 0.99 8980
Model and vectorizer saved successfully!
Step 4: Build Flask Web Application
Now that we have a trained model and vectorizer saved (fakenews_model.pkl and tfidf_vectorizer.pkl), we can build a simple web app using Flask, allowing users to paste news text and receive an instant prediction.
1. Create the Flask app.
nano app.py
Add the following code:
from flask import Flask, render_template, request
import joblib
app = Flask(__name__)
model = joblib.load('fakenews_model.pkl')
vectorizer = joblib.load('tfidf_vectorizer.pkl')
@app.route('/', methods=['GET', 'POST'])
def index():
prediction = None
if request.method == 'POST':
user_text = request.form['news']
user_text_clean = user_text.lower()
user_features = vectorizer.transform([user_text_clean])
pred = model.predict(user_features)[0]
prediction = 'Real News' if pred == 1 else 'Fake News'
return render_template('index.html', prediction=prediction)
if __name__ == '__main__':
app.run(host='0.0.0.0', port=5000, debug=True)
This script:
Initializes the Flask app.
Loads the saved model and vectorizer.
Handles both GET (show empty form) and POST (process user input) requests.
Displays the prediction back to the user.
2. Create a directory for templates.
mkdir templates
3. Create the file index.html for the web interface.
nano templates/index.html
Add the following HTML code:
Fake News Detector
Fake News Detection Web App
{% if prediction %}
Prediction: {{ prediction }}
{% endif %}
Step 5: Run Flask Application
Now that both the backend (app.py) and frontend (index.html) are ready, let’s run the Flask app so it can serve predictions from your trained model.
1. Start the Flask server.
python3 app.py
Output.
* Serving Flask app 'app'
* Debug mode: on
WARNING: This is a development server. Do not use it in a production deployment. Use a production WSGI server instead.
* Running on all addresses (0.0.0.0)
* Running on http://127.0.0.1:5000
* Running on http://149.28.70.3:5000
Press CTRL+C to quit
* Restarting with stat
* Debugger is active!
* Debugger PIN: 212-816-210
2. Open your web browser and access the Flask app using the URL http://your-server-ip:5000. You should see a simple page titled 'Fake News Detection Web App' with a text area and a 'Detect' button.
3. Copy a news article headline or snippet from any online news source. Paste it into the textarea and click the Detect button. The app will process your input, run it through the trained model, and return one of the following results.
Conclusion
In this guide, you built a fake news detection system using machine learning on an Ubuntu 24.04 GPU server. You trained a model, deployed it with Flask, and created a simple web interface for real-time predictions. This project provides a practical foundation for exploring text classification and machine learning deployment. You can now enhance the app further or share it with others for testing and feedback.
### Cryptocurrency Price Prediction with Machine Learning on Ubuntu 24.04 GPU Server
Predicting cryptocurrency prices has become a popular application of machine learning. Crypto markets, such as Bitcoin (BTC) and Ethereum (ETH), are renowned for their volatility, and many developers and researchers are utilizing machine learning models to analyze historical price data and predict future trends.
In this guide, you’ll learn how to build a cryptocurrency price prediction system using machine learning and deploy it on an Ubuntu 24.04 GPU server. We'll use Python and popular libraries like TensorFlow, scikit-learn, and Flask to develop and serve our prediction model.
Prerequisites
An Ubuntu 24.04 server with an NVIDIA GPU.
A non-root user or a user with sudo privileges.
NVIDIA drivers are installed on your server.
Step 1: Install Required Packages
Before we can start building and training our cryptocurrency price prediction model, we need to set up the development environment on your Ubuntu 24.04 GPU server.
1. First, make sure your system is up to date and install essential packages.
apt update -y
apt install -y python3 python3-pip python3-venv git build-essential
2. It’s a good practice to isolate your project’s dependencies using a virtual environment.
python3 -m venv crypto-predict-env
source crypto-predict-env/bin/activate
3. Next, upgrade pip and install all the Python libraries required for this project.
pip install --upgrade pip
pip install flask tensorflow pandas numpy yfinance scikit-learn
Here’s what these packages are used for:
Flask: For building the web application.
TensorFlow: For training and running our LSTM neural network.
pandas & numpy: For handling and processing data.
yfinance: To fetch cryptocurrency price data from Yahoo Finance.
scikit-learn: For scaling and preparing the data.
Step 2: Train the Machine Learning Model
Now that your environment is set up, it’s time to build and train the machine learning model that will predict cryptocurrency prices.
In this project, we’ll use an LSTM (Long Short-Term Memory) neural network, which is well-suited for time-series prediction tasks like price forecasting.
1. Create a Python script called train_model.py to handle downloading data, preprocessing, building the model, and training it.
nano train_model.py
Add the below code:
# train_model.py
import yfinance as yf
import numpy as np
from sklearn.preprocessing import MinMaxScaler
from tensorflow.keras.models import Sequential
from tensorflow.keras.layers import LSTM, Dense
# Download BTC-USD historical data
data = yf.download('BTC-USD', start='2020-01-01', end='2025-01-01')
dataset = data['Close'].values.reshape(-1, 1)
# Normalize prices
scaler = MinMaxScaler()
scaled_data = scaler.fit_transform(dataset)
# Prepare training sequences
seq_length = 60
X_train, y_train = [], []
for i in range(seq_length, len(scaled_data)):
X_train.append(scaled_data[i-seq_length:i, 0])
y_train.append(scaled_data[i, 0])
X_train, y_train = np.array(X_train), np.array(y_train)
X_train = X_train.reshape((X_train.shape[0], X_train.shape[1], 1))
# Build LSTM model
model = Sequential([
LSTM(50, return_sequences=True, input_shape=(X_train.shape[1], 1)),
LSTM(50),
Dense(25),
Dense(1)
])
model.compile(optimizer='adam', loss='mean_squared_error')
# Train the model
model.fit(X_train, y_train, epochs=10, batch_size=32)
# Save the model
import os
os.makedirs('model', exist_ok=True)
model.save('model/crypto_model.h5')
print("✅ Model trained and saved at 'model/crypto_model.h5'")
2. After saving the file, run the script to start the training process.
python3 train_model.py
During training, you’ll see progress output showing loss values for each epoch. Once training is done, the model will be saved in a folder called model as crypto_model.h5.
Step 3: Build Flask Web Application for Predictions
After training and saving our model, we’ll now create a Flask web application. This app will allow users to enter a cryptocurrency symbol (e.g., BTC-USD or ETH-USD), and it will fetch recent price data, load the trained model, and display a predicted next price.
1. Create the Flask app script.
nano app.py
Add the following code.
# app.py
from flask import Flask, request, render_template
import numpy as np
import pandas as pd
import yfinance as yf
from sklearn.preprocessing import MinMaxScaler
from tensorflow.keras.models import load_model
app = Flask(__name__)
model = load_model('model/crypto_model.h5')
scaler = MinMaxScaler()
def prepare_data(symbol='BTC-USD', seq_length=60):
data = yf.download(symbol, period='90d', interval='1h')
close_prices = data['Close'].values.reshape(-1, 1)
scaled = scaler.fit_transform(close_prices)
X_input = scaled[-seq_length:]
X_input = X_input.reshape((1, seq_length, 1))
return X_input, close_prices[-1][0]
@app.route('/', methods=['GET', 'POST'])
def index():
prediction = None
last_price = None
symbol = "BTC-USD"
if request.method == 'POST':
symbol = request.form.get('symbol', 'BTC-USD')
try:
X_input, last_price = prepare_data(symbol)
pred_scaled = model.predict(X_input)
pred_price = scaler.inverse_transform(pred_scaled)[0][0]
prediction = round(pred_price, 2)
except Exception as e:
prediction = f"Error: {str(e)}"
return render_template('index.html', prediction=prediction, symbol=symbol, last_price=last_price)
if __name__ == '__main__':
app.run(host='0.0.0.0', port=5000)
The above script:
Loads your trained model (crypto_model.h5).
Fetches the most recent 90 days of price data.
Normalizes it so the model can use it for prediction.
Handles form submissions to let the user enter any cryptocurrency symbol.
Displays prediction results using an HTML template.
2. Prepare templates directory.
mkdir templates
3. Create the index.html template.
nano templates/index.html
Add the following code.
Crypto Price Prediction
{% if prediction %}
Prediction Result:
Symbol: {{ symbol }}
Last Close Price: {{ last_price }}
Predicted Next Price: {{ prediction }}
{% endif %}
Step 4: Run the Web Application
Now it’s time to run the application and access it from your browser.
1. Run this command in your terminal to launch the Flask server.
python3 app.py
Output.
* Running on all addresses (0.0.0.0)
* Running on http://127.0.0.1:5000
* Running on http://149.28.70.3:5000
INFO:werkzeug:Press CTRL+C to quit
2. Open your web browser and access the Flask web app using the URL http://your-server-ip:5000.
3. Enter a cryptocurrency symbol (like BTC-USD or ETH-USD). Click the Predict button. The app fetches recent price data automatically using yfinance.
Conclusion
In this guide, you built a cryptocurrency price prediction web application from scratch using machine learning on an Ubuntu 24.04 GPU server. You installed all the necessary tools, trained an LSTM neural network on historical Bitcoin data, and deployed a Flask-based web interface to make predictions accessible directly in a web browser.
### Fraction Problem Solving Using Machine Learning on Ubuntu 24.04 Cloud GPU Server
Fractions are a fundamental part of mathematics education and have practical applications in fields such as engineering, finance, and data analysis. However, automating fraction arithmetic is a non-trivial task, especially when the input is expressed as human-readable text (e.g., "1/2 + 1/3").
Traditionally, such problems are solved using rule-based algorithms that parse and compute exact answers. But what if we could teach a machine learning (ML) model to understand and solve these problems by learning patterns from examples? This approach not only offers opportunities for innovation but also opens the door to interactive educational tools, AI tutors, and intelligent calculators.
In this project, we’ll walk through building a fraction problem solver using machine learning on an Ubuntu 24.04 cloud GPU server.
Prerequisites
An Ubuntu 24.04 server with an NVIDIA GPU.
A non-root user or a user with sudo privileges.
NVIDIA drivers are installed on your server.
Step 1: Set up Python Environment
Before we start generating datasets or training models, we need a clean and isolated Python environment with the required libraries.
1. Install core dependencies.
apt install -y python3 python3-pip python3-venv
2. Create a virtual environment.
python3 -m venv ml-fraction-env
3. Activate the environment to make sure all Python libraries are installed locally within it.
source ml-fraction-env/bin/activate
4. Upgrade pip and install all the libraries we’ll need for this project, including NumPy, pandas, TensorFlow, and Flask.
pip install --upgrade pip
pip install numpy pandas tensorflow flask
Step 2: Generate Dataset
To train a machine learning model that can "understand" and solve fraction problems, we need a large dataset containing fraction expressions and their correct solutions. Instead of manually collecting data, we can generate synthetic data programmatically.
1. Write a Python script (generate_dataset.py) that automatically generates random fraction problems using basic arithmetic operators (+, −, ×, ÷) and computes their exact solutions.
nano generate_dataset.py
Add the following code.
import random
from fractions import Fraction
import pandas as pd
def random_fraction():
numerator = random.randint(1, 10)
denominator = random.randint(1, 10)
return Fraction(numerator, denominator)
def generate_problem():
ops = ['+', '-', '*', '/']
a = random_fraction()
b = random_fraction()
op = random.choice(ops)
problem = f"{a} {op} {b}"
try:
if op == '+':
solution = a + b
elif op == '-':
solution = a - b
elif op == '*':
solution = a * b
elif op == '/':
solution = a / b if b != 0 else 'undefined'
except:
solution = 'undefined'
return problem, str(solution)
# Generate 100,000 records
data = [generate_problem() for _ in range(100000)]
df = pd.DataFrame(data, columns=['problem', 'solution'])
df.to_csv('fraction_dataset.csv', index=False)
print("✅ Dataset saved to fraction_dataset.csv")
2. Run the script to generate and save the dataset.
python3 generate_dataset.py
After execution, you should see the confirmation.
✅ Dataset saved to fraction_dataset.csv
Step 3: Model Architecture & Training
With our dataset ready, the next step is to train a machine learning model that can learn to solve fraction problems by predicting the correct result when given an expression.
1. Create a script to train the model.
nano train_model.py
Add the following code.
import pandas as pd
import numpy as np
from tensorflow.keras.preprocessing.text import Tokenizer
from tensorflow.keras.preprocessing.sequence import pad_sequences
from tensorflow.keras.models import Sequential
from tensorflow.keras.layers import Embedding, LSTM, Dense, TimeDistributed
from tensorflow.keras.callbacks import EarlyStopping, ModelCheckpoint
import pickle
# Load dataset
df = pd.read_csv('fraction_dataset.csv')
# Tokenizer (character-level)
tokenizer = Tokenizer(char_level=True)
tokenizer.fit_on_texts(df['problem'].tolist() + df['solution'].tolist())
vocab_size = len(tokenizer.word_index) + 1
# Convert to sequences
X_seq = tokenizer.texts_to_sequences(df['problem'].tolist())
y_seq = tokenizer.texts_to_sequences(df['solution'].tolist())
# Pad sequences
max_len = 20
X = pad_sequences(X_seq, maxlen=max_len, padding='post')
y = pad_sequences(y_seq, maxlen=max_len, padding='post')
# 📝 Reshape y for categorical output at each timestep
y = np.expand_dims(y, -1)
# Define correct sequence-to-sequence model
model = Sequential([
Embedding(input_dim=vocab_size, output_dim=64, input_length=max_len),
LSTM(128, return_sequences=True), # 🔥 Important change here!
TimeDistributed(Dense(vocab_size, activation='softmax')) # 🔥 Predict vocab distribution at each timestep
])
model.compile(optimizer='adam', loss='sparse_categorical_crossentropy', metrics=['accuracy'])
# Callbacks
early_stop = EarlyStopping(monitor='val_loss', patience=5, restore_best_weights=True)
checkpoint = ModelCheckpoint('best_fraction_solver_model.h5', save_best_only=True)
# 🚀 Train for 30 epochs
history = model.fit(
X, y,
epochs=30,
batch_size=64,
validation_split=0.1,
callbacks=[early_stop, checkpoint]
)
# Save tokenizer for inference
with open('tokenizer.pkl', 'wb') as f:
pickle.dump(tokenizer, f)
print("✅ Training complete. Best model saved as best_fraction_solver_model.h5")
This script trains a character-level LSTM model to predict solutions for fraction problems. It tokenizes and pads input-output text, then uses a TimeDistributed layer for character prediction. The trained model and tokenizer are saved for later use.
2. Run the script.
python3 train_model.py
Output.
✅ Training complete. Best model saved as best_fraction_solver_model.h5
Step 4: Building the Flask Web Interface
After training our machine learning model, we aim to provide a straightforward way for users to input fraction problems and receive solutions through a simple web interface. Flask is a lightweight web framework that makes this straightforward.
1. Create the Flask application script.
nano app.py
Add the following code.
from flask import Flask, request, render_template_string
from fractions import Fraction
import re
app = Flask(__name__)
TEMPLATE = '''
Hybrid Fraction Solver
Fraction Problem Solver (Hybrid: ML UI + Exact Backend)
{% if solution %}
Solution: {{ solution }}
{% endif %}
'''
def solve_fraction_expression(expr):
# Basic sanitization: remove spaces
expr = expr.replace(' ', '')
# Regex to extract operands and operator
pattern = r'(\d+/\d+)([\+\-\*/])(\d+/\d+)'
match = re.match(pattern, expr)
if not match:
return "Invalid input format"
frac1, op, frac2 = match.groups()
try:
f1 = Fraction(frac1)
f2 = Fraction(frac2)
if op == '+':
result = f1 + f2
elif op == '-':
result = f1 - f2
elif op == '*':
result = f1 * f2
elif op == '/':
if f2 == 0:
result = "undefined"
else:
result = f1 / f2
else:
result = "Invalid operator"
return str(result)
except Exception as e:
return f"Error: {str(e)}"
@app.route('/', methods=['GET', 'POST'])
def index():
solution = None
if request.method == 'POST':
problem = request.form['problem']
solution = solve_fraction_expression(problem)
return render_template_string(TEMPLATE, solution=solution)
if __name__ == '__main__':
app.run(host='0.0.0.0', port=5000)
2. Run the Flask application.
python3 app.py
Output.
* Running on all addresses (0.0.0.0)
* Running on http://127.0.0.1:5000
* Running on http://45.76.67.103:5000
Press CTRL+C to quit
Step 5: Access the Flask App
1. Open your web browser and access the Flask app using the URL http://your-server-ip:5000. You will be greeted with a simple but functional web form.
2. Enter a fraction problem (e.g., 3/4 + 4/7).
3. Click the Solve button.
4. The page will refresh and display the exact solution below the form.
Conclusion
In this article, we created a fraction problem solver by combining machine learning and traditional Python arithmetic, deployed on an Ubuntu 24.04 cloud GPU server. We generated a large dataset of fraction problems, trained a sequence-to-sequence model, and built a simple Flask web interface for user interaction. While the current version computes exact solutions on the backend, the system is ready for integration with the trained model for prediction-based solving.
### Machine Learning Pipeline for Malicious URL Detection on an Ubuntu 24.04 GPU server
Cybersecurity threats continue to grow, and malicious URLs have become one of the most common vectors for phishing, malware delivery, and other online attacks. Detecting these URLs manually or using traditional blacklists is often ineffective because attackers can easily generate new domains to evade detection.
This is where machine learning comes in. By learning patterns from known malicious and benign URLs, a machine learning model can generalize and classify previously unseen URLs more effectively than static rules or blocklists.
In this guide, we will build a comprehensive machine learning pipeline for detecting malicious URLs.
Prerequisites
An Ubuntu 24.04 server with an NVIDIA GPU.
A non-root user or a user with sudo privileges.
NVIDIA drivers are installed on your server.
Step 1: Set up Python Environment
Before we build and deploy our malicious URL detection pipeline, we need to set up a proper development environment on server.
1. Install required dependencies.
apt install -y python3 python3-pip python3-venv
2. Create a Python virtual environment.
python3 -m venv url-venv
source url-venv/bin/activate
3. Upgrade pip to the latest version.
pip install --upgrade pip
4. Install required Python packages.
pip3 install -U -q scikit-learn joblib seaborn colorama tld plotly whois wordcloud gensim nltk tldextract hmmlearn xgboost lightgbm catboost flask
Step 2: Download the Dataset
Now that our environment is ready, we need to get the dataset onto the server and prepare it for machine learning. The dataset we’ll use contains labeled malicious and benign URLs, and it’s available from Kaggle.
1. On your server, create a directory for the project.
mkdir /root/project
2. Next, download the dataset from Kaggle on your local machine.
3. Use scp (secure copy) to upload the dataset from your local machine to the server.
scp Downloads/malicious_phish.csv.zip root@your-server-ip:/root/project/
4. On the server, navigate to the project directory and unzip the dataset file.
cd /root/project
unzip malicious_phish.csv.zip
You should now see malicious_phish.csv in the /root/project directory.
Step 3: Model Training and Evaluation
With our dataset prepared, we are ready to train the machine learning model that will classify URLs as benign, phishing or malicious.
1. Create the training script.
nano malicious_url_detection.py
Add the following code:
import pandas as pd
import numpy as np
import hashlib
import re
import ipaddress
from urllib.parse import urlparse
import tldextract
from sklearn.model_selection import train_test_split, cross_val_score, cross_val_predict
from sklearn.pipeline import Pipeline
from sklearn.ensemble import ExtraTreesClassifier
from sklearn.metrics import accuracy_score, recall_score, precision_score, f1_score, classification_report
import joblib
# ----------------------
# Utility functions
# ----------------------
def get_url_length(url):
prefixes = ['http://', 'https://']
for prefix in prefixes:
if url.startswith(prefix):
url = url[len(prefix):]
url = url.replace('www.', '')
return len(url)
def count_letters(url): return sum(c.isalpha() for c in url)
def count_digits(url): return sum(c.isdigit() for c in url)
def count_special_chars(url): return sum(c in "!@#$%^&*()_+-=[]{};:,.<>/?`~|" for c in url)
def has_shortening_service(url):
pattern = re.compile(r'bit\.ly|goo\.gl|tinyurl|t\.co|ow\.ly|bitly|is\.gd|cutt\.ly')
return int(bool(pattern.search(url)))
def abnormal_url(url):
parsed = urlparse(url)
hostname = parsed.hostname
return int(bool(hostname and re.search(hostname, url)))
def secure_http(url):
return int(urlparse(url).scheme == 'https')
def have_ip_address(url):
try:
parsed = urlparse(url)
if parsed.hostname:
ip = ipaddress.ip_address(parsed.hostname)
return isinstance(ip, (ipaddress.IPv4Address, ipaddress.IPv6Address))
except ValueError:
return 0
return 0
def hash_encode(val):
return int(hashlib.md5(val.encode()).hexdigest(), 16) % (10 ** 8)
# ----------------------
# Load dataset
# ----------------------
data = pd.read_csv("malicious_phish.csv") # replace with your actual file path
print(f"Loaded dataset: {data.shape[0]} rows")
# ----------------------
# Label encoding
# ----------------------
label_mapping = {'benign': 0, 'defacement': 1, 'phishing': 2, 'malware': 3}
data['url_type'] = data['type'].map(label_mapping)
# ----------------------
# Feature engineering
# ----------------------
data['url_len'] = data['url'].apply(lambda x: get_url_length(str(x)))
data['letters_count'] = data['url'].apply(lambda x: count_letters(str(x)))
data['digits_count'] = data['url'].apply(lambda x: count_digits(str(x)))
data['special_chars_count'] = data['url'].apply(lambda x: count_special_chars(str(x)))
data['shortened'] = data['url'].apply(lambda x: has_shortening_service(str(x)))
data['abnormal_url'] = data['url'].apply(lambda x: abnormal_url(str(x)))
data['secure_http'] = data['url'].apply(lambda x: secure_http(str(x)))
data['have_ip'] = data['url'].apply(lambda x: have_ip_address(str(x)))
data['root_domain'] = data['url'].apply(lambda x: hash_encode(tldextract.extract(str(x)).domain))
data['url_region'] = data['url'].apply(lambda x: hash_encode(x.split('.')[-1]))
# ----------------------
# Prepare dataset for training
# ----------------------
feature_cols = [
'url_len', 'letters_count', 'digits_count', 'special_chars_count',
'shortened', 'abnormal_url', 'secure_http', 'have_ip',
'url_region', 'root_domain'
]
X = data[feature_cols]
y = data['url_type']
print(f"Feature matrix: {X.shape}")
print(f"Labels: {y.shape}")
# ----------------------
# Train-test split
# ----------------------
X_train, X_test, y_train, y_test = train_test_split(X, y, test_size=0.3, random_state=42)
# ----------------------
# Train model
# ----------------------
clf = Pipeline([('classifier', ExtraTreesClassifier(random_state=42))])
clf.fit(X_train, y_train)
# ----------------------
# Evaluate model
# ----------------------
y_pred = clf.predict(X_test)
print("\nClassification report on test set:")
print(classification_report(y_test, y_pred))
# ----------------------
# Save model
# ----------------------
joblib.dump(clf, "eTc.sav")
print("\n✅ Model saved as eTc.sav")
# ----------------------
# Save feature column order for consistency
# ----------------------
joblib.dump(feature_cols, "feature_order.sav")
print("✅ Feature order saved as feature_order.sav")
The above script:
Loads the dataset
Applies feature engineering
Splits the data into training and testing sets
Trains an ensemble classifier (ExtraTreesClassifier)
Evaluates model performance
Saves both the trained model and the feature order for later inference
2. Run the training script.
python3 malicious_url_detection.py
Output.
Classification report on test set:
precision recall f1-score support
0 0.95 0.98 0.96 128733
1 0.91 0.98 0.94 28692
2 0.87 0.68 0.77 28234
3 0.98 0.92 0.95 9699
accuracy 0.93 195358
macro avg 0.93 0.89 0.90 195358
weighted avg 0.93 0.93 0.93 195358
✅ Model saved as eTc.sav
✅ Feature order saved as feature_order.sav
This shows strong predictive performance overall, with a weighted average accuracy of around 93%.
Step 4: Build Flask App
Now that our malicious URL detection model is trained and saved, the next step is to make it accessible via a simple web interface. We’ll use Flask, a lightweight Python web framework, to deploy the model, allowing users to submit URLs and receive predictions in real-time.
1. Create an application file.
nano app.py
Add the following code.
from flask import Flask, render_template, request
import joblib
import numpy as np
import pandas as pd
import re
import hashlib
from urllib.parse import urlparse
import tldextract
import ipaddress
app = Flask(__name__)
# Load trained model and feature order
model = joblib.load('eTc.sav')
feature_cols = joblib.load('feature_order.sav')
class_mapping = {0: 'Benign', 1: 'Defacement', 2: 'Phishing', 3: 'Malware'}
TRUSTED_DOMAINS = ['google.com', 'youtube.com', 'facebook.com', 'github.com', 'amazon.com']
# Utility functions
def get_url_length(url):
prefixes = ['http://', 'https://']
for prefix in prefixes:
if url.startswith(prefix):
url = url[len(prefix):]
url = url.replace('www.', '')
return len(url)
def count_letters(url): return sum(c.isalpha() for c in url)
def count_digits(url): return sum(c.isdigit() for c in url)
def count_special_chars(url): return sum(c in "!@#$%^&*()_+-=[]{};:,.<>/?`~|" for c in url)
def has_shortening_service(url):
pattern = re.compile(r'bit\.ly|goo\.gl|tinyurl|t\.co|ow\.ly|bitly|is\.gd|cutt\.ly')
return int(bool(pattern.search(url)))
def abnormal_url(url):
parsed = urlparse(url)
hostname = parsed.hostname
return int(bool(hostname and re.search(hostname, url)))
def secure_http(url):
return int(urlparse(url).scheme == 'https')
def have_ip_address(url):
try:
parsed = urlparse(url)
if parsed.hostname:
ip = ipaddress.ip_address(parsed.hostname)
return isinstance(ip, (ipaddress.IPv4Address, ipaddress.IPv6Address))
except ValueError:
return 0
return 0
def hash_encode(val):
return int(hashlib.md5(val.encode()).hexdigest(), 16) % (10 ** 8)
def get_features(url):
url_len = get_url_length(url)
letters_count = count_letters(url)
digits_count = count_digits(url)
special_chars_count = count_special_chars(url)
shortened = has_shortening_service(url)
abnormal = abnormal_url(url)
secure_https = secure_http(url)
have_ip = have_ip_address(url)
root_domain = hash_encode(tldextract.extract(url).domain)
url_region = hash_encode(url.split('.')[-1])
return {
'url_len': url_len,
'letters_count': letters_count,
'digits_count': digits_count,
'special_chars_count': special_chars_count,
'shortened': shortened,
'abnormal_url': abnormal,
'secure_http': secure_https,
'have_ip': have_ip,
'url_region': url_region,
'root_domain': root_domain
}
@app.route('/', methods=['GET', 'POST'])
def index():
prediction = None
if request.method == 'POST':
url = request.form['url']
parsed_url = urlparse(url)
hostname = parsed_url.hostname or ''
if any(trusted in hostname.lower() for trusted in TRUSTED_DOMAINS):
prediction = 'Benign (trusted domain override)'
else:
feature_dict = get_features(url)
feature_values = [feature_dict[col] for col in feature_cols]
features_df = pd.DataFrame([feature_values], columns=feature_cols)
pred_idx = model.predict(features_df)[0]
prediction = class_mapping.get(pred_idx, 'Unknown')
return render_template('index.html', prediction=prediction)
if __name__ == '__main__':
app.run(host='0.0.0.0', port=5000, debug=True)
The above script does the following:
Loads the trained model (eTc.sav) and saved feature columns (feature_order.sav)
Accepts URL input from users via a web form
Extracts features from the input URL (using the same feature engineering logic as during training)
Returns the predicted classification (Benign, Defacement, Phishing, or Malware)
2. Create a templates directory and an index.html file that defines the user interface.
mkdir templates
nano templates/index.html
Add the following code.
Malicious URL Detector
🔒 Malicious URL Detector
{% if prediction %}
Prediction: {{ prediction }}
{% endif %}
Step 5: Run the Flask App and Access the Web UI
At this point, our Flask web application is ready to serve predictions using the trained malicious URL detection model. Let’s go over how to start the app and access it from your browser.
1. Start the Flask server with the following command.
python3 app.py
Output.
* Running on all addresses (0.0.0.0)
* Running on http://127.0.0.1:5000
* Running on http://149.28.70.3:5000
Press CTRL+C to quit
* Restarting with stat
* Debugger is active!
* Debugger PIN: 759-456-018
2. Open your web browser and access the Flask App using the URL http://your-server-ip:5000. You should see the “Malicious URL Detector” interface
3. Enter a suspicious-looking or synthetic malicious URL in the text box and click on Check URL. The app will analyze the URL, extract its features, classify it and show the response below the text box.
Conclusion
In this guide, we developed a comprehensive machine learning pipeline for detecting malicious URLs on an Ubuntu 24.04 GPU server. Starting from environment setup, we prepared the dataset, engineered meaningful features, and trained a robust classification model using ExtraTreesClassifier.
We then deployed the trained model as a user-friendly web application using Flask, allowing real-time predictions through a simple browser interface. Users can now submit any URL and immediately get a prediction: whether it is benign, defacement, phishing, or malware.
### Mobile Phone Price Prediction Using Machine Learning on Ubuntu 24.04 GPU Server
Predicting mobile phone prices is an interesting machine learning task with real-world applications, such as helping buyers, sellers, and e-commerce platforms estimate fair market value based on device specifications. Instead of manually comparing phone features and market rates, we can train a machine learning model to analyze patterns in the data and predict prices automatically.
In this guide, we’ll build a mobile phone price prediction system using Python, XGBoost, and Flask on an Ubuntu 24.04 GPU server.
Prerequisites
An Ubuntu 24.04 server with an NVIDIA GPU.
A non-root user or a user with sudo privileges.
NVIDIA drivers are installed on your server.
Step 1: Prepare the Server Environment
Before we can start building and deploying our mobile phone price prediction system, we need to set up a working Python environment on our Ubuntu 24.04 GPU server.
1. We’ll start by installing Python, pip, and essential build tools.
apt install -y python3 python3-pip python3-venv git build-essential
2. Create and activate a virtual environment.
python3 -m venv mobile-predict-env
source mobile-predict-env/bin/activate
3. It’s a good idea to make sure pip is updated before installing libraries.
pip install --upgrade pip
4. Finally, install all the Python libraries needed for this project, including Flask for the web server, pandas and numpy for data processing, scikit-learn and XGBoost for machine learning, and matplotlib and seaborn for visualization.
pip install flask pandas numpy matplotlib seaborn scikit-learn xgboost
Step 2: Download the Dataset
Now that your environment is ready, it’s time to get the dataset onto the server so we can train our machine learning model.
1. First, download the mobile dataset from Kaggle on your local machine.
2. Use scp to upload the dataset from your local machine to the server.
scp Downloads/mobile.csv root@your-server-ip:/root/
This will upload mobile.csv directly to the /root/ directory on your server.
Step 3: Build the Machine Learning Model
With the dataset now on your server, we can create a Python script that prepares the data, engineers useful features, and trains a machine learning model to predict mobile phone prices.
1. Create model.py.
nano model.py
Add the following code:
# model.py
import pandas as pd
import numpy as np
import re
from sklearn.model_selection import train_test_split
from sklearn.pipeline import Pipeline
from sklearn.preprocessing import OneHotEncoder, StandardScaler
from sklearn.compose import ColumnTransformer
from sklearn.impute import SimpleImputer
from sklearn.linear_model import LinearRegression
import xgboost as xgb
class PricePredictor:
def __init__(self, csv_path='mobile.csv'):
self.df = pd.read_csv(csv_path)
self.model = None
self.preprocessor = None
self.prepare_data()
self.train_model()
def prepare_data(self):
df = self.df
df.fillna('Unknown', inplace=True)
# Handle outliers for Spec Score
q1 = np.percentile(df['Spec Score'], 25)
q3 = np.percentile(df['Spec Score'], 75)
iqr = q3 - q1
lower_bound = q1 - 1.5 * iqr
df['Spec Score'] = np.where(df['Spec Score'] < lower_bound, lower_bound, df['Spec Score'])
# Feature engineering
df['Battery_mAh'] = df['battery'].apply(lambda x: self.extract_value(x, r'(\d+)\s*mAh'))
df['Display_Inches'] = df['display'].apply(lambda x: self.extract_value(x, r'(\d+\.?\d*)\s*(?:inch|inches|")'))
df['Camera_MP'] = df['camera'].apply(lambda x: self.extract_value(x, r'(\d+)\s*MP'))
df_storage = df['storage'].apply(self.extract_ram_rom)
df = pd.concat([df, df_storage], axis=1)
df['Processor_Brand'] = df['processor'].apply(self.extract_processor_brand)
df['Version_Main'] = df['version'].apply(self.extract_version_main)
# FIX: Replace inplace fillna with safe assignment
for col in ['Battery_mAh', 'Display_Inches', 'Camera_MP', 'RAM_GB', 'Internal_Storage_GB']:
df[col] = df[col].fillna(0)
self.df = df
self.numerical_features = ['Spec Score', 'rating', 'Battery_mAh', 'Display_Inches', 'Camera_MP', 'RAM_GB', 'Internal_Storage_GB']
self.cat_features = ['tag', 'sim', 'memoryExternal', 'Processor_Brand', 'Version_Main']
self.target = 'price'
def extract_value(self, text, pattern):
match = re.search(pattern, text, re.IGNORECASE)
return float(match.group(1)) if match else np.nan
def extract_ram_rom(self, text):
text = str(text).lower()
ram, rom = np.nan, np.nan
ram_match = re.search(r'(\d+)\s*gb\s*ram', text)
if ram_match:
ram = int(ram_match.group(1))
rom_match = re.search(r'(\d+)\s*gb\s*(inbuilt|storage)?', text)
if rom_match:
rom = int(rom_match.group(1))
return pd.Series({'RAM_GB': ram, 'Internal_Storage_GB': rom})
def extract_processor_brand(self, text):
text = str(text).lower()
if 'snapdragon' in text: return 'Snapdragon'
elif 'dimensity' in text: return 'Dimensity'
elif 'helio' in text: return 'Helio'
elif 'exynos' in text: return 'Exynos'
elif 'a series' in text or 'apple' in text: return 'Apple A Series'
elif 'kirin' in text: return 'Kirin'
elif 'unisoc' in text: return 'Unisoc'
else: return 'Other'
def extract_version_main(self, text):
text = str(text).lower()
match = re.search(r'android\s*(\d+)', text)
if match:
return f"Android {match.group(1)}"
return 'Other'
def train_model(self):
df = self.df
X = df[self.numerical_features + self.cat_features]
y = pd.to_numeric(df[self.target], errors='coerce')
X_train, X_test, y_train, y_test = train_test_split(X, y, test_size=0.2, random_state=42)
num_pipeline = Pipeline([
('imputer', SimpleImputer(strategy='median')),
('scaler', StandardScaler())
])
cat_pipeline = Pipeline([
('imputer', SimpleImputer(strategy='most_frequent')),
('encoder', OneHotEncoder(handle_unknown='ignore'))
])
self.preprocessor = ColumnTransformer([
('num', num_pipeline, self.numerical_features),
('cat', cat_pipeline, self.cat_features)
])
pipeline = Pipeline([
('preprocessor', self.preprocessor),
('regressor', xgb.XGBRegressor(random_state=42))
])
pipeline.fit(X_train, y_train)
self.model = pipeline
def predict(self, input_data):
df_input = pd.DataFrame([input_data])
pred_price = self.model.predict(df_input)[0]
return round(pred_price, 2)
This script will perform the following tasks:
Load the dataset (mobile.csv)
Handle missing values and outliers
Extract numerical features from text fields (like battery or display)
Encode categorical variables
Train a regression model using XGBoost
Provide a prediction method for future use
Step 4: Build the Web Application with Flask
Now that we have a trained machine learning model, it’s time to build a simple web interface that allows users to input mobile phone specifications and receive an instant price prediction.
1. Create app.py.
nano app.py
Add the following code.
# app.py
from flask import Flask, render_template, request
from model import PricePredictor
import pandas as pd
app = Flask(__name__)
predictor = PricePredictor('mobile.csv')
@app.route('/', methods=['GET', 'POST'])
def index():
predicted_price = None
if request.method == 'POST':
input_data = {
'Spec Score': float(request.form['spec_score']),
'rating': float(request.form['rating']),
'Battery_mAh': float(request.form['battery']),
'Display_Inches': float(request.form['display']),
'Camera_MP': float(request.form['camera']),
'RAM_GB': float(request.form['ram']),
'Internal_Storage_GB': float(request.form['rom']),
'tag': request.form['tag'],
'sim': request.form['sim'],
'memoryExternal': request.form['memory_external'],
'Processor_Brand': request.form['processor_brand'],
'Version_Main': request.form['version_main']
}
predicted_price = predictor.predict(input_data)
return render_template('index.html', predicted_price=predicted_price)
if __name__ == '__main__':
app.run(host='0.0.0.0', port=5000, debug=True)
2. Flask looks for HTML templates in a folder called templates. Let’s create it.
mkdir templates
3. Now create the HTML file inside the templates folder.
nano templates/index.html
Add the following code.
Mobile Price Predictor
📱 Mobile Phone Price Prediction
{% if predicted_price %}
💸 Predicted Price: ₹{{ predicted_price }}
{% endif %}
Step 5: Run the Application
1. With your Flask app and HTML template set up, you’re now ready to run the application and start serving predictions.
python3 app.py
By default, this will start the Flask server on port 5000 and listen on all network interfaces (0.0.0.0), making it accessible from your browser.
2. Open your web browser and access the Flask app using the URL http://your-server-ip:5000. You should see a simple web form asking you to enter various specifications (like RAM, battery capacity, display size, etc.) for a mobile phone.
3. Once you fill out the form, click on Predict Price. The trained XGBoost regression model processes the input and returns a predicted mobile phone price, which is displayed right on the page.
Conclusion
In this article, we built a complete mobile phone price prediction system from scratch using Python, XGBoost, and Flask on an Ubuntu 24.04 GPU server. We prepared the server environment, downloaded and processed a real-world dataset, trained a regression model, and deployed a user-friendly web interface for real-time predictions.
### Create a Custom Loss Function in TensorFlow on Ubuntu 24.04 GPU Server
Custom loss functions allow you to make your deep learning models more intelligent and tailored to your needs. While popular loss functions like Mean Squared Error (MSE) and Categorical Cross-Entropy work for most tasks, sometimes you need to reflect specific business priorities or research goals in how your model learns. This is where custom loss functions shine: you can penalize errors differently, combine multiple objectives, or handle special data scenarios.
In this guide, you’ll learn everything you need to create, save, and use a custom loss function in TensorFlow on your Ubuntu 24.04 GPU server.
Why Create a Custom Loss Function?
Before you jump in, it’s important to know why custom loss functions are valuable for machine learning projects.
A loss function tells your model how far off its predictions are from the ground truth. While standard loss functions work for many scenarios, sometimes your problem has unique requirements:
You might want to punish certain mistakes more than others (e.g., false negatives in medical diagnoses).
You may need to mix losses (e.g., combine MSE and MAE).
You could have imbalanced data, unusual output formats, or business-specific priorities.
In all these cases, designing your own loss function lets you shape your model’s learning in exactly the way you need.
Prerequisites
An Ubuntu 24.04 server with an NVIDIA GPU.
A non-root user or a user with sudo privileges.
NVIDIA drivers are installed on your server.
Step 1: Setting Up Python Environment
1. First, install the required dependencies.
apt install -y software-properties-common
2. Add the Python repository.
add-apt-repository ppa:deadsnakes/ppa
3. Install Python 3.10 with additional libraries.
apt install -y python3.10 python3.10-venv python3-pip python3.10-dev
4. Verify the Python installation.
python3.10 --version
Output.
Python 3.10.18
Step 2: Install TensorFlow
1. First, create a virtual environment for your project.
python3.10 -m venv tf-venv
2. Activate the virtual environment.
source tf-venv/bin/activate
3. Update pip to the latest version.
pip install --upgrade pip
4. Install TensorFlow.
pip install tensorflow
Step 3: Defining Your Custom Loss Function
Now, let’s create a Python file that contains your custom loss logic. This keeps your code organized and reusable.
nano custom_loss.py
Add the following code:
import tensorflow as tf
def mae_mse_loss(y_true, y_pred):
"""
Combine Mean Absolute Error (MAE) and Mean Squared Error (MSE).
Returns: scalar loss value.
"""
mae = tf.reduce_mean(tf.abs(y_true - y_pred))
mse = tf.reduce_mean(tf.square(y_true - y_pred))
return mae + mse
class WeightedMAEMSE(tf.keras.losses.Loss):
"""
Custom loss: weighted sum of MAE and MSE.
"""
def __init__(self, mae_weight=0.5, mse_weight=0.5, name="weighted_mae_mse"):
super().__init__(name=name)
self.mae_weight = mae_weight
self.mse_weight = mse_weight
def call(self, y_true, y_pred):
mae = tf.reduce_mean(tf.abs(y_true - y_pred))
mse = tf.reduce_mean(tf.square(y_true - y_pred))
return self.mae_weight * mae + self.mse_weight * mse
Explanation:
mae_mse_loss: Combines MAE and MSE for a balanced regression loss.
WeightedMAEMSE: Lets you control the weighting between MAE and MSE by changing parameters.
Run the script.
python3.10 custom_loss.py
Note: Any warnings here can be safely ignored
Step 4: Building and Training a Model with the Custom Loss
With your custom loss ready, let’s see how to plug it into a real model. This file will set up the data, build the model, and train it.
nano train_with_custom_loss.py
Add the following code:
import numpy as np
import tensorflow as tf
from custom_loss import mae_mse_loss, WeightedMAEMSE
# Generate toy regression data
x = np.random.rand(1000, 10)
y = np.sum(x, axis=1, keepdims=True) + np.random.normal(0, 0.1, (1000, 1)) # target: sum + noise
# Build a simple model
model = tf.keras.Sequential([
tf.keras.layers.Input(shape=(10,)),
tf.keras.layers.Dense(64, activation='relu'),
tf.keras.layers.Dense(1)
])
# Compile model with the function-based custom loss
model.compile(optimizer='adam', loss=mae_mse_loss)
print("Training model with function-based custom loss (MAE + MSE)...")
model.fit(x, y, epochs=5, batch_size=32)
# Now use the class-based loss with custom weights
custom_loss = WeightedMAEMSE(mae_weight=0.7, mse_weight=0.3)
model.compile(optimizer='adam', loss=custom_loss)
print("Training model with class-based custom loss (Weighted MAE + MSE)...")
model.fit(x, y, epochs=5, batch_size=32)
This script imports your custom loss and trains a small regression model using both function-based and class-based losses.
Run the script.
python3.10 train_with_custom_loss.py
The output will show training progress and loss values, proving your custom loss works!
32/32 ━━━━━━━━━━━━━━━━━━━━ 1s 10ms/step - loss: 27.3566
Epoch 2/5
32/32 ━━━━━━━━━━━━━━━━━━━━ 0s 2ms/step - loss: 15.0752
Epoch 3/5
32/32 ━━━━━━━━━━━━━━━━━━━━ 0s 2ms/step - loss: 4.5361
Epoch 4/5
32/32 ━━━━━━━━━━━━━━━━━━━━ 0s 2ms/step - loss: 0.3888
Epoch 5/5
32/32 ━━━━━━━━━━━━━━━━━━━━ 0s 2ms/step - loss: 0.3136
Training model with class-based custom loss (Weighted MAE + MSE)...
Epoch 1/5
32/32 ━━━━━━━━━━━━━━━━━━━━ 1s 10ms/step - loss: 0.1630
Epoch 2/5
32/32 ━━━━━━━━━━━━━━━━━━━━ 0s 2ms/step - loss: 0.1055
Epoch 3/5
32/32 ━━━━━━━━━━━━━━━━━━━━ 0s 2ms/step - loss: 0.0864
Epoch 4/5
32/32 ━━━━━━━━━━━━━━━━━━━━ 0s 2ms/step - loss: 0.0756
Epoch 5/5
32/32 ━━━━━━━━━━━━━━━━━━━━ 0s 2ms/step - loss: 0.0695
Conclusion
Custom loss functions are a powerful tool for AI engineers and researchers. With them, you go beyond basic accuracy and make your models optimize for what matters most to your task, whether that’s a business metric, safety, or a scientific goal.
In this article, you learned not just the “how” but also the “why” of custom losses. You saw how to structure your code with separate files, use both function-based and class-based approaches, and integrate your loss into a TensorFlow training loop.
### The Engine of Modern Computing: A Deep Dive into GPU Architecture
From the vibrant, immersive worlds of video games to the complex calculations powering scientific breakthroughs and artificial intelligence, the role of the GPU has changed from being a specialized graphics processing tool into an essential part of modern AI computing. A GPU has the remarkable ability to perform a massive number of calculations simultaneously, making it indispensable for a wide range of demanding AI/ML applications.
This article will uncover the complexity of GPU architecture, exploring its fundamental components, memory systems, and the design philosophies that set it apart from traditional CPU cores. We will look at the basic structure of a processing unit to the sophisticated tech that drives high-performance computing, machine learning, and specialist video rendering.
Parallel Processing: Kernel Grids to Core Technologies
At the core of a GPU's ability to handle immense computational workloads is its architectural design, which centers on parallel processing. Unlike a Central Processing Unit (CPU) that is designed for sequential task execution with a few powerful cores, a GPU is built with thousands of smaller, more efficient cores. This design is optimized for the Single Instruction, Multiple Data (SIMD) model, where the same instruction is executed across multiple data points simultaneously.
The basic processing unit within a modern GPU is the Streaming Multiprocessor (SM). Each GPU contains multiple SMs, and each SM, in turn, houses hundreds of processing cores. In NVIDIA GPUs, these are known as CUDA cores. These cores are the primary components responsible for executing the core math operations and floating-point calculations that are the basis of graphics rendering and scientific computing. The higher number of CUDA cores results in a higher processing power capability and, in turn, better GPU performance.
The execution of tasks on a GPU is managed through a hierarchical structure of threads. A program running on a GPU, known as a kernel, launches a grid of thread blocks. Each thread block is a group of multiple threads that can cooperate and share data using a high-speed, on-chip memory known as shared memory. A single thread block is executed by a single SM. The ability to manage many thread blocks across multiple SMs allows a GPU to process an enormous number of threads simultaneously, leading to a major acceleration of parallelizable tasks.
Tensor Cores and GPU Acceleration
GPU manufacturers have responded to the surge in deep learning and artificial intelligence demands by developing a relatively new type of processing core that appears within NVIDIA GPUs: the Tensor Core. These are highly specialized cores designed to accelerate the matrix multiplication and accumulation operations that are central to model training and inference in neural networks.
By performing these operations in a single step, Tensor Cores provide a large increase in performance for AI workloads compared to what is achievable with standard CUDA cores alone. This specialization is a prime example of how GPU technology has adapted to meet the needs of new computational fields, establishing the GPU's role in the advancement of machine learning.
Memory: Hierarchy, Bandwidth, L2 cache, and Latency
The immense processing power of a GPU would be wasted without a complex memory system to feed its thousands of cores. The GPU memory hierarchy is a key aspect of its architecture, designed to balance the trade-off between speed, size, and cost. Understanding this hierarchy is central to improving GPU performance.
At the top of the hierarchy are the registers, which are the fastest but smallest memory spaces, local to each processing core. Following this is the L1 cache and shared memory, both of which are on-chip and offer much lower memory latency than off-chip memory. Shared memory is a particularly important resource for developers, as it allows threads within a thread block to communicate and share data effectively. Effective shared memory usage is a key feature of well-tuned GPU applications, as it can greatly reduce latency and the need to access slower global memory.
The largest pool of memory available to a GPU is the global memory, which is typically located off-chip. While large in size, it has the highest memory latency. A major portion of GPU performance improvement comes from minimizing the number of accesses to global memory by using the faster on-chip memory.
To address the growing demand for faster data access, modern GPUs have adopted High-Bandwidth Memory (HBM). HBM uses a stacked die design to provide a much wider memory bus, resulting in much higher memory bandwidth compared to traditional GDDR memory. This high throughput is necessary for feeding the massive number of cores in high-end GPUs, particularly in memory-intensive applications like high-performance computing and large-scale deep learning model training.
Another specialized memory space is texture memory, which is configured for 2D and 3D spatial locality. It has dedicated caching mechanisms that can accelerate memory access patterns commonly found in gaming and some scientific simulations. The entire memory subsystem, including the L2 cache, works together to supply the data multiple threads need, when they need it, to sustain high throughput and reach peak performance.
Architectural Showdown: NVIDIA vs. AMD
The GPU market is largely led by two key players: NVIDIA Corporation and AMD. Both companies have developed distinct GPU microarchitectures tailored to different market segments, from consumer GPUs for gaming to powerful accelerators for data centers.
NVIDIA GPUs, with their CUDA programming model, have a strong foothold in the general-purpose computing on GPU market, especially in the fields of machine learning and scientific computing. Architectures like Ampere and the more recent Hopper have introduced major advancements. The Ampere architecture, for instance, brought second-generation ray tracing cores and third-generation Tensor Cores, greatly increasing performance for both gaming and professional workloads. The Hopper architecture further extends the capabilities for exascale computing and massive AI models, featuring even more powerful Tensor Cores and a new level of multi-GPU connectivity with NVLink.
On the other side, AMD GPUs have made great progress with their RDNA and CDNA architectures. The RDNA architecture targets the gaming market, powering their Radeon series of consumer GPUs. It introduced a redesigned compute unit and a multi-level cache hierarchy to improve instructions-per-clock and energy usage. In contrast, the CDNA (Compute DNA) architecture is specifically designed for the data center and high-performance computing. It puts a priority on floating-point operations and features its own matrix core technology to offer an alternative to NVIDIA's Tensor Cores in AI and scientific workloads.
The key distinctions between these architectural philosophies often lie in the specifics of their core designs, memory subsystems, and the software that supports them. This competition continues to drive progress in GPU technology, leading to more powerful and effective processors with each new generation.
Real-World Applications and How They Impact Performance
The effect of GPU architecture is felt across a wide set of industries and applications. In video rendering and computer-aided design (CAD), GPUs allow for the rapid processing of complex scenes and models, greatly shortening the time it takes to create and render detailed designs.
In the scientific community, GPUs specialize in number-crunching tasks, accelerating simulations in fields like molecular dynamics, climate modeling, and astrophysics. The ability to perform a massive number of math operations in parallel has changed computational science.
For developers looking to use the full power of GPU acceleration, understanding how to improve performance is key.
Main strategies include:
Increasing Parallelism: Structuring problems to expose as much parallelism as possible is a basic principle. This involves designing algorithms that can be broken down into a large number of independent tasks that can be executed by many threads across many thread blocks.
Improving Memory Access: Minimizing data movement between the host (CPU) and the device (GPU), and within the GPU memory hierarchy, is very important. This includes using shared memory to reduce reliance on global memory and making sure that memory accesses are coalesced to get the most out of memory bandwidth.
Using Specialized Hardware: For applications in machine learning, using Tensor Cores through libraries like cuDNN and TensorRT can lead to orders-of-magnitude performance improvements.
Multi-GPU Scaling: For the most computationally intensive workloads, using multiple GPUs can provide an almost direct increase in processing power. Technologies like NVIDIA's NVLink provide a high-speed interconnect between GPUs, allowing them to work together on a single task or a set of multiple tasks more effectively than ever before. Note that not all applications scale well with multiple GPUs, and careful programming is required to manage data distribution and synchronization between devices.
The path to peak performance requires a good understanding of the underlying GPU microarchitecture and a continuous process of profiling and refinement to identify and eliminate bottlenecks that affect performance.
GPU Performance Power Through GPU Hosting
Understanding the complex architecture of a modern GPU is one challenge; gaining access to this powerful hardware is another. The high cost of purchasing and maintaining cutting-edge GPUs can be a significant barrier for individuals and businesses. This is where GPU hosting services provide a practical solution.
Cloud and dedicated server providers enable everyday users to gain access to powerful GPUs on demand. Atlantic.Net, for example, offers GPU hosting solutions that feature powerful NVIDIA GPUs, including the NVIDIA L40S and H100 NVL models. These services allow users to bypass the large upfront investment in hardware and instead rent access to servers equipped with the latest GPU technology.
By using a hosting service, a developer working on a deep learning project can access servers with H100 GPUs, taking direct advantage of the Hopper architecture's fourth-generation Tensor Cores and high-bandwidth HBM3 memory for training large language models.
Similarly, a design studio can rent a server with L40S GPUs to accelerate video rendering workloads, benefiting from its balance of AI compute and graphics performance. This on-demand model provides the scalability to adjust computing resources as project needs change, making powerful GPU acceleration accessible for tasks ranging from scientific research to AI model training and inference.
Conclusion: Ever-Changing GPU Architecture
The GPU architecture has seen a major change, growing from a specialized graphics engine to a powerful, general-purpose parallel processor. The continued push for higher processing power, greater memory bandwidth, and improved energy usage has led to a detailed and highly tuned design. The combination of streaming multiprocessors, a range of processing cores like CUDA cores and Tensor Cores, and a layered memory hierarchy gives modern GPUs powerful capabilities.
The need for artificial intelligence, scientific discovery, and immersive digital experiences will continue to shape the direction of GPU technology. Ongoing work from industry leaders like NVIDIA Corporation and AMD points toward more powerful and specialized architectures. This suggests the graphics processing unit will continue to be a central part of high-performance computing. The GPU's ability to process multiple data points in parallel makes it a key tool for training new deep-learning models, rendering photorealistic virtual worlds, or solving some of the world's most difficult scientific problems.
Experience the power of dedicated NVIDIA GPUs without the cost and complexity of managing your own hardware. Launch your high-performance server in minutes with Atlantic.Net GPU Hosting.
Deploy Your GPU Server Today
### GPU Applications: What Are the Main Applications for GPUs?
The graphics processing unit, or GPU, has changed far beyond its original purpose of rendering complex graphics for video games. Today, it's a powerful workhorse that outperforms the central processing unit for a wide range of highly demanding tasks.
GPUs are essential for artificial intelligence and machine learning applications because the dedicated graphics processor is capable of performing the millions of calculations necessary for modern applications.
From cutting-edge scientific research to powering chatbots, large language models, and intelligent coding agents, none of this would be possible without the performance and recent advances in GPU computing.
In this article, we will explore the primary uses of GPUs and examine why their unique architecture is ideal for applications that handle complex calculations and process vast amounts of data.
GPU Technology: Core Strengths
GPUs excel at parallel processing tasks and memory-intensive tasks. A more recent, but now critical, strength of modern GPUs is the inclusion of dedicated hardware units designed to accelerate very specific workloads.
These are not general-purpose cores; they are highly efficient, fixed-function blocks of silicon that make certain applications practical in real-time.
Tensor Cores: These units are engineered to accelerate the specific math operations (matrix multiply-accumulate) that are the foundation of deep learning and AI. For machine learning tasks, such as training a neural network, these cores provide a massive performance uplift over using general-purpose cores, reducing training times from weeks to days or even hours.
Ray Tracing (RT) Cores: Found in many consumer graphics cards, RT Cores are built for one purpose: to rapidly perform the complex intersection calculations needed for ray tracing. This technology simulates the physical behavior of light, creating incredibly realistic lighting, shadows, and reflections.
Types of GPUs: Integrated, Dedicated, and Beyond
Before looking specifically into the applications, it is important to distinguish between the different types of GPUs available, both consumer and enterprise-grade hardware:
Integrated Graphics Processing Unit (Integrated GPU): This type of processing unit is built directly into the computer's motherboard or the CPU itself. It shares system memory with the CPU and is generally less powerful. Integrated graphics are sufficient for everyday tasks like web browsing, video playback, and basic productivity software.
External GPU (eGPU): An external GPU is a dedicated graphics card housed in an external enclosure that connects to a computer, typically a laptop, via a high-speed connection like Thunderbolt. This allows users to add the power of a discrete graphics card to a machine with only an integrated GPU.
Dedicated Graphics Card (Discrete GPU): A dedicated graphics card is a separate piece of hardware with its own memory (VRAM) and processing unit. These cards, also known as discrete GPUs, offer significantly higher graphics performance and are essential for demanding tasks. These are commonly found in gaming PCs up and down the country.
Cloud GPUs: These are the most powerful GPUs hosted in a data center that can be accessed remotely. Cloud computing services offer cloud GPUs for users who need immense computing power for tasks like large-scale machine learning model training without investing in expensive on-premise hardware.
Key GPU Applications
The unique GPU architecture has made it an indispensable tool in numerous fields. The following sections will detail some of the most prominent GPU applications, including scientific visualization.
Gaming and Graphics Rendering
The original and still most well-known application for GPUs is gaming. Modern GPUs are essential for rendering the complex and realistic worlds of today's video games. They handle everything from rendering graphics and textures to complex physics calculations and real-time ray tracing, a technique that simulates the physical behavior of light to create incredibly lifelike images.
The high memory bandwidth and massive number of cores, such as CUDA cores in NVIDIA cards, allow for the smooth, high-frame-rate gameplay that gamers demand. A powerful discrete graphics card is critical for achieving optimal graphics performance and a must-have for any serious PC gamer.
Beyond gaming, GPUs are popular for professional 3D graphics rendering. Artists and designers in fields like architecture, animation, and visual effects rely on the processing power of GPUs to create and render their detailed models and scenes.
The parallel processing capabilities of a graphics card can dramatically reduce the time it takes to render a final image or animation, from hours or even days with just CPU processing to mere minutes.
Video Editing and Content Creation
Video editing is another area where the GPU acceleration provides a significant boost. Tasks like encoding, decoding, rendering effects, and color grading are all highly parallelizable. A capable graphics processing unit can handle these tasks much more efficiently than a CPU alone, resulting in a smoother editing workflow and much faster export times.
This is especially true when working with high-resolution footage, such as 4K or 8K video. The ability to offload these intensive tasks to the GPU frees up the CPU to handle other aspects of the operating system and software, leading to a more responsive experience.
Machine Learning and Artificial Intelligence
The fields of machine learning and artificial intelligence have been revolutionized by GPU technology. Training deep learning models, a subset of machine learning, involves performing a massive number of matrix multiplications and other mathematical operations.
This is a perfect workload for the parallel processing power of a GPU. The ability to perform thousands of simultaneous calculations has drastically reduced the time it takes to train complex models from weeks or months to days or even hours.
Key machine learning tasks that benefit from GPU acceleration include:
Image recognition
Natural language processing
Autonomous vehicle development
Medical image analysis
The development of specialized libraries and APIs, such as NVIDIA's CUDA platform, has made it easier for developers to program GPUs for general-purpose computing, further solidifying the GPU's role in the AI revolution. The demand for GPU power in this space has also led to the growth of cloud GPUs, which provide the necessary computing resources on demand.
Scientific Computing and Data Analysis
High-performance computing (HPC) and scientific computing have also embraced the power of the GPU. Researchers and scientists use GPUs to run complex simulations and analyze massive datasets in fields like:
Computational fluid dynamics
Molecular modeling
Climate science
Astrophysics
These simulations often involve solving systems of partial differential equations, a task that can be broken down into many smaller, independent calculations. The parallel processing capabilities of a GPU are ideally suited for this kind of work, allowing for faster and more detailed simulations.
GPUs are used to accelerate the processing of large datasets, specifically for data analysis. This can be particularly useful in fields like finance, where analysts need to quickly process market data to identify trends and make decisions.
The ability to process data simultaneously allows for much faster analysis than would be possible with a CPU alone. The increased memory bandwidth of modern GPUs is a significant advantage when working on the data pipeline of large datasets that need to be accessed quickly.
Putting Theory into Practice: Dedicated GPU Cloud Hosting
While understanding the power of a graphics processing unit is one thing, accessing that power is another. For many businesses and research institutions, the high cost of enterprise-grade dedicated hardware and the complexity of maintaining it are significant barriers. This is where dedicated GPU hosting platforms provide a practical solution, offering access to high-performance computing resources on demand.
A prime example of this is the Atlantic.Net GPU Hosting Platform, which provides dedicated servers powered by NVIDIA GPUs. A dedicated server model is critical for professional applications as it guarantees that all the computing power of the physical hardware, including the CPU, RAM, and—most importantly—the dedicated GPU, is allocated to a single client. This ensures consistent, predictable hardware performance and enhances security, which is paramount when processing large datasets containing sensitive information.
Discrete GPUs for the Most Demanding Jobs
A key advantage of such a platform is access to a range of powerful, enterprise-class graphics processors. Atlantic.Net offers servers equipped with some of the most advanced GPUs on the market, including the NVIDIA L40S and the NVIDIA H100 NVL.
The NVIDIA L40S is a versatile GPU built on the Ada Lovelace architecture, designed to handle a mix of AI, graphics rendering, and video processing workloads.
The NVIDIA H100 NVL, based on the Hopper architecture, is a powerhouse specifically engineered for large-scale AI and high-performance computing (HPC), featuring extremely high memory bandwidth crucial for training large language models and other complex machine learning tasks.
By making this dedicated hardware available, the platform enables specialized applications across numerous fields that were once limited to major research labs or corporations.
GPU Applications in Critical Industries
The availability of such powerful cloud GPUs has unlocked new possibilities in sectors that rely on data-intensive analysis and complex calculations.
#1: Healthcare and Life Sciences
In healthcare, GPU acceleration is driving a revolution in patient care and research. Medical institutions can leverage dedicated GPU servers for improved GPU acceleration in their research and patient care :
Medical Image Analysis: Using AI models to rapidly analyze MRI, CT, and X-ray images to detect anomalies like tumors with greater speed and accuracy. The NVIDIA L40S GPU is explicitly suited for accelerating such medical imaging analysis.
Drug Discovery and Genomics: The immense processing power of GPUs like the NVIDIA H100 can drastically reduce the time needed for molecular simulations and genomic sequencing. For example, the NVIDIA Parabricks software, which is optimized for GPUs, has been shown to speed up whole-genome sequencing by more than 25 times. This allows researchers to accelerate the search for new drugs and personalized treatments.
#2: Finance
The financial sector operates on speed and data. GPU computing provides a critical edge for:
Risk Analysis and Simulation: Financial institutions run complex simulations, like Monte Carlo methods, to assess portfolio risk. GPU acceleration can reduce the time for these calculations from hours to minutes, enabling more timely and accurate risk management.
Fraud Detection: Machine learning models running on GPUs can analyze thousands of transactions per second to identify anomalous patterns and detect fraud in real-time, protecting both institutions and their customers.
#3: Legal Technology
Even the legal field, traditionally less tech-forward, is beginning to utilize GPU power. The primary driver is the explosion of digital data and the need to analyze it efficiently.
E-Discovery: In litigation, lawyers often need to sift through terabytes of data, including documents, emails, and other communications. GPU-accelerated platforms can run parallel searches and use AI-powered natural language processing (NLP) to classify and tag relevant documents, cutting review time significantly.
Contract Analysis: AI models accelerated by GPUs can analyze thousands of contracts to extract critical clauses, identify risks, and ensure compliance, automating a process that was once highly manual and error-prone.
Ultimately, for any organization that works with large amounts of data, platforms like Atlantic.Net offer a simpler path. They take the raw power of a graphics processing unit and turn it from a complex piece of hardware into a practical, on-demand tool that businesses can use to push their work forward.
The Future of GPU Applications
The role of the graphics processing unit in modern computing continues to grow. As GPU technology advances, with increasing numbers of cores, greater energy efficiency, and more sophisticated architectures, we can expect to see even more innovative GPU applications emerge.
The increasing use of multiple GPUs in a single system or across a network will further push the boundaries of what is possible.
From powering the next generation of immersive video games to enabling breakthroughs in artificial intelligence and scientific computing, the GPU has proven itself to be a versatile and powerful tool. Its ability to perform a massive number of parallel tasks has fundamentally changed the landscape of computing, and its importance is only set to grow in the years to come.
Whether you are a gamer, a content creator, a data scientist, or a researcher, the graphics processing unit is a piece of dedicated hardware that is likely to have a significant impact on your work and daily life.
Ready to apply this knowledge and deploy your high-performance applications? Atlantic.Net's GPU Hosting provides on-demand access to powerful NVIDIA-powered servers. Accelerate your machine learning, data science, and rendering workloads today.
### Voice Cloning with Tortoise-TTS on Ubuntu 24.04 GPU Server
Voice cloning technology has seen major advances in recent years. You can now synthesize realistic speech that sounds like almost anyone, using just a few minutes of recorded audio. This opens up exciting new possibilities, from personal voice assistants to accessibility tools, creative media, and more.
Tortoise-TTS stands out as one of the most advanced open-source tools for high-quality, controllable voice synthesis. It can generate natural-sounding speech and lets you “clone” a target voice with a small reference sample.
In this guide, you’ll learn how to set up Tortoise-TTS on Ubuntu 24.04, build a simple Flask web interface, and clone voices by uploading a reference sample and custom text for instant speech generation.
Prerequisites
An Ubuntu 24.04 server with an NVIDIA GPU.
A non-root user or a user with sudo privileges.
NVIDIA drivers are installed on your server.
Step 1: Install Required Dependencies
Before you dive into voice cloning, let’s make sure your environment is ready.
1. Install the required dependency.
apt install -y software-properties-common
2. Add the Python repository.
add-apt-repository ppa:deadsnakes/ppa
3. Install Python 3.10 with other packages.
apt install -y python3.10 python3.10-venv python3-pip python3.10-dev python3.10-distutils ffmpeg
4. Verify the Python installation.
python3.10 --version
Output.
Python 3.10.18
Step 2: Setting Up Tortoise-TTS
Before you can start cloning voices, you’ll need to get Tortoise-TTS up and running on your Ubuntu 24.04 server. This section walks you through cloning the official repository and applying a quick code fix to avoid a common runtime error.
1. First, let’s download the latest Tortoise-TTS code from GitHub.
git clone https://github.com/neonbjb/tortoise-tts.git
2. Navigate inside the downloaded directory.
cd tortoise-tts
3. Tortoise-TTS sometimes throws an error related to an unexpected argument in the API. The fix is simple—just update one line in the tortoise/api.py file.
nano tortoise/api.py
Find the following line:
cond_mel = wav_to_univnet_mel(sample.to(self.device), do_normalization=False,
device=self.device, stft=self.stft)
And, replaced it with the following line.
cond_mel = wav_to_univnet_mel(sample.to(self.device), do_normalization=False)
Save and close the file
Step 3: Prepare the Voice Directory
Before you can start cloning a voice, you’ll need a special folder to store your reference audio sample. Tortoise-TTS uses this folder to find the audio it will learn from and later use for synthesis.
Let’s make a new folder called my_target_voice inside the tortoise/voices directory. This will hold your recorded sample.
mkdir -p tortoise/voices/my_target_voice
Step 4: Setting Up a Python Virtual Environment
Running Tortoise-TTS and its dependencies inside a Python virtual environment is the best way to keep your project organized and avoid conflicts with other Python apps on your server.
1. First, make sure you’re in the root folder of your Tortoise-TTS project:
cd ~/tortoise-tts
2. Now, create a new virtual environment called tortoise-venv using Python 3.10.
python3.10 -m venv tortoise-venv
3. Activate your new environment so all Python commands use the right interpreter and dependencies.
source tortoise-venv/bin/activate
Step 5: Install Python Dependencies
With your virtual environment activated, you’re ready to install everything Tortoise-TTS needs to run smoothly. This includes core requirements, plus a couple of extra packages for the web interface.
1. Start by making sure pip (Python’s package installer) is up to date.
pip install --upgrade pip
2. Next, install all the required packages listed by the Tortoise-TTS repository.
pip install -r requirements.txt
Note: The installation will take a few minutes
3. For the web interface and easier running of the Tortoise-TTS API, you’ll also want Flask and the latest Tortoise-TTS package.
pip install flask tortoise-tts
Step 6: Building the Flask Web Application
With Tortoise-TTS installed and ready, let’s make it user-friendly! You’ll build a simple Flask web app so you can record/upload your reference voice, type any text, and get your cloned voice as an MP3, all from your browser.
1. Create a new file named app.py in your tortoise-tts directory.
nano app.py
Add the following code.
import os
from flask import Flask, render_template, request, send_file
app = Flask(__name__)
VOICE_DIR = "tortoise/voices/my_target_voice"
AUDIO_PATH = os.path.join(VOICE_DIR, "sample1.wav")
RESULT_WAV = "results/output_001.wav"
RESULT_MP3 = "results/output_001.mp3"
RESULTS_DIR = "results"
# Ensure directories exist
os.makedirs(VOICE_DIR, exist_ok=True)
os.makedirs(RESULTS_DIR, exist_ok=True)
@app.route("/", methods=["GET"])
def index():
return render_template("index.html")
@app.route("/upload", methods=["POST"])
def upload():
# Remove old wav files in the target voice directory
for f in os.listdir(VOICE_DIR):
if f.endswith(".wav"):
os.remove(os.path.join(VOICE_DIR, f))
audio = request.files["audio_data"]
temp_path = os.path.join(VOICE_DIR, "temp_upload")
audio.save(temp_path)
# Convert to real WAV format using ffmpeg
os.system(f'ffmpeg -y -i "{temp_path}" -ar 22050 -ac 1 "{AUDIO_PATH}"')
os.remove(temp_path)
return "Uploaded", 200
@app.route("/synthesize", methods=["POST"])
def synthesize():
text = request.form["text"]
# Clean old .wav and .mp3 files from results/
for f in os.listdir(RESULTS_DIR):
if f.endswith(".wav") or f.endswith(".mp3"):
os.remove(os.path.join(RESULTS_DIR, f))
# Run Tortoise-TTS with the user's recorded reference
cmd = f'python3 tortoise/do_tts.py --text "{text}" --voice my_target_voice'
os.system(cmd)
# Find the latest .wav file in results/
wav_files = [os.path.join(RESULTS_DIR, f) for f in os.listdir(RESULTS_DIR) if f.endswith(".wav")]
if not wav_files:
return "Synthesis failed: No output .wav found.", 500
latest_wav = max(wav_files, key=os.path.getctime)
# Convert the wav file to mp3 using ffmpeg
os.system(f'ffmpeg -y -i "{latest_wav}" -codec:a libmp3lame -qscale:a 2 "{RESULT_MP3}"')
# Return the mp3 file for download
if not os.path.exists(RESULT_MP3):
return "Synthesis failed: MP3 not created.", 500
return send_file(RESULT_MP3, as_attachment=True, download_name="cloned_voice.mp3")
if __name__ == "__main__":
app.run(debug=True)
The above code:
Handles audio upload and conversion to the right format.
Runs the Tortoise-TTS synthesis process.
Converts the result to MP3 and sends it back for download.
Serves the web page for your interface.
2. Now let’s make a folder for your HTML files.
mkdir templates
3. Create a new HTML file inside the templates directory.
nano templates/index.html
Add the following code.
Voice Clone Web UI
1. Record your voice sample
2. Clone your voice
Synthesizing... please wait
The above code allows you to:
Record your own voice or upload an audio sample directly from your browser.
Enter any text for voice synthesis.
Shows progress and lets you download your cloned voice as an MP3.
Step 7: Running the Voice Cloning Web App
Now that you’ve built your Flask web application and set up all the required files, it’s time to launch your own private voice cloning site!
Run your Flask application.
python3 app.py
You should see output like this.
* Serving Flask app 'app'
* Debug mode: on
WARNING: This is a development server. Do not use it in a production deployment.
* Running on http://127.0.0.1:5000
This means your server is running locally and ready for you to test!
Step 8: Accessing the Web Interface Remotely
If your Ubuntu 24.04 server is running in the cloud, you’ll want to use your laptop or desktop browser to control your voice cloning web app. The safest and easiest way to do this is with an SSH tunnel.
An SSH tunnel creates a secure, encrypted connection from your local computer to your server. It forwards a port from your server to your local machine, so only you can access the web app, no public exposure or risky firewall changes.
On your local desktop computer, open a terminal and run:
ssh -N -f -L 5000:localhost:5000 root@your-server-ip
Note: Replace your-server-ip with your server’s public IP address or domain name.
The above command:
Forward your local port 5000 to port 5000 on the server.
Any request you make to localhost:5000 on your laptop goes securely to your server’s Flask app.
Step 9: Using the Voice Cloning App
Once you have your Tortoise-TTS web app running (and have connected via SSH tunnel if needed), you’re ready to try out voice cloning for yourself. Here’s how you can go from recording your own voice to downloading a fully cloned audio sample, all from your browser.
1. Open the Web App
On your local computer, open a web browser and visit:
http://localhost:5000
This brings up your voice cloning app’s main interface.
2. Record Your Voice Sample
Click the “Record” button to begin recording your voice.
When your browser asks for permission, allow microphone access.
Speak clearly and record a short sample, just a few seconds is enough for a quick demo.
Click “Stop” when you’re done.
You’ll see your recorded sample appear in the audio player and a message confirming upload.
3. Enter the Text to Clone
In the input field below, type any text you want the app to synthesize in your voice.
Example: "My name is hitesh"
4. Generate the Cloned Voice
Click the "Clone Voice" button.
You'll see a progress bar as the server processes your request and generates the synthetic voice.
5. Download Your Cloned Audio
Once the process is finished, a download link for an MP3 file will appear.
Click the link to download your cloned voice and play it on your computer, phone, or any audio player.
Conclusion
You’ve now learned how to set up a powerful, private voice cloning app using Tortoise-TTS on an Ubuntu 24.04 GPU server. With just a few steps, you can record your voice, enter custom text, and generate natural-sounding speech, all from an easy-to-use web interface.
This workflow is perfect for experimenting with AI voice technology in a secure environment, whether you’re a developer, content creator, or just curious about the latest in speech synthesis. If you want to go further, you can explore customizing the web UI, adding support for more voices, or integrating Tortoise-TTS with other applications and APIs.
### How to Convert a Keras Model to a TensorFlow Lite Model on Ubuntu 24.04 GPU Server
Deploying deep learning models outside of powerful cloud servers is now easier than ever, thanks to TensorFlow Lite (TFLite). When you convert your Keras model to TFLite, you unlock the ability to run AI-powered apps on mobile devices, Raspberry Pi, and a wide range of edge hardware.
Many developers and data scientists want to use the same trained model across different platforms, but traditional TensorFlow models are often too large and resource-intensive for these environments.
That’s where TensorFlow Lite comes in: it gives you smaller, faster models that retain much of the original model’s accuracy.
In this guide, you’ll learn how to take a Keras model, convert it step-by-step to the TFLite format, and test it, all on an Ubuntu 24.04 GPU server.
Prerequisites
An Ubuntu 24.04 server with an NVIDIA GPU.
A non-root user or a user with sudo privileges.
NVIDIA drivers are installed on your server.
Step 1: Install TensorFlow
First, update all system packages to the latest version.
apt update -y
Next, install Python and other required dependencies.
apt install python3 python3-venv python3-pip -y
Create and activate the virtual environment.
python3 -m venv keras2tflite-env
source keras2tflite-env/bin/activate
Upgrade pip to the latest version.
pip install --upgrade pip
Install TensorFlow.
pip install tensorflow
Step 2: Create and Save a Keras Model
In this section, you’ll build and save a simple Keras model for demonstration.
Create a create_keras_model.py file.
nano create_keras_model.py
Add the following code.
import tensorflow as tf
from tensorflow import keras
# Build a basic model (MNIST-style, for simplicity)
model = keras.Sequential([
keras.layers.Input(shape=(28, 28)),
keras.layers.Flatten(),
keras.layers.Dense(128, activation='relu'),
keras.layers.Dense(10, activation='softmax')
])
# Compile the model (no need to train for conversion demo)
model.compile(optimizer='adam',
loss='sparse_categorical_crossentropy',
metrics=['accuracy'])
# Save the Keras model in HDF5 format
model.save('my_keras_model.h5')
print("Keras model saved as 'my_keras_model.h5'")
This script builds a basic neural network and saves it to a file named my_keras_model.h5. You can replace this with your own trained model if needed.
Now, run the script.
python3 create_keras_model.py
Output.
Keras model saved as 'my_keras_model.h5'
Step 3: Convert Keras Model to TensorFlow Lite
Now, you’ll convert the Keras model to the TensorFlow Lite format.
Create a Python script.
nano convert_to_tflite.py
Add the following code.
import tensorflow as tf
# Load the Keras model you saved
model = tf.keras.models.load_model('my_keras_model.h5')
# Convert to TFLite format
converter = tf.lite.TFLiteConverter.from_keras_model(model)
tflite_model = converter.convert()
# Save as a .tflite file
with open('model.tflite', 'wb') as f:
f.write(tflite_model)
print("TFLite model saved as 'model.tflite'")
This code loads your Keras. h5 model, converts it to TFLite, and saves it as a model.tflite. This is the model you’ll deploy to mobile or edge devices.
Run the script.
python3 convert_to_tflite.py
Output.
TFLite model saved as 'model.tflite'
Step 4: Optimize Model with Quantization
If you want your model to be even smaller and faster, you can optimize it with quantization.
Create a script.
nano convert_with_quantization.py
Add the following code.
import tensorflow as tf
# Load the Keras model again
model = tf.keras.models.load_model('my_keras_model.h5')
# Enable quantization during conversion
converter = tf.lite.TFLiteConverter.from_keras_model(model)
converter.optimizations = [tf.lite.Optimize.DEFAULT]
quant_tflite_model = converter.convert()
# Save quantized model
with open('model_quant.tflite', 'wb') as f:
f.write(quant_tflite_model)
print("Quantized TFLite model saved as 'model_quant.tflite'")
This script uses TensorFlow’s built-in optimization to reduce the model’s size and improve inference speed, with minimal accuracy loss. The output file is model_quant.tflite.
Run the script.
python3 convert_with_quantization.py
Output.
Quantized TFLite model saved as 'model_quant.tflite'
Step 5: Run Inference with TFLite Interpreter
You should always test your TFLite model to ensure it works as expected. Here’s how to do a quick check.
Let's create a script to test the model.
nano test_tflite_inference.py
Add the following code.
import numpy as np
import tensorflow as tf
# Load the TFLite model and allocate tensors
interpreter = tf.lite.Interpreter(model_path='model.tflite')
interpreter.allocate_tensors()
# Get details for input and output
input_details = interpreter.get_input_details()
output_details = interpreter.get_output_details()
# Create a dummy input (batch size 1, 28x28 zeros)
input_data = np.zeros((1, 28, 28), dtype=np.float32)
interpreter.set_tensor(input_details[0]['index'], input_data)
# Run inference
interpreter.invoke()
output_data = interpreter.get_tensor(output_details[0]['index'])
print("TFLite model output:", output_data)
This script loads your TFLite model and runs it with dummy data to make sure everything works. If you see a probability array as output, your conversion was successful!
Run the script.
python3 test_tflite_inference.py
Output.
TFLite model output: [[0.1 0.1 0.1 0.1 0.1 0.1 0.1 0.1 0.1 0.1]]
The output shows the model's prediction probabilities for each of the 10 possible classes, with each value here being 0.1 since we used a dummy input of all zeros.
Conclusion
You’ve just walked through the complete process of converting a Keras model to TensorFlow Lite, right from installation and setup to final testing on Ubuntu 24.04. With these steps, you can confidently deploy your AI solutions to mobile phones, single-board computers, and embedded devices.
### How Does Atlantic.Net Handle HIPAA Migrations?
The demand for HIPAA-compliant cloud services remains exceptionally strong in 2025. Healthcare institutions increasingly recognize the necessity of migrating to secure, scalable, and technologically advanced cloud environments. This trend, which saw significant acceleration in the early 2020s, continues as organizations strive to enhance patient care delivery and operational efficiency through modern technology.
Migrating production workloads with Protected Health Information (PHI) adds extra dimensions of complexity, requiring the entire process to uphold strict security requirements with minimal downtime.
No Cloud Migration project is the same, and Atlantic.Net understands that migrating your production and development environments can be daunting for any IT department. Atlantic.Net’s experienced migration specialists work with you to create a customized migration strategy.
The Atlantic Cloud Platform (ACP) has seen significant growth and technological advancement, and Atlantic.Net offers a variety of cloud hosting products, including HIPAA hosting, with managed services to simplify migrations.
We will be involved as much (or as little) as you need. The migration process typically takes 2-6 weeks, with preplanning work occurring on weekdays and migration cutover available 24/7/365.
Assess, Migrate & Optimize
The Cloud Migration service is split into three stages, with the assessment stage typically involving a detailed risk analysis. This step is key when handling PHI and involves identifying what PHI data is stored and processed on your systems.
The Migration team will scope the existing platform, identify restrictive compliance requirements like data locality regulations, and focus on securing PHI as per HIPAA requirements, ensuring migrations are into secure and compliant environments. A migration approach, such as “lift and shift” or “greenfield re-architecting,” will be decided, ensuring we always use the latest cloud capabilities.
Client consultation is key, alongside reviews of licensing costs, networking, dependencies, server sizing, scaling, and DR options.
Migration Tiers
Atlantic.Net offers a tiered structure to its cloud migration services: Standard, Advanced, and Enterprise. With all three tiers, we commit to getting you into ACP with minimal disruption.
Standard Migration includes migrating defined data directories from your current system. The data migration will be completed by the Atlantic.Net’s Security Operations Center (SOC). This service is typically used by clients moving from legacy systems and can include cPanel, file server share, and Plesk migrations.
Advanced Migration service assigns a dedicated engineer who will assist with planning, reviewing compatibility, setting up systems that fall under Atlantic.Net’s scope of support for Managed Services, migrating all specified data, and verifying the new environment works correctly per the migration plan.
Enterprise Migrations includes everything from the Standard and Advanced migration services, with the added feature of performing complete bare metal restores (BMR) or Physical to Virtual migrations (P2V). Our highly skilled Professional Services teams work with your organization, utilizing specialist software for pre-seeding and user testing to minimize configuration changes and downtime.
Migration Success Program
Atlantic.Net offers a Migration Success Program. This program provides a migration credit if a customer brings a new environment to Atlantic.Net and meets a minimum revenue requirement.
Further details regarding specific eligibility criteria, the nature of the credits for different service tiers, and how the program might apply are typically discussed during the consultation process with Atlantic.Net.
We encourage you to discuss the Migration Success Program with our specialists during your consultation to explore how your project could benefit from available incentives.
Ready to Find Out More?
Atlantic.Net stands ready to help you attain fast compliance with a range of certifications (such as SOC 2 and SOC 3, and for their hosting environments, HIPAA and HITECH). Atlantic.Net offers HIPAA hosting services.
Migrations leverage these secure environments, ensuring Protected Health Information (PHI) is handled with the necessary safeguards throughout your transition. For faster application deployment, free IT architecture design, and assessment, visit us at www.atlantic.net, call USA: 866-618-DATA (3282), International: +1-408-335-0825, or email us at sales@atlantic.net.
Partner with Atlantic.Net for a meticulously planned and expertly executed migration, ensuring your healthcare workloads are transitioned to a secure, compliant, and optimized cloud environment.
### Live Face Detection Web App with face-api.js and JavaScript on Ubuntu 24.04 GPU Server
Live face detection is becoming a core part of many modern web and mobile applications. From security and authentication to creative effects and user analytics, the ability to recognize faces instantly in the browser opens up a world of possibilities.
face-api.js is a popular JavaScript library that brings powerful, real-time face detection and recognition to any website—no specialized hardware or backend required. It leverages TensorFlow.js to run deep learning models right in your browser, using your device’s webcam for instant results.
In this tutorial, you’ll learn how to build a live face detection web app using face-api.js and vanilla JavaScript.
Prerequisites
An Ubuntu 24.04 server with an NVIDIA GPU.
A non-root user or a user with sudo privileges.
NVIDIA drivers are installed on your server.
Step 1: Installing Node.js and npm
Node.js and npm (Node Package Manager) are essential tools for running and managing JavaScript projects outside the browser.
1. Start by making sure your package list is up to date.
apt update -y
2. Now install Node.js and npm with a single command.
apt install nodejs npm -y
3. After installation, check the versions to confirm everything is set up correctly.
nodejs --version
npm --version
Step 2: Setting Up Your Project and Local Web Server
Let’s get your workspace organized, install a simple web server, and grab everything you need to run face detection in the browser.
1. Create a project directory.
mkdir ~/faceapi-ml5js-demo
cd ~/faceapi-ml5js-demo
2. Install http-server to load your HTML and JavaScript in the browser.
npm install -g http-server
3. Now, download the face-api.js library and the required model files (weights).
git clone https://github.com/justadudewhohacks/face-api.js.git
4. Copy the weights folder from the cloned repo to your project root.
mv face-api.js/weights .
Step 3: Creating the HTML Face Detection App
Now you’ll create the main web page that handles live face detection using face-api.js and JavaScript. This will include video, canvas for drawing, and all the scripts needed to make it work in your browser.
1. Create an index.html file inside your project directory.
nano index.html
Add the following code.
Face Detection with face-api.js
Loading model...
2. Start the HTTP web server.
http-server -p 8080 &
This command starts the server in the background, serving your files at port 8080.
Step 4: Exposing Your App Securely with NGINX and HTTPS
At this point, your app is accessible only from the local machine. To make your app accessible from the internet, you will need to expose it using Nginx and HTTPS.
1. First, install NGINX on your server.
apt install nginx -y
2. Create a new configuration file for your app.
nano /etc/nginx/conf.d/app.conf
Add the following code (replace app.example.com with your real domain):
server {
listen 80;
server_name app.example.com;
location / {
proxy_pass http://localhost:8080;
proxy_set_header Host $host;
proxy_set_header X-Real-IP $remote_addr;
proxy_set_header X-Forwarded-For $proxy_add_x_forwarded_for;
proxy_set_header X-Forwarded-Proto $scheme;
}
}
3. Test the Nginx configuration.
nginx -t
4. If you see “syntax is ok,” reload Nginx.
systemctl reload nginx
5. Install Certbot and the Nginx plugin to secure your app with HTTPS.
apt install certbot python3-certbot-nginx -y
6. Run Certbot to get and apply a free SSL certificate.
certbot --nginx -d app.example.com
Step 5: Access Your App Securely
Now that your NGINX proxy and HTTPS certificate are set up, your app is accessible on the public internet with encrypted, private traffic.
1. Open your web browser and visit the URL below:
https://app.example.com
2. The app will prompt you to allow camera access.
3. Click “Allow” to enable face detection in real time.
4. If your webcam is working and the model weights are in place, you’ll see a green bounding box around your face on the video. The status message updates live: “Face detected!” or “No face detected.”
Conclusion
You’ve just built a full-featured, real-time face detection web app using face-api.js and JavaScript, hosted on your own Ubuntu 24.04 server. With your app running securely over HTTPS, you can now access live face detection from anywhere, share it with others, and demonstrate browser-based AI in action—all with just a few lines of code and open-source tools.
### How to Run Machine Learning Models in Your Browser with TensorFlow.js
Imagine running advanced machine learning models right inside your web browser—no need for heavy backend servers or complicated deployment pipelines. With TensorFlow.js, you can bring real-time AI features like image classification, object detection, and more directly to users, all with JavaScript. This means your apps can analyze images, predict outcomes, or recognize objects instantly, right in the browser.
In this guide, you’ll learn how to build a ReactJS web app that uses TensorFlow.js to classify images.
Why Use TensorFlow.js in the Browser?
Running machine learning models directly in the browser with TensorFlow.js offers some unique advantages.
Here are a few popular use cases for running machine learning in the browser:
Image classification (like recognizing objects, animals, or scenes)
Real-time face or pose detection via webcam
Sound recognition and speech commands
Text sentiment analysis or language translation
Prerequisites
An Ubuntu 24.04 server with an NVIDIA GPU.
A non-root user or a user with sudo privileges.
NVIDIA drivers are installed on your server.
Step 1: Setting Up Your Server
Let’s get your server ready to run a ReactJS app with TensorFlow.js. Follow these steps to update your system and install the necessary tools:
1. Update your package index.
apt update -y
2. Install Node.js and NPM to build and run your ReactJS project.
apt install -y nodejs npm
3. Make sure everything is set up correctly by checking the versions.
node -v
npm -v
Step 2: Create a ReactJS Project
With Node.js and npm installed, you can quickly set up a new ReactJS app using the Create React App tool. This will give you a modern, ready-to-use project structure.
1. Create your app using the npx command.
npx create-react-app tfjs-image-demo
2. Navigate into your project directory.
cd tfjs-image-demo
Step 3: Install TensorFlow.js and Supporting Libraries
Now it’s time to add the libraries that make in-browser machine learning possible.
1. Install TensorFlow.js and other tools.
npm install @tensorflow/tfjs @tensorflow-models/mobilenet antd
Explanation:
@tensorflow/tfjs - the TensorFlow.js library
@tensorflow-models/mobilenet - pre-trained MobileNet model
antd - (optional) for better UI components
Step 4: Build the Image Classifier App
Now, let’s add the code that makes everything work. You’ll create an interactive ReactJS app that uses TensorFlow.js and MobileNet to classify images right in the browser.
1. Edit the file src/App.js.
nano src/App.js
Delete everything in App.js and paste the following code:
import React, { useRef, useState, useEffect } from "react";
import "@tensorflow/tfjs";
import * as mobilenet from "@tensorflow-models/mobilenet";
import { Upload, Button, Tag, Typography } from "antd";
const { Title } = Typography;
function App() {
const [model, setModel] = useState(null);
const [predictions, setPredictions] = useState([]);
const canvasRef = useRef(null);
// Load MobileNet model on mount
useEffect(() => {
async function loadModel() {
const loadedModel = await mobilenet.load();
setModel(loadedModel);
}
loadModel();
}, []);
// Handle image upload
const handleImageChange = async (info) => {
const file = info.file.originFileObj;
if (!file || !model) return;
const img = new window.Image();
img.src = URL.createObjectURL(file);
img.onload = async () => {
// Draw image to canvas
const canvas = canvasRef.current;
canvas.width = img.width;
canvas.height = img.height;
const ctx = canvas.getContext("2d");
ctx.drawImage(img, 0, 0);
// Classify image
const preds = await model.classify(canvas, 5);
setPredictions(preds);
};
};
return (
);
}
export default App;
The above code:
Loads the MobileNet model when the app starts.
Lets users upload any image.
Shows the image on a canvas and runs the model to classify it.
Instantly displays predicted labels and confidence scores, right in the browser!
Step 5: Start the Development Server
You’re almost ready to see your app in action! Now, let’s launch the ReactJS development server so you can access your project from your browser.
Start the React development server.
npm start -- --host your-server-ip
Output.
Compiled successfully!
You can now view tfjs-image-demo in the browser.
http://localhost:3000
Note that the development build is not optimized.
To create a production build, use npm run build.
webpack compiled successfully
Step 6: Test Your Image Classifier in the Browser
Now it’s time for testing using your browser-based AI app.
1. Open your browser and go to http://YOUR_SERVER_IP:3000
2. Click the “Upload an Image” button and choose any photo from your computer. You can try pictures of animals, everyday objects, or anything you like.
3. As soon as you upload the image, the app will display the picture and show prediction tags with labels and confidence scores (like “tabby cat: 99.5%”).
Conclusion
You’ve just built a modern, browser-based image classifier with TensorFlow.js and ReactJS, right on your Ubuntu 24.04 GPU server. With just a few commands and some simple code, you can now run machine learning models instantly in any web browser, all without sending data to a remote backend.
This approach offers privacy, speed, and a seamless user experience. You can expand this project further by adding support for webcam input, testing other pre-trained models, or customizing the UI to fit your needs.
### IaaS (Infrastructure as a Service): The Ultimate Guide [2025]
What Is Infrastructure as a Service (IaaS)?
Infrastructure as a service (IaaS) is a cloud computing model that provides virtualized computing resources over the internet. Instead of buying and maintaining physical servers and data center infrastructure, organizations can rent compute, storage, and networking on-demand from a cloud provider. This model gives businesses the flexibility to scale up or down based on workload requirements while paying only for what they use.
IaaS supports a range of use cases from hosting websites to running large-scale enterprise applications. Users have control over operating systems, deployed applications, and configurations, while the cloud provider manages the underlying physical infrastructure. This makes IaaS ideal for organizations that need computing power and flexibility without the burden of managing hardware.
IaaS Architecture
In the IaaS model, cloud providers host infrastructure like servers, storage, networking hardware, and hypervisors, meaning organizations do not need to have this requirement in their on-premise data center.
IaaS providers offer a variety of services over this infrastructure. These include:
Multi tenancy and billing management
Logging and monitoring
Security
Clustering, failover and load balancing
Backup, replication and recovery
Most IaaS providers offer policy-driven services, allowing users to implement a high level of automation and coordinate critical infrastructure tasks. For example, users can implement policies that automate load balancing to maintain application performance and availability.
IaaS customers can access resources and services over a wide area network (WAN) such as the Internet, and instruct the cloud provider to deploy a complete application stack.
For example, a user can connect to the IaaS platform remotely to create virtual machines (VMs). They can install an operating system and an enterprise application on each virtual machine, deploy local disk storage, large-scale object storage, and database systems. The user can then use the provider's services for cost tracking, performance monitoring, network traffic balancing, disaster recovery management, and more.
Most IaaS users consume cloud services via a cloud provider, such as Amazon Web Services or Microsoft Azure . This is known as public cloud computing. Organizations can also set up their own IaaS infrastructure, creating what is known as a private cloud, or in combination with public cloud resources, a hybrid cloud.
Learn more in the in-depth guides to Load Balancers
Related product offering: Radware Alteon | Application Delivery and Security
Multi-Tenant Architecture in the Cloud
Multi-Tenant Architecture in the Cloud Multi-tenancy makes it possible for one software application or infrastructure component to serve multiple customers. Customers are referred to as “tenants”. Each tenant might have the ability to customize the infrastructure or service they receive, but they usually do not have full access to its configuration or source code.
A multi-tenant architecture runs applications or infrastructure in a shared environment. Every tenant is logically separated, while working on resources that are physically integrated with those of other tenants. This means that a multi-tenant component shares one instance of configurations, user management, and data.
Most cloud environments are based on the multi-tenancy model. Both public clouds and private clouds use multi-tenancy, allowing multiple users or groups (whether from different organizations or the same organization) to run workloads separately. For example, in a multi-tenant public cloud environment, multiple organizations or users can run workloads on the same physical server. However, each user only sees their own workloads, a concept known as isolation.
Learn more in the in-depth guide to multi-tenant architecture
What Is Cloud Hosting?
Cloud hosting is a paradigm that allows organizations to leverage cloud computing without the full complexity of public cloud or private cloud deployments.
Cloud hosting is a more flexible, scalable, and reliable alternative to traditional hosting methods like shared hosting and dedicated hosting. Unlike these traditional methods, where an organization’s resources run on a single server in a provider’s data center, cloud hosting leverages large-scale cloud computing environments, enabling easier scalability and redundancy.
Here are the primary types of cloud hosting:
Managed cloud hosting: In managed cloud hosting, the service provider takes care of the setup, administration, management, and support of the cloud servers, freeing up the business to focus on its core competencies.
Cloud VPS (Virtual Private Server): This is a type of cloud hosting where the user has an allocated amount of server resources. Unlike shared hosting, resources aren't shared with other users. This type of hosting is scalable and can be adjusted as needed.
Dedicated server hosting: This type of service allows organizations to use a dedicated server hosted within a cloud platform.
Learn more in our detailed guide to what is cloud hosting
Related technology updates:
[Blog] What Is the Difference Between a Dedicated Server and a Dedicated Cloud Host?
Learn more in our detailed guide to dedicated server hosting
Related product offering: VPS hosting by Atlantic.net
What Is a Bare-Metal Cloud?
A bare-metal cloud is a type of cloud service where the client leases physical servers from a cloud service provider. Unlike traditional cloud models where multiple users share resources of the same physical server, the bare-metal cloud provides dedicated servers to a single client. This eliminates the "noisy neighbor" problem often encountered in shared hosting environments.
The term "bare-metal" refers to the direct access granted to the underlying physical servers.
This means that users are not limited to the resources provided by the hypervisor or virtualization software, but they can access the full capacity of the physical servers. This includes the server's processor power, memory, storage, and networking resources.
Bare-metal cloud combines the best features of traditional dedicated server hosting with the flexibility and scalability of cloud hosting. You get the raw performance of physical servers and the ability to scale up or down as your needs change. And unlike traditional dedicated servers, you can provision and deprovision servers in a matter of minutes, not days or weeks.
Related product offering: bare metal servers by Atlantic.net
IaaS vs PaaS vs SaaS
What is Platform as a Service (PaaS)?
Platform as a Service (PaaS) provides some infrastructure components, along with additional managed service and software. A PaaS is a framework developers can use to create their own applications, focusing on developing software functionality for their end users. The cloud provider manages complex back-end infrastructure, including computing resources, operating systems, software updates, storage, networking, and integrations.
What is Software as a Service (SaaS)?
Software as a service (SaaS) is a popular choice for cloud users. Because SaaS delivers software to end users over the Internet, most SaaS applications run directly from a web browser and do not need to be downloaded or installed by the customer. PaaS, on the other hand, delivers a software development platform. The majority of cloud consumers do not need PaaS.
This web services model eliminates the need for IT staff to download and install applications on local devices. SaaS enables providers to simplify service and support for their business, while solving potential technical problems such as data and storage management, middleware, servers, and networking.
Key Differences Between IaaS, PaaS and SaaS
PaaS is based on the IaaS model—this is because, in addition to infrastructure components, the provider manages the operating systems, middleware, and other operating environments for cloud users. PaaS workloads simplify deployment but offer more limited flexibility compared to a pure IaaS model.
SaaS manages all infrastructure and applications needed for the end user—SaaS users don't need to install or deploy anything. They can typically just login and start using the provider's application, running on the provider's infrastructure. Users can customize the behavior of applications, add their own data, and restrict access. Almost all other aspects are the responsibility of the SaaS provider.
Public Cloud vs. Private Cloud vs. Hybrid Cloud vs. Multi Cloud
There are three primary types of cloud computing environments: public, private, and hybrid clouds:
Public cloud is the most common form of cloud computing. In this model, service providers offer resources, such as servers and storage, over the Internet. Public cloud services are generally affordable and highly scalable, but they may lack the security and control desired by some businesses.
Private cloud is a cloud service that is not shared with any other organization. The servers and storage are dedicated to a single business, providing greater control and security. However, private clouds are more expensive and require more management than public clouds.
Hybrid cloud is a blend of public and private clouds. It allows businesses to keep sensitive information in a private cloud while using the public cloud for non-sensitive data and applications. Hybrid clouds offer the best of both worlds, combining the security of private clouds with the cost-effectiveness and scalability of public clouds.
Multi cloud refers to the use of multiple cloud services from different providers. This approach allows businesses to avoid vendor lock-in, optimize costs, and leverage the unique strengths of each cloud provider. Multi cloud strategies enable greater flexibility and resilience, as workloads can be distributed across various platforms to meet specific requirements and ensure continuity.
Learn more in the detailed guides to:
Multi cloud
Hybrid cloud
Related technology updates: [Report] Optimizing in a Multi-Cloud World
Examples of IaaS Use Cases
IaaS enables organizations to access scalable, on-demand infrastructure without maintaining physical hardware. This model is suited for a wide range of use cases across industries and technical needs.
Test and Development – Quickly provision environments for application development and testing, supporting agile workflows and CI/CD pipelines.
Web Applications – Host web apps with dynamic scaling and built-in load balancing, minimizing upfront infrastructure investment.
Cloud hosting – Distributes website or application data across multiple virtual servers, offering scalability, high availability, and flexibility without physical server management. It supports a wide variety of workloads and operational needs. Learn about Atlantic.net cloud hosting solutions.
Dedicated hosting – Provides organizations with exclusive use of physical servers, delivering consistent performance, control, and security for high-demand or regulated workloads. Learn about Atlantic.net dedicated server hosting.
Storage, Backup, and Recovery – Leverage elastic storage and automated backup solutions without complex on-prem management. Learn more in the detailed guide to cloud storage
High-Performance Computing (HPC) – Run simulations, financial models, or scientific computations using scalable compute clusters available on demand.
Big Data Analytics – Utilize distributed storage and compute resources for real-time analytics, machine learning, and large-scale data processing.
Learning Management Systems (LMS) – Deploy scalable back-ends for LMS platforms that require high uptime and adaptable performance, supporting e-learning for organizations, educational institutions, or corporate training platforms. Learn more in the detailed guide to Learning Management Systems.
Digital Asset Management (DAM) – Store and serve media assets globally with high availability and integrated security controls. Learn more in the detailed guide to Digital Asset Management
Infrastructure as Code (IaC) – Automate infrastructure provisioning and management through code, using tools like Terraform or AWS CloudFormation. IaaS provides the underlying resources that IaC tools configure and orchestrate, enabling consistent, repeatable deployments.
Learn more in the detailed guide to Infrastructure as Code
Related product offering: GitOps Software Delivery Platform by Codefresh
Related technology update: [Blog] How to Model Your GitOps Environments and Promote Releases between Them
What Is CloudOps?
CloudOps is the combination of continuous operations and continuous delivery in the cloud. It is about operating your infrastructure and applications in a way that is optimized, efficient, reliable, secure, and cost-effective.
In the context of IaaS, CloudOps involves managing and maintaining the infrastructure elements provided by the IaaS provider. This could include server instances, storage, and networking components. The goal is to ensure that these resources are optimally configured, secure, and that they are delivering value to the business.
CloudOps also involves monitoring and managing the performance and availability of these resources. This includes setting and managing service levels, as well as identifying and resolving any issues that may arise.
Learn more in our detailed guide to CloudOps
Related product offering: NetApp Spot | Cloud Optimization Solutions
Related technology update: [Report] 2023 State of CloudOps
Learn more in our detailed guide to: Cloud Optimization
Related technology update: [Report] GigaOm 2024 Radar for Cloud Resource Optimization
Learn more in our detailed guide to: Cloud Cost Optimization
What Is FinOps?
FinOps, short for Financial Operations, is a discipline that combines financial management, operations, and cloud engineering to optimize cloud spending and maximize business value. It focuses on gaining financial control and accountability over cloud resources, ensuring that cloud investments are made efficiently and aligned with business objectives.
FinOps involves several key practices:
Visibility: Ensuring that cloud costs are transparent and understandable. This includes detailed cost reporting and usage analytics to track where and how resources are being consumed.
Optimization: Identifying areas where cloud spending can be reduced without compromising performance or reliability. This includes rightsizing instances, leveraging reserved instances, and eliminating unused resources.
Governance: Implementing policies and controls to manage cloud spending. This involves setting budgets, defining cost allocation rules, and establishing spending limits to prevent cost overruns.
Collaboration: Facilitating communication and cooperation between finance, operations, and engineering teams. This ensures that financial considerations are integrated into the cloud management process and that all stakeholders are aligned on cost management goals.
By integrating FinOps into cloud operations, organizations can better manage their cloud costs, enhance financial predictability, and ensure that their cloud investments support overall business strategy.
Learn more in the detailed guide to FinOps
FinOps on AWS
FinOps on AWS involves leveraging various tools and practices provided by Amazon Web Services to manage and optimize cloud costs effectively. Key components include:
AWS Cost Explorer: This tool provides detailed insights into your AWS spending and usage. It helps in analyzing cost trends, identifying cost drivers, and exploring saving opportunities. With Cost Explorer, you can create custom reports and visualize data to understand spending patterns better.
AWS Budgets: AWS Budgets allows you to set custom cost and usage budgets. You can receive alerts when usage or costs exceed the predefined thresholds, enabling proactive management of cloud expenses. This tool also integrates with AWS Cost Explorer for detailed budget analysis.
AWS Trusted Advisor: Trusted Advisor offers real-time recommendations to optimize your AWS environment. It provides insights on cost optimization, security, fault tolerance, and performance improvements. The cost optimization checks include recommendations for unused or idle resources, reserved instance usage, and opportunities for savings plans.
AWS Savings Plans and Reserved Instances: These purchasing options allow you to commit to using a specific amount of compute power or instances over a one- or three-year period, in exchange for significant discounts compared to on-demand pricing. Utilizing these plans effectively can lead to substantial cost savings.
Cost Allocation Tags: Implementing cost allocation tags helps in categorizing and tracking AWS resources. By tagging resources with meaningful labels, organizations can allocate costs to specific projects, departments, or teams, enabling more granular cost management and accountability.
Learn more in the detailed guide to AWS cost optimization
Related product offering: Finout | Enterprise-Grade FinOps Platform
Related technology update: [Webinar] How To Create a Cost-Effective AWS Environment
FinOps on Azure
FinOps on Azure focuses on using Microsoft's suite of tools and services to optimize cloud spending and improve financial management. Key practices include:
Azure Cost Management and Billing: This service provides comprehensive insights into your Azure spending. It includes cost analysis, budgeting, and forecasting tools that help in tracking and managing cloud expenses. You can set budgets and alerts to monitor spending and ensure it stays within the allocated limits.
Azure Advisor: Azure Advisor provides personalized recommendations to optimize your Azure resources for cost, security, performance, and availability. The cost recommendations include advice on rightsizing or shutting down underutilized resources and taking advantage of reserved instances or savings plans.
Azure Reservations and Spot VMs: Azure Reservations allow you to commit to one- or three-year plans for significant cost savings on compute resources. Spot VMs offer unused Azure capacity at discounted rates, ideal for non-critical or flexible workloads.
Azure Cost Allocation and Tagging: By implementing a robust tagging strategy, organizations can allocate costs accurately to different projects, departments, or business units. Tags facilitate detailed cost reporting and accountability, making it easier to track and manage expenses.
Azure Hybrid Benefit: This feature allows you to use your existing on-premises Windows Server and SQL Server licenses with Software Assurance to save on Azure costs. It provides substantial savings for workloads that can leverage this benefit.
FinOps on Google Cloud
FinOps on Google Cloud involves utilizing Google's tools and practices to manage cloud costs effectively. Key components include:
Google Cloud Cost Management: This suite of tools includes detailed cost reporting, budget tracking, and cost forecasting. It allows you to monitor spending, analyze cost trends, and set budget alerts to prevent unexpected expenses.
Google Cloud Pricing Calculator: This tool helps in estimating the cost of Google Cloud services based on your specific usage patterns. It provides a detailed breakdown of costs, enabling you to plan and optimize your cloud spending.
Committed Use Contracts and Sustained Use Discounts: Google Cloud offers discounts for committing to use specific resources over a period (one or three years) and automatic sustained use discounts for consistent usage of certain resources. These options help in reducing overall cloud costs significantly.
Resource Management and Tagging: Implementing a robust tagging strategy in Google Cloud allows for detailed cost tracking and allocation. Tags can be used to categorize resources by project, team, or department, facilitating more accurate financial reporting and accountability.
Google Cloud Recommender: This tool provides actionable recommendations to optimize your Google Cloud environment. It includes suggestions for rightsizing VMs, removing unused resources, and optimizing storage, helping to reduce costs without impacting performance.
Learn more in the in-depth guide to cloud cost management
Related technology updates:
[Webinar] Driving a Successful Company-Wide FinOps Cultural Change
[Webinar] Mastering Kubernetes Spend-Efficiency
Top Cloud Computing Providers
General Purpose Cloud Providers
Amazon Web Services—AWS was the first major IaaS provider in 2008, and is today the leading provider of public cloud computing. It provides a complete computing stack that enables organizations to deploy almost any combination or software and hardware infrastructure.
Microsoft Azure—Microsoft Azure is the world’s second largest cloud provider. It is the obvious choice for hosting Microsoft-based systems on the cloud, and is a common choice for government agencies. It also runs an increasing number of non-Microsoft workloads, including Linux, HPC, and SAP systems.
Google Cloud—offers a more limited set of services compared to AWS and Azure, but competes on price and provides the Anthos Platform, which makes it easier to create multi cloud solutions and avoid vendor lock in.
IBM Cloud—a group of enterprise cloud computing services developed by IBM. Includes IaaS, SaaS, and PaaS solutions supporting public, private, and hybrid cloud models.
Alibaba Cloud—the leading cloud provider in China, which is forging alliances to become a key player across Asia.
Hewlett Packard Enterprise—Hewlett Packard Enterprise's hybrid cloud strategy focuses on its hardware stack, including Aruba wireless networking and edge computing solutions, and software platforms like Greenlake, SimPVT, and Synergy. HPE has partnerships with Red Hat, VMware, and the major cloud providers.
Oracle Cloud—Oracle’s public cloud has a competitive advantage in IoT, OLTP, microservices, artificial intelligence and machine learning. It provides its popular database software as IaaS and PaaS offerings, and also provides the Oracle Data Cloud, which enables big data analytics for business data.
Dell Technologies/VMware—Dell acquired VMware and is using it to provide a true multi cloud offering. VMware is today fully container based, and enables companies to run the same workloads on leading public clouds like Amazon, Azure and Google Cloud, as well as on premises. VMware complements its cloud offering with its acquisition of CloudHealth, a cloud cost management solution.
Cloud-Native Analytics Platforms
Cloud-native analytics platforms are designed to run entirely in the cloud, offering scalable, flexible, and efficient solutions for data storage, processing, and analysis. These platforms separate compute and storage resources, enabling independent scaling and cost optimization. They support various data types and provide advanced analytics capabilities, including real-time processing and machine learning integration.
Here are some leading cloud-native analytics platforms:
Snowflake: A cloud-based data warehouse that separates compute and storage, allowing for independent scaling. Supports structured and semi-structured data formats like JSON and Parquet. Offers features like automatic scaling, data sharing, and support for multiple cloud providers. Utilizes ANSI SQL for querying and provides near-zero maintenance. Learn more in the in-depth guide to Snowflake pricing.
Amazon Redshift: A fully managed, petabyte-scale data warehouse service by AWS. Employs columnar storage and parallel processing to handle large datasets efficiently. Integrates with AWS services like S3 and supports querying data directly from S3 using Redshift Spectrum. Offers features like concurrency scaling and materialized views.
Google BigQuery: A serverless, highly scalable data warehouse that enables super-fast SQL queries using the processing power of Google's infrastructure. Automatically handles resource provisioning and scaling. Supports real-time analytics and integrates with various Google Cloud services. Pricing is based on the amount of data processed per query.
Azure Synapse Analytics: An analytics service that brings together big data and data warehousing. Allows querying data using serverless on-demand or provisioned resources. Integrates with Azure services like Power BI and Azure Machine Learning. Supports both structured and unstructured data and provides a unified experience for ingesting, preparing, managing, and serving data.
Databricks: A unified data analytics platform built on Apache Spark. Combines data engineering, data science, and machine learning workflows. Supports various data formats and provides collaborative notebooks for data exploration. Offers features like Delta Lake for reliable data lakes and MLflow for managing the machine learning lifecycle.
IaaS Pricing: AWS vs Azure vs Google Cloud
The following table will help you understand the basic pricing model offered by the big three cloud providers.
Price Parameter
AWS
Azure
Google Cloud
Compute Instances
General Purpose, Computer Optimized, Memory Optimized instances
Price per second determined by the number of CPUs, memory, and other hardware resources
Reserved Instances
Commit to 1-3 years with three payment options: upfront, partial payment and the balance monthly, or monthly payment
Commit to 1-3 years and pay balance upfront
Offers a discount for commitment to 1 or 3 years, with monthly payments
Spot Instances
Bid for unused EC2 capacity at a potentially lower price. Prices fluctuate based on supply and demand.
Instances can be terminated by AWS with a two-minute notification if demand rises or spot price exceeds the bid.
Bid for unused Azure compute capacity at reduced prices. Prices can change based on availability and demand.
Virtual Machines can be evicted based on capacity or the set max price.
Offered at a lower fixed price than standard VMs. Can be terminated by Google Cloud if resources are needed elsewhere.
Designed for batch jobs and fault-tolerant workloads; run for up to 24 hours.
Object Storage—Frequent Access
Basic rate for first 50 TB, discounts for 51-500 TB and over 500 TB
Flat rate per GB per month
Object Storage—Infrequent Access
Three tiers: Infrequent access, One Zone Infrequent Access, Archive Storage
Two tiers: Infrequent access, Archive storage
Two tiers: Nearline storage, Coldline storage
Block Storage
Two tiers: HDD, SSD, and free tier up to 30GB
Two tiers: HDD, SSD
Offers standard local/regional volumes, SSD local/regional volumes, multi-regional snapshot storage
Rating Frequency
Per-Hour for most services, Per-Second for EC2 and Reserved instances
Per-Hour for most services, Per-Second offered for Windows VMs and Container instances
Per-Second pricing for all services
Official Pricing Information
Official pricing
Cost calculator
Official pricing Cost calculator
Learn more in our guides comparing cloud services pricing:
Google Cloud Pricing
Cloud Cost
Spot Instances
Cloud Computing Costs
Related technology updates: [Report] GigaOm 2024 Radar for Cloud Resource Optimization
Learn more in our detailed guide to: AWS EC2 Pricing
Related technology updates:
[Report] Optimizing in a Multi-Cloud World
[Announcement] Cost Intelligence and Billing Launch
Learn more in our detailed guide to: Cloud Cost
Related product offering: Spot Eco | Cloud Commitments and Cost Management
What Is IoT in the Cloud?
The Internet of Things, or IoT, refers to the network of physical devices connected to the internet, all collecting and sharing data. When we talk about IoT in the cloud, we're referring to using cloud computing to process and store the data collected by these devices.
IoT in the cloud allows businesses to improve efficiency and make more informed decisions. By using cloud-based analytics, companies can extract valuable insights from vast amounts of data generated by IoT devices. These insights can then be used to drive business growth and innovation.
Moreover, cloud-based IoT platforms can handle the massive influx of data from various devices and sensors in real-time. They provide the necessary scalability and storage capacity to manage this data effectively. Also, cloud-based IoT solutions offer advanced security features to ensure that the data remains protected from potential threats.
IaaS High Availability
High availability is an important principle of cloud computing. This is especially important for mission critical systems where downtime due to business interruptions is unacceptable. Downtime can hurt productivity and lead to financial losses.
IaaS services are known for their ability to provide a high level of redundancy, spreading applications across multiple physical machines in different locations. They can also provide auto scaling, a mechanism that allows systems to automatically scale up to additional machines on the cloud when loads increase.
AWS High Availability Architecture
Amazon Web Services has built a massive global infrastructure to provide high availability and flexibility for customer workloads.
Amazon offers cloud services in 24 regions (see the map of the Amazon regions). Amazon defines a region as a geographic area with at least three different data centers known as availability zones (AZs).
Each AWS availability zone is a fully localized infrastructure with redundant power supplies, networks, and Internet connectivity. Currently, Amazon supports 77 Availability Zones worldwide. Each AZ typically has three or more data centers in one location, separated by a “meaningful distance” of up to 100 km. This ensures a physical disaster is unlikely to take down all data centers in the AZ, and yet enables high-speed connections between the data centers.
Learn more in the in-depth guide to AWS auto scaling.
Azure High Availability Architecture
Like AWS, Azure also bases its high availability architecture on regions and availability zones. Azure always stores three copies of user data across three availability zones. This is called redundant local storage. Customers can opt for global redundant storage, to create up to three additional copies of their data in a “paired region”, a nearby region that has fast connectivity with the first region, for added flexibility.
Azure availability zones achieve high availability by distributing resources across multiple data centers in a customer’s region. Azure provides additional services like Azure Site Recovery and Azure Backup to achieve the required recovery point objective (RPO) and recovery time objective (RTO) for their applications.
Google Cloud SQL High Availability Architecture
In Google Cloud, resources that operate in one zone are called “zonal resources”. Other resources operate across an entire region and are called “regional resources”. For example, a Google Cloud virtual machine instance or persistent disk is a zonal resource, while a static IP address is a regional resource.
Google adds the concept of clusters—clusters are groups of physical computers inside a physical data center, with independent power, cooling, networking, and security infrastructure. This allows Google Compute Engine to balance customer resources across clusters in the same zone, while retaining high connectivity between the physical machines in each cluster.
AWS CloudFormation
Amazon Web Services (AWS) CloudFormation is a service that helps you automate the process of creating and managing infrastructure resources in the AWS Cloud. It allows you to use a template to create and provision resources in your AWS account. This template is written in JSON or YAML, and it specifies the resources and their properties that you want to create.
CloudFormation allows you to create, update, and delete resources in a predictable and automated way. It helps you standardize and automate the way you create and manage resources, making it easier to manage and maintain your infrastructure. CloudFormation also provides versioning for your templates, so you can track changes to your infrastructure over time.
You can use CloudFormation to create and manage resources such as Amazon EC2 instances, Amazon S3 buckets, and Amazon Virtual Private Clouds (VPCs). You can also use CloudFormation to create custom resources, using AWS Lambda functions or other AWS services.
Learn more in the in-depth guide to: AWS CloudFormation.
Related product offering: Faddom | Instant Application Dependency Mapping Tool
Related technology updates: [Announcement] AWS Well Architected Reviews with CloudCheckr
AWS IaaS Services
Amazon S3
Amazon Simple Storage Service (S3) is the first and most popular Amazon service, which provides object storage at unlimited scale. S3 is easy to access via the Internet and programmatically via API, and is integrated into a wide range of applications. It provides 11 9’s of durability (99.999999999%), and offers several storage tiers, allowing users to move data that is used less frequently into a low-cost archive tier within S3.
AWS EC2
Amazon Elastic Compute Cloud (Amazon EC2) offers scalable computing resources. It lets you run as many virtual servers as you want, configure your network and security, and manage storage. You can increase or decrease resources on-demand according to changing business requirements, and set up auto scaling to scale resources up and down according to actual workloads.
AWS EBS
Amazon Elastic Block Store (Amazon EBS) is a block-level storage service for use with Amazon EC2 instances. When mounted on an Amazon EC2 instance, you can use Amazon EBS volumes like any other raw block storage device. It can be formatted and mirrored for specific file systems, host operating systems, and applications.
AWS EFS
Amazon Elastic File System (Amazon EFS) provides a simple, scalable, and fully managed elastic NFS file system for use with AWS cloud services and on-premises resources. It can support up to petabytes of data, automatically scaling as files are added and removed, eliminating the need to configure and manage storage capacity.
AWS EMR
Amazon Elastic MapReduce (EMR) is a cloud-based big data platform for processing vast amounts of data using common open-source tools such as Apache Spark, HBase, Presto, and Flink. EMR is used for data analysis, machine learning, financial analysis, scientific simulation, and bioinformatics.
Customers can create EMR clusters using large or small instances depending on their compute and memory requirements. EMR integrates with AWS data stores such as Amazon S3 and DynamoDB, allowing you to analyze and visualize your data with business intelligence tools.
AWS Lambda
AWS Lambda is a serverless, on-demand IT service that provides developers with a fully managed, event-driven cloud system that executes code. AWS Lambda uses Lambda functions—anonymous functions that are not associated with identifiers—enabling users to package any code into a function and run it, independently of other infrastructure.
AWS FSx
Amazon FSx is a fully-managed service that lets you launch, run, and scale high-performance file systems in the AWS cloud. AWS handles management tasks such as hardware provisioning, backups, and patching. The underlying infrastructure powering this service consists of the latest AWS networking, compute, and disk technologies.
AWS FSx offers various capabilities delivered as a reliable, secure, and scalable cloud service that achieves high performance and lower TCO. The service lets you choose a file system to support your storage, including NetApp ONTAP, Lustre, and Windows File Server. FSx
provides full access to all feature sets, data management capabilities, and performance profiles.
AWS ECS
AWS Elastic Container Service (ECS) is a highly scalable, high-performance container orchestration service that supports Docker containers and allows you to easily run and scale containerized applications on AWS. ECS eliminates the need for you to install, operate, and scale your own cluster management infrastructure. With simple API calls, you can launch and stop Docker-enabled applications, query the complete state of your application, and access many familiar features like security groups, Elastic Load Balancing, EBS volumes, and IAM roles.
ECS can be used in conjunction with AWS Fargate, a compute engine for Amazon ECS that allows you to run containers without having to manage servers or clusters. With AWS Fargate, you no longer have to provision, configure, and scale clusters of virtual machines to run containers. This removes the need to choose server types, decide when to scale your clusters, or optimize cluster packing.
AWS Fargate
AWS Fargate is a serverless compute engine for containers that works with both Amazon Elastic Container Service (ECS) and Amazon Elastic Kubernetes Service (EKS). Fargate enables you to focus on building and deploying applications without the complexity of managing the underlying infrastructure. It allocates the right amount of compute, eliminating the need to choose instances and scale cluster capacity.
Fargate is designed for applications that require a balance of compute, memory, and networking resources and integrates with AWS services to provide a secure and efficient container execution environment. Pricing is based on the actual compute and memory resources used by the containerized application, offering a pay-as-you-go model that can lead to cost savings. However, in general Fargate is more expensive compared to EC2, for the same computing capacity.
AWS EKS
AWS Elastic Kubernetes Service (EKS) is a managed service that makes it easier for users to run Kubernetes on AWS without needing to install, operate, and maintain their Kubernetes control plane or nodes. Kubernetes is an open-source system for automating deployment, scaling, and management of containerized applications.
EKS runs the Kubernetes management infrastructure across multiple AWS availability zones, automatically detecting and replacing unhealthy control plane nodes, and providing on-demand, zero-downtime upgrades and patching.
AWS Bedrock
AWS Bedrock is a fully managed service that allows developers to build and scale generative AI applications using foundation models from various AI providers. It eliminates the need to manage underlying infrastructure and provides seamless integration with AWS services.
Bedrock supports multiple foundation models, enabling users to choose the best model for their use case, whether for text generation, image creation, or chatbot applications. It also offers fine-tuning capabilities and responsible AI tools to help businesses deploy AI solutions securely and ethically.
Learn more in the in-depth guide to AWS Bedrock
Related product offering: Anodot | Intelligent Cost Optimization Platform
Related technology updates:
[Blog] State of Cloud Cost Report 2024
AWS Secrets Manager
AWS Secrets Manager is a managed service that helps you securely store, manage, and retrieve sensitive information such as database credentials, API keys, and other secrets. It eliminates the need for hardcoding secrets in application code by providing automatic retrieval and rotation.
Secrets Manager integrates with AWS Identity and Access Management (IAM) and AWS Key Management Service (KMS) to enforce security best practices. It also provides audit logs via AWS CloudTrail, helping organizations meet compliance requirements.
Learn more in the in-depth guide to AWS Secrets Manager
Related product offering: Configu: Configuration Management Platform | Configuration-as-Code Automation for Secure Collaboration
Related technology update: [Blog] The state of config file formats: XML vs. YAML vs. JSON vs. HCL
AWS SNS
Amazon Simple Notification Service (SNS) is a fully managed messaging service that enables the delivery of notifications between distributed systems, microservices, and applications. It supports multiple messaging protocols, including SMS, email, HTTP/S, and AWS Lambda.
SNS allows developers to implement pub/sub messaging architectures, where messages are published to topics and then distributed to multiple subscribers. It integrates with AWS services like SQS and CloudWatch, enabling event-driven architectures at scale.
AWS CloudWatch
Amazon CloudWatch is a monitoring and observability service that provides real-time insights into AWS resources, applications, and services. It collects and analyzes metrics, logs, and events, helping users detect anomalies, troubleshoot issues, and optimize performance.
CloudWatch includes features like alarms, dashboards, and automated actions. It integrates with AWS Lambda, EC2, ECS, and other services to enable proactive monitoring and automated responses to infrastructure events.
AWS Auto Scaling
AWS Auto Scaling monitors your applications and automatically adjusts capacity to maintain steady, predictable performance at the lowest possible cost. It provides a powerful interface that lets you build scaling plans for resources including Amazon EC2 instances and Spot Fleets, Amazon ECS tasks, Amazon DynamoDB tables and indexes, and Amazon Aurora Replicas.
AWS Auto Scaling lets you optimize costs and improve performance. It makes it possible to set scaling policies and set scaling targets manually, or have these created automatically based on an analysis of application loads.
Learn more in the in-depth guide to AWS autoscaling
Related product offering: Spot Elastigroup | Spot Instance Automation
Related technology update: [Blog] Horizontal vs. Vertical Scaling
Azure IaaS Services
Linux Virtual Machines in Azure
Traditionally Azure focused on Windows virtual machines, but now has a robust offering for Linux users as well. Azure virtual machines (VMs) are scalable on-demand compute resources provided by Azure.
Microsoft Azure supports popular Linux distributions deployed and managed by multiple partners. Linux machine images are available in the Azure Marketplace for the following Linux distributions (more distributions are added on an ongoing basis):
FreeBSD
Red Hat Enterprise
CentOS
SUSE Linux Enterprise
Debian
Ubuntu
CoreOS
RancherOS
Azure Files
Azure Files is a cloud file storage service that provides access to server message block (SMB) file shares. These shares can be configured as part of an Azure storage account. Azure Files enables cloud-based virtual machines and on-premise applications to share files using standard protocols.
Azure Managed Disk
Azure managed disks are block-level storage volumes managed by Azure and used by Azure virtual machines. A managed disk is similar to a physical disk on a local server, but it is virtualized. For managed disks, you only need to specify the disk size and disk type, and provision—Azure does the rest. The available hard drive types are:
Standard hard disks (HDD)
Standard SSD
Premium SSDs
Ultra disks—optimized for sub-millisecond latency
Azure Blob Storage
Azure Blob Storage is Microsoft's object storage service, similar to Amazon S3. Blob storage is suitable for storing large amounts of unstructured data. Blob storage offers sixteen 9’s of durability, and advanced security features including RBAC, encryption at rest and advanced threat protection. IT also supports lifecycle management and immutable storage (WORM), which can help protect against data loss and threats like Ransomware.
HPC on Azure
Azure provides high performance computing (HPC) resources, which you can deploy purely on the public cloud, or combine with local HPC resources to create a hybrid HPC deployment. Azure provides an HPC head node which is used to schedule jobs and workloads, and a virtual machine scale set, with large numbers of VMs that can be used to run massively parallel workloads. These VMs can include both CPU and GPU hardware, depending on the type of processing required.
Learn more in the in-depth guide about HPC on Azure
SAP on Azure
A large variety of SAP applications can be deployed to Azure, using predefined virtual machines created and certified by SAP.
SAP HANA
You can run the SAP HANA in-memory database on Azure, using M-series VMs that scale up to 4TB memory, certified for use with SAP HANA. Another option is Mv2 VMs, the largest SAP HANA certified VMs in the public cloud, with 6TB of memory. Azure offers a service level agreement (SLA) of 99.99% for instances in high availability pairs, and 99.9% for standalone instances.
SAP S/4HANA
You can deploy SAP S/4HANA on Azure, with remote connection via Azure ExpressRoute for Fiori applications. Azure provides an SLA of 99.99% SLA if you run S/4HANA in two Azure availability zones. It also provides backup and recovery in second, even for databases with multiple TBs of data.
VDI on Azure
Microsoft Virtual Desktop Infrastructure (VDI) offers multi-tenant support for Windows 10 and a Windows Virtual Desktop license. Azure provides the FSLogix configuration file container, which decouples user configuration files from the underlying operating system. Azure recently launched MSIX AppAttach, which allows you to package a Win32 application in an MSIX application container.
Google Cloud IaaS Services
Google Cloud Storage
Google Cloud Storage is an object storage service by Google Cloud. It provides features like object versioning and extended permissions (per item or bucket). Google Cloud offers two archive storage tiers with lower pricing and fast retrieval times, called Nearline and Coldline.
Google Cloud Filestore
Google Cloud Filestore uses NFS version 3 and is designed for workloads requiring low latency and minimal performance fluctuations. This service has two levels of performance: standard and premium. The premium tier can support very high performance—700 Mbps for reads, 350 Mbps for writes, and a maximum of IOPS of 30,000.
Google Persistent Disk
In Google Cloud, a Persistent Disk is a storage device that you can access from a virtual machine, like a physical hard drive. The data is spread across multiple physical hard drives in the Google data center. Google Compute Engine manages the distribution of data for optimal redundancy and performance.
Adopting IaaS: Cloud Migration Strategies
Following are the most common approaches to cloud migration, taken from the influential “5 Rs” model proposed by Gartner.
Rehosting
Re-hosting (also known as "lift and shift") is the fastest way to move your application to the cloud. This is usually the first approach taken in a cloud migration project because it allows moving the application to the cloud without any changes. Both physical and virtual servers are migrated to infrastructure as a service (IaaS). Lift and shift is commonly used to improve performance and reliability for legacy applications.
Replatforming, Refactoring, or Re-architecture
This migration strategy involves detailed planning and a high investment, but it is the only strategy that can help you get the most out of the cloud. Applications that undergo replatforming or re-architecture are completely rebuilt on cloud-native infrastructure. They scale up and down on-demand, are portable between cloud resources and even between different cloud providers.
Repurchasing
In most cases, repurchasing is as easy as moving from an on-premise application to a SaaS platform. Typical examples are switching from internal CRM to Salesforce.com, or switching from internal email server to Google’s G Suite. It is a simple license change, which can reduce labor, maintenance, and storage costs for the organization.
Retire
When planning a move to the cloud, it often turns out that part of the company's IT product portfolio is no longer useful and can be decommissioned. Removing old applications allows you to focus time and budget on high priority applications and improve overall productivity.
Retain
Moving to the cloud doesn't make sense for all applications. You need a strong business model to justify migration costs and downtime. Additionally, some industries require strict compliance with laws that prevent data migration to the cloud. Some on-premises solutions should be kept on-premises, and can be supported in a hybrid cloud migration model.
Now that we’ve covered some of the general strategies for migrating workloads to the cloud, let’s dive deeper into specific best practices for migrating to each of the big three cloud providers: AWS, Azure, and Google Cloud
AWS Migration Best Practices
Leverage AWS Tools
AWS offers a wide range of tools designed for the migration process, from the initial planning phase to features for post-migration. Here are several useful tools to consider:
AWS Migration Hub - a dashboard that centralizes data and helps you monitor and track the progress of migration.
AWS Application Discovery - collects data needed for pre-migration due diligence.
TSO Logic - offers data-driven recommendations based on predictive analytics. The recommendations are tailored to help during the planning and strategizing phase.
AWS Server Migration Service - provides automation, scheduling, and tracking capabilities for incremental migrations.
AWS Database Migration Service - keeps the source data store fully-operational while the migration is in process, to minimize downtime.
Amazon S3 Transfer Acceleration - improves the speed of data transfers made to Amazon S3, to maximize available bandwidth.
Automate Repetitive Tasks
The migration process typically involves many repetitive tasks. You can perform these tasks manually, and you can automate them. The main purpose of automation is to enable you to achieve a higher level of efficiency while reducing costs. In many cases, automation can also help you complete tasks much faster than manually possible.
Outline and Share a Clear Cloud Governance Model
A cloud governance model defines and specifies the practices, roles, responsibilities, tools, and procedures involved in the governance of your cloud environments. Your model needs to be as clear as possible, to ensure all relevant stakeholders understand how cloud resources should be managed and used. Ideally, you should define this information before migrating.
Here are several questions your cloud governance model should answer:
What controls are set in place to meet security and privacy requirements?
How many AWS accounts are maintained?
What privileges are enabled for each role?
There are many more considerations to address in your cloud governance model, depending on your industry and business needs. Be sure to keep your documentation flexible to allow for change and optimization after the migration process is completed and your workloads settle in the new cloud environment.
Azure Migration Best Practices
Azure Migration Tools
Azure offers several migration tools designed to simplify and automate the migration process. Here are three commonly used Azure migration tools:
Azure Migrate—helps you to assess your local workloads, determine the required size of cloud resources, and estimate cloud costs.
Microsoft Assessment and Planning—helps you discover your servers and applications and build an inventory. Additionally, this tool can create reports that determine whether Azure can support your workloads.
Azure Database Migration Service—helps you migrate on-premise SQL Server workloads to Azure.
Cost Management in Azure
Cloud resources are highly accessible and flexible, but costs can quickly skyrocket if you don’t have a cost management strategy in place. Here are several tools and techniques you can use to manage your cloud costs:
Tag your resources - to manage costs, you need visibility into cloud resource consumption. You can set this up by tagging resources and monitoring them. Be sure to use standard tags and keep this organized.
Use policies - to automate tagging and monitoring. Cloud resources are highly scalable and this can make manual tagging and monitoring incredibly time consuming. Use policies to standardize the process and automation to enforce these rules.
You can leverage either third-party and first-party tools for tagging. There are also tools dedicated to cost management and optimization and monitoring. In addition, you can set up role-based access control (RBAC) to ensure resources are properly used by authorized users, and set up several resource groups.
Review Every Policy and Procedure
Policies and procedures are a foundational component of the migration process and heavily impact the success of the implementation. To ensure your migration runs smoothly, you should define and review all policies and then apply them in a cohesive and standardized manner.
Properly implementing security can ensure all required security measures are set in place. Policies are not only responsible for enforcing security, but also help you achieve and maintain compliance. Data encryption, for example, is a component you can enforce using a policy.
Once you define your policies and procedures, you should test them before running in production. You can automate this process using several tools. Azure Migrate, for example, can help you automatically identify, assess, and migrate your local VMs to the Azure cloud.
Google Cloud Migration Best Practices
Moving Data
Here are several aspects to consider when migrating to Google Cloud:
Move your data first - and then move the rest of the application. This is recommended by Google.
Choose the relevant storage - Google Cloud offers several tiers for hot and warm storage, as well as several archiving options. You can also leverage SSDs and hard discks, or choose a cloud-based database service, such as Bigtable, Datastore, and Google Cloud SQL.
Plan the data transfer process - determine and define how to physically move your data. You can, for example, send your offline disk to a Google data center or opt to stream to persistent disks.
Moving Applications
There are several ways to migrate applications, depending on the application’s suitability to the cloud. In some cases, you might need to re-architect the entire application before it can be moved to the cloud. In other cases, you might need to do light modification before the migration. Ideally, when possible, your application can be lifted and shifted to the cloud.
A lift and shift migration means you do not need to make any changes to your application. You can lift it and move it directly to the new cloud environment. For example, you can create a local VM within your on-premise center, and then import it as a Google VM. Alternatively, you can backup your application to GCP - this option lets you automatically create a cloud copy.
Optimize
After the migration process is complete and your application is safely hosted in the cloud, you need to set up measures that help you continuously optimize your cloud environment. Here are several tools offered by Google:
Google Cloud operations suite (Stackdriver) - provides features that enable full observability into your Google cloud environment. The information is centralized in a single database that lets you run queries and leverage root-cause analysis to gain detailed insights.
Google Cloud Pub/Sub - helps you set up communication between any independent applications. You can use Pub/Sub to rapidly scale, decouple applications, and improve performance.
Google Cloud Deployment Manager - lets you automate the configuration of your applications. You specify the requirements and Deployment Manager automatically initiates the deployments.
Running Mission Critical Applications in the Cloud
A mission-critical application relies on continuous availability and cannot undergo even a brief downtime. This can lead to financial, reputational, and operational damages to an entire business or a segment.
When provisioning a mission critical application, you need to ensure stability and availability at all times. You can achieve this by creating redundant copies of your application and hot backups. Additionally, you can duplicate your production and staging environments and test them.
Large enterprises typically use the following three types of mission critical applications:
Backup and disaster recovery - strategies are critical to ensure business continuity. Your recovery strategy should provide a short recovery time objective (RTO) and minimize the recovery point objective (RPO).
Enterprise Resource Planning (ERP) - systems manage business processes, providing capabilities to manage finances, manufacturing, distribution, the supply chain, human resources, and more. ERPs must remain operational at all times.
Virtual Desktop Infrastructure (VDI) - solutions help you remotely deliver a desktop image to endpoint devices via an Internet network. VDI technology enables users to access mission critical applications on their smartphones, laptops, and other thin-client devices.
Traditionally, mission-critical applications are hosted on-premises, but today many of these applications are moving to cloud environments. The cloud can provide enterprises with a high level of flexibility and scalability. Ideally, if cloud resources are properly utilized and optimized, enterprises can significantly reduce their costs by moving to the cloud.
There are, however, several challenges enterprises face when migrating their mission-critical applications to the cloud. The migration process is a major challenge for many enterprises. The process itself can take time, for one, and comes with a unique set of risks. For many enterprises, security and compliance are critical and must be maintained at all times.
The cost of migration and unforeseen overhead can also run high. However, it is possible to address these challenges. To successfully migrate mission critical applications, enterprises can leverage techniques and solutions designed for the migration process. Planning the migration is especially helpful to minimize overhead and ensure known challenges are addressed in advance.
Deep Learning in the Cloud
Deep learning is at the center of most artificial intelligence (AI) initiatives. It is based on the concept of a deep neural network, which passes inputs through multiple layers of connections. Neural networks can perform many complex cognitive tasks, improving performance dramatically compared to traditional machine learning algorithms. However, they often require huge data volumes to train and can be very computationally intensive.
Deep learning is often a time-consuming and costly endeavor, especially regarding training models. Many factors can impact the process, but processing power is critical to ensure the pipeline works effectively. Graphics processing units (GPUs) provide the processing power needed for computationally intensive operations, but setting this up is not affordable for all organizations.
Cloud computing vendors provide various services to help make deep learning more affordable and accessible. Services may vary between vendors, but most can help you manage large datasets and train algorithms on distributed hardware. Here are notable offerings from the top cloud vendors - Amazon Web Services (AWS), Microsoft Azure, and Google Cloud:
AWS
AWS provides four instance options, available in multiple sizes. These include EC2 P2, P3, G3, and G4 instances. With these instances, you can choose to access NVIDIA Tesla M60, T4 Tensor, K80, or V100 GPUs and can include up to 16 GPUs per instance.
With AWS, you also have the option of using Amazon Elastic Graphics. This service enables you to connect your EC2 instances to various low-cost GPUs. You can attach GPUs to any instance compatible for greater workload flexibility. The Elastic Graphics service also provides up to 8GB of memory and supports OpenGL 4.3.
Azure
Azure provides several choices for GPU-based instances. These instances are designed for high computation tasks, including deep learning, simulations, and visualizations.
In Azure, you can choose from three instance series:
NC-series—optimized for compute and network-intensive workloads. These instances can support OpenCL and CUDA-based applications and simulations. Available GPUs include NVIDIA Tesla V100, Intel Broadwell, and Intel HaswellGPUs.
NV-series—optimized for visualizations, encoding, streaming and virtual desktop infrastructures (VDI). These instances support OpenGL and DirectX. Available GPUs include AMD Radeon Instinct MI25 and NVIDIA Tesla M60 GPUs.
ND-series—optimized for deep learning training scenarios and inference. Available GPUs include NVIDIA Tesla P40, Intel Skylake, and Intel Broadwell GPUs.
Google Cloud
Although Google Cloud doesn’t offer dedicated instances with GPUs, it does enable you to connect GPUs to existing instances. This works with standard instances and Google Kubernetes Engine (GKE) instances. It also enables you to deploy node pools, including GPUs. Support is available for NVIDIA Tesla V100, P4, T4, K80, and P100 GPUs.
Another option in Google Cloud is access to TensorFlow processing units (TPUs). These units are made of multiple GPUs. TPUs are designed to perform matrix multiplication quickly and can provide performance similar to Tensor Core enabled Tesla V100 instances. Currently, PyTorch provides partial support for TPUs.
Kubernetes in the Cloud
Kubernetes on AWS
Kubernetes lets you use existing on-premises and cloud-based tools to run containerized applications. It can manage clusters of AWS EC2 instances, deploying, running, maintaining, and scaling containers on EC2 instances.
AWS helps you easily manage Kubernetes infrastructure with Amazon EC2 or employ Amazon EKS for automatic provisioning and management. You can also leverage community-backed integrations to AWS services, such as IAM, VPC, and service discovery.
Kubernetes on Azure
Azure Kubernetes Service (AKS) enables you to deploy a managed Kubernetes cluster in the Azure cloud. AKS is a hosted Kubernetes service that reduces the operational overhead and complexity of managing Kubernetes by managing these responsibilities. Azure handles health monitoring and maintenance and manages Kubernetes masters, so you can focus on managing and maintaining agent nodes.
Kubernetes on Google Cloud
Google Kubernetes Engine (GKE) is an orchestration system for Docker containers and container clusters running in Google's public cloud. It is based on Kubernetes, which Google originally developed for container management. You can use the gcloud CLI or the Google Cloud Platform Console to interact with this service.
GKE employs a group of instances to run Kubernetes. It allocates a master node to manage a cluster of Docker containers and runs a Kubernetes API server that interacts with the cluster and performs various tasks, including scheduling containers. A cluster may also include one or more additional nodes that run a Docker runtime and kubelet agent to manage containers.
See Additional Guides on IaaS Topics
What Is Cloud Hosting
Related guides
Authored by Atlantic.Net
What Is Cloud Hosting?
What Is a DNS? Complete Domain Name System Guide
What is VMware?
Related product offering: Atlantic.Net Dedicated Server Hosting | High Performance Dedicated Servers
Offered by Atlantic.Net
Managed Private Cloud Hosting
Atlantic.Net Orlando Colocation Data Center
Server Management Services
Related technology updates:
[Blog] What Is the Difference Between a Dedicated Server and a Dedicated Cloud Host?
What Is Dedicated Server Hosting
Related guides
Authored by Atlantic.Net
What Is Dedicated Server Hosting: Benefits, Types, and Costs
GPU Dedicated Server Hosting: A Buyer’s Guide
Related product offering: Atlantic.Net Dedicated Server Hosting | High Performance Dedicated Servers
Offered by Atlantic.Net
USA Dedicated Server Hosting
Bare Metal Server Hosting
Dedicated Hosts
Related technology updates:
[Blog] How to Secure SSH Server on Arch Linux
[Blog] 9 Essential Features of Dedicated Server Hosting
Hybrid Cloud
Related guides
Authored by Faddom
Hybrid Cloud: Architecture, Use Cases & 5 Critical Best Practices
Hybrid Cloud Architecture: Is It Right for Your Business?
Hybrid Cloud with AWS: 5 Tools and a Reference Architecture
Related product offering: Faddom | Instant Application Dependency Mapping Tool
Related technology updates: [Report] Optimizing in a Multi-Cloud World
Infrastructure as Code
Related guides
Authored by Codefresh
Infrastructure as Code: Benefits, Platforms & Tips for Success
Infrastructure as Code on AWS: Process, Tools & Best Practices
Why You Need Immutable Infrastructure and 4 Tips for Success
Related product offering: GitOps Software Delivery Platform
Offered by Codefresh
CI/CD Platform with GitOps
Enterprise Support for Argo
Secure Distribution for Argo CD and Argo Rollouts
Related technology update: [Blog] How to Model Your GitOps Environments and Promote Releases between Them
Load Balancer
Related guides
Authored by Radware
What is a Load Balancer? History, Key Functions, Pros and Cons
What is Global Server Load Balancing (GSLB)?
Related product offering: Application Delivery and Security
Offered by Radware
Application Delivery For Hybrid Environments
SSL Inspection, Offloading and Acceleration
AWS Cloudformation
Related guides
Authored by Faddom
AWS CloudFormation Beginners Guide
Creating a custom resource in AWS CloudFormation
Related product offering: Instant Application Dependency Mapping Tool
Offered by Faddom
Asset Documentation & Discovery
Application Change Management
Data Center Migration
Related technology updates: [Announcement] AWS Well Architected Reviews with CloudCheckr
Cloud Computing Costs
Related guides
Authored by Faddom
AWS EC2 Pricing: A Beginners Guide
Azure VMs Pricing Beginners Guide
Cloud Computing Costs & Pricing Comparison for 2023
Related product offering: Instant Application Dependency Mapping Tool
Offered by Faddom
Resource and Cost Optimization
Network Security
Compliance and IT Audit
Related technology updates: [Report] GigaOm 2024 Radar for Cloud Resource Optimization
Cloud Cost Management
Related guides
Authored by Finout
Why Cloud Cost Management, 5 Tools to Know, and Tips for Success
What Is IT Financial Management (ITFM) and 5 Steps to Adoption
Cloud Storage Pricing - Updated for 2025
Related product offering: Enterprise-Grade FinOps Platform
Offered by Finout
Cloud Cost Anomaly Detection Tools
Dashboards & Reporting
How to manage AI cloud spend
Related technology updates:
[Webinar] Driving a Successful Company-Wide FinOps Cultural Change
[Webinar] Mastering Kubernetes Spend-Efficiency
FinOps
Related guides
Authored by Finout
Cloud FinOps: Ultimate Guide to Principles, Tools & Practices
AWS FinOps: Why, How, and 6 Tools to Get You Started
FinOps: Principles and Lifecycle Guide
Related product offering: Enterprise-Grade FinOps Platform
Offered by Finout
Oracle | Integration
Snowflake Cost Optimization & Cost Management Tool
Datadog Cloud Cost Management & Cost Optimization Tool
AWS Cost Optimization
Related guides
Authored by Finout
AWS Cost Optimization: 6 Free Tools & 10 Hacks to Cut AWS Bills
What Are AWS Spot Instances, Pros/Cons, and 6 Ways to Save Even More
Top 5 Free & Open Source AWS Cost Optimization Tools
Related product offering: Enterprise-Grade FinOps Platform
Offered by Finout
Finout's Patented Instant Virtual Tagging
Financial Planning
Track and Control Cloud Costs waste
Related technology update: [Webinar] How To Create a Cost-Effective AWS Environment
Snowflake Pricing
Related guides
Authored by Seemore Data
Complete Guide to Understanding Snowflake Pricing
Snowflake Storage Costs: The Complete Guide for 2024
CloudHealth
Related guides
Authored by Finout
VMware CloudHealth: Solution Overview, Pros/Cons & Alternatives
CloudHealth Pricing Tiers and Contract Structure Explained
CloudHealth Competitors to Watch in 2025
Related product offering: Enterprise-Grade FinOps Platform
Offered by Finout
Databricks Cost Optimization & Cost Management Tool
Kubernetes Cost Monitoring & Management Tool: K8s Cost Reduction
Digital Asset Management
Related guides
Authored by Cloudinary
Digital Asset Management (DAM) Users, Features, and Benefits
Reimaging DAM: The next-generation solution for marketing & development
MAM vs ECM: What’s the Difference?
Learning Management System
Related guides
Authored by Kaltura
Learning Management Systems (LMS): 6 Key Features and Top Use Cases
Corporate Learning Management System: 11 Solutions to Know in 2025
Healthcare learning management system: Challenges & best practices
AWS Secrets Manager
Related guides
Authored by Configu
AWS Secret Manager: Features, Pricing, Limitations & Alternatives
Related product offering: Configu: Configuration Management Platform | Configuration-as-Code Automation for Secure Collaboration
Related technology update: [Blog] The state of config file formats: XML vs. YAML vs. JSON vs. HCL
AWS Bedrock
Related guides
Authored by Umbrella
Complete 2024 Guide to Amazon Bedrock: AWS Bedrock 101
AWS Bedrock Pricing: Your 2024 Guide to Amazon Bedrock Costs
AWS Bedrock vs Azure OpenAI – Which Platform Is Best For You
Related product offering: Intelligent Cost Optimization Platform
Offered by Umbrella
Cloud Cost Management and Optimization
MSP Cloud
Accurate FinOps Forecasting
Related technology updates:
[Blog] State of Cloud Cost Report 2024
Multicloud
Related guides
Authored by Umbrella
What Is Multicloud? Benefits, Use Cases, Challenges and Solutions
Multicloud Strategy: Pros, Cons, and Tips for Success
Multicloud Management: How It Works & 5 Critical Best Practices
Related product offering: Intelligent Cost Optimization Platform
Offered by Umbrella
Multicloud Cost Visibility for FinOps
Boost your cloud efficiency with automated waste detection
Detect and resolve cloud cost anomalies in real-time
AWS Autoscaling
Related guides
Authored by Spot.io
AWS Auto Scaling: Scaling EC2, ECS, RDS, and more
EC2 Autoscaling: The Basics, Getting Started & 4 Best Practices
Understanding EC2 Auto Scaling Groups
Related product offering: Spot Elastigroup
Offered by Spot.io
Elastigroup: Scale mission-critical workloads on spot instances
Related technology updates:
[Blog] Horizontal vs. Vertical Scaling
[Report] GigaOm 2024 Radar for Cloud Resource Optimization
AWS EC2 Pricing
Related guides
Authored by Spot.io
AWS EC2 Pricing: The Ultimate Guide
The Complete Guide to EC2 Instance Pricing
AWS Reserved Instances: Ultimate Guide [2024]
Related product offering: Spot Elastigroup
Related technology updates:
[Report] Optimizing in a Multi-Cloud World
[Announcement] Cost Intelligence and Billing Launch
Cloud Cost
Related guides
Authored by Spot.io
Cloud Cost: 4 Cost Models and 6 Cost Management Strategies
5 Cloud Pricing Factors and Examples from Top Cloud Providers
9 Free Cloud Cost Management Tools
Related product offering: Spot Eco
Offered by Spot.io
Cloud services for MSPs
Spot by NetApp for Microsoft Azure
Google cloud platform
Cloud Optimization
Related guides
Authored by Spot.io
Cloud Optimization: The 4 Things You Must Optimize
What Is Cloud Automation? Use Cases and Best Practices
Cloud Infrastructure: 4 Key Components and Deployment Models
Related product offering: NetApp Spot
Related technology updates:
[Report] GigaOm 2024 Radar for Cloud Resource Optimization
CloudOps
Related guides
Authored by Spot.io
CloudOps: What is Cloud Operations?
Related product offering: NetApp Spot
Related technology updates:
[Report] 2023 State of CloudOps
EC2 Instances
Related guides
Authored by Spot.io
AWS EC2 Spot Instances Workload Automation
Which EC2 Instance Type is Right for You?
How the EC2 API Works and a Quick Tutorial to Get Started
Related product offering: Spot Elastigroup
Offered by Spot.io
Elastigroup: Scale mission-critical workloads on spot instances
Related technology update: [Announcement] Cost Intelligence and Billing Launch
Google Cloud Pricing
Related guides
Authored by Spot.io
Google Cloud Pricing: The Complete Guide
Related product offering: Spot Elastigroup
Spot Instances
Related guides
Authored by Spot.io
Ultimate Guide to Spot Instances on AWS, Azure & Google Cloud
Spot Instances vs. On-Demand Instances: Pros and Cons
Spot Instances vs. Reserved Instances: How to Choose
Related product offering: Spot Elastigroup
Multi Tenant Architecture
Related guides
Authored by Frontegg
Multi-Tenant Architecture: How It Works, Pros, and Cons
Multi-Tenancy in Cloud Computing: Basics & 5 Best Practices
Multi-Tenant vs. Single-Tenant: What Is the Difference?
Additional IaaS Resources
What Is Cloud Orchestration?
4 AWS File Systems Compared
ECS Vs. Plain Kubernetes: 5 Key Differences and How to Choose
Benefits of Cloud Migration: Do They Outweigh the Cost?
Cloud Orchestration and its Impact on DevOps Teams
AWS Fargate pricing: how to optimize billing and save costs
The Complete Guide to EC2 Instance Pricing
Azure Kubernetes: The Basics and a Quick Tutorial
Moving HPC To The Cloud: A Guide For 2020
Virtualization in Cloud Computing: Behind the Scenes
HIPAA Compliance in the Cloud: A Quick Start Guide
Azure Encryption Explained
Understanding Azure Time Series Insights
3 Azure Migration Services and How They Cut Migration Costs
What Is a Cloud Operations Engineer?
How to Become a Cloud Operations Engineer
Cloud Capacity Planning: A Practical Guide
Which Service to Choose?
Whether choosing an infrastructure or platform as a service model, cloud servers are practical solutions in today’s world of constantly evolving technology. Since 1994, Atlantic.Net has been providing businesses with the best hosting solutions like our super-fast VPS Hosting. To learn more about our cloud server hosting solutions, including HIPAA compliant hosting, give us a call today at 800-521-5881.
### How to Build a Real-Time AI Inference Pipeline Using GPU and StarRocks
Building a real-time AI inference pipeline lets you analyze and react to data as soon as it’s available. With the rise of deep learning and big data, you often need to combine high-performance AI models (using GPU acceleration) with fast, scalable analytics tools.
In this guide, you’ll learn how to set up an end-to-end pipeline that uses a GPU server for running AI inference with PyTorch and StarRocks.
Prerequisites
An Ubuntu 24.04 server with an NVIDIA GPU.
A non-root user or a user with sudo privileges.
NVIDIA drivers are installed on your server.
Step 1: Install Required Packages
You need several tools and dependencies to build your AI inference pipeline and run StarRocks. This step will guide you through updating your system and installing everything you need.
First, update all the packages to the latest version.
apt update -y
Next, install the required packages.
apt install python3 python3-pip python3-venv docker-compose default-jdk -y
Step 2: Deploy StarRocks with Docker Compose
Now that you have the required tools, it’s time to deploy a StarRocks cluster using Docker Compose. This makes it easy to set up and manage both the Frontend (FE) and Backend (BE) services needed for analytics.
First, create a directory for your StarRocks project.
mkdir ~/starrocks && cd ~/starrocks
Next, create a docker-compose.yml file.
nano docker-compose.yml
Add the following configuration.
version: '3.8'
services:
fe:
image: starrocks/fe-ubuntu:3.2-latest
container_name: starrocks-fe
ports:
- "8030:8030" # Web UI
- "9030:9030" # MySQL protocol
environment:
- FE_SERVERS=starrocks-fe:9010
command:
- /opt/starrocks/fe/bin/start_fe.sh
volumes:
- ./fe-meta:/opt/starrocks/fe/meta
restart: always
be:
image: starrocks/be-ubuntu:3.2-latest
container_name: starrocks-be
depends_on:
- fe
ports:
- "8040:8040" # BE port
command:
- /opt/starrocks/be/bin/start_be.sh
environment:
- FE_SERVERS=starrocks-fe:9010
volumes:
- ./be-storage:/opt/starrocks/be/storage
restart: always
Explanation:
Frontend (FE): Handles queries and coordinates the cluster, with ports 8030 (web UI) and 9030 (MySQL protocol).
Backend (BE): Stores data and executes queries, exposed on port 8040. It depends on the FE service.
Both use local volumes to persist metadata and storage, and will restart automatically if they fail.
Start the StarRocks cluster.
docker compose up -d
Verify that containers are running.
docker ps
You should see both starrocks-fe and starrocks-be containers in the output, indicating that your StarRocks cluster is up and running.
CONTAINER ID IMAGE COMMAND CREATED STATUS PORTS NAMES
97465ff8fb67 starrocks/be-ubuntu:3.2-latest "/opt/starrocks/be/b…" 31 minutes ago Up 31 minutes 0.0.0.0:8040->8040/tcp, [::]:8040->8040/tcp starrocks-be
b184563cf3b3 starrocks/fe-ubuntu:3.2-latest "/opt/starrocks/fe/b…" 31 minutes ago Up 31 minutes 0.0.0.0:8030->8030/tcp, [::]:8030->8030/tcp, 0.0.0.0:9030->9030/tcp, [::]:9030->9030/tcp starrocks-fe
Step 3: Connect to StarRocks Frontend
With StarRocks running in Docker, it’s time to connect to the Frontend (FE) service and prepare it for storing AI inference results. You’ll use the MySQL client to manage your StarRocks databases and tables, since StarRocks supports the MySQL protocol for compatibility.
1. First, install the MySQL client package.
apt install mysql-client -y
2. Next, connect to StarRocks FE using MySQL protocol.
mysql -h 127.0.0.1 -P 9030 -uroot
This command connects to the StarRocks FE running on your server at port 9030, using the default root user.
3. Before you can create and use tables, you must register at least one backend (BE) node with the FE.
mysql>ALTER SYSTEM ADD BACKEND "starrocks-be:9050";
4. Verify that the backend is registered and active.
mysql>SHOW BACKENDS\G
You should see an output showing the BE node’s status, IP address, and “Alive: true.”
*************************** 1. row ***************************
BackendId: 10006
IP: 172.18.0.3
HeartbeatPort: 9050
BePort: 9060
HttpPort: 8040
BrpcPort: 8060
LastStartTime: 2025-06-28 11:06:13
LastHeartbeat: 2025-06-28 11:07:28
Alive: true
SystemDecommissioned: false
ClusterDecommissioned: false
TabletNum: 59
DataUsedCapacity: 0.000 B
AvailCapacity: 269.413 GB
TotalCapacity: 337.143 GB
UsedPct: 20.09 %
MaxDiskUsedPct: 20.09 %
ErrMsg:
Version: 3.2.16-8dea52d
Status: {"lastSuccessReportTabletsTime":"2025-06-28 11:07:14"}
DataTotalCapacity: 269.413 GB
DataUsedPct: 0.00 %
CpuCores: 4
NumRunningQueries: 0
MemUsedPct: 0.73 %
CpuUsedPct: 0.2 %
Location:
1 row in set (0.00 sec)
5. Exit from MySQL.
mysql>exit;
Step 4: Create Tables in StarRocks for Prediction Data
Now that your StarRocks cluster is up and the backend node is active, you need a place to store your AI inference results. You’ll create a database and a table designed for logging model predictions, making it easy to analyze results in real-time.
1. Connect to StarRocks FE with the MySQL client.
mysql -h 127.0.0.1 -P 9030 -uroot
2. Create a new database for your AI demo.
mysql>CREATE DATABASE ai_demo;
3. Switch to your new database.
mysql> USE ai_demo;
4. Create a predictions table to store model outputs.
mysql> CREATE TABLE predictions (
filename VARCHAR(255),
prediction INT,
ts DATETIME DEFAULT CURRENT_TIMESTAMP
) ENGINE=OLAP
DUPLICATE KEY(filename)
DISTRIBUTED BY HASH(filename) BUCKETS 3
PROPERTIES (
"replication_num" = "1"
);
5. Exit the MySQL client.
mysql>exit;
Step 5: Run AI Inference Using GPU (PyTorch)
With your StarRocks database ready, it’s time to generate some predictions using a GPU-accelerated AI model. In this step, you’ll set up a simple PyTorch pipeline to process images, run inference on your GPU, and export results for analytics.
1. Create a Python virtual environment for your project.
python3 -m venv venv
source venv/bin/activate
2. Install PyTorch and related libraries.
pip install torch torchvision pillow
3. Build your model inference script.
nano model_inference.py
Add the following code:
import torch
from torchvision.models import resnet50, ResNet50_Weights
from torchvision import transforms
from PIL import Image
weights = ResNet50_Weights.DEFAULT
model = resnet50(weights=weights).cuda().eval()
transform = weights.transforms()
def predict(image_path):
image = Image.open(image_path).convert('RGB')
input_tensor = transform(image).unsqueeze(0).cuda()
with torch.no_grad():
output = model(input_tensor)
return output.argmax(dim=1).item()
4. Test single image inference.
python3 model_inference.py
5. Create another script to run batch inference on a folder of images.
nano batch_infer.py
Add the following code:
import os, csv
from model_inference import predict
from PIL import UnidentifiedImageError
os.makedirs("images", exist_ok=True) # Ensure folder exists
with open("predictions.csv", "w", newline="") as f:
writer = csv.writer(f)
writer.writerow(["filename", "prediction"])
for file in os.listdir("images"):
if file.endswith(".jpg"):
path = os.path.join("images", file)
try:
label = predict(path)
writer.writerow([file, label])
except UnidentifiedImageError:
print(f"Skipped invalid image: {file}")
This script loops through all .jpg files in the images folder, runs inference, and writes the results to predictions.csv.
6. Run the batch inference.
python3 batch_infer.py
After this step, you’ll have a predictions.csv file with model outputs, ready to load into StarRocks for analytics.
Step 6: Ingest Inference Data into StarRocks
With your AI model’s predictions saved in predictions.csv, the next step is to load these results directly into your StarRocks database. StarRocks offers a simple and fast streaming API called Stream Load for ingesting batch data via HTTP.
1. Use the Stream Load API with curl.
curl --location-trusted -u root: \
-T predictions.csv \
-H "Expect: 100-continue" \
-H "Content-Type: application/octet-stream" \
-H "column_separator:," \
-H "columns: filename,prediction" \
http://localhost:8030/api/ai_demo/predictions/_stream_load
You should see a response like this:
{
"TxnId": 2,
"Label": "c62f6a53-aeff-4be2-a2b5-0d04733217ae",
"Status": "Success",
"Message": "OK",
"NumberTotalRows": 1,
"NumberLoadedRows": 1,
"NumberFilteredRows": 0,
"NumberUnselectedRows": 0,
"LoadBytes": 21,
"LoadTimeMs": 195,
"BeginTxnTimeMs": 22,
"StreamLoadPlanTimeMs": 116,
"ReadDataTimeMs": 0,
"WriteDataTimeMs": 9,
"CommitAndPublishTimeMs": 46
}
Status: "Success" confirms your data was loaded.
Your AI inference results are now stored in StarRocks and ready for instant querying and analytics! In the next step, you’ll learn how to run real-time SQL queries on these predictions.
Step 7: Query Results in Real-Time
Once your predictions are loaded into StarRocks, you can instantly analyze and visualize the data using SQL queries. This step demonstrates how to access your AI inference results and perform real-time analytics.
1. Connect to StarRocks using the MySQL client.
mysql -h 127.0.0.1 -P 9030 -uroot
2. Switch to your AI demo database.
mysql> USE ai_demo;
3. View the latest predictions.
mysql>SELECT * FROM predictions ORDER BY ts DESC LIMIT 5;
This command fetches the five most recent inference results, letting you monitor new data as it arrives.
+----------+------------+---------------------+
| filename | prediction | ts |
+----------+------------+---------------------+
| filename | NULL | 2025-07-09 07:34:34 |
+----------+------------+---------------------+
1 row in set (0.07 sec)
4. Aggregate predictions for analytics.
mysql> SELECT prediction, COUNT(*) AS count FROM predictions GROUP BY prediction ORDER BY count DESC;
This query shows how many times each prediction label appears, great for summarizing your model’s results.
+------------+-------+
| prediction | count |
+------------+-------+
| NULL | 1 |
+------------+-------+
1 row in set (0.03 sec)
Your pipeline is now complete, from GPU-powered inference to instant analytics with StarRocks!
Conclusion
You’ve now built a complete real-time AI inference pipeline using a GPU server and StarRocks. You started by preparing your Ubuntu 24.04 environment, then deployed StarRocks with Docker Compose. After connecting to StarRocks, you created a table for storing prediction results. Next, you used PyTorch to run image classification on your GPU, saved the predictions, and loaded them directly into StarRocks for real-time analytics.
### How to Use StarRocks for Fast SQL Queries on JSON and Nested Data Using Ubuntu 24.04 GPU Server
StarRocks is a blazing-fast analytical database optimized for modern analytics workloads. It supports semi-structured formats like JSON and nested data, making it an excellent fit for use cases involving raw event data, user activity logs, or application telemetry.
In this hands-on tutorial, you’ll learn how to deploy StarRocks on Ubuntu 24.04 with Docker, preprocess JSON using GPU acceleration, and run fast SQL queries using the StarRocks engine.
Prerequisites
An Ubuntu 24.04 server with an NVIDIA GPU.
A non-root user or a user with sudo privileges.
NVIDIA drivers are installed on your server.
Step 1: Install Required Packages
Install essential tools like Python, Docker, Java, and the MySQL client needed for running StarRocks and preprocessing JSON with a GPU.
First, update all the packages to the latest version.
apt update -y
Next, install the required packages.
apt install python3 python3-pip python3-venv docker-compose default-jdk -y
Step 2: Deploy StarRocks with Docker Compose
We will use Docker Compose to deploy a single-node StarRocks cluster with Frontend (FE) and Backend (BE) services.
First, create a directory for your project and navigate inside it.
mkdir ~/starrocks && cd ~/starrocks
Next, create a docker-compose.yml file.
nano docker-compose.yml
Add the following configuration.
version: '3.8'
services:
fe:
image: starrocks/fe-ubuntu:3.2-latest
container_name: starrocks-fe
ports:
- "8030:8030" # Web UI
- "9030:9030" # MySQL protocol
environment:
- FE_SERVERS=starrocks-fe:9010
command:
- /opt/starrocks/fe/bin/start_fe.sh
volumes:
- ./fe-meta:/opt/starrocks/fe/meta
restart: always
be:
image: starrocks/be-ubuntu:3.2-latest
container_name: starrocks-be
depends_on:
- fe
ports:
- "8040:8040" # BE port
command:
- /opt/starrocks/be/bin/start_be.sh
environment:
- FE_SERVERS=starrocks-fe:9010
volumes:
- ./be-storage:/opt/starrocks/be/storage
restart: always
The above file defines a StarRocks deployment with two services:
Frontend (FE) - Acts as the query coordinator, running on port 8030 (web UI) and 9030 (MySQL protocol). It stores metadata in the ./fe-meta volume and connects to the backend.
Backend (BE) - Handles data storage and query execution, exposed on port 8040. It depends on the FE and stores data in ./be-storage. Both services auto-restart on failure.
Start the container using the command below.
docker compose up -d
Verify that containers are running.
docker ps
Output.
CONTAINER ID IMAGE COMMAND CREATED STATUS PORTS NAMES
97465ff8fb67 starrocks/be-ubuntu:3.2-latest "/opt/starrocks/be/b…" 31 minutes ago Up 31 minutes 0.0.0.0:8040->8040/tcp, [::]:8040->8040/tcp starrocks-be
b184563cf3b3 starrocks/fe-ubuntu:3.2-latest "/opt/starrocks/fe/b…" 31 minutes ago Up 31 minutes 0.0.0.0:8030->8030/tcp, [::]:8030->8030/tcp, 0.0.0.0:9030->9030/tcp, [::]:9030->9030/tcp starrocks-fe
Step 3: Connect to StarRocks Frontend
Use the MySQL protocol to connect to the StarRocks FE service and issue SQL commands for managing databases and tables.
First, install the MySQL client package.
apt install mysql-client -y
Next, verify the StarRocks FE connectivity.
mysql -h 127.0.0.1 -P 9030 -uroot
The FE must register at least one BE node to store data. Add the backend node using the below command.
ALTER SYSTEM ADD BACKEND "starrocks-be:9050";
Verify that the backend is registered and active.
SHOW BACKENDS\G
Output.
*************************** 1. row ***************************
BackendId: 10006
IP: 172.18.0.3
HeartbeatPort: 9050
BePort: 9060
HttpPort: 8040
BrpcPort: 8060
LastStartTime: 2025-06-28 11:06:13
LastHeartbeat: 2025-06-28 11:07:28
Alive: true
SystemDecommissioned: false
ClusterDecommissioned: false
TabletNum: 59
DataUsedCapacity: 0.000 B
AvailCapacity: 269.413 GB
TotalCapacity: 337.143 GB
UsedPct: 20.09 %
MaxDiskUsedPct: 20.09 %
ErrMsg:
Version: 3.2.16-8dea52d
Status: {"lastSuccessReportTabletsTime":"2025-06-28 11:07:14"}
DataTotalCapacity: 269.413 GB
DataUsedPct: 0.00 %
CpuCores: 4
NumRunningQueries: 0
MemUsedPct: 0.73 %
CpuUsedPct: 0.2 %
Location:
1 row in set (0.00 sec)
Step 4: Create a Database and Table
In this section, we will create a StarRocks database and define a table schema to receive flattened JSON data.
First, create a StarRocks database.
CREATE DATABASE gpu_json;
Change the database to gpu_json.
USE gpu_json;
Define a table schema.
CREATE TABLE IF NOT EXISTS users (
id INT,
name STRING,
email STRING,
city STRING,
zip STRING
)
ENGINE=OLAP
DUPLICATE KEY(id)
DISTRIBUTED BY HASH(id) BUCKETS 1
PROPERTIES("replication_num" = "1");
Press CTRL+D to exit from the MySQL shell.
Step 5: Set Up GPU JSON Preprocessing with cuDF
We’ll now use GPU acceleration to flatten nested JSON data using NVIDIA’s cuDF, a high-performance GPU dataframe library.
Create a Python virtual environment and activate it.
python3 -m venv venv
source venv/bin/activate
Update pip to the latest version.
pip install --upgrade pip
Install cuDF to preprocess nested JSON.
pip install cudf-cu12 --extra-index-url=https://pypi.nvidia.com
Create a sample JSON data.
nano raw_users.json
Add the following content.
[
{
"id": 1,
"user": {
"name": "Alice",
"email": "alice@example.com",
"location": {"city": "New York", "zip": "10001"}
}
},
{
"id": 2,
"user": {
"name": "Bob",
"email": "bob@example.com",
"location": {"city": "Chicago", "zip": "60601"}
}
}
]
This JSON structure contains nested fields that we’ll flatten before loading into StarRocks.
Create a preprocess_json_gpu.py script to load the JSON into GPU memory, extract nested values, and save the flat result to a CSV file.
nano preprocess_json_gpu.py
Add the following code.
import cudf
import json
# Load raw JSON file
with open("raw_users.json", "r") as f:
data = json.load(f)
# Convert list of dicts to cuDF DataFrame
df = cudf.DataFrame(data)
# Convert 'user' column to pandas for safe iteration
user_data = df['user'].to_pandas()
# Extract nested fields using pandas-like iteration
df['name'] = [user['name'] for user in user_data]
df['email'] = [user['email'] for user in user_data]
df['city'] = [user['location']['city'] for user in user_data]
df['zip'] = [user['location']['zip'] for user in user_data]
# Drop the original nested column
df = df.drop(columns=['user'])
# Save to CSV
df.to_csv("flattened_users.csv", index=False)
print("✅ Flattened data saved to 'flattened_users.csv'")
Run the script.
python3 preprocess_json_gpu.py
Step 6: Load the CSV into StarRocks Using Stream Load
We’ll use StarRocks’ HTTP API to load the CSV file directly into the users table.
First, remove the CSV header row.
tail -n +2 flattened_users.csv > flattened_users_noheader.csv
Load the data to StarRocks using curl.
curl -v --location-trusted -u root: \
-H "label: csv_load_02" \
-H "format: csv" \
-H "column_separator: ," \
-H "Expect: 100-continue" \
-T ./flattened_users_noheader.csv \
http://localhost:8030/api/gpu_json/users/_stream_load
Look for a "Status": "Success" message in the output.
{
"TxnId": 4,
"Label": "csv_load_02",
"Status": "Success",
"Message": "OK",
"NumberTotalRows": 3,
"NumberLoadedRows": 3,
"NumberFilteredRows": 0,
"NumberUnselectedRows": 0,
"LoadBytes": 100,
"LoadTimeMs": 29,
"BeginTxnTimeMs": 0,
"StreamLoadPlanTimeMs": 2,
"ReadDataTimeMs": 0,
"WriteDataTimeMs": 6,
"CommitAndPublishTimeMs": 20
* Connection #1 to host 172.18.0.3 left intact
Step 7: Verify the Data
In this section, we will query the table to confirm that the flattened JSON has been loaded correctly.
First, connect to StarRocks.
mysql -h 127.0.0.1 -P 9030 -uroot
Change the database to gpu_json.
mysql> USE gpu_json;
Verify the data.
mysql> SELECT * FROM users;
Output.
+----+-------+-------------------+----------+--------+
| id | name | email | city | zip |
+----+-------+-------------------+----------+--------+
| 1 | Alice | alice@example.com | New York | 10001 |
| 2 | Bob | bob@example.com | Chicago | 60601 |
+----+-------+-------------------+----------+--------+
Conclusion
In this tutorial, you built a powerful data pipeline using StarRocks and GPU acceleration on Ubuntu 24.04. You learned how to deploy a StarRocks single-node cluster using Docker Compose, preprocess nested JSON data with NVIDIA's cuDF library, and ingest the flattened data using the high-performance Stream Load API. Finally, you verified that the data was correctly loaded and queried it using standard SQL.
### Most Impactful AI Applications in Healthcare in 2025
AI is radically transforming healthcare, and 2025 is shaping up to be a breakthrough year for innovative, patient-centered applications across clinical care, research, and beyond. We have seen significant competition in this space, with both established medtech giants and agile AI startups achieving remarkable success throughout the first half of the year.
In this article, we will take a look at some of the most impactful AI applications currently reshaping healthcare, highlighting the AI tools and companies behind them that are truly making a difference in this area.
Top 5 AI Applications Transforming Clinical Practice in 2025
Here are some of the standout AI applications that are shaping the healthcare industry in 2025:
#1: Aidoc
About Aidoc:
Aidoc is a leading AI technology company that provides AI-powered solutions to help health care organizations detect and prioritize critical imaging findings. They specialize in offering real-time medical imaging analysis, which supports faster, more accurate diagnoses and coordination of care.
Aidoc's sophisticated AI algorithms analyze medical images, for example, CT, MRI, and X-ray scans, to detect critical health conditions such as strokes, pulmonary embolisms, and brain hemorrhages. This helps to quickly identify and treat urgent cases, leading to better patient outcomes in critical care and emergency settings.
Advantages:
Faster Interventions: Significantly reduces the time it takes to diagnose diseases and commence treatment, directly impacting overall health outcomes.
Optimized Workflow: Prioritizes radiologists' worklists, allowing healthcare professionals to focus on the most urgent cases first.
Broad Clinical Impact: Compatible with multiple imaging types, supporting widespread use in clinical practice.
Disadvantages:
Requirement of High Quality Data: The performance and accuracy of Aidoc's AI models rely heavily on the quality, consistency, and diversity of the medical imaging data that they are trained on and analyze.
Complex Integration: Integrating Aidoc into existing medical IT infrastructure can be challenging.
High Cost: As a premium AI solution, the initial investment in Aidoc, as well as ongoing subscription fees, can be substantial. This can significantly limit the adoption of Aidoc for smaller organizations or those with tighter budgets.
Target Audience:
Emergency, Critical Care, and Radiology departments in large hospitals
Trauma or Stroke Centers
Medical Research Centers
Outpatient Imaging Centers and Teleradiology Groups
#2: Insilico Medicine
About Insilico Medicine:
Insilico Medicine is a pioneering biotechnology company that leverages end-to-end generative AI and deep learning to accelerate drug discovery and development. Its Pharma.AI platform integrates multiple AI models to accelerate the entire drug discovery process, including "PandaOmics" to identify disease targets and "Chemistry42" for designing novel drug candidates. By automating key steps in the drug discovery pipeline, Insilico Medicine drastically reduces both the time and cost of bringing new treatments to clinical practice, helping to enhance patient care.
Advantages:
Accelerated Drug Development: Can significantly reduce the time required for early-stage drug discovery, often reducing it from years to just months.
Novel Chemical Insights: Generative AI allows for the creation of entirely new molecular structures, potentially leading to truly novel and effective therapies.
Improved Efficiency: By predicting efficacy and toxicity, Insilico minimizes the need for expensive and time-consuming laboratory experiments.
Disadvantages:
Downstream Validation Required: While AI platforms, such as Insilico Medicine, can speed up the early stages of drug discovery, all findings must still go through rigorous lab validation and human clinical trials to ensure safety and effectiveness.
Limited Biological Context: As AI models can only simulate based on what they've been trained on, they can lack the full complexity of real biological systems. This means they can miss the influence of immune responses, off-target effects, and interactions between organs, cells, and molecules, leading to gaps in prediction accuracy.
Target Audience:
Pharmaceutical Companies and Biotech Startups
Academic & Research Institutions
Contract Research Organizations (CROs)
#3: Intuitive Surgical
About Intuitive Surgical:
Intuitive Surgical is a California-based medtech company, best known for developing the da Vinci Surgical System, which is the world’s leading platform for robot-assisted, minimally invasive surgery. It has transformed how minimally invasive procedures are performed in specialties such as urology, gynecology, cardiothoracics, and general surgery.
Its AI technologies help to guide surgery in real time, improve the control of surgical tools, enhance images for better visibility, and make systems easier for doctors to use. It also reviews surgical data to give feedback on technique and results, helping to boost precision and patient safety.
Advantages:
High Level of Precision & Control: Robotic arms filter out hand tremors and allow for ultra-fine movements, improving surgical accuracy in delicate procedures, such as heart valve repair or microsuturing.
Proven Clinical Efficacy: A large meta-analysis of 230 studies found that surgeries carried out using the da Vinci robotic system led to fewer complications, less blood loss, fewer transfusions, and shorter hospital stays compared to both laparoscopic and open surgery.
Continuous AI Development: Intuitive Surgical regularly updates its AI tools to improve real-time guidance, enhance surgical precision, and personalize surgeon training.
Disadvantages:
High Initial Investment: The da Vinci system has a high initial purchase price, as well as the cost of ongoing maintenance and disposable instruments. This contributes to higher healthcare costs for facilities, meaning that it may not be viable for smaller hospitals or clinics.
Specialized Training Required: Surgeons and care teams must complete structured training programs before operating the Intuitive Surgical systems, which can take time and resources to implement effectively.
Target Audience:
Large Academic Medical Centers and Hospitals
#4: Suki AI
About Suki AI:
Suki AI is an innovative AI-powered voice assistant that helps frontline healthcare workers to save time on administrative tasks, allowing them to focus on caring for their patients. It uses advanced natural language processing (NLP) and voice recognition to listen to natural human language during doctor and patient conversations and automatically generate structured clinical notes in real time. This key health data can then be seamlessly integrated into a patient's electronic health records.
Advantages:
Significant Time Savings: Cuts down the hours that healthcare professionals spend on manually writing out patient notes by up to 72%. This frees up hours each week, allowing clinicians to focus more on patient care and less on paperwork.
Enhanced Note Accuracy: Captures key clinical details from real-time patient-clinician conversations, creating more thorough and accurate medical notes.
Improved Connection Between Patient and Healthcare Provider: Allows healthcare professionals to maintain crucial eye contact and focus fully on their patient during appointments, fostering better communication and a more engaged patient experience.
Disadvantages:
Limited Speciality Coverage: Currently, Suki AI is best suited for primary care and internal medicine and is less optimized for highly specialized or complex fields where documentation can be more nuanced or procedure-specific.
Voice Recognition Nuances: While highly advanced in understanding human language and medical terminology, AI models can occasionally misinterpret complex jargon, diverse accents, or background noise, meaning that notes must be carefully reviewed and corrected if needed.
Target Audience:
Healthcare Organizations & Clinics, including group practices, urgent care centers, and health systems
Primary Healthcare Professionals
#5: Wysa
About Wysa:
Wysa is a leading conversational AI platform that is designed to support mental health and emotional well-being. It offers a confidential and non-judgmental space, allowing users to interact with an AI chatbot that’s available 24/7. Through guided conversations and clinically backed techniques, such as cognitive behavioral therapy (CBT), dialectical behavior therapy (DBT), mindfulness, and mood tracking, Wysa helps users to manage stress, anxiety, and low mood at their own pace.
Wysa also provides self-help tools, guided meditations, and therapeutic exercises, often serving as a crucial first line of support or a complementary tool to human therapy in health care. This accessibility and immediate, evidence-based support are more critical than ever, given the escalating global mental health crisis.
Advantages:
24/7 Accessibility: Provides patients with on-demand support around the clock, removing the need to wait for appointments. This helps to overcome common barriers associated with accessing traditional mental health care services.
Scalability & Reach: As an AI application, Wysa can support patients around the world, improving access to mental health interventions and addressing the systemic shortage of healthcare professionals in this field.
Anonymity: This is especially important in the mental health space, where stigma or fear of judgment can prevent people from seeking help.
Disadvantages:
Use is Limited for Severe Conditions: While Wysa is designed to support mild to moderate mental health concerns such as stress, anxiety, and low mood, it is not a substitute for professional therapy in cases of severe or complex mental health conditions.
Lack of Human Empathy: Wysa AI systems are designed to simulate supportive conversations, but they do not possess genuine emotional understanding, lived experience, and human empathy. This means responses may lack the depth, nuance, and emotional resonance that come from interacting with a real human therapist.
Target Audience:
Individuals seeking immediate, accessible, and confidential mental health support
Individuals exploring self-help techniques to support their mental health
Organizations or employers looking to provide scalable mental well-being solutions to their members or employees
How Are Artificial Intelligence Applications Being Used in the Healthcare Industry?
AI applications are being used across the healthcare industry to solve complex medical challenges, improve patient outcomes, and streamline clinical workflows. Unlike traditional computer programs, these AI-driven tools can mimic important aspects of human cognition, such as reasoning, learning, and decision-making at a speed and scale that we've never seen before.
In 2025, AI is making major strides in several key areas, fundamentally transforming how healthcare is delivered:
Early Detection and Improved Medical Diagnosis
One of the most important ways that AI is making an impact in the healthcare sector is by allowing healthcare providers to make faster, more accurate diagnoses. AI machine learning algorithms are continuously refining their ability to identify patterns in vast datasets, leading to increasingly reliable diagnostic support.
As an example, AI applications are being used to scan complex medical images, including X-rays, MRIs, and digital pathology slides, with incredible precision, often spotting subtle patterns that the human eye could easily miss. This is particularly valuable for early detection of cancers, neurological conditions, and heart disease, where a prompt disease diagnosis can make all the difference to the outcome of the patient.
Accelerated Drug Discovery and Development
Bringing a new drug to market can take over a decade and cost billions of dollars. AI tools dramatically speed things up by identifying promising compounds, predicting how they’ll behave in the body, and even suggesting new uses for existing drugs. These applications are helping to streamline the early stages of the drug development process, cutting both time and costs. They can also be used to flag compounds that are likely to fail early on, so teams can focus their resources where they matter most.
Personalized Treatment
Given the powerful ability of AI tools to analyze massive, complex datasets quickly, clinicians can use these applications to make more informed, personalized treatment plans based on a patient's genetic data, real-time patient monitoring, and medical history.
In practice, this could mean using AI to help choose the most effective cancer treatment for a specific tumor profile, or adjusting medication for someone with multiple health conditions. This could be especially valuable in the management of cancers, rare diseases, and chronic illnesses, where individual variation can have a huge impact on outcomes.
Enhanced Surgical Precision
From robotic-assisted procedures to real-time image guidance, AI is also helping to make surgical procedures safer, more precise, and often less invasive. Notably, medical professionals can leverage AI tools to analyze patient scans ahead of time to map out the best surgical approach, and even assist during operations by highlighting key structures or flagging potential complications.
Revolutionizing Healthcare Data Management
Healthcare organizations generate a staggering amount of data every day, from patient medical records and clinical data to lab results and imaging scans. Artificial intelligence in healthcare is helping to bring order to the chaos by structuring, sorting, and analyzing this information in ways that are useful to medical practitioners and researchers.
Expanding Access to Mental Health Care
Mental health services have been overstretched in recent years, but AI is helping to fill in some of the gaps. For example, AI-powered chatbots can offer patients 24/7 mental health support, while apps help people to track their mood and manage symptoms. These virtual health assistants are making mental health care more accessible, especially for those who might find traditional mental health services hard to reach.
Challenges and Considerations of Adopting AI Applications in Healthcare Delivery
While AI is transforming healthcare, it’s not without its challenges. One major concern for healthcare professionals is data privacy, particularly when it comes to sensitive patient information being handled by automated systems. Protecting this sensitive patient data requires robust security and transparent consent processes.
Integrating innovative AI tools into complex healthcare systems and workflows can prove tricky, often slowing down the adoption of these advancements and limiting their impact in real-world settings. There is also the risk of bias, where AI tools can inadvertently reinforce existing health disparities when they haven't been trained using diverse datasets.
Recognizing and addressing these hurdles is key to ensuring AI’s benefits are accessible and equitable as the technology continues to evolve.
What Is the Future of AI in Healthcare?
AI is continuing to redefine what’s possible in healthcare, enhancing early diagnosis, supporting clinical decision making, streamlining administrative tasks, accelerating drug development, and ultimately driving better health outcomes for patients and providers alike. The near future will see even deeper integration of machine learning into every aspect of healthcare, from personalized precision medicine to advanced robotic surgeries. The emphasis will increasingly be on leveraging AI for population health management, not just individual patient care.
As the digital transformation of healthcare accelerates, innovators need infrastructure that can keep pace.
That’s where Atlantic.Net comes in. Whether you're training large language models, deploying real-time diagnostics, or scaling AI-powered platforms, Atlantic.Net’s GPU cloud hosting, powered by NVIDIA, delivers the performance, flexibility, and reliability you need to bring your vision to life. Built to meet the highest standards of data protection and regulatory readiness, Atlantic.Net's hosting services are HIPAA audited, HITRUST certified, and fully compliant with SOC 2, SOC 3, PCI, and GDPR, making it ideal for healthcare-grade AI innovation.
### Top 7 Essential Books on AI in 2025 for Anyone Curious About Technology
Artificial intelligence (AI) is a very popular subject for learners and readers, and staying informed on its key themes is essential, especially considering how quickly the technology changes and develops. AI books, authored by leading experts, provide a critical resource for understanding complex AI subjects. Ever since ChatGPT was put on general release in November 2022, AI has gone mainstream, and generative AI has ushered in a new era in science and technology, making a foundational understanding of its basic concepts really important for anyone interested in the field.
Books are a great way of demonstrating how integrating AI into daily life and business operations is achieved. Personal stories from authors and the brief history of AI's evolution offer valuable insights and perspective. Books on AI explain the fundamental science of neural networks, image recognition, and the concept of co-intelligence. The best books on the subject are a must-read for those who wonder about the future, the challenges, and the ethical considerations that AI presents.
From sci-fi-inspired concepts to practical applications, AI books offer a fascinating look at the potential impact of artificial intelligence on humanity. Understanding AI happens one concept at a time, and these texts provide an accessible path for teachers, students, and business professionals alike. As AI continues to evolve at a rapid pace, these expert suggestions are essential for anyone looking to learn and keep pace with the subject.
A Selection of Must-Read AI Books
We managed to narrow down a huge selection of books down to our seven favorites. We have chosen a varied selection, some old, some new. Several books offer a comprehensive view of artificial intelligence, from its technical underpinnings to its societal implications. Here is a list of some of the best books available for gaining a deeper understanding of AI.
#1: Artificial Intelligence: A Modern Approach by Stuart Russell and Peter Norvig (2021)
Introduction: This volume is widely considered the standard text in the field of artificial intelligence. It provides a comprehensive and detailed exploration of AI, covering a vast range of topics including search, knowledge representation, machine learning, and robotics. The authors frame AI as the study of intelligent agents that perceive their environment and act to maximize success.
Key Takeaways:
It offers a complete and authoritative overview of the foundational principles of AI.
The concept of the "intelligent agent" is used as a unifying theme across all topics.
It provides in-depth coverage of both classical and modern AI techniques, including probabilistic reasoning and deep learning.
The material is structured logically, making it an excellent reference for academic and professional work.
Points to Consider:
Its comprehensive nature results in a very long and dense book, which can be difficult for casual reading.
A solid background in computer science and mathematics is necessary to grasp many of the concepts.
The focus is primarily theoretical, with less emphasis on the practical engineering of production AI systems.
Ideal for: This book is ideal for undergraduate or graduate students taking an AI course. It is also an essential reference for AI researchers, data scientists, and software engineers who require a deep, theoretical understanding of the field.
#2: The Coming Wave: Technology, Power, and the Twenty-first Century's Greatest Dilemma by Mustafa Suleyman and Michael Bhaskar (2024)
Introduction: The co-founder of DeepMind, Mustafa Suleyman, delivers a clear-eyed analysis of the risks and rewards of the current technological wave. The book argues that AI and synthetic biology are poised to create unprecedented global change, presenting a difficult challenge: how to contain these powerful technologies without stifling progress or enabling authoritarian control.
Key Takeaways:
It provides an insider's perspective on the immense power and accelerating pace of AI development.
The concept of the "containment problem" is clearly articulated as the central challenge of our time.
It effectively explains the dual-use nature of technology, highlighting both its immense benefits and its potential for misuse.
The book connects AI to a broader technological field, including advances in biotechnology.
Points to Consider:
The tone can be seen as alarmist, with a strong focus on worst-case scenarios.
The proposed solutions for containment are acknowledged as difficult and potentially unattainable on a global scale.
It focuses more on the high-level strategic and geopolitical dilemmas than on the specific technical aspects of AI.
Ideal for: This book is essential reading for policymakers, business leaders, and strategists. It is also highly relevant for anyone who wants to understand the profound societal shifts that advanced technology will bring in the near future.
#3: The Age of AI: And Our Human Future by Henry A. Kissinger, Eric Schmidt, and Daniel Huttenlocher (2022)
Introduction: This book brings together three influential thinkers—a statesman, a technology executive, and a computer scientist—to explore how AI will change society. The authors examine the impact of AI on human identity, knowledge, and global order, arguing that this technological shift is as transformative as the Enlightenment.
Key Takeaways:
It offers a unique, high-level perspective that combines foreign policy, technology, and academic viewpoints.
The book effectively argues that AI is not just a tool but a new force that will reshape how we perceive reality and reason.
It raises profound philosophical questions about the future of human consciousness and decision-making in partnership with machines.
The historical analogies used, such as the invention of the printing press, provide valuable context for the current moment.
Points to Consider:
The analysis is broad and philosophical, which may leave readers seeking concrete technical details or policy prescriptions wanting more.
Some critics find the book raises more questions than it answers and can be abstract in its treatment of the subject.
Its focus on geopolitical and security implications reflects the backgrounds of its authors.
Ideal for: This work is well-suited for readers interested in the intersection of technology, philosophy, and global politics. It is a thought-provoking read for leaders in government and industry who are grappling with the long-term strategic implications of AI.
#4: Human Compatible: Artificial Intelligence and the Problem of Control by Stuart Russell
Introduction: AI pioneer Stuart Russell addresses the long-term implications of creating superintelligent machines. The book explores the existential risk that advanced AI could pose if not designed with provable beneficence toward humans at its core. Russell proposes a new model for AI development centered on this principle of control.
Key Takeaways:
The book makes the complex "control problem" accessible to a general audience.
It argues for a fundamental shift in AI research, moving from creating pure intelligence to creating beneficial intelligence.
It effectively uses analogies and personal stories to explain difficult concepts about the future of AI.
The author's authority in the field lends significant weight to the arguments presented.
Points to Consider:
The book focuses heavily on the potential long-term risks, which may seem speculative to some readers.
While accessible, some arguments still require careful and focused reading to fully understand.
It is a book about the "why" of AI safety, not a technical manual on "how" to implement it.
Ideal for: This is a must-read for technology enthusiasts, policymakers, ethicists, and any citizen concerned with the long-term societal impact of artificial intelligence. It provides crucial context for the global conversation on AI regulation and safety.
#5: Co-Intelligence: Living and Working with AI by Ethan Mollick (2024)
Introduction: Professor Ethan Mollick delivers a practical guide to collaborating with AI in our professional and personal lives. The book's central idea is to treat AI as a "co-intelligence"—a partner that can augment human capabilities. Mollick provides clear principles for effective human-AI interaction.
Key Takeaways:
It provides a positive and actionable framework for integrating AI into daily work.
The four main principles—invite AI, be the human in the loop, treat AI like a person, and assume it's the worst AI you'll ever use—are easy to remember and apply.
The book is filled with concrete examples and prompts for using AI in creative, analytical, and productive tasks.
It successfully demystifies generative AI for a non-technical audience.
Points to Consider:
The advice is focused on current large language models, and specific tactics may become dated as the technology evolves.
The optimistic focus on augmentation may understate the legitimate concerns about job displacement.
A reader must be willing to experiment with AI tools to get the full value from the book's suggestions.
Ideal for: This book is perfect for business leaders, managers, educators, students, and any professional seeking to harness AI as a tool for productivity and creativity. It is a great resource for anyone wanting a practical starting point for working with AI.
#6: AI Engineering by Chip Huyen (2024)
Introduction: This book serves as a technical guide for building real-world applications with foundation models. Authored by an expert with experience at top technology firms, it bridges the gap between machine learning theory and production-level AI engineering. The focus is on creating scalable, reliable, and maintainable AI products.
Key Takeaways:
It offers a structured, end-to-end framework for developing and deploying AI applications.
The content is highly practical and product-oriented, addressing real-world engineering challenges.
It provides a clear distinction between traditional ML engineering and the newer discipline of AI engineering.
The book covers essential topics like model evaluation, fine-tuning, and Retrieval-Augmented Generation (RAG).
Points to Consider:
It is written for a technical audience and assumes a foundational understanding of machine learning concepts.
The book does not contain code, focusing instead on frameworks and best practices.
As the AI engineering field is new, some of the specific tools and patterns discussed will evolve.
Ideal for: This book is designed for AI engineers, machine learning engineers, data scientists, and technical product managers. It is also valuable for software developers looking to specialize in building applications with foundation models.
#7: Empire of AI: Dreams and Nightmares in Sam Altman's OpenAI by Karen Hao (2025)
Introduction: This work of investigative journalism provides a critical account of OpenAI's history and the broader AI industry. The author tracks the company's evolution from a research-focused nonprofit to a commercial powerhouse, exposing the human and environmental costs behind the race for AI supremacy.
Key Takeaways:
It offers a deeply researched, behind-the-scenes look at one of the most influential companies in AI.
The book connects the abstract world of AI development to concrete global impacts, from data labor to water usage.
It raises crucial questions about corporate power, ethics, and the concentration of resources required to build advanced AI.
The journalistic narrative is engaging and makes a complex topic accessible.
Points to Consider:
The book has a clear critical perspective on OpenAI and the current trajectory of AI development.
The focus is more on the political and social story rather than the technical details of how the AI works.
The narrative centers heavily on one company, which may not be representative of the entire AI ecosystem.
Ideal for: This book is for readers interested in the business, politics, and ethics of technology. It is a compelling read for journalists, policymakers, activists, and anyone who wants to understand the hidden costs and power dynamics of the AI revolution.
Conclusion: From Knowledge to Application
Artificial intelligence is a vast industry, and the speed of change taking place is immense. The books listed here provide a comprehensive guide, from foundational university textbooks to practical handbooks for the modern professional, and high-level strategic analyses to critical journalistic accounts.
Other notable authors that didn't make this list include: Fei Fei Li, Edward Watson, Ray Kurzweil, and Melanie Mitchell. Each offers a unique perspective on a subject that is reshaping our world.
Reading is the first step in the journey of understanding. For those who feel inspired to move from theory to practice, the next step is hands-on experimentation. This is where concepts of machine learning, neural networks, and generative AI come to life. To take this journey of discovery further, powerful and accessible computing resources are required.
Services like Atlantic.Net's GPU Hosting provide the necessary infrastructure for this exploration. With access to high-performance NVIDIA GPUs, developers, students, and researchers can train models, run complex simulations, and build their own AI applications. This allows you to apply the knowledge gained from these essential books and become an active participant in artificial intelligence.
### How to Serve Ollama Models on GPU Server via REST API
As demand for local, private, and GPU-accelerated AI solutions grows, developers and enterprises are looking for alternatives to cloud-based LLM APIs. Ollama is an open-source tool that allows you to run large language models like Mistral, LLaMA, and Code LLaMA entirely on your own hardware, including GPU-accelerated servers. This provides complete data privacy, faster inference, and zero ongoing API costs.
In this tutorial, you'll learn how to set up Ollama on a GPU server running Ubuntu 24.04, serve models through a REST API, and build a simple web interface using FastAPI to query models from your browser.
Prerequisites
An Ubuntu 24.04 server with an NVIDIA GPU.
A non-root user or a user with sudo privileges.
NVIDIA drivers are installed on your server.
Step 1: Set Up Ollama on the GPU Server
We'll begin by installing Ollama and verifying that it runs correctly with GPU acceleration.
1. First, install Python and other required dependencies.
apt install python3 python3-venv python3-pip
2. Create and activate a Python virtual environment.
python3 -m venv venv
source venv/bin/activate
3. Install Ollama.
curl -fsSL https://ollama.com/install.sh | sh
Output.
>>> Installing ollama to /usr/local
>>> Downloading Linux amd64 bundle
############################################################################################################### 100.0%
>>> Creating ollama user...
>>> Adding ollama user to render group...
>>> Adding ollama user to video group...
>>> Adding current user to ollama group...
>>> Creating ollama systemd service...
>>> Enabling and starting ollama service...
Created symlink /etc/systemd/system/default.target.wants/ollama.service → /etc/systemd/system/ollama.service.
>>> NVIDIA GPU installed.
4. Start and enable the Ollama service.
systemctl enable ollama
systemctl start ollama
5. Verify that Ollama is running.
curl http://localhost:11434
Output.
Ollama is running
6. Download and runs the Mistral model locally. This model is optimized for instruction-following and text generation, and is runnable locally via the Ollama framework.
ollama run mistral
Step 2: Test REST API via cURL
Verify that the REST API works correctly by querying a prompt.
curl -s http://localhost:11434/api/generate -d '{
"model": "mistral",
"prompt": "What is the most populous city in Germany?"
}' | jq -r '.response' | tr -d '\n'
You will see the generated response from the model.
The most populous city in Germany is Berlin. As of 2021, its estimated population is approximately 3.7 million people within its city limits, and over 6.5 million people in the Berlin-Brandenburg metropolitan area. However, if we consider the total urban agglomeration, which includes cities like Potsdam and Brandenburg an der Havel, the population exceeds 7 million inhabitants.
Step 3: Create a Python Script to Call the API
Let’s write a Python script to send a request to the Ollama API and stream the output.
nano test_ollama_api.py
Add the following code.
import requests
import json
url = "http://localhost:11434/api/generate"
payload = {
"model": "mistral",
"prompt": "What is the most populous city in USA?"
}
response = requests.post(url, json=payload, stream=True)
# Collect streamed chunks and combine text
output = ""
for line in response.iter_lines():
if line:
chunk = json.loads(line.decode("utf-8"))
output += chunk.get("response", "")
print("Full response:\n", output)
Run the script.
python3 test_ollama_api.py
This streams the response in real-time.
Full response:
The most populous city in the United States is New York City, specifically its five boroughs: The Bronx, Brooklyn, Manhattan, Queens, and Staten Island. According to the U.S. Census Bureau's July 1, 2021 estimates, New York City has a population of approximately 8.4 million people.
Step 4: Build a Web Interface with FastAPI
Now, let’s create a user-friendly chat interface using FastAPI and Jinja2.
Install the necessary Python modules.
pip install fastapi uvicorn requests jinja2 python-multipart
Create a FastAPI endpoint.
nano main.py
Add the following code.
from fastapi import FastAPI, Request, Form
from fastapi.responses import HTMLResponse
from fastapi.templating import Jinja2Templates
import requests
import json
app = FastAPI()
templates = Jinja2Templates(directory="templates")
OLLAMA_URL = "http://localhost:11434/api/generate"
@app.get("/", response_class=HTMLResponse)
def load_chat(request: Request):
return templates.TemplateResponse("index.html", {"request": request, "response": ""})
@app.post("/", response_class=HTMLResponse)
async def get_response(request: Request, prompt: str = Form(...)):
payload = {
"model": "mistral",
"prompt": prompt
}
# Collect response stream
response = requests.post(OLLAMA_URL, json=payload, stream=True)
output = ""
for line in response.iter_lines():
if line:
chunk = json.loads(line.decode("utf-8"))
output += chunk.get("response", "")
return templates.TemplateResponse("index.html", {
"request": request,
"response": output,
"prompt": prompt
})
Create a simple HTML form to interact with the model.
mkdir templates
nano templates/index.html
Add the following code.
Ollama Chat
Ollama Chat Interface
{% if response %}
Response:
{{ response }}
{% endif %}
Step 5: Run the Web App
Finally, start your FastAPI server.
uvicorn main:app --host 0.0.0.0 --port 8000
Output.
INFO: Started server process [41142]
INFO: Waiting for application startup.
INFO: Application startup complete.
INFO: Uvicorn running on http://0.0.0.0:8000 (Press CTRL+C to quit)
Now open http://your-server-ip:8000 in your browser. You will see the FastAPI interface with a chat box.
Type "Please explain about linux operating system" and click on Send. You will see a real-time response from the Ollama model.
Conclusion
You’ve now seen how to serve large language models like Mistral on your own GPU server using Ollama. Starting from setting up Python and the Ollama runtime to calling the model through a REST API, you also built a lightweight web interface with FastAPI and Jinja2 to send prompts and display streamed responses. This setup is ideal for creating private, low-latency LLM applications that run entirely on your infrastructure.
### How to Use GPU Servers to Generate Embeddings for Weaviate Vector Search on Ubuntu 24.04
Weaviate is a powerful open-source vector database designed to perform semantic search using vector embeddings. When you integrate it with GPU-powered servers, embedding generation becomes significantly faster, especially for large-scale or real-time applications.
In this guide, you'll learn how to:
Set up Weaviate using Docker
Leverage a GPU for fast embedding generation
Store custom embeddings in Weaviate
Query and manage vectorized data using Python scripts
Prerequisites
An Ubuntu 24.04 server with an NVIDIA GPU.
A non-root user or a user with sudo privileges.
NVIDIA drivers are installed on your server.
Step 1: Install Required Dependencies
First, install Python and the necessary tools.
apt install python3 python3-pip python3-venv -y
Restart Docker to ensure GPU support.
systemctl restart docker
Verify that the NVIDIA container runtime is available.
docker info | grep -i runtime
Output.
Runtimes: io.containerd.runc.v2 nvidia runc
Default Runtime: runc
Step 2: Set Up Weaviate with Docker
Configure and launch Weaviate using Docker Compose, ensuring proper port exposure for both REST and gRPC connections that will be used for vector operations.
Create a docker-compose.yml file.
nano docker-compose.yml
Add the below configuration.
services:
weaviate:
image: semitechnologies/weaviate:latest
ports:
- "8080:8080"
- "50051:50051" # <-- required for gRPC
environment:
ENABLE_MODULES: ''
DEFAULT_VECTORIZER_MODULE: 'none'
QUERY_DEFAULTS_LIMIT: 25
AUTHENTICATION_ANONYMOUS_ACCESS_ENABLED: 'true'
Start Weaviate container using the below command.
docker-compose up -d
Verify the running container.
docker ps
Output.
CONTAINER ID IMAGE COMMAND CREATED STATUS PORTS NAMES
2166c9434c83 semitechnologies/weaviate:latest "/bin/weaviate --hos…" 18 minutes ago Up 18 minutes 0.0.0.0:8080->8080/tcp, [::]:8080->8080/tcp, 0.0.0.0:50051->50051/tcp, [::]:50051->50051/tcp root-weaviate-1
Step 3: Set Up a Python Virtual Environment
In this section, we will create an isolated Python environment to manage dependencies cleanly and verify that PyTorch can properly access your GPU hardware.
Create a Python virtual environment.
python3 -m venv venv
Activate the environment.
source venv/bin/activate
Update pip to the latest version.
pip install --upgrade pip
Install required Python packages.
pip install sentence-transformers weaviate-client torch torchvision
Verify GPU availability.
python3 -c "import torch; print(torch.cuda.is_available())"
Output.
True
Step 4: Generate Embeddings Using GPU
In this section, we will create a Python script that leverages GPU acceleration to convert text into high-dimensional vectors using the sentence-transformers library.
Create generate_embeddings.py.
nano generate_embeddings.py
Add the following code.
from sentence_transformers import SentenceTransformer
import torch
device = "cuda" if torch.cuda.is_available() else "cpu"
model = SentenceTransformer('all-MiniLM-L6-v2', device=device)
def get_embedding(text):
embedding = model.encode(text, convert_to_tensor=True)
return embedding.cpu().numpy().tolist()
Run the script.
python3 generate_embeddings.py
Step 5: Insert Data into Weaviate
In this section, we will create and populate a Weaviate collection with your text documents and their corresponding GPU-generated vector embeddings.
Create insert_to_weaviate.py.
nano insert_to_weaviate.py
Add the following code.
from weaviate.connect import ConnectionParams
from weaviate import WeaviateClient
from weaviate.collections.classes.config import DataType
from generate_embeddings import get_embedding
# Connect to Weaviate
connection_params = ConnectionParams.from_url("http://localhost:8080", 50051)
client = WeaviateClient(connection_params)
client.connect()
# Define class name
class_name = "Document"
# Create collection if not exists
if not client.collections.exists(class_name):
client.collections.create(
name=class_name,
vectorizer_config=None, # Use custom embeddings
properties=[
{"name": "content", "data_type": DataType.TEXT} # ✅ Correct enum
]
)
# Sample texts to insert
texts = [
"Weaviate is a vector database.",
"GPU servers are great for deep learning.",
"Embeddings help convert text into searchable vectors."
]
collection = client.collections.get(class_name)
for text in texts:
vector = get_embedding(text)
collection.data.insert(
properties={"content": text},
vector=vector
)
# Close the connection properly
client.close()
Run the script.
python3 insert_to_weaviate.py
Step 6: Query Data in Weaviate
In this section, we will execute vector similarity searches against your Weaviate database to retrieve relevant documents based on semantic meaning rather than exact keyword matches.
Create search_weaviate.py.
nano search_weaviate.py
Add the following code.
from weaviate.connect import ConnectionParams
from weaviate import WeaviateClient
from generate_embeddings import get_embedding
# Connect to Weaviate
connection_params = ConnectionParams.from_url("http://localhost:8080", 50051)
client = WeaviateClient(connection_params)
client.connect()
collection = client.collections.get("Document")
# Query
query = "What is Weaviate?"
query_vector = get_embedding(query)
# Perform search
results = collection.query.near_vector(
near_vector=query_vector,
limit=3,
return_properties=["content"]
)
# Print results
print("\nSearch Results:")
for result in results.objects:
print(f"- {result.properties['content']}")
client.close()
Run the script.
python3 search_weaviate.py
You will see the following output.
Search Results:
- Weaviate is a vector database.
- Embeddings help convert text into searchable vectors.
- GPU servers are great for deep learning.
Step 7: Manage Documents
In this section, we will learn additional operations for maintaining your vector database, including listing, updating, and removing documents as needed.
First, create a script to list all documents.
nano list_documents.py
Add the following code.
from weaviate.connect import ConnectionParams
from weaviate import WeaviateClient
connection_params = ConnectionParams.from_url("http://localhost:8080", 50051)
client = WeaviateClient(connection_params)
client.connect()
collection = client.collections.get("Document")
# Replace with actual UUID
doc_id = "REPLACE-WITH-UUID"
# Delete the document
success = collection.data.delete(uuid=doc_id)
print("Deleted successfully?" , success)
client.close()
Run the script.
python3 list_documents.py
You will see all documents in the output below.
Documents in 'Document' collection:
- ID: 2189ca0b-ebdb-437a-90f1-d2881bfbbbd7 | Content: Weaviate is a vector database.
- ID: 296db11b-b2bc-4554-a236-2fee50579c2d | Content: GPU servers are great for deep learning.
- ID: dde5a358-058b-46f3-9033-47967df64a01 | Content: Embeddings help convert text into searchable vectors.
Create an update_document.py script to update the existing document.
nano update_document.py
Add the below code.
from weaviate.connect import ConnectionParams
from weaviate import WeaviateClient
from weaviate.collections.classes.config import DataType
from generate_embeddings import get_embedding
# Connect to Weaviate
connection_params = ConnectionParams.from_url("http://localhost:8080", 50051)
client = WeaviateClient(connection_params)
client.connect()
try:
collection = client.collections.get("Document")
# UUID of the document to update (replace with actual ID)
doc_id = "296db11b-b2bc-4554-a236-2fee50579c2d"
# New content
new_text = "Updated description about vector databases."
# Generate new embedding
new_vector = get_embedding(new_text)
# Delete existing object by ID
collection.data.delete_by_id(doc_id)
# Re-insert object with same ID and new content + vector
collection.data.insert(
uuid=doc_id,
properties={"content": new_text},
vector=new_vector
)
print("✅ Document updated successfully.")
finally:
client.close()
Replaced the id "296db11b-b2bc-4554-a236-2fee50579c2d" with the actual document.
Run the script.
python3 update_document.py
Output.
✅ Document updated successfully.
Create a delete_document.py to delete the existing document.
nano delete_document.py
Add the below code.
from weaviate.connect import ConnectionParams
from weaviate import WeaviateClient
# Connect to Weaviate
connection_params = ConnectionParams.from_url("http://localhost:8080", 50051)
client = WeaviateClient(connection_params)
client.connect()
try:
# Get the 'Document' collection
collection = client.collections.get("Document")
# Replace this with the actual UUID you want to delete
doc_id = "2189ca0b-ebdb-437a-90f1-d2881bfbbbd7"
# Delete the object by UUID
deleted = collection.data.delete_by_id(doc_id)
if deleted:
print(f"✅ Document with ID {doc_id} deleted successfully.")
else:
print(f"❌ Document with ID {doc_id} not found or could not be deleted.")
finally:
client.close()
Run the script.
python3 delete_document.py
Output.
✅ Document with ID 2189ca0b-ebdb-437a-90f1-d2881bfbbbd7 deleted successfully.
Conclusion
Congratulations! You've successfully created a powerful vector search system that combines Weaviate's efficient similarity search capabilities with GPU-accelerated embedding generation. This setup demonstrates how modern hardware can dramatically improve the performance of semantic search applications.
### How to Deploy Milvus with GPU Support for High-Speed Indexing on Ubuntu 24.04
Milvus is an open-source vector database designed for high-performance similarity search and AI applications. When deployed with GPU acceleration, Milvus can significantly speed up indexing and search tasks, perfect for machine learning workloads.
In this guide, you'll learn how to deploy Milvus with GPU support on Ubuntu 24.04 using Docker, configure it for GPU-accelerated FAISS indexing, and test it with a Python script.
Prerequisites
An Ubuntu 24.04 server with an NVIDIA GPU.
A non-root user or a user with sudo privileges.
NVIDIA drivers are installed on your server.
Step 1: Install Required Dependencies
In this step, we install essential packages like Python, Docker Compose, and set up a Python virtual environment.
apt install python3 python3-dev python3-venv docker-compose -y
Create and activate the virtual environment:
python3 -m venv venv
source venv/bin/activate
Upgrade pip to the latest version.
pip install --upgrade pip
Restart Docker to ensure all changes are applied:
systemctl restart docker
This sets up a clean Python environment and prepares your system for Dockerized deployment.
Step 2: Verify Docker GPU Runtime
Check if your Docker installation is configured to support GPU access.
docker info | grep -i runtimes
Output.
Runtimes: nvidia runc io.containerd.runc.v2
If NVIDIA is missing, install the NVIDIA Container Toolkit to enable GPU support in Docker containers.
Step 3: Clone the Milvus Repository
Milvus provides a Docker-based deployment setup. We’ll use their official repository.
Clone the Milvus repository.
git clone https://github.com/milvus-io/milvus.git
Navigate to the standalone directory.
cd milvus/deployments/docker/standalone
This directory contains Docker Compose files for deploying Milvus in standalone mode.
Step 4: Configure Docker Compose for GPU Acceleration
In this section, we will create a docker-compose.yml with a GPU-optimized configuration.
nano docker-compose.yml
Remove the default configuration and add the following configuration:
version: '3.5'
services:
etcd:
container_name: milvus-etcd
image: quay.io/coreos/etcd:v3.5.18
environment:
- ETCD_AUTO_COMPACTION_MODE=revision
- ETCD_AUTO_COMPACTION_RETENTION=1000
- ETCD_QUOTA_BACKEND_BYTES=4294967296
- ETCD_SNAPSHOT_COUNT=50000
volumes:
- ${DOCKER_VOLUME_DIRECTORY:-.}/volumes/etcd:/etcd
command: etcd -advertise-client-urls=http://etcd:2379 -listen-client-urls http://0.0.0.0:2379 --data-dir /etcd
healthcheck:
test: ["CMD", "etcdctl", "endpoint", "health"]
interval: 30s
timeout: 20s
retries: 3
minio:
container_name: milvus-minio
image: minio/minio:RELEASE.2023-03-20T20-16-18Z
environment:
MINIO_ACCESS_KEY: minioadmin
MINIO_SECRET_KEY: minioadmin
ports:
- "9001:9001"
- "9000:9000"
volumes:
- ${DOCKER_VOLUME_DIRECTORY:-.}/volumes/minio:/minio_data
command: minio server /minio_data --console-address ":9001"
healthcheck:
test: ["CMD", "curl", "-f", "http://localhost:9000/minio/health/live"]
interval: 30s
timeout: 20s
retries: 3
standalone:
container_name: milvus-standalone
image: milvusdb/milvus:v2.3.9-gpu
command: ["milvus", "run", "standalone"]
security_opt:
- seccomp:unconfined
environment:
MINIO_REGION: us-east-1
ETCD_ENDPOINTS: etcd:2379
MINIO_ADDRESS: minio:9000
CUDA_VISIBLE_DEVICES: "0"
volumes:
- ${DOCKER_VOLUME_DIRECTORY:-.}/volumes/milvus:/var/lib/milvus
healthcheck:
test: ["CMD", "curl", "-f", "http://localhost:9091/healthz"]
interval: 30s
start_period: 90s
timeout: 20s
retries: 3
ports:
- "19530:19530"
- "9091:9091"
depends_on:
- "etcd"
- "minio"
deploy:
resources:
reservations:
devices:
- driver: nvidia
count: all
capabilities: [gpu]
networks:
default:
name: milvus
This setup ensures Milvus and its dependencies, like etcd and MinIO, run correctly with GPU support.
Step 5: Launch Milvus with Docker Compose
Start the Milvus standalone stack using Docker Compose.
docker compose up -d
Check the container status.
docker ps
Output.
CONTAINER ID IMAGE COMMAND CREATED STATUS PORTS NAMES
0e15ab0d6d9a milvusdb/milvus:v2.3.9-gpu "/tini -- milvus run…" 4 minutes ago Up 4 minutes (healthy) 0.0.0.0:9091->9091/tcp, [::]:9091->9091/tcp, 0.0.0.0:19530->19530/tcp, [::]:19530->19530/tcp milvus-standalone
d3c681c4ef63 minio/minio:RELEASE.2023-03-20T20-16-18Z "/usr/bin/docker-ent…" 4 minutes ago Up 4 minutes (healthy) 0.0.0.0:9000-9001->9000-9001/tcp, [::]:9000-9001->9000-9001/tcp milvus-minio
d59b8cd4bb7b quay.io/coreos/etcd:v3.5.18 "etcd -advertise-cli…" 4 minutes ago Up 4 minutes (healthy) 2379-2380/tcp
You should see three containers: milvus-standalone, milvus-minio, and milvus-etcd, all marked healthy.
Step 6: Verify GPU Access Inside the Container
Now we’ll enter the Milvus container to confirm it can see the host GPU.
docker exec -it milvus-standalone bash
After you connect to the container, you will get the following shell.
root@0e15ab0d6d9a:/milvus#
Run the below command to see the host GPU.
nvidia-smi
Output.
Wed Jun 25 14:32:10 2025
+-----------------------------------------------------------------------------------------+
| NVIDIA-SMI 550.90.07 Driver Version: 550.90.07 CUDA Version: 12.4 |
|-----------------------------------------+------------------------+----------------------+
| GPU Name Persistence-M | Bus-Id Disp.A | Volatile Uncorr. ECC |
| Fan Temp Perf Pwr:Usage/Cap | Memory-Usage | GPU-Util Compute M. |
| | | MIG M. |
|=========================================+========================+======================|
| 0 NVIDIA A40-12Q On | 00000000:06:00.0 Off | 0 |
| N/A N/A P8 N/A / N/A | 1MiB / 12288MiB | 0% Default |
| | | N/A |
+-----------------------------------------+------------------------+----------------------+
+-----------------------------------------------------------------------------------------+
| Processes: |
| GPU GI CI PID Type Process name GPU Memory |
| ID ID Usage |
|=========================================================================================|
| No running processes found |
+-----------------------------------------------------------------------------------------+
Exit the container once verified.
exit
Step 7: Create a Python Script to Test GPU FAISS Indexing
Let’s run a quick demo to validate that GPU-based indexing works using the Milvus Python SDK.
Create a new Python script.
nano milvus_faiss_gpu_demo.py
Add the below configuration.
from pymilvus import connections, utility, Collection, FieldSchema, CollectionSchema, DataType
import random
import numpy as np
# Step 1: Connect to Milvus
connections.connect(alias="default", host="localhost", port="19530")
print("✅ Connected to Milvus")
# Step 2: Create a collection with FLOAT_VECTOR field
collection_name = "demo_gpu_vectors"
# Delete old collection if exists
if utility.has_collection(collection_name):
Collection(collection_name).drop()
print(f"⚠️ Dropped existing collection: {collection_name}")
# Define schema
fields = [
FieldSchema(name="id", dtype=DataType.INT64, is_primary=True, auto_id=False),
FieldSchema(name="embedding", dtype=DataType.FLOAT_VECTOR, dim=128)
]
schema = CollectionSchema(fields, description="GPU FAISS test collection")
collection = Collection(name=collection_name, schema=schema)
print(f"✅ Created collection: {collection_name}")
# Step 3: Insert 1,000 random vectors
num_vectors = 1000
vectors = np.random.random((num_vectors, 128)).astype("float32")
ids = [i for i in range(num_vectors)]
data = [ids, vectors]
collection.insert(data)
print(f"✅ Inserted {num_vectors} vectors")
# Step 4: Create GPU FAISS index
index_params = {
"index_type": "IVF_FLAT", # GPU-accelerated
"metric_type": "L2",
"params": {"nlist": 128}
}
collection.create_index(field_name="embedding", index_params=index_params)
print("✅ Index created with IVF_FLAT (GPU enabled)")
# Step 5: Load collection into memory
collection.load()
print("✅ Collection loaded into memory")
# Step 6: Perform a similarity search
search_vectors = [vectors[42]] # Use a vector from dataset
search_params = {"metric_type": "L2", "params": {"nprobe": 10}}
results = collection.search(
search_vectors,
"embedding",
search_params,
limit=5,
output_fields=["id"]
)
print("\n🔍 Top 5 Similar Vectors:")
for hit in results[0]:
print(f"ID: {hit.id}, Distance: {hit.distance:.4f}")
This script connects to Milvus, inserts 1000 random vectors, creates a GPU-accelerated FAISS index, and performs a similarity search.
Step 8: Install the Milvus Python SDK and Run the Script
Now, install the Python SDK client.
pip install pymilvus
Run the script.
python3 milvus_faiss_gpu_demo.py
After the successful connection, you will get the following output.
✅ Connected to Milvus
✅ Created collection: demo_gpu_vectors
✅ Inserted 1000 vectors
✅ Index created with IVF_FLAT (GPU enabled)
✅ Collection loaded into memory
🔍 Top 5 Similar Vectors:
ID: 42, Distance: 0.0000
ID: 165, Distance: 15.2311
ID: 437, Distance: 15.4424
ID: 921, Distance: 15.5928
ID: 549, Distance: 15.6674
This confirms that GPU-based indexing and similarity search are working as expected.
Conclusion
You have successfully deployed Milvus with GPU support on Ubuntu 24.04. By using the FAISS IVF_FLAT index on GPU, you can perform high-speed similarity searches across thousands (or millions) of vectors with impressive performance. This setup is ideal for real-time recommendation engines, semantic search, and AI applications.
### Top ML Development Companies in 2025
Machine learning development companies create specialized software that utilizes machine learning models to automate tasks, enable data analysis, and improve organizational performance. In 2025, the demand for proficient ML development companies has grown as organizations aim to extract valuable insights from their data. An AI development company provides a range of AI solutions and machine learning services, from natural language processing and computer vision to predictive analytics and the construction of neural networks.
Machine Learning App Development Services
The selection of a development company for machine learning solutions is a critical decision that can impact business growth. The ideal partner has deep technical expertise, an understanding of specific business goals, and the capability to deliver tailored software solutions.
The best artificial intelligence companies provide guidance through the entire process, from data collection and data preparation to the deployment and continuous monitoring of machine learning models in production environments. The objective is to understand business operations, enhance operational efficiency, and optimize processes through the use of intelligent systems.
Cutting Edge AI Technologies
This article examines leading ML development companies in 2025, their strengths, and the types of businesses they are best suited to serve are highlighted. These organizations are at the forefront of implementing cutting-edge AI technologies and machine learning algorithms.
This work enables businesses across various industries to optimize operations. Whether you require custom ML model development, seamless integration with existing systems, or ongoing machine learning consulting, the following companies offer a diverse set of capabilities.
Leading ML Development Companies for 2025
Seven leading ML development companies are reviewed below. They are notable for their machine learning development services and custom solutions, offering unique strengths in AI and ML development.
#1: H2O.ai
H2O.ai is a leader in the artificial intelligence space, positioned as a core technology innovator. The company's reputation is built on its open-source platform and its commercial H2O Driverless AI, which automates the machine learning workflow. This focus on automation has led to consistent recognition, including being named a "Visionary" in the Gartner® Magic Quadrant™ for Data Science and Machine Learning Platforms.
A cloud platform is provided that enables data science teams to be more productive. A key differentiator is its work in image recognition and Explainable AI (XAI), which provides transparent model predictions—a crucial feature for organizations in regulated sectors.
Advantages:
Automated Machine Learning (AutoML): The Driverless AI platform automates time-intensive tasks like feature engineering and model tuning, significantly reducing development cycles.
Performance and Scalability: Engineered for speed, the platform excels at handling massive datasets, allowing for rapid model training and deployment of ML systems.
Proven Enterprise Impact: Global brands like AT&T and Epsilon used H2O.ai to transform operations, from optimizing call centers with Generative AI to boosting marketing return on investment (ROI).
Disadvantages:
Steep Learning Curve: While Driverless AI is user-friendly, the broader open-source platform can be complex for teams new to machine learning.
Cost of Enterprise Features: Accessing the full suite of advanced features and premium support represents a significant investment.
Ideal for:
Large enterprises, particularly in finance, insurance, and healthcare, that require a scalable, explainable, and high-performance AI platform to enhance their internal data science capabilities.
#2: Magora Systems
Magora Systems provides customized software and mobile app development with a focus on AI and machine learning. With a presence in the UK and the US, it operates as a full-service partner. Its portfolio shows cross-industry expertise, with successful projects in logistics, e-commerce, and healthcare.
Advantages:
Full-Spectrum Custom Solutions: As an app development company, Magora excels at end-to-end projects, building tailored solutions like the AI-powered fault detection system for the Eastern Australia railway network.
Verified Client Success: The company has a strong portfolio and a track record of positive client testimonials that praise its technical acumen and professionalism.
Integrated Expertise: They seamlessly blend machine learning with robust software and web development, creating cohesive and functional products.
Transparent Process: A clear, six-step development process ensures clients have visibility and input throughout the project lifecycle.
Disadvantages:
Premium Pricing: The cost for their high-touch, bespoke development services is higher than that of smaller firms or freelance developers.
Resource Allocation: As a busy agency, project start times and resource availability may vary depending on their current workload.
Ideal for:
Businesses of all sizes, from startups to large enterprises, seeking a reliable, full-service partner to design and build custom AI-powered software from the ground up.
#3: STX Next
As one of Europe's largest software houses specializing in Python, STX Next is a significant presence in the machine learning domain. Their large team of Python software engineers provides a distinct advantage. The company's philosophy is to engineer the entire software ecosystem required for ML models to function in a production environment.
Advantages:
Unmatched Python Expertise: With a large team of Python developers, they possess the specialized skills essential for machine learning software development and handling complex data.
Holistic Product Teams: STX Next provides an integrated development team that covers the full software development lifecycle, from data science and QA to DevOps.
Focus on Production-Ready ML: A strong emphasis on Machine Learning Operations (MLOps) ensures solutions are scalable and maintainable in real-world applications.
Integrated Product Development: They can build the web or mobile app that leverages the ML model, providing a one-stop shop for creating AI-powered products.
Disadvantages:
Broad Focus: As a large software development company, ML is one of several core offerings. Companies seeking a highly specialized, AI-only firm might look elsewhere.
Geographic Focus: Their core team's location in Europe could pose time-zone challenges for clients in the Americas.
Ideal for:
Companies that need to develop a complete software product with a machine learning component at its heart, and who value having a single, integrated team to handle everything from model creation to application development.
#4: The Dot Collective
The Dot Collective operates on the premise that successful AI is built on a foundation of well-governed data. This specialized data consultancy focuses on data engineering, cloud architecture, and MLOps. Its primary mission is to build data platforms that enable organizations to execute their own data initiatives, often using robotic process automation.
Advantages:
Foundation-First Approach: They specialize in creating the robust data architecture and governance essential for successful and scalable machine learning.
Expertise in Data Engineering and MLOps: Their core strength lies in designing and implementing the data pipelines and operational frameworks that make ML at scale possible.
Cloud-Native Proficiency: They are experts in building bespoke, flexible data solutions on modern cloud platforms.
Strategic Partnership: They act as strategic partners to align a company's data infrastructure with its long-term business and AI ambitions.
Disadvantages:
Not a Pure ML Model Builder: Their primary focus is on the data platform and infrastructure, not the custom development of specific ML algorithms.
Niche Focus: They are best suited for a specific client, one that needs to build or modernize its core data platform before diving deep into ML development.
Ideal for:
Large or complex enterprises that need to build or overhaul their data infrastructure before scaling their machine learning capabilities and want to establish best practices in data governance and MLOps.
#5: CodeTrade.IO
CodeTrade.IO is focused on making AI and ML development accessible for startups and small to medium-sized businesses (SMBs) while ensuring robust data security. The provide tailored solutions in predictive analytics, computer vision, and NLP. The model uses advanced algorithms to improve customer engagement.
Advantages:
Focus on SMBs and Startups: Their pricing and engagement models are structured to fit the budgets and needs of smaller businesses.
Flexible Engagement Models: Clients can choose from project-based work or hiring dedicated developers, offering significant control.
Full Source Code Ownership: This unique offering provides clients with long-term security and freedom, preventing vendor lock-in.
Integrated App Development: They can seamlessly integrate their ML solutions into new or existing web and mobile applications.
Disadvantages:
Less Suited for Massive Enterprise Needs: They may not have the extensive resources required for the highly complex AI deployments of the largest enterprise clients.
Diverse Service Portfolio: Their focus covers a wide range of IT services, which may be less specialized than a dedicated AI-only consultancy.
Ideal for:
Startups and SMBs that need a cost-effective and adaptable partner for integrating AI features into their software products and who prioritize control and ownership of their intellectual property.
#6: Accenture
Accenture is a global consulting business with a major presence in artificial intelligence. They offer end-to-end AI services, from strategic consulting to the implementation and operation of complex AI systems. Accenture's approach is to partner with large organizations to drive enterprise-wide transformation, integrating AI into the core of their business processes.
Advantages:
Strategic Enterprise Partnership: Accenture excels at developing AI strategies that align with the C-suite business objectives, focusing on tech that drives value.
Deep Industry and Functional Expertise: With a presence across virtually all sectors, they bring a deep understanding of specific industry challenges and can deploy tailored AI solutions for functions like supply chain, finance, and customer service.
Global Scale and Ecosystem: Their extensive global network provides access to a significant pool of talent and strong partnerships with leading technology providers.
Focus on Responsible AI: Accenture places a strong emphasis on developing and deploying AI systems that are ethical, transparent, and accountable, a critical requirement for large, regulated enterprises.
Disadvantages:
Premium Cost Structure: The services of a top-tier global consultancy come at a significant cost, making it less accessible for mid-market companies or startups.
Corporate Overhead: Engagements can be complex and may move at a more deliberate pace than smaller, more agile firms due to the scale of their operations and structured methodologies.
Ideal for: Large, multinational corporations seeking a strategic, long-term partner to guide them through a complete business transformation powered by AI, from initial strategy and data readiness to full-scale implementation and change management.
#7: Scale AI
Scale AI is a leader in the data-centric AI movement, built on the premise that high-quality data is the most critical component for building high-performance machine learning models. The company provides a data platform that helps AI teams manage the entire data lifecycle, from annotation and labeling to data curation and model evaluation.
Advantages:
Expertise in High-Quality Data: Scale AI specializes in delivering the accurately labeled and curated data necessary for training advanced ML models, especially for computer vision and large language models (LLMs).
Enterprise-Grade Data Engine: Their platform is designed to handle massive, complex datasets and provides the tools for efficient data annotation, automation, and quality control, which is essential for scaling AI initiatives.
Proven in Advanced AI Fields: They are a key partner for many of the world's most advanced AI development teams, including those in autonomous vehicles, drones, and AI research labs.
Disadvantages:
Focus on Data, Not Model Building: While they provide the critical data foundation, Scale AI is not a custom ML model development shop. Clients are expected to have their own data science teams to build the models.
Cost Can Be a Factor for Simple Projects: Their services are enterprise-grade and may be more than what is required for smaller companies or projects with less stringent data quality needs.
Ideal for: Technology-forward companies and enterprises, particularly in the automotive, robotics, and tech industries, that are developing sophisticated AI systems and require a robust, scalable platform to produce and manage high-quality training data.
AI/ML Business Operations with Atlantic.Net
In 2025, machine learning development is characterized by a wide array of companies and solutions. Whether comprehensive ML development services, automated platforms, or specialized data engineering experts are needed, businesses have many choices. The selection of the right partner for development services and ongoing support is a strategic decision that depends on a company's internal expertise, business goals, and specific challenges.
The goal of this journey—from initial data collection to deployment—is to transform complex data into tailored machine learning solutions that provide business value. These successful projects, which rely on advanced algorithms and sophisticated ml systems, require significant computational power for training and operation.
To support these applications, access to enterprise-grade hardware that can handle demanding AI and deep learning workloads is necessary. A powerful and reliable GPU hosting service is designed to build and scale innovative ai solutions. By providing a development team with flexible, high-performance infrastructure, machine learning projects can be moved from concept to production with confidence.
### How to Build a Real-Time Speech to Text App with Whisper and Flask
Real-time speech-to-text transcription is a powerful application of AI. With the rise of open-source models like OpenAI's Whisper and lightweight web frameworks like Flask, building such tools has become much easier.
In this tutorial, we'll walk you through building a speech-to-text web app that:
Captures audio from your browser,
Sends it to a Flask server using WebSockets,
Transcribes the audio in real time using Whisper,
Displays the transcribed text in the browser.
We'll also show how to expose the app with HTTPS using Nginx and Certbot for a secure experience.
Prerequisites
Before you begin, ensure the following are in place:
An Atlantic.Net cloud GPU server running Ubuntu 24.04 with root access.
A domain name (e.g., app.code2devops.com) pointing to your server IP.
NVIDIA drivers are installed on your server.
Step 1: Install System Dependencies
First, install all the essential system packages required for audio processing and Python development.
apt install espeak ffmpeg libespeak1 python3 python3-dev python3-venv -y
These packages are required for text-to-speech (optional), audio conversion, and Python environment setup.
Step 2: Create a Python Virtual Environment
Create a virtual environment for your project dependencies are isolated and won’t interfere with other Python projects.
Let's create a virtual environment for your project.
python3 -m venv venv
Activate the virtual environment.
source venv/bin/activate
Upgrade pip to the latest version.
pip install --upgrade pip
Step 3: Install Python Packages
Next, install Flask, Whisper, Socket.IO, and supporting libraries for real-time audio streaming and transcription.
pip install flask flask-socketio eventlet whisper torch pyttsx3
Explanation:
Whisper and Torch are for speech recognition.
Flask and flask-socketio serve and manage the web app.
Eventlet enables real-time WebSocket communication.
pyttsx3 is optional, used for speech synthesis if needed.
Step 4: Create the Flask App
Now, build the backend logic using Flask and WebSockets.
Create an app.py file.
nano app.py
Add the following code.
from flask import Flask, render_template
from flask_socketio import SocketIO
from core import transcribe_audio
app = Flask(__name__)
socketio = SocketIO(app, cors_allowed_origins="*")
@app.route("/")
def home():
return render_template("index.html")
@socketio.on("audio")
def handle_audio(data):
with open("temp.webm", "wb") as f:
f.write(data)
text = transcribe_audio("temp.webm")
print("🗣️ Transcribed:", text)
socketio.emit("transcript", {"text": text})
if __name__ == "__main__":
socketio.run(app, host="0.0.0.0", port=5000, debug=True)
This file sets up the Flask web server, handles audio input, and emits transcribed output.
Step 5: Add Whisper Transcription Logic
Create a separate file to manage Whisper transcription logic.
nano core.py
Add the following code.
import whisper
model = whisper.load_model("base")
def transcribe_audio(audio_file):
result = model.transcribe(audio_file)
return result['text'].strip()
This script loads the Whisper model and uses it to transcribe audio.
Step 6: Create the Web Interface
Now let’s build the frontend interface for browser-based audio capture and display.
mkdir templates
nano templates/index.html
Add the following HTML code.
Speech to Text
🎤 Speech to Text Demo
Transcription:
This simple UI allows users to start and stop audio recording and view the transcription in real time.
Step 7: Run the Flask App
Start your Flask application in the background.
python3 app.py &
The app will now be accessible on port 5000.
Step 8: Configure Nginx as a Reverse Proxy
Web browsers do not allow microphone access on insecure (HTTP) websites. This is a built-in security measure to protect user privacy. Since our app relies on real-time voice input, serving it over HTTPS is not optional, it's required for the microphone to work. Additionally, HTTPS ensures all audio data is transmitted securely and cannot be intercepted.
To achieve this, we'll use Nginx to forward requests to our Flask app and later secure the app with Let’s Encrypt SSL certificates using Certbot.
First, install Nginx and other packages.
apt install nginx certbot python3-certbot-nginx -y
Next, create an Nginx configuration file.
nano /etc/nginx/conf.d/app.conf
Add the following configuration.
server {
listen 80;
server_name app.code2devops.com;
location / {
proxy_pass http://127.0.0.1:5000;
proxy_http_version 1.1;
proxy_set_header Upgrade $http_upgrade;
proxy_set_header Connection "upgrade";
proxy_set_header Host $host;
proxy_set_header X-Real-IP $remote_addr;
}
}
Note: Replace the domain app.code2devops.com with your own domain name.
Verify the Nginx configuration.
nginx -t
Restart Nginx to apply the changes.
systemctl restart nginx
Now, use certbot to issue a free SSL certificate and enable HTTPS for your domain.
certbot --nginx -d app.code2devops.com
Step 9: Access and Test Your Application
Visit https://app.code2devops.com in your browser.
Click Start Recording. Allow microphone access when prompted.
Click Stop Recording to stop and see your transcribed text.
Conclusion
You’ve successfully built a real-time speech-to-text web application using Whisper and Flask. The app captures audio through a browser, transcribes it on the server using Whisper, and displays the text in real time. With the help of Nginx and Certbot, you also secured your app using HTTPS and made it publicly accessible via a custom domain.
### Dog vs Cat Convolutional Neural Network Classifier on Ubuntu 24.04 GPU Server
Classifying images of dogs and cats is a classic deep learning problem that helps demonstrate the power of Convolutional Neural Networks (CNNs).
In this tutorial, we'll build a CNN-based classifier using TensorFlow and Keras on an Ubuntu 24.04 server with GPU acceleration. We'll also create a simple Flask-based web interface to upload images and get predictions.
Prerequisites
Before starting, ensure you have:
An Ubuntu 24.04 server with an NVIDIA GPU.
A root user or a user with sudo privileges.
NVIDIA drivers are installed for GPU acceleration.
Step 1: Install Required Packages
First, update your system and install the necessary Python packages:
apt update -y
apt install python3 python3-pip python3-venv
Step 2: Set Up Python Environment
Now, you will create a Python environment for your project.
1. Create a virtual environment.
python3 -m venv ~/dogcat-cnn
2. Activate the virtual environment.
source ~/dogcat-cnn/bin/activate
3. Install the required Python packages.
pip install tensorflow keras flask pillow scipy kaggle
These packages include:
tensorflow for machine learning with GPU support
pillow for image processing
flask for the web interface
kaggle to download datasets
Step 3: Set Up Kaggle API
We’ll use the Kaggle API to download the dataset.
1. Go to Kaggle and log in.
2. Click your profile picture => Account
3. Scroll down to the API section
4. Click "Create New API Token"
5. This will download kaggle.json to your computer
6. Create a Kaggle configuration directory on your server.
mkdir -p ~/.kaggle
7. Copy your downloaded kaggle.json file into the ~/.kaggle folder.
8. Set appropriate permissions.
chmod 600 ~/.kaggle/kaggle.json
This step allows us to download the dataset directly from Kaggle without manual uploads programmatically.
Step 4: Download and Prepare the Dataset
Now, we will use Kaggle to download the Dogs vs Cats dataset from Kaggle and extract it.
1. Download the dataset.
kaggle datasets download -d salader/dogs-vs-cats
2. Unzip the dataset.
unzip dogs-vs-cats.zip
3. Verify the extracted directory.
ls dogs_vs_cats/train/
Output.
cats dogs
4. Create the required directories for your project.
mkdir templates
mkdir -p static/uploads
The dataset contains labeled images of dogs and cats, which we’ll use to train our CNN model.
Step 5: Build and Train the CNN Model
We’ll define a CNN using TensorFlow/Keras and train it on the dataset.
nano dog_cat_classifier.py
Add the below code:
import os
from tensorflow.keras.models import Sequential
from tensorflow.keras.layers import Conv2D, MaxPooling2D, Flatten, Dense, Dropout
from tensorflow.keras.preprocessing.image import ImageDataGenerator
from tensorflow.keras.models import load_model
# Define paths
base_dir = 'dogs_vs_cats'
train_dir = os.path.join(base_dir, 'train')
test_dir = os.path.join(base_dir, 'test')
# Image parameters
img_width, img_height = 150, 150
batch_size = 32
# Data augmentation for training
train_datagen = ImageDataGenerator(
rescale=1./255,
rotation_range=40,
width_shift_range=0.2,
height_shift_range=0.2,
shear_range=0.2,
zoom_range=0.2,
horizontal_flip=True,
fill_mode='nearest')
# Only rescaling for testing
test_datagen = ImageDataGenerator(rescale=1./255)
# Generators
train_generator = train_datagen.flow_from_directory(
train_dir,
target_size=(img_width, img_height),
batch_size=batch_size,
class_mode='binary')
test_generator = test_datagen.flow_from_directory(
test_dir,
target_size=(img_width, img_height),
batch_size=batch_size,
class_mode='binary')
# Build the model
model = Sequential([
Conv2D(32, (3,3), activation='relu', input_shape=(img_width, img_height, 3)),
MaxPooling2D(2,2),
Conv2D(64, (3,3), activation='relu'),
MaxPooling2D(2,2),
Conv2D(128, (3,3), activation='relu'),
MaxPooling2D(2,2),
Flatten(),
Dropout(0.5),
Dense(512, activation='relu'),
Dense(1, activation='sigmoid')
])
# Compile the model
model.compile(loss='binary_crossentropy',
optimizer='adam',
metrics=['accuracy'])
# Train the model
epochs = 10
model.fit(
train_generator,
steps_per_epoch=train_generator.samples // batch_size,
epochs=epochs,
validation_data=test_generator,
validation_steps=test_generator.samples // batch_size)
# Evaluate the model
loss, accuracy = model.evaluate(test_generator)
print(f'Test Accuracy: {accuracy * 100:.2f}%')
# Save the model
model.save('dog_cat_classifier_model.h5')
This CNN model uses convolutional layers to extract features and dense layers for classification. Data augmentation helps improve generalization.
Step 6: Create a Flask Web App for Predictions
We’ll build a simple web interface to upload images and get predictions.
Create a web application file.
nano web_app.py
Add the below code.
from flask import Flask, request, render_template, redirect, url_for
from tensorflow.keras.models import load_model
from tensorflow.keras.preprocessing.image import load_img, img_to_array
import numpy as np
import os
from PIL import Image
app = Flask(__name__)
model = load_model('dog_cat_classifier_model.h5')
UPLOAD_FOLDER = 'static/uploads'
app.config['UPLOAD_FOLDER'] = UPLOAD_FOLDER
def model_predict(img_path):
img = load_img(img_path, target_size=(150, 150))
img_array = img_to_array(img) / 255.0
img_array = np.expand_dims(img_array, axis=0)
prediction = model.predict(img_array)[0][0]
return 'Dog' if prediction > 0.5 else 'Cat'
@app.route('/', methods=['GET', 'POST'])
def index():
if request.method == 'POST':
file = request.files['file']
if file:
filepath = os.path.join(app.config['UPLOAD_FOLDER'], file.filename)
file.save(filepath)
prediction = model_predict(filepath)
return render_template('index.html', prediction=prediction, image_url=filepath)
return render_template('index.html')
if __name__ == '__main__':
app.run(host='0.0.0.0', port=5000)
Create an index.html file.
nano templates/index.html
Add the following code.
Dog vs Cat Classifier
Upload an image of a Dog or Cat
{% if prediction %}
Prediction: {{ prediction }}
{% endif %}
The Flask app loads the trained model and provides an interface for uploading images and receiving real-time predictions.
Step 7: Run the Web App
1. You can now start the Flask Web Application using the following command:
python3 web_app.py
2. Visit http://your-server-ip:5000 in your browser to access the interface.
3. Click Browse and upload a cat image, then click on the Predict button. The web interface classifies the uploaded image with a pre-trained model and displays the result.
Conclusion
We successfully built a Dog vs Cat CNN classifier on Ubuntu 24.04 with GPU support, trained it on a Kaggle dataset, and deployed it using Flask. This project demonstrates:
CNN architecture for image classification.
Data augmentation to improve model robustness.
Flask integration for real-time predictions.
### Lane Line Detection with OpenCV and Flask on Ubuntu 24.04 GPU Server
Lane detection is a key element in autonomous driving systems and driver-assistance technologies. In this article, we’ll walk through implementing lane line detection using OpenCV and Python on an Ubuntu 24.04 GPU server. This real-time solution processes a video stream to identify lane lines using computer vision techniques like edge detection, region masking, and Hough transforms. We'll also create a web interface to display both original and processed videos side-by-side.
What You'll Build
We'll use a video of a car driving on a highway, apply computer vision techniques to detect lane lines, and visualize both the original and processed outputs in a web app. The lane detection is powered by OpenCV, and Flask delivers the interface.
Prerequisites
An Ubuntu 24.04 server with an NVIDIA GPU.
A root user or a user with sudo privileges.
NVIDIA drivers installed.
Step 1: Set Up the Python Environment
To ensure a clean setup with all necessary packages, we'll create a virtual environment and install dependencies.
First, install all necessary dependencies:
apt install python3 python3-dev python3-venv -y
Next, create and activate a virtual environment.
python3 -m venv venv
source venv/bin/activate
Next, update pip to the latest version.
pip install --upgrade pip
Next, install all required packages for this project.
python3 -m pip install opencv-python numpy matplotlib pillow flask kaggle
Step 2: Download the Video Dataset
We'll use the Kaggle lane detection dataset for this project. Follow the below steps to download the Kaggle dataset.
1. Go to Kaggle and log in.
2. Click your profile picture => Account
3. Scroll down to the API section
4. Click "Create New API Token"
5. This will download kaggle.json to your computer
6. Create a Kaggle configuration directory on your server.
mkdir -p ~/.kaggle
7. Copy your downloaded kaggle.json file into the ~/.kaggle folder.
8. Set appropriate permissions.
chmod 600 ~/.kaggle/kaggle.json
9. Download the dataset using the command below.
kaggle datasets download -d dpamgautam/video-file-for-lane-detection-project
10. Unzip the downloaded file.
unzip video-file-for-lane-detection-project.zip
11. This command will extract the test_video.mp4 file from the downloaded zip file.
Step 3: Process the Video with OpenCV
We'll write a Python script that reads each frame, detects edges, isolates the region of interest, and applies the Hough Line Transform to detect lanes on test_video.mp4.
1. Create a file.
nano main.py
Add the below code.
import cv2
import numpy as np
import os
# Global variables
first_frame = True
cache = np.zeros(8)
frame_counter = 0
def interested_region(img, vertices):
mask = np.zeros_like(img)
mask_color = (255,) * img.shape[2] if len(img.shape) > 2 else 255
cv2.fillPoly(mask, vertices, mask_color)
return cv2.bitwise_and(img, mask)
def hough_lines(img, rho, theta, threshold, min_line_len, max_line_gap):
lines = cv2.HoughLinesP(img, rho, theta, threshold, np.array([]),
minLineLength=min_line_len, maxLineGap=max_line_gap)
if lines is None:
print("⚠️ No Hough lines found.")
else:
print(f"✅ Detected {len(lines)} line(s).")
line_img = np.zeros((img.shape[0], img.shape[1], 3), dtype=np.uint8)
lines_drawn(line_img, lines)
return line_img
def lines_drawn(img, lines, color=[0, 255, 0], thickness=3):
if lines is None:
return
for line in lines:
for x1, y1, x2, y2 in line:
cv2.line(img, (x1, y1), (x2, y2), color, thickness)
def weighted_img(img, initial_img, α=0.8, β=1., λ=0.):
return cv2.addWeighted(initial_img, α, img, β, λ)
def process_frame(image):
global frame_counter
# Use full grayscale image (no masking)
gray = cv2.cvtColor(image, cv2.COLOR_BGR2GRAY)
# Gaussian blur
blurred = cv2.GaussianBlur(gray, (5, 5), 0)
# Canny edge detection - more sensitive
edges = cv2.Canny(blurred, 5, 50)
# Region of interest
height, width = image.shape[:2]
roi_vertices = np.array([[
(width * 0.1, height),
(width * 0.45, height * 0.6),
(width * 0.55, height * 0.6),
(width * 0.9, height)
]], dtype=np.int32)
roi = interested_region(edges, roi_vertices)
# Save debug images for the first few frames
if frame_counter < 3:
os.makedirs("debug", exist_ok=True)
cv2.imwrite(f"debug/edges_{frame_counter}.jpg", edges)
cv2.imwrite(f"debug/roi_{frame_counter}.jpg", roi)
# Run relaxed Hough Transform
line_img = hough_lines(roi, 2, np.pi / 180, 10, 20, 50)
result = weighted_img(line_img, image)
frame_counter += 1
return result
if __name__ == "__main__":
cap = cv2.VideoCapture("test_video.mp4")
if not cap.isOpened():
print("❌ Error: Cannot open input video.")
exit(1)
width = int(cap.get(cv2.CAP_PROP_FRAME_WIDTH))
height = int(cap.get(cv2.CAP_PROP_FRAME_HEIGHT))
fps = cap.get(cv2.CAP_PROP_FPS)
fourcc = cv2.VideoWriter_fourcc(*'mp4v')
out = cv2.VideoWriter("output.mp4", fourcc, fps, (width, height))
print("🚀 Processing video...")
while cap.isOpened():
ret, frame = cap.read()
if not ret:
break
processed = process_frame(frame)
out.write(processed)
if frame_counter % 10 == 0:
print(f"📦 Processed {frame_counter} frames...")
cap.release()
out.release()
print("✅ Done. Output saved as output.mp4.")
print("🛠️ Debug edge/ROI images saved to ./debug/")
This code reads each frame, applies edge detection and region masking, then uses HoughLinesP to detect line segments. It overlays the detected lines on the original video and writes the output.
Now, run the above code.
python3 main.py
Step 4: Create the Flask Web App
Now we’ll set up a web server that streams both the original and processed videos.
Create a Flask application file.
nano app.py
Add the following code.
from flask import Flask, render_template, Response
import cv2
app = Flask(__name__)
# Video file paths
video_original = cv2.VideoCapture("test_video.mp4")
video_processed = cv2.VideoCapture("output.mp4")
def generate_frames(video):
while True:
success, frame = video.read()
if not success:
video.set(cv2.CAP_PROP_POS_FRAMES, 0)
continue
_, buffer = cv2.imencode('.jpg', frame)
frame_bytes = buffer.tobytes()
yield (b'--frame\r\n'
b'Content-Type: image/jpeg\r\n\r\n' + frame_bytes + b'\r\n')
@app.route('/')
def index():
return render_template('index.html')
@app.route('/video_original')
def stream_original():
return Response(generate_frames(video_original),
mimetype='multipart/x-mixed-replace; boundary=frame')
@app.route('/video_processed')
def stream_processed():
return Response(generate_frames(video_processed),
mimetype='multipart/x-mixed-replace; boundary=frame')
if __name__ == "__main__":
app.run(host='0.0.0.0', port=5000, debug=False)
This Flask app defines routes to stream both video files as MJPEG streams. The generate_frames() function encodes each video frame into JPEG and streams it continuously.
Step 5: Build the Web Interface
We’ll now create an HTML page to display the input and output video feeds side-by-side.
First, create a templates directory and create an HTML page.
mkdir templates
nano templates/index.html
Add the below code.
Lane Line Detection – Viewer
Lane Line Detection – Input vs Output
Original Video
Processed Video
The HTML page renders both video streams with labels using the routes defined in the Flask app.
Step 6: Run the Flask App
Now, start the Flask server using the command below.
python3 app.py
Open your web browser and access the Flask web interface using the URL http://your-server-ip:5000. You should see both the original and processed videos playing side by side.
Conclusion
You have successfully implemented a full lane detection system using OpenCV and served it with Flask. By leveraging the parallel processing capabilities of GPUs, you can achieve real-time performance essential for critical applications like autonomous navigation. This solution can be extended to use live camera input, real-time overlays, or integration with machine learning models.
### Set up a Transcoding Server with Handbrake and Atlantic Cloud GPU
Transcoding means changing a media file from one format to another. This process can use a lot of CPU and GPU power, especially for large files, which might be too much for a regular computer to handle. A good solution is to use a special server made for transcoding. These servers are fast, powerful, and often use hardware acceleration to speed up the process.
HandBrake is a free, open-source tool that converts video files. You can set it up on a server just for transcoding. When you combine HandBrake with FileBrowser, you can use cloud-based GPU power to make the conversion faster and more efficient.
In this guide, you'll learn how to create a transcoding server using HandBrake on an Atlantic.Net Cloud GPU server.
Prerequisites
An Ubuntu 24.04 server with an NVIDIA GPU.
A root user or a user with sudo privileges.
NVIDIA drivers installed.
Step 1: Create a User
1. First, create a dedicated user for your project.
adduser example-user
2. Add your user to the sudo group.
usermod -aG sudo example-user
3. Add the user to the Docker group.
usermod -aG docker example-user
Step 2: Install HandBrake
In this section, we will create a HandBrake container.
1. Log in as an example-user.
su - example-user
2. Verify that the Docker service is up and running.
sudo service docker status
3. Start a new HandBrake container.
docker run -d --name=handbrake -p 8000:5800 -v /docker/appdata/handbrake:/config:rw -v /home/handbrake-user/:/storage:rw -v /home/handbrake-user/HandBrake/watch:/watch:rw -v /home/handbrake-user/HandBrake/output:/output:rw jlesage/handbrake
Explanation:
The above Docker run command starts a HandBrake container in the background (-d) with the name handbrake.
It maps port 5800 inside the container to port 8000 on the host, allowing you to access HandBrake's web interface via http://localhost:8000.
Several volumes are mounted: /docker/appdata/handbrake is used to store HandBrake's configuration files, /home/handbrake-user/ provides general file access, and specific folders (watch and output) are used for input and output video files.
The container uses the jlesage/handbrake image, which includes a web-based interface for transcoding videos.
4. Verify that the HandBrake container is created and running.
docker ps
Output.
CONTAINER ID IMAGE COMMAND CREATED STATUS PORTS NAMES
00dd17e8cada jlesage/handbrake "/init" 11 seconds ago Up 10 seconds 5900/tcp, 0.0.0.0:8000->5800/tcp, [::]:8000->5800/tcp handbrake
5. Also, verify if HandBrake is listening on port 8000.
ss -antpl | grep 8000
Output.
LISTEN 0 4096 0.0.0.0:8000 0.0.0.0:*
LISTEN 0 4096 [::]:8000 [::]:*
Step 2: Install FileBrowser
FileBrowser is an open-source, self‑hosted web-based file manager that lets you interact with files and folders on your server through a browser.
1. First, create a new directory for storing FileBrowser files.
sudo mkdir /home/handbrake-user/Files
2. Create a database file for FileBrowser.
sudo touch /home/handbrake-user/Files/filebrowser.db
3. Create a new container for FileBrowser.
docker run -d --name=filebrowser -v /home/handbrake-user/Files:/srv -v /home/handbrake-user/Files/filebrowser.db:/database.db -e PGID=$(id -g) -e PUID=$(id -u) -p 8001:80 filebrowser/filebrowser
This command runs a FileBrowser container named filebrowser in the background, maps port 80 in the container to port 8001 on the host, mounts a file directory and database, and sets user permissions using your current user and group ID, enabling web-based file management at http://localhost:8001.
4. Verify that the FileBrowser container created and running.
docker ps
Output.
CONTAINER ID IMAGE COMMAND CREATED STATUS PORTS NAMES
f621cca33d0a filebrowser/filebrowser "/filebrowser" 10 seconds ago Up 9 seconds (healthy) 0.0.0.0:8001->80/tcp, [::]:8001->80/tcp filebrowser
00dd17e8cada jlesage/handbrake "/init" 2 minutes ago Up 2 minutes 5900/tcp, 0.0.0.0:8000->5800/tcp, [::]:8000->5800/tcp handbrake
Step 3: Configure Nginx as a Reverse proxy
In this section, you'll configure Nginx as a reverse proxy to securely route incoming traffic to the internal ports, 8000 for HandBrake and 8001 for FileBrowser, allowing safe and streamlined access to both applications.
1. Install the Nginx server.
sudo apt install nginx -y
2. Delete the default Nginx host configuration file.
sudo rm /etc/nginx/sites-enabled/default
3. Create a new HandBrake configuration file.
sudo nano /etc/nginx/conf.d/handbrake.conf
Add the following configuration.
map $http_upgrade $connection_upgrade {
default upgrade;
'' close;
}
server {
listen 80;
server_name handbrake.example.com;
location / {
proxy_pass http://127.0.0.1:8000;
proxy_set_header Host $host;
proxy_set_header X-Real-IP $remote_addr;
}
location /websockify {
proxy_pass http://127.0.0.1:8000;
proxy_http_version 1.1;
proxy_set_header Upgrade $http_upgrade;
proxy_set_header Connection $connection_upgrade;
proxy_read_timeout 86400;
}
}
4. Test the Nginx configuration.
sudo nginx -t
Output.
nginx: the configuration file /etc/nginx/nginx.conf syntax is ok
nginx: configuration file /etc/nginx/nginx.conf test is successful
5. Create a FileBrowser configuration file.
sudo nano /etc/nginx/conf.d/filebrowser.conf
Add the following configuration.
server {
listen 80;
server_name filebrowser.example.com;
location / {
proxy_pass http://127.0.0.1:8001;
proxy_set_header Host $host;
proxy_set_header X-Real-IP $remote_addr;
}
}
6. Restart Nginx to apply the changes.
sudo systemctl restart nginx
Step 4: Upload Files Using FileBrowser
In this section, you will access the FileBrowser and upload a video file.
1. Open your web browser and access the FileBrowser at http://filebrowser.example.com.
2. Provide the default administrator username admin and password admin to log in to FileBrowser.
3. Click New Folder on the left navigation menu to create a new folder named HandBrake-uploads.
4. Click the Upload ↑ button on the top right bar.
5. In the pop-up window, click File to browse and upload a video file from your computer.
6. After the upload finishes, check that the file appears in the directory so you can begin the transcoding process with HandBrake.
Step 5: Transcode Files Using Handbrake
In this section, you will access the Handbrake web interface and transcode your uploaded video file using Handbrake.
1. Access the Handbrake web UI using the URL http://handbrake.example.com.
2. Click Open Source to locate your media file.
3. Navigate to the Files directory where you uploaded the media file and click Open to load it.
4. Click the Presets button in the top-right toolbar, choose your preferred transcode preset (e.g., Creator 2160p60 4K) from the dropdown, then close the popup by clicking the X.
5. In the Summary section, open the Format dropdown and choose your desired output format.
6. In the Video section, set your preferred Video Encoder and Framerate.
7. Adjust settings in the Audio, Subtitles, and Tags sections as needed.
8. In the Save As field at the bottom, enter a name for the output file. Under the TO: dropdown, click it, scroll down, select Other, then use the file manager to open the storage folder and choose the Files directory as the output location.
9. Click Start to begin the transcoding process.
Step 6: Download Transcoded Files
1. Go back to the FileBrowser dashboard.
2. Verify that the new transcoded file is available in your Files directory.
3. Click the file, then click the Download ↓ button on the top right bar.
4. Download and save the file on your computer.
Conclusion
You've successfully set up a transcoding server using HandBrake on an Atlantic.net Cloud GPU. With GPU acceleration, you can transcode multiple files simultaneously while maintaining high output quality, which can be easily downloaded via FileBrowser. If you need faster conversions or have heavier workloads, you can scale your GPU instance for more processing power. To increase storage capacity, simply attach a block storage volume.
### How to Use Zilliz for Scalable Vector Search on Ubuntu 24.04 GPU Instances
Vector search has become a critical component of modern AI applications, enabling efficient similarity searches in high-dimensional spaces. Zilliz is a powerful vector database that provides scalable, high-performance search capabilities, particularly when leveraging GPU acceleration.
In this guide, we'll walk through setting up and using Zilliz on Ubuntu 24.04 GPU instances for optimal vector search performance.
Prerequisites
Before getting started, ensure you have:
An Ubuntu 24.04 server with NVIDIA GPU(s).
NVIDIA drivers installed.
A non-root user with sudo privileges.
Step 1: Set Up Your GPU Environment
First, install the necessary dependencies.
apt update -y
apt install -y python3-pip python3-venv docker-compose
Step 2: Install Zilliz with GPU Support
Zilliz offers several deployment options. For GPU instances, we recommend using Milvus (the open-source version of Zilliz) with GPU acceleration:
1. Create a directory for your Zilliz deployment.
mkdir zilliz-gpu && cd zilliz-gpu
2. Create a docker-compose.yaml file for GPU-enabled Milvus.
nano docker-compose.yaml
Add the below content:
version: '3.5'
services:
etcd:
container_name: milvus-etcd
image: quay.io/coreos/etcd:v3.5.5
environment:
- ETCD_AUTO_COMPACTION_MODE=revision
- ETCD_AUTO_COMPACTION_RETENTION=1000
- ETCD_QUOTA_BACKEND_BYTES=4294967296
- ETCD_SNAPSHOT_COUNT=50000
volumes:
- ${DOCKER_VOLUME_DIRECTORY:-.}/etcd:/etcd
command: etcd -advertise-client-urls=http://127.0.0.1:2379 -listen-client-urls http://0.0.0.0:2379 --data-dir /etcd
minio:
container_name: milvus-minio
image: minio/minio:RELEASE.2023-03-20T20-16-18Z
environment:
MINIO_ACCESS_KEY: minioadmin
MINIO_SECRET_KEY: minioadmin
volumes:
- ${DOCKER_VOLUME_DIRECTORY:-.}/minio:/minio_data
command: minio server /minio_data
healthcheck:
test: ["CMD", "curl", "-f", "http://localhost:9000/minio/health/live"]
interval: 30s
timeout: 20s
retries: 3
standalone:
container_name: milvus-standalone
image: milvusdb/milvus:v2.3.3-gpu
command: ["milvus", "run", "standalone"]
environment:
ETCD_ENDPOINTS: etcd:2379
MINIO_ADDRESS: minio:9000
volumes:
- ${DOCKER_VOLUME_DIRECTORY:-.}/volumes/milvus:/var/lib/milvus
ports:
- "19530:19530"
- "9091:9091"
depends_on:
- "etcd"
- "minio"
deploy:
resources:
reservations:
devices:
- driver: nvidia
count: 1
capabilities: [gpu]
3. Start the containers.
docker-compose up -d
4. Verify the services are running.
docker ps
Output.
CONTAINER ID IMAGE COMMAND CREATED STATUS PORTS NAMES
66ac3ea90205 milvusdb/milvus:v2.3.3-gpu "/tini -- milvus run…" 11 minutes ago Up 11 minutes 0.0.0.0:9091->9091/tcp, [::]:9091->9091/tcp, 0.0.0.0:19530->19530/tcp, [::]:19530->19530/tcp milvus-standalone
cd2e62004369 quay.io/coreos/etcd:v3.5.5 "etcd -advertise-cli…" 11 minutes ago Up 11 minutes 2379-2380/tcp milvus-etcd
e09e5cb48212 minio/minio:RELEASE.2023-03-20T20-16-18Z "/usr/bin/docker-ent…" 11 minutes ago Up 11 minutes (healthy) 9000/tcp milvus-minio
Step 3: Install Python Client and Dependencies
1. Create a Python virtual environment.
python3 -m venv zilliz-env
source zilliz-env/bin/activate
2. Install the necessary Python packages.
pip install pymilvus torch torchvision sentence-transformers
Step 4: Connect to Zilliz and Create a Collection
1. First, create a Python script to import all necessary Python modules, including the Milvus client and SentenceTransformer for embedding generation.
nano zilliz_demo.py
Add the below code:
#!/usr/bin/env python3
from pymilvus import connections, utility, FieldSchema, CollectionSchema, DataType, Collection
from sentence_transformers import SentenceTransformer
import time
import torch
import pymilvus
Explanation:
pymilvus is used to interact with the Milvus vector database.
SentenceTransformer loads a pre-trained transformer model for sentence embeddings.
torch detects if GPU is available for faster inference.
2. Verify a connection to Milvus server.
def verify_connection():
"""Verify connection to Milvus server"""
try:
# Test connection
connections.connect("default", host="localhost", port="19530")
print("✓ Successfully connected to Milvus server")
# Check server status
print(f"Server status: {utility.get_server_version()}")
print(f"List of collections: {utility.list_collections()}")
return True
except Exception as e:
print(f"Failed to connect to Milvus: {e}")
return False
Explanation:
Connects to a Milvus instance running on localhost:19530.
Prints server version and any existing collections to confirm successful connection.
3. Creates a new Milvus collection if it doesn’t exist, generates embeddings for a set of documents, and inserts them into the collection.
def create_collection():
"""Create a collection with sample data"""
# Configuration
collection_name = "document_embeddings"
dim = 384 # Dimension of SBERT embeddings
# Verify connection first
if not verify_connection():
return
# Initialize model (using GPU if available)
device = 'cuda' if torch.cuda.is_available() else 'cpu'
print(f"Using device: {device}")
model = SentenceTransformer('all-MiniLM-L6-v2', device=device)
# Create collection if it doesn't exist
if not utility.has_collection(collection_name):
print(f"Creating collection: {collection_name}")
fields = [
FieldSchema(name="id", dtype=DataType.INT64, is_primary=True, auto_id=True),
FieldSchema(name="text", dtype=DataType.VARCHAR, max_length=500),
FieldSchema(name="embedding", dtype=DataType.FLOAT_VECTOR, dim=dim)
]
schema = CollectionSchema(fields, description="Document embeddings collection")
collection = Collection(collection_name, schema)
# Create index for efficient search
index_params = {
"index_type": "IVF_PQ",
"metric_type": "L2",
"params": {"nlist": 128, "m": 16, "nbits": 8}
}
collection.create_index("embedding", index_params)
print("Collection created with IVF_PQ index")
else:
collection = Collection(collection_name)
print(f"Collection {collection_name} already exists")
# Sample data
documents = [
"Zilliz provides scalable vector search solutions",
"Ubuntu 24.04 offers improved GPU support",
"Vector databases are essential for AI applications",
"GPU acceleration significantly improves vector search performance"
]
# Generate embeddings
print("Generating embeddings...")
start_time = time.time()
embeddings = model.encode(documents)
print(f"Embeddings generated in {time.time() - start_time:.2f} seconds")
# Prepare data for insertion - CORRECTED FORMAT
entities = [
documents, # text field
embeddings.tolist() # embedding field
]
# Insert data - now properly formatted
print("Inserting data...")
mr = collection.insert(entities) # Removed extra list wrapper
# Wait for collection to load
collection.load()
print(f"Inserted {len(documents)} documents")
return collection
Explanation:
Initializes the SentenceTransformer model (GPU-accelerated if available).
Defines the collection schema with fields: auto-generated id, text, and embedding.
Creates an IVF_PQ index for efficient vector search.
Encodes 4 sample sentences into 384-dim embeddings using SBERT.
Inserts the documents and loads the collection for querying.
4. Encodes a search query into an embedding and performs an ANN (Approximate Nearest Neighbor) search in the Milvus collection.
def perform_search(collection):
"""Perform a sample vector search"""
device = 'cuda' if torch.cuda.is_available() else 'cpu'
model = SentenceTransformer('all-MiniLM-L6-v2', device=device)
search_terms = ["scalable database solutions"]
print("\nGenerating search embedding...")
search_embeddings = model.encode(search_terms)
search_params = {
"metric_type": "L2",
"params": {"nprobe": 10}
}
print("Executing search...")
results = collection.search(
data=[search_embeddings[0].tolist()],
anns_field="embedding",
param=search_params,
limit=3,
output_fields=["text"]
)
print("\nSearch results:")
for i, hits in enumerate(results):
print(f"Search term: '{search_terms[i]}'")
for hit in hits:
print(f" • Score: {hit.distance:.4f} - Text: {hit.entity.get('text')}")
Explanation:
Re-loads the same SBERT model to encode the search term.
Uses collection.search() with vector data, targeting the "embedding" field, and retrieves the top 3 matches.
Outputs a similarity score and matched text.
5. Create the script's entry point. It verifies the connection, creates the collection and data, and performs a sample vector search.
if __name__ == "__main__":
print("=== Zilliz/Milvus Vector Search Demo ===")
print(f"PyMilvus version: {pymilvus.__version__}")
# Verify connection first
if verify_connection():
collection = create_collection()
if collection:
perform_search(collection)
print("\nDemo completed")
Explanation:
First print PyMilvus version.
If the connection is successful, it proceeds to create the collection and run the search query.
Wraps the entire logic in a clean main block for clarity and modularity.
6. Run the full Python script.
python3 zilliz_demo.py
Output.
=== Zilliz/Milvus Vector Search Demo ===
PyMilvus version: 2.5.10
✓ Successfully connected to Milvus server
Server status: v2.3.3-gpu
List of collections: ['document_embeddings']
✓ Successfully connected to Milvus server
Server status: v2.3.3-gpu
List of collections: ['document_embeddings']
Using device: cuda
Collection document_embeddings already exists
Generating embeddings...
Embeddings generated in 0.30 seconds
Inserting data...
Inserted 4 documents
Generating search embedding...
Executing search...
Search results:
Search term: 'scalable database solutions'
• Score: 1.1304 - Text: Zilliz provides scalable vector search solutions
• Score: 1.1836 - Text: Vector databases are essential for AI applications
• Score: 1.6474 - Text: GPU acceleration significantly improves vector search performance
Demo completed
Conclusion
Setting up Zilliz (Milvus) on Ubuntu 24.04 GPU instances provides a powerful platform for scalable vector search applications. By leveraging GPU acceleration, you can achieve significant performance improvements for similarity search operations. This setup is particularly valuable for AI applications requiring real-time vector search capabilities with large datasets.
### How to Deploy a PyTorch Workspace on a Atlantic.Net Cloud GPU Server
PyTorch is a free, open-source tool used for deep learning tasks like natural language processing and computer vision. It's easy to use and flexible, making it simple to build and use AI models in different types of projects.
Running a PyTorch workspace on Atlantic.Net lets you take advantage of powerful Cloud GPU servers with NVIDIA A100 and A40 GPUs. This is great for heavy tasks like training models using the torch library. By combining PyTorch with JupyterLab, you get a smooth remote development setup where you can easily work with others on machine learning projects.
This article shows you how to create your own Docker image by starting with a PyTorch image and adding JupyterLab. It also guides you through setting everything up using Docker and Docker Compose on Atlantic.Net Cloud GPU servers with help from the NVIDIA Docker Toolkit.
Prerequisites
Before getting started, ensure you have:
An Ubuntu 24.04 server with NVIDIA GPU(s).
NVIDIA drivers installed.
A non-root user with sudo privileges.
Step 1: Verify GPU Availability
Before starting, make sure your GPU is detected and working.
1. Check GPU on the server.
nvidia-smi
This shows GPU details like model, driver version, and memory usage.
Sat Jun 7 07:20:18 2025
+-----------------------------------------------------------------------------------------+
| NVIDIA-SMI 550.90.07 Driver Version: 550.90.07 CUDA Version: 12.4 |
|-----------------------------------------+------------------------+----------------------+
| GPU Name Persistence-M | Bus-Id Disp.A | Volatile Uncorr. ECC |
| Fan Temp Perf Pwr:Usage/Cap | Memory-Usage | GPU-Util Compute M. |
| | | MIG M. |
|=========================================+========================+======================|
| 0 NVIDIA A40-12Q On | 00000000:06:00.0 Off | 0 |
| N/A N/A P0 N/A / N/A | 1MiB / 12288MiB | 0% Default |
| | | N/A |
+-----------------------------------------+------------------------+----------------------+
+-----------------------------------------------------------------------------------------+
| Processes: |
| GPU GI CI PID Type Process name GPU Memory |
| ID ID Usage |
|=========================================================================================|
| No running processes found |
+-----------------------------------------------------------------------------------------+
2. Install required dependencies.
apt install -y python3-pip python3-venv docker-compose docker.io
3. Run a temporary PyTorch container.
docker run --rm -it --gpus all pytorch/pytorch:latest
Explanation:
--gpus all allows Docker to use the GPU.
-it gives you an interactive terminal.
--rm deletes the container when you exit.
After running the above command, you will get into the container shell as shown below.
root@7117aa4ac0ba:/workspace#
4. Connect to the Python shell.
root@7117aa4ac0ba:/workspace# python
Output.
Python 3.10.13 (main, Sep 11 2023, 13:44:35) [GCC 11.2.0] on linux
Type "help", "copyright", "credits" or "license" for more information.
>>>
5. Check if PyTorch detects the GPU.
>>> import torch
>>> torch.cuda.is_available()
If the output says True, your GPU is working!
True
6. Use the quit() command to quit the Python console and the exit command to exit the container terminal.
Step 2: Build a Custom Docker Image with PyTorch & JupyterLab
We'll create a new Docker image that includes PyTorch + JupyterLab for easy coding.
1. Create and activate the Python virtual environment.
python3 -m venv venv
source venv/bin/activate
2. Install Jupyter notebook.
pip install jupyter
3. Create a new configuration file for Jupyter notebook.
nano config.py
Add the following content:
c.ServerApp.ip = '0.0.0.0'
c.ServerApp.allow_root = True
c.ServerApp.allow_remote_access = True
c.ServerApp.password = ''
The above setup tells the JupyterLab server to accept remote connections and listen on IP address 0.0.0.0, which allows you to access the workspace using the server's public IP. You can also add other settings to this file to customize the container before it runs.
4. Create the password hash using the passwd function.
python3 -c "from jupyter_server.auth import passwd; print(passwd('securepassword'))"
Output.
argon2:$argon2id$v=19$m=10240,t=10,p=8$+Gm411wZBogCWpF/CyvvMg$w+tQ9IctMYs4P6Zbi6rcwEGx8HVerRxHczhBtFHsSV0
5. Edit the config.py.
nano config.py
Replace the c.ServerApp.password value in the config.py file with the output.
c.ServerApp.ip = '0.0.0.0'
c.ServerApp.allow_root = True
c.ServerApp.allow_remote_access = True
c.ServerApp.password = 'argon2:$argon2id$v=19$m=10240,t=10,p=8$+Gm411wZBogCWpF/CyvvMg$w+tQ9IctMYs4P6Zbi6rcwEGx8HVerRxHczhBtFHsSV0'
6. Create a Dockerfile.
nano Dockerfile
Add the below content.
FROM pytorch/pytorch:latest
RUN pip install jupyterlab
RUN pip install -U ipywidgets ipykernel
COPY config.py /root/.jupyter/jupyter_lab_config.py
EXPOSE 8888
CMD ["bash", "-c", "jupyter lab"]
The above steps use the official PyTorch container image as a starting point. It installs JupyterLab using pip, copies the config file you created earlier, opens port 8888, and runs the JupyterLab server with the bash -c jupyter lab command.
7. Build the Docker image.
docker build -t pytorch-jupyter .
This builds a new container image called pytorch-jupyter. You can also upload this image to your private DockerHub account so it’s ready to use anytime you want to quickly launch a PyTorch workspace for heavy tasks like training models.
Step 3: Deploy the Workspace using Docker
In the last section, you created the pytorch-jupyter image by combining JupyterLab and the PyTorch container. This part now shows how to run that image using Docker to set up a temporary workspace or test your setup.
1. Run a temporary container using the pytorch-jupyter image.
docker run --rm -it --gpus all -p 8888:8888 pytorch-jupyter
This command starts a new container using the image you created. The --gpus all option gives the container access to all GPUs on the host machine. The -it option allows you to interact with the container through the terminal. The --rm option makes sure the container is automatically deleted from the system once it stops running.
2. Open your web browser and access the URL http://your-server-ip:8888. You will see the Jupyter notebook login page.
3. Log in to the JupyterLab interface using the password you used to create the password hash in the previous sections.
4. Create a new notebook.
Then add the below function in a new notebook to verify the GPU availability.
import torch
if torch.cuda.is_available():
print("✅ GPU is available!")
print(f"GPU Name: {torch.cuda.get_device_name(0)}")
else:
print("❌ GPU is NOT available.")
5. Run the Notebook. If everything is fine, you will see the message "✅ GPU is available!".
6. Go back to your terminal and exit the container using Ctrl + C.
Step 4: Deploy a Permanent Workspace (Docker Compose)
In this section, we'll deploy a persistent PyTorch workspace on an Atlantic.Net Cloud GPU server using Docker Compose.
1. Create and enter a new directory named pytorch-environment.
mkdir ~/pytorch-environment
cd ~/pytorch-environment
2. Create a new file named docker-compose.yaml.
nano docker-compose.yaml
Add the following content:
services:
jupyter:
image: pytorch-jupyter
restart: unless-stopped
volumes:
- "/root/workspace:/workspace"
deploy:
resources:
reservations:
devices:
- capabilities: [gpu]
nginx:
image: nginx
restart: unless-stopped
ports:
- 80:80
- 443:443
volumes:
- ./nginx/nginx.conf:/etc/nginx/nginx.conf
- ./certbot/conf:/etc/letsencrypt
- ./certbot/www:/var/www/certbot
certbot:
image: certbot/certbot
container_name: certbot
volumes:
- ./certbot/conf:/etc/letsencrypt
- ./certbot/www:/var/www/certbot
command: certonly --webroot -w /var/www/certbot --force-renewal --email hitjethva@gmail.com -d pytorch.example.com --agree-tos
The above setup includes three services.
The jupyter service runs a container with a GPU-powered PyTorch workspace and saves all workspace files in the /root/workspace folder using the volumes setting.
The nginx service uses the official Nginx image to act as a reverse proxy, directing traffic from users to the Jupyter service.
The certbot service uses the official Certbot image to request a free SSL certificate from Let’s Encrypt for your domain.
Important: Replace your-email@example.com and pytorch.example.com with your own email and domain name.
2. Create a new directory named nginx.
mkdir nginx
3. Create a new file named nginx/nginx.conf inside the directory.
nano nginx/nginx.conf
Add the below content.
user nginx;
worker_processes auto;
error_log /var/log/nginx/error.log warn;
pid /var/run/nginx.pid;
events {
worker_connections 1024;
}
http {
server_tokens off;
charset utf-8;
include /etc/nginx/mime.types;
default_type application/octet-stream;
sendfile on;
keepalive_timeout 65;
access_log /var/log/nginx/access.log;
server {
listen 80;
server_name pytorch.example.com;
location /.well-known/acme-challenge/ {
root /var/www/certbot;
}
location / {
return 404;
}
}
}
4. Create required directories.
mkdir -p certbot/www/.well-known/acme-challenge
5. Start the PyTorch workspace.
docker-compose up -d
The above command launches the services listed in the docker-compose.yaml file in detached mode. This means the services will run in the background, allowing you to continue using your terminal for other tasks.
6. Verify the generated SSL certificates.
ls certbot/conf/live/pytorch.example.com/
Output.
cert.pem chain.pem fullchain.pem privkey.pem README
7. Update the nginx.conf file.
nano nginx/nginx.conf
Replace existing content with the following:
user nginx;
worker_processes auto;
error_log /var/log/nginx/error.log warn;
pid /var/run/nginx.pid;
events {
worker_connections 1024;
}
http {
server_tokens off;
charset utf-8;
include /etc/nginx/mime.types;
default_type application/octet-stream;
sendfile on;
keepalive_timeout 65;
access_log /var/log/nginx/access.log;
# HTTP - for Certbot challenge and redirect to HTTPS
server {
listen 80;
server_name pytorch.example.com;
# Let’s Encrypt challenge path
location /.well-known/acme-challenge/ {
root /var/www/certbot;
}
# Redirect everything else to HTTPS
location / {
return 301 https://$host$request_uri;
}
}
# HTTPS - Secure JupyterLab
server {
listen 443 ssl;
server_name pytorch.example.com;
ssl_certificate /etc/letsencrypt/live/pytorch.example.com/fullchain.pem;
ssl_certificate_key /etc/letsencrypt/live/pytorch.example.com/privkey.pem;
ssl_protocols TLSv1.2 TLSv1.3;
ssl_ciphers HIGH:!aNULL:!MD5;
location / {
proxy_pass http://jupyter:8888;
proxy_set_header Host $host;
proxy_set_header X-Real-IP $remote_addr;
proxy_set_header X-Forwarded-For $proxy_add_x_forwarded_for;
proxy_set_header X-Forwarded-Proto $scheme;
}
}
}
The above setup uses the SSL certificate provided by Certbot. It sets up a reverse proxy server that forwards incoming traffic to the container running on port 8888. It also includes a location block to handle ACME challenge files, which are needed for automatic SSL renewal through a scheduled Cron job.
8. Restart the Nginx service.
docker-compose restart nginx
9. You can now confirm the deployment of the workspace by opening https://pytorch.example.com in your web browser.
Conclusion
This article explained how to start with the PyTorch container image and install JupyterLab to create a custom container image. It also guided you through deploying the setup using Docker and Docker Compose on Atlantic.Net Cloud GPU servers. You can also upload your custom image to your DockerHub account, making it easy to launch temporary PyTorch workspaces whenever you need them.
### How to Deploy a High-Performance Semantic Search Application Using Zilliz on Ubuntu 24.04 GPU Server
Semantic search represents the next evolution in search technology, moving beyond keyword matching to understanding the intent and contextual meaning behind queries. When combined with GPU acceleration, semantic search systems can deliver unprecedented performance and accuracy for applications like e-commerce product discovery, enterprise document retrieval, and personalized recommendation systems.
In this guide, we'll walk through deploying a high-performance semantic search application using Zilliz (an open-source vector database) on an Ubuntu 24.04 GPU server.
Prerequisites
Before beginning, ensure you have:
An Ubuntu 24.04 server with NVIDIA GPU (Tested on A100, V100, or RTX 3090/4090).
NVIDIA drivers installed.
A root user or a user with sudo privileges.
Step 1: Set Up the Python Environment
1. Update the system packages.
apt update -y
2. Install required dependencies.
apt install -y python3-pip python3-venv build-essential libssl-dev docker-compose
Step 2: Install Zilliz with GPU Support
Zilliz offers several deployment options. We'll use the open-source Milvus version with GPU acceleration:
1. Pull the GPU-enabled Milvus image
docker pull milvusdb/milvus:latest-gpu
2. Create a docker-compose.yml file.
nano docker-compose.yml
Add the following content.
version: '3.5'
services:
etcd:
container_name: milvus-etcd
image: quay.io/coreos/etcd:v3.5.5
environment:
- ETCD_AUTO_COMPACTION_MODE=revision
- ETCD_AUTO_COMPACTION_RETENTION=1000
- ETCD_QUOTA_BACKEND_BYTES=4294967296
- ETCD_SNAPSHOT_COUNT=50000
volumes:
- ./etcd_data:/etcd
command: etcd -advertise-client-urls=http://127.0.0.1:2379 -listen-client-urls http://0.0.0.0:2379 --data-dir /etcd
minio:
container_name: milvus-minio
image: minio/minio:RELEASE.2023-03-20T20-16-18Z
environment:
MINIO_ACCESS_KEY: minioadmin
MINIO_SECRET_KEY: minioadmin
volumes:
- ./minio_data:/minio_data
command: minio server /minio_data
healthcheck:
test: ["CMD", "curl", "-f", "http://localhost:9000/minio/health/live"]
interval: 30s
timeout: 20s
retries: 3
standalone:
container_name: milvus-standalone
image: milvusdb/milvus:latest-gpu
command: ["milvus", "run", "standalone"]
environment:
ETCD_ENDPOINTS: etcd:2379
MINIO_ADDRESS: minio:9000
volumes:
- ./milvus_data:/var/lib/milvus
ports:
- "19530:19530"
depends_on:
- "etcd"
- "minio"
deploy:
resources:
reservations:
devices:
- driver: nvidia
count: 1
capabilities: [gpu]
networks:
default:
name: milvus
3. Start the containers.
docker compose up -d
Step 3: Verify the Installation
1. Check that all services are running.
docker ps
Output.
CONTAINER ID IMAGE COMMAND CREATED STATUS PORTS NAMES
7546b3a7999a milvusdb/milvus:latest-gpu "/tini -- milvus run…" 16 seconds ago Up 16 seconds 0.0.0.0:19530->19530/tcp, [::]:19530->19530/tcp milvus-standalone
d700cd1e1af3 minio/minio:RELEASE.2023-03-20T20-16-18Z "/usr/bin/docker-ent…" 16 seconds ago Up 16 seconds (health: starting) 9000/tcp milvus-minio
fbe9fd450a28 quay.io/coreos/etcd:v3.5.5 "etcd -advertise-cli…" 16 seconds ago Up 16 seconds 2379-2380/tcp milvus-etcd
2. Create a Python virtual environment.
python3 -m venv semantic_env
source semantic_env/bin/activate
3. Install the Milvus client.
pip install pymilvus
4. Test the Milvus connection.
python3 -c "from pymilvus import connections, utility; connections.connect('default', host='localhost', port='19530'); print(utility.get_server_version())"
Output.
v2.4.15-gpu
Step 4: Set Up the Semantic Search Application
1. Install required packages.
pip install torch torchvision torchaudio --index-url https://download.pytorch.org/whl/cu118
pip install sentence-transformers pymilvus fastapi uvicorn python-multipart
2. Create a file named semantic_search.py.
nano semantic_search.py
Add the below code.
import torch
from sentence_transformers import SentenceTransformer
from pymilvus import (
connections,
Collection,
utility,
FieldSchema,
CollectionSchema,
DataType
)
import numpy as np
from fastapi import FastAPI, Query, HTTPException
from fastapi.responses import JSONResponse
from typing import Optional
import uuid
import logging
from pydantic import BaseModel
# Configure logging
logging.basicConfig(level=logging.INFO)
logger = logging.getLogger(__name__)
# Initialize FastAPI
app = FastAPI(
title="Semantic Search API",
description="GPU-accelerated semantic search using Zilliz/Milvus",
version="1.0"
)
# Configuration
COLLECTION_NAME = "semantic_search"
EMBEDDING_DIM = 384 # Dimension for 'all-MiniLM-L6-v2' model
MODEL_NAME = "all-MiniLM-L6-v2"
MILVUS_HOST = "localhost"
MILVUS_PORT = 19530
# Initialize the model (GPU if available)
device = "cuda" if torch.cuda.is_available() else "cpu"
logger.info(f"Using device: {device}")
model = SentenceTransformer(MODEL_NAME, device=device)
logger.info(f"Initialized model on device: {device}")
# Pydantic models for API documentation
class Document(BaseModel):
text: str
doc_id: Optional[str] = None
class SearchResult(BaseModel):
id: str
text: str
score: float
class SearchResponse(BaseModel):
results: list[SearchResult]
class ErrorResponse(BaseModel):
error: str
detail: Optional[str] = None
def initialize_milvus():
"""Initialize connection and create collection if needed"""
try:
# Connect to Milvus
connections.connect("default", host=MILVUS_HOST, port=MILVUS_PORT)
# Create collection if it doesn't exist
if not utility.has_collection(COLLECTION_NAME):
fields = [
FieldSchema(name="id", dtype=DataType.VARCHAR,
is_primary=True, auto_id=False, max_length=100),
FieldSchema(name="text", dtype=DataType.VARCHAR, max_length=5000),
FieldSchema(name="embedding", dtype=DataType.FLOAT_VECTOR, dim=EMBEDDING_DIM)
]
schema = CollectionSchema(fields, "Semantic search collection")
collection = Collection(COLLECTION_NAME, schema, consistency_level="Strong")
# Create index
index_params = {
"index_type": "IVF_FLAT",
"metric_type": "L2",
"params": {"nlist": 128}
}
collection.create_index("embedding", index_params)
logger.info("Created new collection with index")
else:
collection = Collection(COLLECTION_NAME)
logger.info("Connected to existing collection")
# Explicit load for version compatibility
try:
collection.load()
except Exception as e:
logger.warning(f"Load warning (may be normal in some versions): {str(e)}")
return collection
except Exception as e:
logger.error(f"Milvus initialization failed: {str(e)}")
raise HTTPException(
status_code=500,
detail=f"Database connection failed: {str(e)}"
)
# Initialize Milvus connection on startup
try:
collection = initialize_milvus()
except Exception as e:
logger.error(f"Failed to initialize Milvus: {str(e)}")
collection = None
@app.on_event("shutdown")
def shutdown_event():
"""Clean up on shutdown"""
if connections.has_connection("default"):
connections.disconnect("default")
logger.info("Disconnected from Milvus")
@app.post("/documents/",
response_model=dict,
responses={500: {"model": ErrorResponse}})
async def add_document(document: Document):
"""Add a document to the search index"""
try:
if not collection:
raise HTTPException(status_code=503, detail="Service unavailable")
# Generate embedding
embedding = model.encode(document.text)
# Prepare data
doc_id = document.doc_id if document.doc_id else str(uuid.uuid4())
data = [
[doc_id],
[document.text],
[embedding.tolist()]
]
# Insert into Milvus
collection.insert(data)
collection.flush()
return {"status": "success", "id": doc_id}
except Exception as e:
logger.error(f"Document insertion failed: {str(e)}")
raise HTTPException(
status_code=500,
detail=f"Document processing failed: {str(e)}"
)
@app.get("/search/",
response_model=SearchResponse,
responses={
400: {"model": ErrorResponse},
500: {"model": ErrorResponse},
503: {"model": ErrorResponse}
})
async def search(
query: str = Query(..., min_length=1, max_length=1000),
top_k: int = Query(5, ge=1, le=100)
):
"""Search for similar documents"""
try:
if not collection:
raise HTTPException(status_code=503, detail="Service unavailable")
# Version-compatible load check
try:
if hasattr(collection, 'is_loaded') and not collection.is_loaded:
collection.load()
elif not hasattr(collection, 'is_loaded'):
collection.load() # Force load for older versions
except Exception as e:
logger.warning(f"Load warning: {str(e)}")
# Generate embedding
query_embedding = model.encode(query)
# Search parameters
search_params = {
"metric_type": "L2",
"params": {"nprobe": 10}
}
# Execute search
results = collection.search(
data=[query_embedding.tolist()],
anns_field="embedding",
param=search_params,
limit=top_k,
output_fields=["text"]
)
# Format results
ret = []
for hits in results:
for hit in hits:
ret.append({
"id": hit.id,
"text": hit.entity.get("text"),
"score": 1 - hit.distance # Convert to similarity score
})
return {"results": ret}
except ValueError as e:
raise HTTPException(status_code=400, detail=str(e))
except Exception as e:
logger.error(f"Search failed: {str(e)}")
raise HTTPException(
status_code=500,
detail=f"Search processing failed: {str(e)}"
)
@app.get("/status")
async def service_status():
"""Check service health"""
try:
milvus_ok = connections.has_connection("default")
gpu_available = torch.cuda.is_available()
# Version-compatible collection check
collection_status = False
if collection:
try:
if hasattr(collection, 'is_loaded'):
collection_status = collection.is_loaded
else:
# For older versions, assume loaded if we have a collection object
collection_status = True
except:
collection_status = False
return {
"milvus_connected": milvus_ok,
"gpu_available": gpu_available,
"collection_loaded": collection_status,
"model": MODEL_NAME,
"status": "healthy" if all([milvus_ok, collection_status]) else "degraded"
}
except Exception as e:
return {
"status": "unhealthy",
"error": str(e)
}
if __name__ == "__main__":
import uvicorn
uvicorn.run(app, host="0.0.0.0", port=8000)
Step 5: Launch the Application
1. Start the FastAPI service.
python3 semantic_search.py
Output.
INFO: Started server process [59814]
INFO: Waiting for application startup.
INFO: Application startup complete.
INFO: Uvicorn running on http://0.0.0.0:8000 (Press CTRL+C to quit)
2. Your semantic search service is now running on port 8000.
Step 6: Test the Application
1. Add the text "The quick brown fox jumps over the lazy dog" to documents.
curl -X POST "http://localhost:8000/documents/" -H "Content-Type: application/json" -d '{"text": "The quick brown fox jumps over the lazy dog"}'
Output.
{"status":"success","id":"c9dbb77f-a41f-4056-bd4b-69eab9334ae3"}
2. Search for "brown fox" from the added documents using curl.
curl -G "http://localhost:8000/search/" --data-urlencode "query=brown fox" --data "top_k=2"
Output.
{"results":[{"id":"c9dbb77f-a41f-4056-bd4b-69eab9334ae3","text":"The quick brown fox jumps over the lazy dog","score":0.24801254272460938},{"id":"f27c880e-9b18-4a6f-b625-dc57e393117d","text":"The quick brown fox jumps over the lazy dog","score":0.24801254272460938}]}
3. Check the health status of your application.
curl "http://localhost:8000/status"
Output.
{"milvus_connected":true,"gpu_available":true,"collection_loaded":true,"model":"all-MiniLM-L6-v2","status":"healthy"}
Conclusion
You've now deployed a high-performance semantic search application leveraging Zilliz (Milvus) on an Ubuntu 24.04 GPU server. The architecture can be extended with custom embedding models, hybrid search (combining vectors and keywords), and real-time indexing for dynamic content.
### How to Set up a TensorFlow Workspace on a Atlantic.Net Cloud GPU Instance
TensorFlow is a popular open-source tool that makes it easier to build and train machine learning and deep learning models. It’s widely used by developers and companies to solve real-world problems using AI. TensorFlow provides everything needed to create powerful and scalable machine learning applications.
This guide shows you how to set up a temporary or permanent TensorFlow workspace using Docker and NVIDIA’s GPU tools.
Prerequisites
Before getting started, ensure you have:
An Ubuntu 24.04 server with NVIDIA GPU(s).
NVIDIA drivers installed.
A non-root user with sudo privileges.
Step 1: Check if Your GPU is Working
Before starting, make sure your GPU is available.
1. Run this command on your server:
nvidia-smi
This will show GPU details like model, memory, and usage.
Sat Jun 7 07:20:18 2025
+-----------------------------------------------------------------------------------------+
| NVIDIA-SMI 550.90.07 Driver Version: 550.90.07 CUDA Version: 12.9 |
|-----------------------------------------+------------------------+----------------------+
| GPU Name Persistence-M | Bus-Id Disp.A | Volatile Uncorr. ECC |
| Fan Temp Perf Pwr:Usage/Cap | Memory-Usage | GPU-Util Compute M. |
| | | MIG M. |
|=========================================+========================+======================|
| 0 NVIDIA A40-12Q On | 00000000:06:00.0 Off | 0 |
| N/A N/A P0 N/A / N/A | 1MiB / 12288MiB | 0% Default |
| | | N/A |
+-----------------------------------------+------------------------+----------------------+
+-----------------------------------------------------------------------------------------+
| Processes: |
| GPU GI CI PID Type Process name GPU Memory |
| ID ID Usage |
|=========================================================================================|
| No running processes found |
+-----------------------------------------------------------------------------------------+
2. Run the nvidia-smi command inside a container to check if Docker can access the GPU.
docker run --rm --gpus all nvidia/cuda:12.9.0-base-ubuntu24.04 nvidia-smi
Explanation:
--rm deletes the container after use.
--gpus all lets Docker use the GPU.
If you see GPU info, everything is working!
Sat Jun 7 08:05:20 2025
+-----------------------------------------------------------------------------------------+
| NVIDIA-SMI 550.90.07 Driver Version: 550.90.07 CUDA Version: 12.9 |
|-----------------------------------------+------------------------+----------------------+
| GPU Name Persistence-M | Bus-Id Disp.A | Volatile Uncorr. ECC |
| Fan Temp Perf Pwr:Usage/Cap | Memory-Usage | GPU-Util Compute M. |
| | | MIG M. |
|=========================================+========================+======================|
| 0 NVIDIA A40-12Q On | 00000000:06:00.0 Off | 0 |
| N/A N/A P0 N/A / N/A | 1MiB / 12288MiB | 0% Default |
| | | N/A |
+-----------------------------------------+------------------------+----------------------+
+-----------------------------------------------------------------------------------------+
| Processes: |
| GPU GI CI PID Type Process name GPU Memory |
| ID ID Usage |
|=========================================================================================|
| No running processes found |
+-----------------------------------------------------------------------------------------+
3. Install required dependencies.
apt install -y python3-pip python3-venv
4. Create and activate the Python virtual environment.
python3 -m venv venv
source venv/bin/activate
5. Install Jupyter notebook.
pip install jupyter
Step 2: Set Up a Temporary TensorFlow Workspace
Atlantic.Net Cloud GPU servers let you use powerful GPUs without buying expensive hardware. These servers are great for training machine learning models faster. In this section, we’ll show you how to quickly set up a temporary TensorFlow workspace on an Atlantic.Net Cloud GPU server.
1. Run TensorFlow in a Docker container.
docker run --rm --gpus all -p 8888:8888 -v /root/notebooks:/tf/notebooks tensorflow/tensorflow:2.15.0-gpu-jupyter
Explanation:
-p 8888:8888 makes Jupyter Notebook accessible on port 8888.
-v /root/notebooks:/tf/notebooks saves notebooks to your server.
You will see the following output containing Jupyter URL.
To access the server, open this file in a browser:
file:///root/.local/share/jupyter/runtime/jpserver-1-open.html
Or copy and paste one of these URLs:
http://c9af04990219:8888/tree?token=73873d6313d74f4477d83e15ffc4d95983ab8fd8e9f24be2
http://127.0.0.1:8888/tree?token=73873d6313d74f4477d83e15ffc4d95983ab8fd8e9f24be2
2. Open a web browser and access the Jupyter notebook using the URL http://your-server-ip:8888/tree?token=73873d6313d74f4477d83e15ffc4d95983ab8fd8e9f24be2
3. Create a new notebook from the top left menu (file > new) .
4. Run the following code in the Notebook cell.
import tensorflow as tf
tf.config.list_physical_devices()
If you see CPU and GPU listed, TensorFlow is using the GPU!
[PhysicalDevice(name='/physical_device:CPU:0', device_type='CPU'),
PhysicalDevice(name='/physical_device:GPU:0', device_type='GPU')]
Step 3: Set Up a Permanent TensorFlow Workspace
For long-term use, we’ll use Docker Compose with Nginx (for secure access) and HTTPS.
1. Install Docker Compose.
apt install docker-compose -y
2. Create and navigate to the new directory named tensorflow-workspace.
mkdir ~/tensorflow-workspace
cd ~/tensorflow-workspace
3. Create a docker-compose.yaml file.
nano docker-compose.yaml
Add the following content.
services:
jupyter:
image: tensorflow/tensorflow:2.15.0-gpu-jupyter
restart: unless-stopped
volumes:
- "/root/notebooks:/tf/notebooks"
deploy:
resources:
reservations:
devices:
- capabilities: [gpu]
nginx:
image: nginx
restart: unless-stopped
ports:
- 80:80
- 443:443
volumes:
- ./nginx/nginx.conf:/etc/nginx/nginx.conf
- ./nginx/dhparam.pem:/etc/ssl/certs/dhparam.pem
- ./certbot/conf:/etc/letsencrypt
- ./certbot/www:/var/www/certbot
certbot:
image: certbot/certbot
container_name: certbot
volumes:
- ./certbot/conf:/etc/letsencrypt
- ./certbot/www:/var/www/certbot
command: certonly --webroot -w /var/www/certbot --email YOUR_EMAIL@example.com -d your_domain.com --agree-tos --no-eff-email
The above setup includes three services.
The jupyter service runs a container with TensorFlow and GPU support, and it saves all your notebooks in the /root/notebooks folder.
The nginx service uses the official Nginx container to work as a reverse proxy, passing traffic between users and the jupyter server.
The certbot service uses the official Certbot container to get a free SSL certificate from Let’s Encrypt for your domain name.
4. Create a new directory for Nginx.
mkdir nginx
5. Create an Nginx configuration file.
nano nginx/nginx.conf
Add the following configuration.
events {}
http {
server_tokens off;
charset utf-8;
server {
listen 80;
server_name tensorflow.example.com;
location ~ /.well-known/acme-challenge/ {
root /var/www/certbot;
}
}
}
The above setup tells the Nginx server to handle the special verification files created by Certbot. This step is needed so Certbot can prove that you own the domain name and then issue a free SSL certificate for it.
6. Create a directory structure for Let's Encrypt challenge.
mkdir -p certbot/www/.well-known/acme-challenge
7. Deploy the Docker Compose services.
docker-compose up -d
The above command starts the services defined in the docker-compose.yaml file in detached mode.
8. Verify the SSL issuance.
ls certbot/conf/live/tensorflow.example.com/
Output.
cert.pem chain.pem fullchain.pem privkey.pem README
9. Edit the Nginx configuration file.
nano nginx/nginx.conf
Remove all existing content and add the below configuration.
events {}
http {
server_tokens off;
charset utf-8;
map $http_upgrade $connection_upgrade {
default upgrade;
'' close;
}
server {
listen 80;
server_name tensorflow.example.com;
return 301 https://$host$request_uri;
}
server {
listen 443 ssl http2;
server_name tensorflow.example.com;
ssl_certificate /etc/letsencrypt/live/tensorflow.example.com/fullchain.pem;
ssl_certificate_key /etc/letsencrypt/live/tensorflow.example.com/privkey.pem;
ssl_protocols TLSv1.2 TLSv1.3;
ssl_prefer_server_ciphers on;
ssl_ciphers 'ECDHE-ECDSA-AES128-GCM-SHA256:ECDHE-RSA-AES128-GCM-SHA256:ECDHE-ECDSA-AES256-GCM-SHA384:ECDHE-RSA-AES256-GCM-SHA384:ECDHE-ECDSA-CHACHA20-POLY1305:ECDHE-RSA-CHACHA20-POLY1305:DHE-RSA-AES128-GCM-SHA256:DHE-RSA-AES256-GCM-SHA384';
ssl_session_timeout 1d;
ssl_session_cache shared:SSL:50m;
ssl_stapling on;
ssl_stapling_verify on;
add_header Strict-Transport-Security max-age=15768000;
location / {
proxy_pass http://jupyter:8888;
proxy_set_header X-Real-IP $remote_addr;
proxy_set_header Host $host;
proxy_set_header X-Forwarded-For $proxy_add_x_forwarded_for;
proxy_http_version 1.1;
proxy_set_header Upgrade $http_upgrade;
proxy_set_header Connection $connection_upgrade;
proxy_set_header X-Scheme $scheme;
proxy_buffering off;
}
location ~ /.well-known/acme-challenge/ {
root /var/www/certbot;
}
}
}
The above setup uses the SSL certificate from Certbot along with extra security settings to protect your workspace. It also sets up a reverse proxy server that sends incoming traffic to the Jupyter container running on port 8888.
10. Restart the Nginx container to apply the changes.
docker-compose restart nginx
11. Retrieve the token from the Docker logs.
docker-compose logs jupyter
This command outputs the logs generated by the jupyter container. It contains the token to access the Jupyter notebook interface.
jupyter_1 | To access the server, open this file in a browser:
jupyter_1 | file:///root/.local/share/jupyter/runtime/jpserver-1-open.html
jupyter_1 | Or copy and paste one of these URLs:
jupyter_1 | http://19880e871edf:8888/tree?token=cfecf37285dccaf783a751bda24b4497a1279487ebd70c03
jupyter_1 | http://127.0.0.1:8888/tree?token=cfecf37285dccaf783a751bda24b4497a1279487ebd70c03
12. Open your web browser and access the Jupyter notebook using https://tensorflow.example.com.
13. Scroll down to the "Setup a Password" section. Enter the token fetched from the Docker Compose logs. Enter the password you want to use to protect the interface. Click the "Log in and set new password" button. You will see the Jupyter notebook dashboard.
Conclusion
This article showed how to set up a temporary or long-term TensorFlow workspace using the official Docker image and NVIDIA Docker Toolkit. You can create a temporary setup to use the powerful hardware from Atlantic.Net for tasks like training models or creating visualizations. You can also set up a permanent workspace, which gives you a stable environment for remote development. With the Jupyter notebook interface, it’s easy to collaborate with others on your machine learning projects - try it on GPU Hosting from Atlantic.Net.
### Future-Proofing Digital Security: The Role of AI and Quantum-Safe Algorithms in Trust Convergence
Due to the increased reliance on digital systems, businesses face increasing cyber threats today. Artificial intelligence (AI) and quantum computing are emerging as influential technologies having both risks and prospects for companies. While AI provides advanced tools for identifying and preventing cyberattacks, it also introduces new vulnerabilities, as cybercriminals employ similar technologies to execute more complex and difficult-to-detect cyberattacks.
Likewise, quantum computing poses a distinct challenge to existing encryption techniques and thus makes the conventional security measures less effective. Cyberattacks are becoming more advanced, and traditional security methods no longer offer the same level of protection. Therefore, businesses need to rethink their approach to digital security. This requires adopting new strategies that rely on advanced technologies and preparing for future challenges.
The concept of trust convergence, which integrates AI, quantum-safe algorithms, and conventional security techniques, has become an essential component of modern security strategies. Organizations should adopt technologies like AI-enhanced threat detection and quantum-safe algorithms to establish a robust and dependable framework for digital trust. This strategy will help businesses protect their data, proactively address emerging threats, and maintain the long-term security of their digital environments.
The Evolving Digital Security Environment
Traditional security methods, such as encryption, Domain Name System (DNS), and Public Key Infrastructure (PKI), have been widely used to secure sensitive data. However, as cyber threats become more advanced and quantum computing develops quickly, these methods alone are no longer enough to keep systems secure.
Recent findings from Gartner’s November 2024 survey show that AI-driven attacks are still the top emerging risk for businesses. This trend continued for the third quarter in a row. According to the survey of 286 senior risk executives, the rapid rise of AI-powered cyber threats has significantly impacted enterprise security, making it a leading concern.
The costs are even higher in the financial sector, with breaches averaging $7.3 million. Likewise, ransomware attacks, driven by AI tools, rose by 149% in early 2025. Supply chain attacks are also expected to grow as cybercriminals target complex vendor networks. These trends show that AI's ability to adapt quickly surpasses traditional security measures.
While methods like DNS and PKI are still important, they have limitations. DNS is often the first defence against threats like phishing and malware. However, attackers can bypass it by exploiting weaknesses in DNS servers. Similarly, PKI uses certificates to verify and encrypt communications, but it faces risks from the growing power of quantum computing.
Surprisingly, quantum computing seriously threatens encryption, which is an integral part of traditional security. Algorithms like RSA and Elliptic Curve Cryptography (ECC) are often used to protect data. However, they can be easily broken by a powerful quantum computer, making the current encryption methods outdated. This shows the urgent need to move to quantum-safe encryption techniques.
How AI Strengthens Digital Trust
Digital trust is essential for businesses today and AI plays a significant role in enforcing and maintaining it. AI helps enhance security by automating threat detection, improving response times, and providing predictive insights to prevent cyberattacks before they happen. AI can quickly identify threats by processing large volumes of data in real-time. It can also adapt to new attack patterns more effectively than human analysts.
AI-based threat detection is a key component of digital trust. Real-time machine learning-based anomaly detection systems can identify unusual behaviors. These behaviors may indicate an impending attack. For example, AI can analyze network traffic for abnormal patterns. This may include attempts to steal data or unauthorized login activity. When these threats are recognized, AI can immediately stop breaches before they cause significant damage.
In addition, AI plays a vital role in fraud detection and identity verification, which are essential to maintaining trust. In sectors like finance, machine learning algorithms can analyze transaction patterns. These patterns help detect fraudulent activities. These systems are meant to spot even minor irregularities. By ensuring that identities are accurately verified, AI strengthens the security of online transactions.
Despite several benefits, AI brings new challenges. Cybercriminals are increasingly using AI to create more sophisticated attacks. For example, AI-based phishing attacks can be tailored to target specific individuals based on their online behavior. To overcome these challenges, businesses must adopt strong AI-based security measures capable of reacting quickly to new threats and protecting digital trust. This will help companies to avoid being outpaced by cybercriminals who use AI to exploit weaknesses.
The Quantum Threat: Why Quantum-Safe Algorithms Matter
Quantum computing appears to threaten current encryption systems due to its ability to solve complex problems much faster than classical computers. These computers use qubits, which enable them to perform calculations in parallel. This makes them capable of breaking widely used encryption methods like RSA and ECC through algorithms like Shor’s algorithm, which can efficiently factor large numbers.
One of the main risks of quantum computing is the harvest now, decrypt later threat. In this practice, cybercriminals intercept or steal encrypted data today with the expectation that quantum computers will be able to decrypt it in the future. This is a particular concern for industries like government, finance, and healthcare, where data security is critical. With quantum decryption becoming a reality soon, businesses should transition to quantum-safe algorithms to protect their sensitive data.
Quantum-safe cryptography, also known as Post-Quantum Cryptography (PQC), is based on mathematical problems that are hard for quantum computers to solve. The National Institute of Standards and Technology (NIST) is working on standardizing these quantum-resistant algorithms, which are being developed to resist quantum attacks and tested for security and efficiency.
Organizations must assess their current cryptographic systems to prepare for the quantum era. They should transition to quantum-safe methods by replacing outdated algorithms like RSA-2048 and ECC-256 with quantum-resistant alternatives. During the transition, hybrid systems that combine classical and quantum-safe algorithms can be used to maintain compatibility. Moreover, organizations should actively participate in testing and PQC migration initiatives to ensure smooth implementation.
Trust Convergence: Integrating AI, DNS, PKI, and Quantum-Safe Security
Trust convergence is a new way to improve digital security. It combines AI, DNS, PKI, and quantum-safe algorithms into a unified framework. This method increases digital trust by creating a multi-layered defense system. Each technology supports the others to provide better protection against evolving cyber threats.
AI and DNS collaborate to identify and stop threats before they reach users. AI-based DNS filtering can find harmful domains in real-time, helping prevent phishing, malware, and other attacks. By acting early, AI and DNS minimize risk and enhance overall network security.
Likewise, PKI is the foundation for secure communications. It provides authentication, encryption, and digital signatures. However, with the rise of quantum computing, traditional cryptographic methods face new challenges. Therefore, to be secure, PKI must adapt by adding quantum-safe cryptography. This ensures PKI can protect trusted identities and secure communications against quantum threats.
By incorporating quantum-resistant algorithms into PKI, organizations can protect their security for the future. Combining AI for intelligent threat detection, DNS for network protection, PKI for identity assurance, and quantum-safe encryption can help build a strong and flexible security system. This system can respond to new threats while keeping users and data secure. As a result, the idea of trust convergence can help move cybersecurity from separate tools to a single, intelligent, and coordinated approach.
Five-Step Trust Convergence Strategy for Cybersecurity Preparation
Businesses should prioritize integrating AI, DNS, PKI, and quantum-safe encryption into their cybersecurity strategies to be secure against emerging threats. Below, a five-step trust convergence strategy for businesses to prepare for cybersecurity is presented:
Integrate AI-based threat detection tools to identify and stop threats in real time. This will help businesses respond quickly to potential security issues.
Implement DNS filtering to block harmful Websites and prevent phishing attacks. This will add an extra layer of protection and stop threats before they reach users.
Conduct a thorough review of cryptographic assets. Check current encryption methods and identify any weaknesses, especially those that could be affected by quantum threats.
Develop a plan to switch to quantum-safe encryption. As part of a long-term strategy, adopt quantum-resistant algorithms to ensure cryptographic systems are ready for the future.
Provide training for the project teams on AI-based security solutions and quantum-safe cryptography. Moreover, stay updated on NIST’s PQC standardization process and adopt quantum-safe algorithms as they become available.
The Bottom Line
With the rise of more advanced cyber threats, adopting new technologies like AI and quantum-safe encryption has become essential for businesses. Trust convergence, which combines AI, DNS, PKI, and quantum-safe systems, is the future of digital security. This approach strengthens protection by integrating these technologies into one cohesive framework. By implementing this strategy, organizations can address current vulnerabilities and prepare for future risks posed by quantum computing.
While moving to these advanced technologies could be challenging, the long-term benefits far outweigh the difficulties. By investing in improved security measures now, organizations can build greater trust with users and ensure stronger resilience against future threats. Taking early action can help protect sensitive data and support uninterrupted business operations and ensure long-term security.
### How to Predict Stock Prices Using LSTM Neural Network on Ubuntu 24.04 GPU Server
Predicting stock prices has long been a challenge for investors and analysts alike. With the advent of deep learning, particularly Long Short-Term Memory (LSTM) neural networks, we now have powerful tools to analyze time-series data like stock prices.
In this tutorial, we will walk through setting up an LSTM model on an Ubuntu 24.04 GPU server to predict stock prices, using Apple Inc. (AAPL) as an example.
Prerequisites
Before we begin, ensure you have:
Ubuntu 24.04 server with GPU capabilities.
Python 3 and NVIDIA drivers installed.
Basic familiarity with terminal commands.
Step 1: Setting Up the Environment
First, let's create a clean Python environment and install the necessary packages:
1. Install Python's virtual environment and pip packages.
apt install python3-venv python3-pip
2. Create a new virtual environment.
python3 -m venv stock_env
3. Activate the environment.
source stock_env/bin/activate
4. Install essential packages, including TensorFlow, for our LSTM model.
pip install tensorflow numpy pandas matplotlib scikit-learn yfinance
Step 2: Writing the LSTM Stock Prediction Script
Now, we will write the full Python script to download stock data, preprocess it, build and train the LSTM model, and visualize the predictions. This script handles everything: data download, training, evaluation, and next-day prediction.
Create the script file.
nano stock_prediction_lstm.py
Add the following code.
import numpy as np
import pandas as pd
import yfinance as yf
import matplotlib.pyplot as plt
from sklearn.preprocessing import MinMaxScaler
from tensorflow.keras.models import Sequential
from tensorflow.keras.layers import LSTM, Dense, Dropout
# Download stock data directly
ticker = 'AAPL'
data = yf.download(ticker, start='2010-01-01', end='2025-04-20')
# Preprocess data
data_close = data[['Close']]
dataset = data_close.values
# Scale data between 0 and 1
scaler = MinMaxScaler(feature_range=(0, 1))
scaled_data = scaler.fit_transform(dataset)
# Split into training (80%) and testing (20%)
train_len = int(len(scaled_data) * 0.8)
train_data = scaled_data[:train_len]
# Function to create dataset for LSTM
def create_dataset(data, time_step=60):
X, y = [], []
for i in range(time_step, len(data)):
X.append(data[i-time_step:i, 0])
y.append(data[i, 0])
return np.array(X), np.array(y)
# Prepare training data
X_train, y_train = create_dataset(train_data)
X_train = X_train.reshape(X_train.shape[0], X_train.shape[1], 1)
# Build the LSTM model
model = Sequential([
LSTM(50, return_sequences=True, input_shape=(X_train.shape[1], 1)),
Dropout(0.2),
LSTM(50, return_sequences=False),
Dropout(0.2),
Dense(25),
Dense(1)
])
model.compile(optimizer='adam', loss='mean_squared_error')
# Train the model
model.fit(X_train, y_train, batch_size=32, epochs=50)
model.save('lstm_stock_model.h5')
# Prepare test data
test_data = scaled_data[train_len - 60:]
X_test, y_test = create_dataset(test_data)
X_test = X_test.reshape(X_test.shape[0], X_test.shape[1], 1)
# Predict and inverse transform
predictions = model.predict(X_test)
predictions = scaler.inverse_transform(predictions)
y_test_actual = scaler.inverse_transform(y_test.reshape(-1, 1))
# Calculate RMSE
rmse = np.sqrt(np.mean((predictions - y_test_actual)**2))
print(f"Root Mean Squared Error (RMSE): {rmse}")
# Visualization
train = data_close[:train_len]
valid = data_close[train_len:].copy()
valid['Predictions'] = predictions
plt.figure(figsize=(16, 8))
plt.title('Stock Price Prediction with LSTM')
plt.xlabel('Date')
plt.ylabel('Close Price (USD)')
plt.plot(train['Close'], label='Train')
plt.plot(valid['Close'], label='Actual')
plt.plot(valid['Predictions'], label='Predicted')
plt.legend()
plt.savefig('stock_prediction_plot.png')
plt.show()
# Predict the next day's closing price
def predict_next_day(model, data, scaler, time_step=60):
last_60_days = data[-time_step:].values
last_60_scaled = scaler.transform(last_60_days)
X_pred = np.array([last_60_scaled])
X_pred = X_pred.reshape(X_pred.shape[0], X_pred.shape[1], 1)
pred_price = model.predict(X_pred)
return scaler.inverse_transform(pred_price)[0][0]
next_day_price = predict_next_day(model, data_close, scaler)
print(f"Predicted next day price for {ticker}: ${next_day_price:.2f}")
The above code:
Downloads historical stock data for AAPL from Yahoo Finance.
Trains an LSTM neural network to predict the future closing price based on past data.
Visualizes the model's predicted vs. actual closing prices.
Predicts and displays the next day's closing price for Apple's stock.
Step 3: Run the Model
Now let’s run the script to train the model and see the results.
python3 stock_prediction_lstm.py
This step executes the prediction workflow and shows model accuracy and forecast.
Root Mean Squared Error (RMSE): 7.07722469189058
1/1 ━━━━━━━━━━━━━━━━━━━━ 0s 25ms/step
Predicted next day price for AAPL: $182.96
Step 4: Download the Prediction Chart
To visualize the chart on your local system, use scp to download it.
scp root@YOUR_SERVER_IP:/root/stock_prediction_plot.png Downloads/
Conclusion
In this guide, you learned how to predict stock prices using an LSTM neural network on an Ubuntu 24.04 GPU server. We used Python and deep learning tools to download historical stock data, train a model, and predict the next day's closing price for Apple’s stock. We also visualized the model’s performance and saved the results for easy access.
### Top Online Courses for AI in 2025
At times, it can certainly feel that AI is taking over, from finding your social media news feed bombarded to discovering that your workplace is integrating new productivity AI tools into workflows. AI has quickly gone from a futuristic idea to a daily reality that's integrated into our lives and society. As someone who works in the IT industry, this rapid change has left me asking the question: "How do I keep up?"
One of the best ways to keep up with new trends is to embrace learning a self-paced course; there is so much choice available online or in the classroom. Generative AI is a popular subject, but there are countless courses available (paid and free online courses) that introduce you to this fast-changing new technology.
This article will save you plenty of online searching and point you directly to what we think are the top online courses for AI. We will review free examples and paid content, from courses that will teach you the basics to classes that go beyond just the introduction, can transform your knowledge, and maybe even help you become a top talent in a new business or organization.
Leading Platforms for AI Education
Now let's take a look at the leading online courses for AI. With so many courses out there, it can be tough to know where to start. From huge, multi-course programs to quick lessons on a single tool, there's something for everyone.
To help you choose, we have broken down the best and most respected platforms for learning AI.
#1: Coursera
Coursera has established itself as a top resource for online learning, collaborating with over 200 leading universities and companies to offer a vast catalog of courses, specializations, and degrees.
Think of it as a one-stop shop for learning and business training.
Its offerings in artificial intelligence are particularly good, featuring content from all the major players in the industry.
Advantages:
Extensive selection of AI courses, from beginner to advanced levels.
Specializations and Professional Certificates offer a structured learning path.
Courses are often developed and taught by renowned university professors and industry experts from companies like Google and IBM.
The platform's user-friendly interface and mobile app make learning accessible.
Many courses include hands-on projects, allowing students to apply their knowledge to real-world applications.
Disadvantages:
While many courses can be viewed for free, earning a certificate and accessing graded assignments requires payment.
The sheer volume of courses can be overwhelming for beginners to navigate.
The quality of peer-graded assignments can sometimes be inconsistent.
Ideal for:
Learners seeking a structured education in machine learning, deep learning, or broader data science.
Individuals who value credentials from top universities and tech companies.
Professionals looking to earn a recognized certificate to enhance career prospects.
Recommended Courses:
Machine Learning: Supervised Machine Learning: Regression and Classification
AI For Everyone
Generative AI for Everyone
#2: DeepLearning.AI
If you click any of the links above, you will notice that most of the content was provided by our next entry at number two - DeepLearning.AI. Founded by Andrew Ng, they have become well-known for high-quality, accessible education in deep learning and machine learning.
Their courses are often delivered through Coursera, but they also host their own content. All courses are celebrated for their clarity and practical focus.
Advantages:
Curriculum designed and taught by one of the most respected figures in AI.
Focus on building a deeper understanding of the core concepts of deep learning.
Emphasis on real-world applications and practical skills.
The self-paced nature of the courses provides flexibility for learners.
Strong community forums for students to collaborate and seek help.
Disadvantages:
The course content is highly specialized in deep learning, so it may not be suitable for those seeking a broader overview of artificial intelligence.
A foundational understanding of programming, particularly Python, is a prerequisite for most courses.
Ideal for:
Aspiring machine learning engineers and data science professionals wanting to specialize in deep learning.
Individuals who prefer a clear, concise, and intuitive teaching style.
Learners who want to gain the essential skills to build and deploy neural networks.
Recommended Courses:
Deep Learning Specialization (Multiple Courses)
Generative AI with Large Language Models
TensorFlow Developer Professional Certificate
#3: Stanford University
As a world-renowned institution at the forefront of AI research and innovation, Stanford University offers a selection of its rigorous AI courses to a global audience online. These courses provide a taste of world-class education from the comfort of your home.
Most courses are paid for, some are based in virtual classrooms, but one thing to mention is that the quality of teaching and instructors is superb.
Advantages:
Access to the same high-quality curriculum and lectures offered to on-campus students.
Courses are taught by leading academics and researchers in the field of artificial intelligence.
In-depth and theoretically grounded content that fosters a deeper understanding of the subject matter.
Some courses are available for free, providing incredible value.
Disadvantages:
The courses can be highly demanding and time-intensive, often requiring a significant commitment each week.
The prerequisites in mathematics and computer science are often more stringent than on other platforms.
While some courses are free to audit, obtaining a formal certificate or university credit can be expensive.
Ideal for:
Highly motivated learners with a strong academic background in computer science or a related field.
Individuals who are passionate about the theoretical underpinnings of artificial intelligence and want to learn from top professors.
Those considering pursuing a graduate degree in AI who want to experience a university-level curriculum.
Recommended Courses:
CS229: Machine Learning
CS231n: Convolutional Neural Networks for Visual Recognition
AI in Healthcare Specialization
#4: IBM
IBM has a long history of innovation in artificial intelligence. The company uses this expertise to offer a range of professional certificates and courses designed to equip learners, including engineers, with job-ready skills. Most courses focus on products and services created by or offered by IBM.
Advantages:
The curriculum is heavily focused on practical, in-demand skills and tools.
Professional Certificates are designed to prepare learners for specific jobs in the AI industry.
Courses often include hands-on labs and projects using IBM's own AI platforms and tools.
Earning a Professional Certificate from IBM can be a valuable credential for your resume.
Disadvantages:
The course content has a strong focus on IBM's proprietary technologies, which might not be as universally applicable as open-source alternatives.
Some of the more comprehensive certificate programs require significant time and financial investment.
Ideal for:
Individuals seeking a direct path to a career in artificial intelligence with a focus on practical application.
Learners who want to gain experience with enterprise-level AI tools and platforms.
Professionals working in industries that heavily utilize IBM technologies.
Recommended Courses:
IBM AI Engineering Professional Certificate
IBM Data Science Professional Certificate
Introduction to Artificial Intelligence (AI)
#5: edX
Founded by Harvard and MIT, edX is another leading MOOC (Massive Open Online Courses) provider that hosts a wide array of courses from top universities and institutions. Its offerings in artificial intelligence and computer science are known for their academic rigor and quality, essential for your daily tasks .
Advantages:
Courses from prestigious universities like HarvardX and MITx provide access to world-class education.
MicroMasters programs offer a series of graduate-level courses that can sometimes count as credit toward a master's degree.
Many courses can be viewed for free, allowing learners to explore the material before committing to a paid certificate.
The platform features a wide range of subjects within AI, including ethics and the societal impact of this technology.
Disadvantages:
The user interface and platform experience can sometimes feel less modern than some of its competitors.
The cost of verified certificates can be higher than on other platforms.
Ideal for:
Academically-minded learners who want to delve into the theoretical foundations of artificial intelligence.
Individuals interested in pursuing advanced degrees who want graduate-level coursework.
Those who want to learn from the instructors at some of the world's most respected academic institutions.
Recommended Courses:
CS50's Introduction to Artificial Intelligence with Python (HarvardX)
Professional Certificate in Computer Science for Artificial Intelligence (HarvardX)
Tiny Machine Learning (TinyML) (HarvardX)
#6: Udacity
Udacity is known in the online education market with its "Nanodegree" programs, which are project-based and designed in collaboration with leading tech companies.
Their AI and machine learning Nanodegrees are highly regarded for their hands-on approach.
Advantages:
The project-based curriculum ensures that participants gain practical, hands-on experience.
Nanodegree programs are developed with input from industry experts, ensuring the skills learned are relevant to current jobs.
The platform provides access to mentors and a student community for support.
Career services, including resume reviews and LinkedIn profile optimization, are often included.
Disadvantages:
Nanodegree programs can be significantly more expensive than individual courses on other platforms.
The fast-paced, project-intensive nature of the programs can be demanding.
Ideal for:
Learners who are committed to a career change or significant upskilling in artificial intelligence.
Individuals who learn best by doing and want to build a portfolio of projects to showcase to potential employers.
Those who value mentorship and career support services as part of their learning experience.
Recommended Courses
AI Programming with Python
Become a Machine Learning Engineer
Deep Learning
#7: Fast.ai
Fast.ai offers a unique, top-down approach to learning deep learning, making it one of the most practical courses available to explore for aspiring practitioners. The course is offered for free and has a strong focus on getting students to build and train state-of-the-art models quickly.
Advantages:
The "code-first" approach allows learners to achieve impressive results from the very first lesson.
The course is entirely free and taught by industry experts with extensive practical experience.
A strong emphasis on practical techniques and best practices for training deep learning models.
The fastai library, built on top of PyTorch, simplifies many of the complexities of deep learning programming.
Disadvantages:
The top-down approach may not be ideal for those who prefer to learn the underlying theory.
The course is very fast-paced, which may be challenging for absolute beginners in programming.
Ideal for:
Individuals who are eager to start building and experimenting with deep learning models right away.
Programmers who want to add deep learning to their skillset and are comfortable learning by doing.
Learners who are looking for a free, high-quality, and practical alternative to more traditional, theory-heavy courses.
Recommended Courses:
Practical Deep Learning for Coders
From Deep Learning Foundations to Stable Diffusion
Self-Paced Learning
Professionals are feeling the pressure to keep their skills up-to-date. This is exactly why so many participants and professionals are turning to online courses to supplement their learning. Online courses are the most accessible and flexible way to get a real handle on AI, letting you balance learning with your work and personal life. You get to master complex subjects without having to put everything else on hold, learning from the very people who are leading the AI revolution.
Learn AI Essential Skills
Beyond the knowledge itself, earning an AI certificate gives you something tangible to show existing and new employers. It’s a powerful credential that tells potential employers you have what it takes. In a crowded job market, that proof can make all the difference, opening doors to opportunities you might not have otherwise considered.
Ready to turn your curiosity into a career-defining skill? This guide will introduce you to the best online training content on generative AI that can help you do just that. Remember, if you need an AI-ready hosting platform to assist your learning, Atlantic.Net features cloud and dedicated GPU hosting options, powered by NVIDIA and available on demand.
Free Online Course Vs Paid Content
There is much debate about free vs paid content. Traditionally, you may have thought that the free content was subpar when compared to paid. That really isn't the case these days, especially when it comes to AI.
Content creators want people to use their applications and learn how they work, and this has driven a surge in really high-quality free content that addresses key issues. This is especially true for beginner and intermediate level courses; however, paid content from institutions is better for expert-level training.
Conclusion
Platforms like Coursera and edX provide academically rigorous courses from top universities, while innovators like DeepLearning.AI and Fast.ai offer practical, hands-on training to get you building models immediately. Whether you choose a free, code-first approach or invest in a comprehensive Nanodegree, the key is to start learning and applying your new skills.
As you progress from learning the theory to building your own complex projects, you'll need powerful and reliable computing resources. Atlantic.Net's on-demand GPU hosting, powered by NVIDIA, provides the high-performance infrastructure you need to train sophisticated AI models, turning your newfound knowledge into career-defining results.
Start your AI journey today and let Atlantic.Net power your projects. Reach out to the team or sign up today.
### Auto-Capture Selfie by Detecting Smile Using OpenCV on Ubuntu 24.04 Server
In this digital age, automated photo capture systems are becoming increasingly popular for creating seamless user experiences. This article will guide you through setting up a browser-based smile detection system that automatically captures selfies when it detects your smile.
Prerequisites
An Ubuntu 24.04 server with an NVIDIA GPU.
A non-root user with sudo privileges.
NVIDIA drivers installed.
Step 1: Set up a Python Environment
First, we need to install essential system-level packages to support Python development and OpenCV.
apt install -y python3-pip python3-dev python3-venv libopencv-dev cmake
Now let’s isolate our Python project using a virtual environment.
python3 -m venv smile_env
source smile_env/bin/activate
Install the necessary Python libraries for image processing, mathematical operations, and web application.
pip install opencv-python opencv-contrib-python numpy flask
Step 2: Create Project Structure
Now, create directories to organize templates and selfie images.
mkdir templates static/selfies
Step 3: Create a Self-Signed SSL Certificate
Flask will run with HTTPS, which browsers require for webcam access. Let’s create a self-signed certificate.
openssl req -x509 -newkey rsa:4096 -nodes -out cert.pem -keyout key.pem -days 365
This creates two files: cert.pem (certificate) and key.pem (private key), valid for one year. Browsers may show a warning, but you can safely proceed for local testing.
Step 4: Build the Flask Backend
Let’s create the heart of the app, the Python backend that receives webcam frames and saves selfies.
nano app.py
Add the following code.
from flask import Flask, request, Response, jsonify, render_template
import cv2
import numpy as np
import os
import time
import base64
app = Flask(__name__)
# Create directory for saved selfies
os.makedirs('static/selfies', exist_ok=True)
# Load pre-trained classifiers
face_cascade = cv2.CascadeClassifier(cv2.data.haarcascades + 'haarcascade_frontalface_default.xml')
smile_cascade = cv2.CascadeClassifier(cv2.data.haarcascades + 'haarcascade_smile.xml')
selfie_count = 0
last_capture_time = 0
CAPTURE_COOLDOWN = 2 # seconds between captures
@app.route('/')
def index():
selfies = sorted([f for f in os.listdir('static/selfies') if f.endswith('.jpg')], reverse=True)
return render_template('index.html', selfies=selfies)
@app.route('/process_frame', methods=['POST'])
def process_frame():
global selfie_count, last_capture_time
# Get image data from POST request
image_data = request.json['image'].split(',')[1] # Remove data URL prefix
nparr = np.frombuffer(base64.b64decode(image_data), np.uint8)
frame = cv2.imdecode(nparr, cv2.IMREAD_COLOR)
# Convert to grayscale
gray = cv2.cvtColor(frame, cv2.COLOR_BGR2GRAY)
# Detect faces
faces = face_cascade.detectMultiScale(gray, 1.3, 5)
result = {'faces': [], 'captured': False}
for (x, y, w, h) in faces:
# Add face to result
result['faces'].append({'x': int(x), 'y': int(y), 'w': int(w), 'h': int(h)})
# Detect smiles within the face region
roi_gray = gray[y:y+h, x:x+w]
smiles = smile_cascade.detectMultiScale(
roi_gray,
scaleFactor=1.7,
minNeighbors=20,
minSize=(25, 25)
)
# If smile detected and cooldown has passed
current_time = time.time()
if len(smiles) > 0 and (current_time - last_capture_time) > CAPTURE_COOLDOWN:
# Save the selfie
timestamp = time.strftime("%Y%m%d-%H%M%S")
filename = f"static/selfies/selfie_{timestamp}_{selfie_count}.jpg"
cv2.imwrite(filename, frame)
selfie_count += 1
last_capture_time = current_time
result['captured'] = True
result['selfie_url'] = filename
return jsonify(result)
if __name__ == '__main__':
app.run(host='0.0.0.0', port=5000, ssl_context=('cert.pem', 'key.pem'))
The above code:
Loads pre-trained Haar cascade classifiers for face and smile detection.
Processes video frames sent from the browser.
Captures and saves selfies when a smile is detected (with a 2-second cooldown).
Step 5: Build the Web Interface
Create a front-end that interacts with the user's webcam and displays the results.
nano templates/index.html
Add the following code.
Browser-Based Smile Detection Selfie
Smile Detection Selfie Capture
Allow camera access when prompted. The system will automatically capture selfies when you smile!
Camera is off
Your Selfies
{% for selfie in selfies %}
{% endfor %}
This page:
Lets users start or stop their webcam.
Sends each frame to the Flask server via /process_frame.
Draws bounding boxes around detected faces.
Displays the captured selfies in a grid layout.
Step 6: Run the Flask App
Launch your Flask web server with HTTPS enabled.
python3 app.py
Your app will now listen on https://0.0.0.0:5000 with the SSL certificates. This makes it compatible with browsers requiring a secure context for webcam access.
Step 7: Access the Web Interface
Open your web browser and open the URL https://server-ip:5000.
Once the site loads, click on the "Start Camera" button. Allow camera access when prompted.
The system will now:
Show your camera feed.
Continuously scan for faces.
Capture and save selfies when it detects a smile.
Every time you smile, the system detects it and captures a selfie, saving it to the static/selfies folder.
Conclusion
You’ve just built a complete smile-activated selfie system using OpenCV and Flask on an Ubuntu 24.04 server. This project is an excellent example of combining computer vision with web development to create real-time, interactive applications.
### Advanced Color Detection Web App with Flask & Machine Learning on Ubuntu 24.04 GPU Server
Color detection plays a crucial role in computer vision, from sorting items by color to assisting visually impaired users. By combining the power of Flask, OpenCV, and machine learning, you can build an advanced web app that accurately detects and classifies colors from uploaded images or user interactions.
In this tutorial, we will deploy a color detection web app on an Ubuntu 24.04 GPU server. The app utilizes a pre-trained machine learning model for enhanced accuracy and offers an intuitive interface for uploading images and selecting pixels to identify their colors. You also learn how to structure the Flask backend, handle file uploads, and serve color predictions in real-time.
Prerequisites
An Ubuntu 24.04 server with an NVIDIA GPU.
A non-root user with sudo privileges.
NVIDIA drivers installed.
Step 1: Set Up Python Environment
First, we'll install the necessary Python packages and create a virtual environment.
1. Install Python and pip.
apt install -y python3-pip python3-dev python3-venv
2. Create a virtual environment.
python3 -m venv venv
3. Activate the virtual environment.
source venv/bin/activate
Step 2: Install Required Python Packages
Now we'll install all the Python dependencies for our project.
pip install tqdm flask opencv-python pandas numpy scikit-learn pillow
These packages include:
tqdm for progress bars
flask for the web framework
opencv-python for image processing
pandas, numpy for data handling
scikit-learn for machine learning
pillow for image handling
Step 3: Set Up Project Structure
1. Create the necessary directories for our web application.
mkdir templates static
2. Download the color database from Kaggle for color recognition.
3. Copy the downloaded dataset file from your local computer to the server.
scp archive.zip root@server-ip:/root/
4. Unzip the downloaded dataset.
unzip archive.zip
Step 4: Create the Machine Learning Model
Now we'll create a script to train our color classification model.
1. Create a new file called model_trainer.py:
nano model_trainer.py
Add the following code.
import os
import cv2
import numpy as np
from sklearn.svm import SVC
from sklearn.model_selection import train_test_split
from sklearn.metrics import accuracy_score
import joblib
from tqdm import tqdm
class ColorModelTrainer:
def __init__(self, dataset_path="training_dataset"):
self.dataset_path = dataset_path
self.classes = sorted(os.listdir(dataset_path))
self.model = SVC(kernel='linear', probability=True)
def load_dataset(self):
X = []
y = []
print("Loading dataset...")
for class_idx, class_name in enumerate(tqdm(self.classes)):
class_path = os.path.join(self.dataset_path, class_name)
for img_file in os.listdir(class_path):
img_path = os.path.join(class_path, img_file)
img = cv2.imread(img_path)
if img is not None:
img = cv2.resize(img, (50, 50)) # Standardize size
img = cv2.cvtColor(img, cv2.COLOR_BGR2RGB)
X.append(img.flatten())
y.append(class_idx)
return np.array(X), np.array(y)
def train(self):
X, y = self.load_dataset()
X_train, X_test, y_train, y_test = train_test_split(X, y, test_size=0.2)
print("Training model...")
self.model.fit(X_train, y_train)
# Evaluate
y_pred = self.model.predict(X_test)
accuracy = accuracy_score(y_test, y_pred)
print(f"Model accuracy: {accuracy:.2f}")
# Save model
os.makedirs("static/models", exist_ok=True)
joblib.dump(self.model, "static/models/color_classifier.joblib")
joblib.dump(self.classes, "static/models/classes.joblib")
print("Model saved successfully")
if __name__ == "__main__":
trainer = ColorModelTrainer()
trainer.train()
2. Run the training script.
python3 model_trainer.py
This script will:
Load and preprocess the training images
Train an SVM classifier
Evaluate the model accuracy
Save the trained model for later use
Step 5: Create the Color Detector Class
Now we'll create the core functionality that detects colors using both traditional and ML methods.
1. Create a new file called color_detector.py:
nano color_detector.py
Add the following code.
import cv2
import pandas as pd
import numpy as np
import joblib
import os
class AdvancedColorDetector:
def __init__(self):
# Traditional method
self.csv_path = os.path.join('static', 'colors.csv')
self.index = ["color", "color_name", "hex", "R", "G", "B"]
self.df = pd.read_csv(self.csv_path, names=self.index, header=None)
# ML method
self.ml_model = joblib.load("static/models/color_classifier.joblib")
self.classes = joblib.load("static/models/classes.joblib")
def get_color_name_traditional(self, R, G, B):
minimum = float('inf')
color_name = "Unknown"
for i in range(len(self.df)):
d = abs(R - int(self.df.loc[i, "R"])) + abs(G - int(self.df.loc[i, "G"])) + abs(B - int(self.df.loc[i, "B"]))
if d < minimum:
minimum = d
color_name = self.df.loc[i, "color_name"]
return color_name
def get_color_name_ml(self, img, x, y):
# Extract 50x50 patch around the clicked point
patch_size = 25
patch = img[max(0,y-patch_size):min(img.shape[0],y+patch_size),
max(0,x-patch_size):min(img.shape[1],x+patch_size)]
if patch.size == 0:
return "Unknown"
# Resize and predict
patch = cv2.resize(patch, (50, 50))
patch = cv2.cvtColor(patch, cv2.COLOR_BGR2RGB).flatten()
proba = self.ml_model.predict_proba([patch])[0]
confidence = max(proba)
if confidence < 0.6: # Confidence threshold
return "Unknown (Low Confidence)"
return self.classes[np.argmax(proba)]
def process_image(self, image_path, x, y):
img = cv2.imread(image_path)
if img is None:
return None, "Could not read image"
b, g, r = img[y, x]
# Get results from both methods
traditional_name = self.get_color_name_traditional(r, g, b)
ml_name = self.get_color_name_ml(img, x, y)
return {
'rgb': (r, g, b),
'traditional': traditional_name,
'ml': ml_name
}
Step 6: Create the Flask Web Application
Now we'll create the main Flask application that serves our web interface.
1. Create a new file called app.py:
nano app.py
Add the following code.
from flask import Flask, render_template, request, jsonify
import os
from color_detector import AdvancedColorDetector
app = Flask(__name__)
app.config['UPLOAD_FOLDER'] = os.path.join('static', 'uploads')
os.makedirs(app.config['UPLOAD_FOLDER'], exist_ok=True)
detector = AdvancedColorDetector()
@app.route('/', methods=['GET', 'POST'])
def index():
if request.method == 'POST':
if 'file' not in request.files:
return render_template('index.html', error="No file selected")
file = request.files['file']
if file.filename == '':
return render_template('index.html', error="No file selected")
if file:
filename = os.path.join(app.config['UPLOAD_FOLDER'], file.filename)
file.save(filename)
return render_template('index.html',
image_url=filename,
filename=file.filename)
return render_template('index.html')
@app.route('/detect', methods=['POST'])
def detect():
data = request.json
filename = os.path.join(app.config['UPLOAD_FOLDER'], data['filename'])
x, y = int(data['x']), int(data['y'])
result = detector.process_image(filename, x, y)
return jsonify({
'rgb': f"RGB({result['rgb'][0]}, {result['rgb'][1]}, {result['rgb'][2]})",
'traditional': result['traditional'],
'ml': result['ml']
})
if __name__ == '__main__':
app.run(host='0.0.0.0', port=5000, debug=True)
2. Create the web interface template in the templates directory.
nano templates/index.html
Add the following code.
Advanced Color Detection
Upload an image and click anywhere to detect colors using both traditional and ML methods
{% if image_url %}
Traditional Method:Click on the image
ML Method:Click on the image
RGB Values:-
{% endif %}
{% if image_url %}
{% endif %}
Step 7: Run the Application
Start the Flask development server.
python3 app.py
You will see the following output.
* Running on all addresses (0.0.0.0)
* Running on http://127.0.0.1:5000
* Running on http://server-ip:5000
Step 8: Access the Application
1. Open a web browser and navigate to http://server-ip:5000.
2. Click the "Browse" button to upload an image from your local computer.
3. After uploading, click on any color in the image.
4. The app will display:
The RGB values of the selected color
The color name detected by the traditional method
The color name detected by the machine learning method
Conclusion
In this tutorial, you have built a robust and interactive web app capable of detecting colors using machine learning on an Ubuntu 24.04 GPU server. You configured the environment, deployed a Flask application, and integrated a color classification model to enhance accuracy. This setup provides a strong foundation for more complex vision tasks such as object recognition or augmented reality.
### Iris Flower Classification Using Machine Learning on Ubuntu 24.04 GPU Server
Classifying Iris flowers is a classic machine learning problem. It’s a perfect introduction to supervised learning, showcasing key machine learning techniques. Initially introduced by the renowned statistician Ronald Fisher, the Iris dataset has become a standard benchmark for testing new machine learning algorithms. It consists of different Iris species, each with distinct characteristics, making it an ideal dataset for understanding classification concepts.
In this guide, you'll learn how to build a robust Iris flower classification model using a GPU-powered Ubuntu 24.04 server. We will also create a Flask web application that allows users to upload an image of an iris flower and display the predicted species name.
Prerequisites
An Ubuntu 24.04 server with an NVIDIA GPU.
A non-root user with sudo privileges.
NVIDIA drivers installed.
Step 1: Install Required Packages
First, let's install the necessary system packages.
apt install python3-pip python3-venv unzip -y
Step 2: Set Up Python Environment
Now, you will create a Python environment for your project.
1. Create a virtual environment.
python3 -m venv venv
2. Activate the virtual environment.
source venv/bin/activate
3. Install the required Python packages.
pip3 install tensorflow pillow flask kaggle
These packages include:
tensorflow for machine learning with GPU support
pillow for image processing
flask for the web interface
kaggle to download datasets
Step 3: Set Up Kaggle API
To download our dataset, we need to configure the Kaggle API.
1. Go to Kaggle and log in.
2. Click your profile picture => Account
3. Scroll down to API section
4. Click "Create New API Token"
5. This will download kaggle.json to your computer
6. Create a Kaggle configuration directory on your server.
mkdir -p ~/.kaggle
7. Copy your downloaded kaggle.json file into the ~/.kaggle folder.
8. Set appropriate permissions.
chmod 600 ~/.kaggle/kaggle.json
Step 4: Download and Prepare the Dataset
Now, we will use Kaggle to download and extract the dataset.
1. Download the flower dataset.
kaggle datasets download -d imsparsh/flowers-dataset
2. Unzip the dataset.
unzip flowers-dataset.zip
3. Rename the training folder for easier reference.
mv train flowers
Step 5: Create the CNN Training Script
1. Create a file called train_cnn_model.py.
nano train_cnn_model.py
Add the following code.
# train_cnn_model.py
import tensorflow as tf
from tensorflow.keras.preprocessing.image import ImageDataGenerator
from tensorflow.keras.models import Sequential
from tensorflow.keras.layers import Conv2D, MaxPooling2D, Flatten, Dense
from tensorflow.keras.optimizers import Adam
# Define dataset path
data_dir = 'flowers' # folder created after unzip
model_path = 'flowers_cnn_model.h5'
# Image properties
img_width, img_height = 150, 150
batch_size = 32
epochs = 10
# Data loading and augmentation
datagen = ImageDataGenerator(rescale=1./255, validation_split=0.2)
train_generator = datagen.flow_from_directory(
data_dir,
target_size=(img_width, img_height),
batch_size=batch_size,
class_mode='categorical',
subset='training'
)
validation_generator = datagen.flow_from_directory(
data_dir,
target_size=(img_width, img_height),
batch_size=batch_size,
class_mode='categorical',
subset='validation'
)
# Build CNN Model
model = Sequential([
Conv2D(32, (3, 3), activation='relu', input_shape=(img_width, img_height, 3)),
MaxPooling2D(2, 2),
Conv2D(64, (3, 3), activation='relu'),
MaxPooling2D(2, 2),
Flatten(),
Dense(128, activation='relu'),
Dense(train_generator.num_classes, activation='softmax')
])
# Compile model
model.compile(optimizer=Adam(), loss='categorical_crossentropy', metrics=['accuracy'])
# Train the model
model.fit(train_generator, epochs=epochs, validation_data=validation_generator)
# Save the model
model.save(model_path)
print("✅ CNN model trained and saved as flowers_cnn_model.h5")
This will:
Load and preprocess the flower images
Create a convolutional neural network (CNN)
Train the model for 10 epochs
Save the trained model as flowers_cnn_model.h5
2. Run the training script.
python3 train_cnn_model.py
Output.
✅ CNN model trained and saved as flowers_cnn_model.h5
Step 6: Create the Flask Application
1. Create the main application file.
nano app.py
Add the following code.
# app.py
import os
from flask import Flask, render_template, request
from tensorflow.keras.models import load_model
from tensorflow.keras.preprocessing import image
import numpy as np
app = Flask(__name__)
UPLOAD_FOLDER = 'static/uploads'
os.makedirs(UPLOAD_FOLDER, exist_ok=True)
app.config['UPLOAD_FOLDER'] = UPLOAD_FOLDER
# Load the trained model
model = load_model('flowers_cnn_model.h5')
# Class labels (based on folders in 'flowers' dataset)
class_labels = ['daisy', 'dandelion', 'rose', 'sunflower', 'tulip']
@app.route('/', methods=['GET', 'POST'])
def index():
prediction = None
image_url = None
if request.method == 'POST':
file = request.files['file']
if file:
filepath = os.path.join(app.config['UPLOAD_FOLDER'], file.filename)
file.save(filepath)
# Preprocess uploaded image
img = image.load_img(filepath, target_size=(150, 150))
img_array = image.img_to_array(img) / 255.0
img_array = np.expand_dims(img_array, axis=0)
# Predict class
pred = model.predict(img_array)
predicted_class = class_labels[np.argmax(pred)]
prediction = predicted_class
image_url = filepath
return render_template('index.html', prediction=prediction, image_url=image_url)
if __name__ == '__main__':
app.run(host='0.0.0.0', port=5000)
2. Create the templates directory and HTML file.
mkdir templates
nano templates/index.html
Add the following code.
Flower Image Classifier 🌸
Upload a Flower Image 🌻🌹🌼
{% if prediction %}
Predicted Flower Species: {{ prediction }}
{% endif %}
Step 7: Run the Application
Start the Flask development server.
python3 app.py
Output.
* Running on all addresses (0.0.0.0)
* Running on http://127.0.0.1:5000
* Running on http://server-ip:5000
INFO:werkzeug:Press CTRL+C to quit
Step 8: Access the App
1. Open your web browser and access the app using the URL http://server-ip:5000.
2. Click the "Browse" button to upload a flower image from your local computer
3. Click "Upload and Predict".
4. The app will process the image and display:
The predicted flower species (daisy, dandelion, rose, sunflower, or tulip)
The uploaded image
Conclusion
This tutorial has walked you through the complete process of building a flower classification system on an Ubuntu 24.04 GPU server. We have implemented a convolutional neural network using TensorFlow that can accurately classify five types of flowers (daisy, dandelion, rose, sunflower, and tulip). We then created a user-friendly web interface using Flask to make the model accessible.
### Gender and Age Detection using Machine Learning on Ubuntu 24.04 Server
In today’s AI-driven world, automatically recognizing a person’s age and gender from an image has numerous real-world applications. From targeted advertising to audience analysis and security systems, age and gender detection is increasingly valuable.
In this tutorial, we'll build a gender and age detection system using Machine Learning on an Ubuntu 24.04 server. We will also create a Flask-based web interface that allows users to upload an image and view the predicted age and gender.
Prerequisites
An Ubuntu 24.04 server with an NVIDIA GPU.
A non-root user with sudo privileges.
NVIDIA drivers installed.
Step 1: Set Up a Python Environment
1. Install required Python packages.
apt install python3-pip python3-venv
2. Create a virtual environment for your project.
python3 -m venv venv
3. Activate the virtual environment.
source venv/bin/activate
4. Install Python libraries for AI and Web development
pip install scikit-learn opencv-python flask tensorflow keras
Step 2: Prepare Pre-trained Models
In this section, we will download the face, age, and gender detection models needed for inference. For this project, we'll use OpenCV’s pre-trained Age and Gender models.
1. First, create a directory to store all models.
mkdir -p model
2. Navigate to the model directory.
cd model
3. Download all required models.
wget https://raw.githubusercontent.com/spmallick/learnopencv/master/AgeGender/opencv_face_detector.pbtxt
wget https://raw.githubusercontent.com/spmallick/learnopencv/master/AgeGender/opencv_face_detector_uint8.pb
wget https://raw.githubusercontent.com/spmallick/learnopencv/master/AgeGender/age_deploy.prototxt
wget https://raw.githubusercontent.com/eveningglow/age-and-gender-classification/5b60d9f8a8608cdbbcdaaa39bf28f351e8d8553b/model/age_net.caffemodel
wget https://raw.githubusercontent.com/spmallick/learnopencv/master/AgeGender/gender_deploy.prototxt
wget https://raw.githubusercontent.com/eveningglow/age-and-gender-classification/master/model/gender_net.caffemodel
4. Change back to the main directory.
cd ..
Step 3: Write the Age and Gender Detection Script
Here, you create a Python script that loads the models and predicts age and gender from face images.
1. Create a file detect.py.
nano detect.py
Add the following code.
import cv2
# Load models
face_model = "model/opencv_face_detector_uint8.pb"
face_proto = "model/opencv_face_detector.pbtxt"
age_model = "model/age_net.caffemodel"
age_proto = "model/age_deploy.prototxt"
gender_model = "model/gender_net.caffemodel"
gender_proto = "model/gender_deploy.prototxt"
age_list = ['(0-2)', '(4-6)', '(8-12)', '(15-20)',
'(25-32)', '(38-43)', '(48-53)', '(60-100)']
gender_list = ['Male', 'Female']
# Load networks
face_net = cv2.dnn.readNet(face_model, face_proto)
age_net = cv2.dnn.readNet(age_model, age_proto)
gender_net = cv2.dnn.readNet(gender_model, gender_proto)
def detect_face(img):
blob = cv2.dnn.blobFromImage(img, 1.0, (300, 300),
[104, 117, 123], swapRB=False)
face_net.setInput(blob)
detections = face_net.forward()
h, w = img.shape[:2]
faces = []
for i in range(detections.shape[2]):
confidence = detections[0, 0, i, 2]
if confidence > 0.7:
box = detections[0, 0, i, 3:7] * \
[w, h, w, h]
(x1, y1, x2, y2) = box.astype("int")
faces.append((x1, y1, x2-x1, y2-y1))
return faces
def predict_age_gender(img_path):
frame = cv2.imread(img_path)
faces = detect_face(frame)
if len(faces) == 0:
return "No face detected!", None
results = []
for (x, y, w, h) in faces:
face_img = frame[y:y+h, x:x+w].copy()
blob = cv2.dnn.blobFromImage(face_img, 1.0, (227, 227),
(78.4263377603, 87.7689143744, 114.895847746),
swapRB=False)
# Predict Gender
gender_net.setInput(blob)
gender_preds = gender_net.forward()
gender = gender_list[gender_preds[0].argmax()]
# Predict Age
age_net.setInput(blob)
age_preds = age_net.forward()
age = age_list[age_preds[0].argmax()]
results.append((gender, age))
return results[0] # Return first detected face
Step 4: Create the Flask Web App
This step builds a web server using Flask that can accept image uploads and return predictions.
1. Create a Flask application.
nano app.py
Add the following code.
from flask import Flask, render_template, request
import os
from detect import predict_age_gender
app = Flask(__name__)
UPLOAD_FOLDER = 'static/uploads'
app.config['UPLOAD_FOLDER'] = UPLOAD_FOLDER
os.makedirs(UPLOAD_FOLDER, exist_ok=True)
@app.route('/', methods=['GET', 'POST'])
def index():
result = None
filename = None
if request.method == 'POST':
if 'file' not in request.files:
return 'No file uploaded', 400
file = request.files['file']
if file.filename == '':
return 'No selected file', 400
if file:
filename = os.path.join(app.config['UPLOAD_FOLDER'], file.filename)
file.save(filename)
result = predict_age_gender(filename)
return render_template('index.html', result=result, filename=filename)
if __name__ == '__main__':
app.run(host="0.0.0.0", port=5000, debug=True)
Step 5: Create the HTML Template
You’ll now design a simple user interface that allows users to upload images and view the results.
Create a folder called 'templates' and inside it, create an index.html file.
mkdir templates
nano templates/index.html
Add the following code.
Gender and Age Detection
Upload an Image for Age and Gender Detection
{% if filename %}
Uploaded Image:
{% endif %}
{% if result %}
Prediction:
Gender: {{ result[0] }}
Age: {{ result[1] }}
{% endif %}
Step 6: Run the Flask App
Finally, this step starts the Flask web server, allowing you to access your app from a browser.
python3 app.py
Access your Flask app at http://server-ip:5000.
You’ll see a simple page where you can upload a face image, and it will show the predicted gender and age!
Conclusion
In this project, we built a Gender and Age Detection app using Machine Learning models on an Ubuntu 24.04 server and created a Flask web interface for easy interaction. You can enhance this project further by integrating it with a live camera feed or deploying it online.
### Leading AI in Healthcare Providers in 2025
AI is driving innovation across the healthcare sector. As technology progresses, AI is being increasingly integrated into clinical care, diagnostics, and operational processes, transforming how healthcare providers deliver their services.
In 2025, we are seeing a clear shift from experimentation with AI to implementation. Healthcare providers are embracing AI-driven healthcare innovation and moving beyond pilot projects to adopt AI tools at scale.
This article highlights some of the leading AI in healthcare providers at the forefront of this transformation. These providers are using AI strategically to enhance their services, streamline their workflow, and deliver more responsive, data-driven care.
Top Companies Using AI Technology to Reshape Health Care in 2025
So, which healthcare organizations are leading the way? Here are some of the top providers embracing AI to deliver smarter, faster, and more effective care in 2025:
#1: Tempus
About Tempus:
Tempus is a leader in AI-powered precision medicine, with a strong focus on oncology, neurology, psychiatry, cardiology, dermatology, and radiology. Their platform uses real-world clinical, molecular, and genomic data to allow healthcare professionals to diagnose conditions with more accuracy and devise personalized treatment recommendations that are tailored to each patient’s unique profile.
Advantages:
Precision Oncology: Analyzes tumor genomic data to identify mutations and biomarkers, guiding targeted therapies.
Comprehensive Data Integration: Combines clinical, molecular, and patient health records for deeper insights.
Drug Development & Clinical Trials: Uses AI, alongside a vast library of clinical data, to identify novel drug targets and optimize the drug development process.
Scalable Platform: Enables healthcare providers to apply precision medicine across various specialties.
Disadvantages:
Implementation Complexity: Integrating advanced AI tools into existing healthcare systems may require significant resources and training.
Data Privacy Concerns: Handling extensive genomic and clinical data necessitates stringent compliance with privacy regulations.
Target Audience:
Healthcare providers and research institutions seeking to integrate AI-driven precision medicine into everyday healthcare delivery, particularly within the field of oncology and other complex specialties.
#2: Cera
About Cera:
Cera is a UK-based healthcare provider that is transforming home care through the use of AI technology. It uses machine learning and data analytics to monitor patients remotely, anticipate health deteriorations and potential health risks, and automate their care planning, with the aim of reducing hospitalizations in patients with chronic diseases.
Advantages:
Proactive and Preventative Care: Cera's deep learning algorithms help to flag early signs of illness and predict potential health risks or deterioration, enabling timely intervention and reducing hospital admissions.
Remote Patient Monitoring: The app-based platform uses AI tools to analyze real-time health data from in-patient home visits, which includes things like heart rate, temperature and blood pressure, as well as other health indicators such as sleep patterns and activity levels. This data can then be used to detect whether a patient's condition is worsening so that health professionals can respond appropriately.
Enhanced Medication Management: The technology can be used to enhance medication adherence by sending reminders and tracking intake, significantly reducing errors and improving patient safety at home.
Support of Caregivers: Cera automates administrative tasks, including rostering and care documentation, freeing up staff to focus on delivering hands-on care.
Disadvantages:
Integration Challenges: Cera relies on high-quality, consistent data input from both carers and their patients, which can be difficult to standardize at scale.
Maintaining Human Touch: Cera's extensive use of AI and automation, while efficient, requires careful management to ensure that the essential human element of compassionate care isn't diminished, especially for vulnerable patients.
Data Privacy & Trust: Handling sensitive health data in a highly integrated system requires strict cybersecurity and transparent data usage policies.
Target Audience:
Cera’s platform is ideal for national health systems, local authorities, and private care providers who are looking to use AI to modernize home healthcare services and to ease pressure on hospitals.
#3: PathAI
About PathAI:
PathAI, which is a Boston-based company, uses AI-powered technology to transform the workflow within biopharma and pathology laboratories. By applying deep learning to vast datasets of digital pathology images, PathAI is enabling more precise disease diagnosis, accelerating drug development, and uncovering novel biomarkers, ultimately pushing the boundaries of precision medicine in areas such as oncology and inflammatory diseases to improve patient outcomes.
Advantages:
Improve Diagnostic Accuracy: PathAI's deep learning models have demonstrated high accuracy in detecting malignancies and other diseases on pathology slides, often matching or surpassing the performance of experienced pathologists.
Optimize Workflow: AI tools such as TumorDetect automate tumor assessment and quantification, enabling pathologists to focus on the most critical cases and reduce their turnaround times.
Seamless Integration: PathAI's technology can integrate seamlessly into existing lab software, without the need for major system overhauls or lengthy onboarding.
Continuous Learning: PathAI's machine learning algorithms continuously improve over time, adapting to new data so that they align with evolving diagnostic standards.
Disadvantages:
Initial Setup Complexity: Implementing PathAI's solutions may require significant time and resources for setup and training.
Dependence on Data Quality: The accuracy of any analysis is highly dependent on the quality of data input into the system, so if you have poor-quality pathology slides, then this can affect performance.
Cost Considerations: The platform may be expensive for smaller laboratories or institutions with limited budgets.
Target Audience:
Pathologists looking to improve the efficiency and accuracy of their work
Large laboratories and medical institutions with high diagnostic workloads
Researchers looking for advanced AI tools to aid in pathology and medical research
#4: Butterfly Network
About Butterfly Network:
Butterfly Network has developed an AI-powered handheld ultrasound device that connects to a smartphone, bringing high-quality imaging directly to the point of care. This portable ultrasound system is practical for use even in diverse settings, such as remote communities, making diagnostic imaging more accessible than ever. Their devices make use of advanced AI algorithms to automate image capture and analysis, including rapid and accurate B-line counting from a six-second lung ultrasound clip (used in lung ultrasounds to assess fluid build-up), enhancing on-the-spot assessment of lung conditions.
Advantages:
More Precise Disease Diagnosis: Real-time, AI-assisted image analysis enhances diagnostic accuracy.
Improved Accessibility to Ultrasound Imaging: Portable and smartphone-compatible, enabling versatile use in diverse settings.
Simplified Imaging Workflow: Automates complex imaging tasks, reducing operator dependency.
Disadvantages:
User Training Needed: While AI assists with image acquisition, proficient interpretation of the ultrasound images still requires significant user training and clinical experience.
Reliance on Good Connectivity: Optimal functionality of the devices and integration of data rely heavily on stable smartphone connectivity, which can be a limitation in extremely remote or underdeveloped areas.
Diagnostic Scope Limitations: Despite its advancements, the handheld device may not fully replace the advanced capabilities or specialized probes of traditional ultrasound systems for certain complex or in-depth diagnostic needs.
Target Audience:
Healthcare providers needing mobile imaging solutions
Clinics and emergency services in remote regions
Medical professionals seeking AI solutions to improve ultrasound diagnostics
#5. XpertDox
About XpertDox:
Based in the U.S, XpertDox uses AI to automate medical coding, helping healthcare providers to speed up billing and reduce errors. Their flagship tool, XpertCoding, automatically pulls the right billing codes from clinical documents, helping hospitals and clinics to speed things up, cut down on admin errors, and get reimbursed faster.
Advantages:
Fast and Efficient: XpertCoding processes and submits medical claims within 24 hours, reducing manual effort and accelerating the billing process. It also automates approximately 94% of claims without human intervention, reducing the need for manual coding.
High Accuracy: The platform achieves over 98% coding accuracy, minimizing claim denials and enhancing compliance.
Seamless EHR Integration: The XpertCoding platform can seamlessly connect with any existing EHR system.
Business Intelligence Platform: Their Business Intelligence Platform provides real-time analytics, audit trails, and Clinical Documentation Improvement (CDI) feedback to optimize operational efficiency.
Disadvantages:
Initial Setup Requirements: While integration is streamlined, initial setup and training may require dedicated resources to ensure optimal utilization.
Reliance on Accurate Data: The effectiveness of the system relies heavily on the clarity and completeness of the clinical data and medical records that are input. Any incomplete notes or ambiguity can pose challenges.
Target Audience:
Hospitals, large multi-specialty clinics, healthcare systems, and third-party billing companies that are focused on optimizing their revenue cycle management.
How Do Healthcare Providers Use Artificial Intelligence to Enhance Patient Care?
The healthcare industry employs AI technologies, such as natural language processing, deep learning, and machine learning, to enhance efficiency, improve diagnostics, and streamline patient care. These tools enable healthcare professionals to better analyze and organize patient data, support more accurate diagnoses, and deliver personalized treatment plans tailored to individual needs.
Here are some of the key ways that healthcare organizations are implementing AI tools across their services:
Improving Medical Diagnosis and Disease Detection
AI algorithms, particularly deep learning models, are revolutionizing medical diagnosis and disease detection. By meticulously analyzing medical images such as X-rays, MRIs, and mammograms, as well as medical history records, these technologies help to enhance diagnostic accuracy. This advancement is particularly important in conditions such as breast cancer, Alzheimer's disease, and cardiovascular conditions, where early-stage detection is paramount to achieving better health outcomes.
Streamlining Electronic Health Records and Reducing Administrative Burdens
AI systems automate repetitive administrative tasks such as health data entry, leading to enhanced accuracy and freeing up clinicians' valuable time for patient-centered activities. These tools also help to manage and extract crucial information from complex clinical data, providing actionable insights for diagnosis and treatment.
Embrace Personalized Medicine
Through analyzing patient-specific data, AI supports precision medicine, allowing healthcare providers to tailor treatments based on an individual's unique health concerns, as well as their biomarker profiles, lifestyle, environmental factors, and genetics.
Support Population Health Management
As AI tools analyze data at scale, they can be used to track health trends, monitor outbreaks, and support decision-making for public health strategies. These insights are essential to organizations such as the World Health Organization that help to manage the health of large populations.
Boost Patient Engagement with Virtual Assistants
To significantly boost patient engagement and experience, healthcare providers take advantage of virtual health assistants. These can answer routine questions, help with appointment scheduling and remind patients to take their medication.
Reduce Healthcare Costs
By optimizing efficiency, minimizing waste and errors, and optimizing resource allocation, AI technologies continue to reduce costs across the whole of the healthcare sector.
Accelerate Drug Discovery and Optimize Clinical Trials
In addition to transforming day-to-day medicine, AI models are also revolutionizing the drug development process and significantly speeding up clinical trials. AI excels at identifying novel drug targets by pinpointing critical biological pathways and proteins that can be precisely manipulated for therapeutic benefit. When it comes to clinical trials, AI helps to optimize protocol design, streamline data collection, and enhance analysis, significantly speeding up the trial process and reducing costs.
Artificial Intelligence in Healthcare: What’s Next?
AI has already made a huge impact on healthcare, from improving diagnostics and speeding up drug discovery to personalizing patient care, but we’re only just scratching the surface.
As AI tools become more advanced and datasets more diverse, the potential for AI to transform everything from mental health care to surgical planning is enormous. As we progress, we can expect to see even more collaboration between AI companies and healthcare providers, as well as stronger safeguards to tackle data security.
Do you need a reliable way to build and scale your AI healthtech application? Atlantic.Net offers fast, secure GPU cloud hosting, ideal for building, training, and deploying your AI models.
### Top LLM Companies in 2025
The field of artificial intelligence is not just advancing; it's accelerating at an unbelievable pace. The AI market is projected to be worth a staggering $1.81 trillion by 2030, evidence of the technology's profound impact on our everyday lives.
At the heart of this transformation are large language models (LLMs), sophisticated AI systems that are powering a new generation of applications. We are already halfway through 2025, and a handful of leading LLM development companies have already established themselves as the leaders in LLM development.
LLMs are custom machine learning models that have been created for research and commercial purposes. They incorporate generative AI capabilities and advanced reasoning tasks that allow users to chat with the model to learn or perform specific tasks.
This article uncovers some of the leading LLM companies making an impact in 2025. We will explore their flagship AI models, their unique approaches, and the innovative generative AI functions they offer.
Best Large Language Model AI Companies
Here are five of the top LLM companies making a significant impact in 2025:
#1: OpenAI (ChatGPT)
OpenAI is well known around the world and often associated with bringing the use of LLMs to the masses with the hugely popular ChatGPT. It became the fastest-growing application in history by reaching 100 million users in just two months.
Advantages:
Strong Brand Recognition: High public awareness due to ChatGPT's success, which currently attracts billions of interactions a month.
Leading-Edge Performance: Consistently develops state-of-the-art, powerful AI models and excels in image creation.
Developer-Friendly: Features many easy-to-use APIs for integration.
Extensive Research: A key contributor to fundamental AI advancements.
Disadvantages:
Closed-Source Models: Lack of transparency into its most powerful AI systems.
High-Volume Costs: API usage can be expensive for large-scale applications.
Ongoing Safety Debates: Faces scrutiny over potential misuse and model bias.
Ideal for:
Startups & Developers: For rapid AI feature integration and prototyping.
Content & Marketing Teams: For creative text generation and brainstorming.
Academic Researchers: For tracking major advancements in AI model capabilities.
#2: Anthropic (Claude)
Anthropic was founded by former senior members of OpenAI with a primary focus on AI safety and research. The company is dedicated to building reliable foundation models , interpretable, and steerable AI systems. Their flagship large language model, Claude, is designed with a "Constitutional AI" approach, where the model's behavior is guided by a set of principles aimed at ensuring it remains helpful, harmless, and honest.
Advantages:
Forefront of AI Safety: Focused on ethical and responsible AI development.
"Constitutional AI" Training: Unique approach reduces the risk of harmful or unethical outputs.
Advanced Comprehension: Excels at understanding nuance in long, complex documents.
Focus on Transparency: Actively researches methods for more interpretable AI systems.
Disadvantages:
Slower Commercial Pace: More cautious in releasing commercial products compared to rivals.
Lower Public Profile: Less brand recognition outside of the dedicated AI community.
Fewer Resources: Does not possess the vast computational power of tech giants.
Ideal for:
Regulated Industries: Finance, healthcare, and legal fields requiring high ethical standards.
Brand-Conscious Organizations: Prioritizing brand safety and predictable AI behavior.
AI Safety Researchers: For academic and practical work on controllable AI systems.
Developers: Claude excels at writing code in numerous languages.
#3: Google (Gemini / Vertex AI)
As a long-standing leader in artificial intelligence research, Google has used its immense resources and extensive talent pool to become a major player in the LLM space. The company's AI efforts are now heavily focused on its Google Vertex AI and Gemini models, a family of multimodal models designed to understand and process information from text, code, images, and video. Google has spent a lot of time integrating its advanced language models into its product lines, such as Gmail, Google Docs, Google Sheets, and so on.
Advantages:
Native Multimodality: Gemini models are built to understand various data types (text, image, video).
Vast Ecosystem Integration: AI is embedded into Google Search, Workspace (Google gSuite), and Cloud.
Massive Infrastructure: Unparalleled computational resources for training massive models.
Pioneering Research: Google DeepMind remains a world leader in AI breakthroughs.
Disadvantages:
Complex Products: The wide array of AI services on the Google Cloud Platform can be overwhelming to navigate.
Image Issues: Google changes product names too often, remember Bard?
Privacy: There are big question marks over Google's privacy; literally every AI interaction is logged and analysed by default.
Poor at Imaging: Google's AI ability to draw images and artwork is significantly behind its competitors.
Ideal for:
Google Cloud Customers: Enterprises that are already heavily invested in the Google Cloud platform and Google Workspace products.
Multimodal Developers: Those creating applications that concentrate on processing text, images, and video.
Data Science: Google Cloud delivers a flexible, open, and scalable AI infrastructure that simplifies the training of data-intensive models on optimized hardware and managed services.
#4: Meta AI (LLama)
Meta AI, the artificial intelligence research lab of Meta Platforms, has taken the approach to open-source LLM development. Llama is a series of open models that have been made available to the research and commercial communities. This approach has helped popularize do-it-yourself AI solutions.
Advantages:
Open Source: Freely releases powerful models in open source, allowing anyone to download and experiment.
Developer Focused: A large, active community that contributes and builds upon Llama 3.
Great Customization: Open access allows for fine-tuning on proprietary data.
Competitive Performance: Llama models often rival the large-scale AI models' capability of closed-source alternatives.
Disadvantages:
Limited Official Support: Relies more on community support than dedicated enterprise services.
Risk of Misuse: The open availability of models creates a significant potential risk for bias.
High Self-Hosting Costs: Requires significant computational resources to run and fine-tune.
Ideal for:
AI Researchers & Academics: Requiring open-source access for experimentation.
Tech-Savvy Startups: For building highly customized and proprietary AI solutions.
Application Developers: Fine-tuning models for specialized industry tasks.
#5: xAI (Grok)
Founded by Elon Musk, xAI is one of the newer LLM models, but one that has quickly gained media attention. The company's stated mission is to 'understand the true nature of the universe.' Its primary product, Grok, is a conversational AI, designed to be witty, rebellious, and have access to real-time information through its integration with the X (formerly Twitter) platform. xAI aims to create AI that is not only intelligent but also engaging and less constrained by what it perceives as the "politically correct" norms of other AI systems.
Advantages:
Real-Time Integration: Access to live information from Twitter.
Distinctive AI Personality: Offers a witty and less conventional tone than competitors.
Direct Approach: Aims to provide more direct answers with fewer content restrictions.
Ambitious Vision: Backed by Elon Musk's high profile.
Disadvantages:
Higher Risk of Inaccuracy: Real-time data can include misinformation and unverified claims.
Niche User Base: The unique personality may not be suitable for professional or formal use cases.
New and Unproven: Still establishing its track record compared to veteran AI labs.
Public Image: Elon Musk's high profile is seen as a problem in some circles.
Ideal for:
Heavy X Platform Users: Seeking a seamlessly integrated and context-aware AI.
Alternative AI Seekers: Looking for less filtered, unconventional AI responses.
Real-Time Applications: For use cases that depend on up-to-the-minute news and trends.
What Is the Purpose of an LLM?
The AI revolution is already here, with businesses adopting these new technologies at a breakneck pace. 83% of companies state that using AI is a top priority. There are currently about 44 LLMs available (as of June 2025), with more being added almost daily.
You can do almost anything with a modern LLM, from writing a book to generating complex code. The only real limit is your imagination. This has fueled a competitive AI industry where top LLM development companies continuously push the boundaries of what an LLM can do, integrating various AI-powered features.
Here are some of the creative ways you can engage with an LLM.
Generative AI: Content Creation
Use generative language models to create articles, emails, and marketing copy for e-commerce.
Generate human language to compose creative works such as poems, scripts, or song lyrics.
Brainstorm ideas and create outlines for projects or essays.
AI Tools for Analysis
Perform natural language processing tasks like summarizing lengthy research whitepapers.
Apply natural language understanding to answer questions from text.
Extract key information like names, dates, and topics from text.
Explain complex subjects in simple, easy-to-understand language.
AI Systems for Language & Text
Translate content between two or more languages.
Rewrite text to change its style or tone (e.g., formal to informal).
Correct grammar and spelling errors in your writing.
AI Assistant Interactive AI
Build a smart chatbot or voice assistant with a system of conversational controls built in.
Use reasoning models to solve logic puzzles and mathematical problems.
Software Development
Write code and debug your applications.
Convert natural language input into structured data like JSON or tables.
Multimodal Interaction
Use advanced AI models to describe the contents of an image or answer questions about it.
The Future of LLM Companies
The AI landscape is shifting from a focus on monolithic, general-purpose models to more refined and efficient technology. The new LLM generation is about specialization, with a growing demand for smaller, customizable, and often open-source models that businesses can fine-tune for specific tasks without incurring massive computational costs.
A key technical advancement driving this change is the Mixture of Experts (MoE) architecture. Instead of a single, giant neural network processing every task, an MoE model is composed of numerous smaller, specialized "expert" networks. When a query is received, a routing mechanism intelligently directs the task to only the most relevant experts. This innovative approach means only a fraction of the model's parameters are used at any given time, dramatically increasing efficiency, reducing latency, and lowering the cost of inference.
This architectural change is accelerating the push toward multimodal models that can process text, images, and audio, as different experts can be trained to handle different types of data. Major players like Google and Microsoft are investing billions in these sophisticated AI solutions, focusing on real-world applications and deep-system integration. Features like integrated dialog management and sophisticated conversational flow builders are becoming standard, all made more feasible by the efficiency gains from architectures like MoE.
The future is certainly exciting. Innovations like Mixture of Experts are not just incremental improvements; they represent a fundamental change in how powerful AI is built and deployed. It's incredible to imagine what the technology will be like in 10 years as these new models mature.
Conclusion
The AI scene is a vibrant, competitive, and complex ecosystem dominated by a handful of companies, each with a distinct vision for the future. From OpenAI’s mass-market dominance and Google’s deep integration into our digital lives. With Anthropic’s principled stance on ethical AI, Meta’s championing of open-source language models, and xAI’s push for real-time, unfiltered information, the choice of LLM has never been greater.
LLM technology is split between closed, proprietary models and open, community-driven development. This isn't just a technical difference between LLM businesses; it’s a fundamental disagreement about how these similar large language models should be built, controlled, and deployed. This means making a decision to adopt an AI solution whose approach to safety, transparency, and innovation matches your own company's values and long-term goals.
We are already seeing LLMs reshaping business operations across every industry, creating a new wave of AI-driven services that enhance productivity and unlock creative potential. The continuous cycle of AI research and development means that what is considered state-of-the-art technology today will likely be surpassed within 12 months.
We can expect to see even more state-of-the-art models emerge in the near future, with capabilities that blur the lines between text, image, and code generation, making current LLM systems rudimentary by comparison.
Whichever LLM company you decide to back, fine-tuning and deploying advanced LLM systems demands immense computational power that standard servers simply cannot provide. This is where high-performance infrastructure becomes critical.
To build, train, and scale your own generative AI applications, you need access to enterprise-grade hardware. Atlantic.Net provides exactly that, with powerful NVIDIA GPU hosting designed for the most demanding AI workloads. By giving you the raw power and flexible infrastructure you need, you can move beyond the limitations of closed systems and start building the future of your business.
Ready to build your AI solution? Explore Atlantic.Net's GPU hosting and deploy your own powerful AI model today!
### Top AI Tools for Developers in 2025
What Is an AI Development Tool?
An AI Development Tool is a software application or platform that helps people create, test, and deploy artificial intelligence (AI) and machine learning (ML) models and applications. Coding is one subset of AI tools that is gaining significant traction, but AI tools can be much more, including:
Used to write and manage code generation (AI Writing assistant).
Prepare and process data for analysis.
Build or train AI models.
Test and evaluate trained models.
Automate tasks to aid project management.
AI Dev Tools cover the broad scope of the development lifecycle, and there are tools suitable for every type of developer. There are even no-code platform options emerging, making AI more accessible to a wider range of users.
Should I Use Paid or Free AI Tools?
With so many AI tools out there, listing them all would be impossible. Many are free or open source, but the majority of the leading AI tools feature stripped-down free versions (free tier or free plan) but rely on a paid premium model for growth.
Paying for AI tools is becoming increasingly more common simply because of the huge costs involved in developing and marketing AI applications. However, even a free tier can provide significant access to core functionalities, allowing users to test before committing.
Top AI Development Tools
Here’s our deep dive into some of the standout tools shaping the AI landscape in 2025. These tools represent a new wave of AI assistance designed to enhance productivity and unlock new creative and analytical potential.
#1: Cursor
About Cursor:
Cursor is an AI-first code editor, built around integrating AI into the development workflow. It's not just VS Code with an AI plugin; it’s a completely redesigned IDE where the AI assistant is built-in.
Cursor allows developers to chat with their codebase, generate code from prompts, debug, and refactor complex sections using an AI agent. Cursor's goal is to act as an intelligent partner that understands the entire context of your project, from individual files to the overall architecture.
Advantages:
Codebase Understanding: Can reference your entire project to provide context-aware AI assistance, unlike tools that only see the flat files.
Intuitive AI Chat: Allows for natural language commands to edit, generate, and debug code, making it feel like pair programming with an advanced AI agent.
Error Resolution: Can often automatically identify and suggest fixes for bugs, speeding up the debugging process.
Refactoring: Simplifies large-scale code changes by understanding intent.
Migration: Helps in migrating codebases or adopting new technologies. For example, migrating a Python script to TypeScript.
Disadvantages:
Learning Curve: While intuitive, leveraging its full power requires adjusting your workflow and thinking about coding problems differently.
Resource Intensive: Cursor is resource-intensive.
Dependency on AI Models: The quality of suggestions is tied to the underlying LLMs (e.g., GPT-4, Claude), and occasional manual adjustments are still necessary.
Target Audience:
Software Developers: Suitable for anyone who writes code.
Complex Projects: Cursor can scope an entire project (or repo), making it ideal for intricate codebases.
Tight Deadlines: Those looking to fast-track productivity and save time.
Early Adopters: Developers are grateful for the help that Cursor brings to the table in their day jobs.
#2: GitHub Copilot
About GitHub Copilot:
Developed by GitHub and OpenAI, Copilot is a well-known AI tool. Launched initially in 2021, it integrates directly into popular IDEs like Visual Studio Code, Neovim, and JetBrains IDEs.
Copilot uses the OpenAI Codex to suggest code and entire functions in real-time, right in your editor. It provides code suggestions and tab completions as you type, acting like an autocomplete that understands syntax and semantics.
Advantages:
Seamless IDE Integration: Works within the environments that many developers already use.
Speed & Efficiency: Significantly speeds up writing boilerplate and repetitive code.
Broad Language Support: Supports the vast majority of programming languages and frameworks.
Learning Tool: Can help developers discover new ways to write code or use unfamiliar libraries.
Contextual: Analyzes open files to provide more relevant content and code snippets.
Disadvantages:
Quality Varies: While often helpful, suggestions can sometimes be suboptimal, insecure, or subtly incorrect, requiring careful review.
"Black Box" Nature: Developers might not always understand why a certain suggestion is made.
Potential for Over-Reliance: Newer developers might become too dependent, potentially slowing down their fundamental learning curve.
Privacy Concerns: Though policies exist, the idea of code being sent for analysis raises concerns for some projects or companies.
May not fully grasp the "bigger picture" or intricate business logic for very specific tasks without detailed prompting.
Target Audience:
Individual Developers: Programmers working on personal or professional projects.
Open-Source Contributors: Those contributing to projects on GitHub or other platforms.
Development Teams of All Sizes: From small startups to large corporations using supported IDEs.
Boilerplate-Weary Programmers: Anyone looking to accelerate common coding tasks and reduce time on repetitive code.
Prototypers: Users aiming to quickly build initial versions of web applications or test new AI features.
#3: RunwayML
About RunwayML:
RunwayML, founded in 2018, has positioned itself as a leading no-code platform for artists, designers, and creators looking to use AI without writing code.
Runway provides a suite of "AI Magic Tools" that cover a wide array of creative tasks, from video generation (text-to-video, video-to-video) and image generators (allowing users to generate images from text prompts) to 3D texture creation and music generation.
Runway provides a web-based interface to complex AI models, enabling users to experiment and create images and high-quality visuals with ease, often using pre-built templates or styles to get started. It's a great tool for content creation!
Advantages:
User-Friendly Interface: Designed for creatives, not just AI experts.
Wide Range of Creative Tools: A comprehensive suite for video, image, and audio file manipulation and generation.
No-Code/Low-Code: You don't need to be a programmer to get started.
Rapid Prototyping: Excellent for quickly visualizing content ideas and generating high-quality content for social media posts. Social media management assets can be scheduled through platforms like Vista Social.
Community and Learning: Offers tutorials and a community for users to learn and create shareable clips.
Disadvantages:
Output Control: Achieving specific results sometimes requires many attempts, and it can still fall short of specific artistic visions.
Computational Costs: Generating high-resolution videos consumes credits quickly.
"AI Look": Generated content can have a 'recognizable' AI aesthetic.
Target Audience:
Artists & Designers: Creatives looking for new mediums and tools for expression.
Filmmakers & Video Editors: Professionals and hobbyists needing video generation and editing tools.
Content Creators: Those focused on generating engaging content for various platforms.
Marketers: Those needing high-quality visuals and social media posts to promote products or services.
Small Businesses: Companies aiming to produce professional-looking creative assets and social media content without a large dedicated team or significant AI software investment.
Hobbyists & Experimenters: Anyone curious about creative AI and looking for a no-code platform to explore image generation, like DALL-E outputs, but with broader creative tools.
#4: Perplexity AI
About Perplexity AI:
Founded in 2022, Perplexity AI aims to be an "answer engine" rather than just a traditional search engine. It provides direct answers to user queries by synthesizing information from various web sources and citing them, offering a conversational approach to information retrieval.
Its purpose is to provide accurate, well-sourced answers, making it a powerful tool for research, learning, and knowledge management. It excels at understanding context and can summarize data effectively.
Advantages:
Direct Answers with Citations: Saves time by providing summarized answers and linking directly to sources, ensuring transparency.
Conversational Interface: Allows for follow-up questions and a more natural interaction, making the search process more intuitive.
Reduced Information Overload: Helps cut through the noise of endless search results by delivering concise, relevant content.
Focus Modes: Offers different modes (e.g., Academic, Writing) to tailor search results and AI assistance.
Good for Research: Excellent for finding and synthesizing information for reports, articles, or learning new topics.
Disadvantages:
Inaccuracies/Hallucinations: Like all LLM-based tools, it can sometimes misunderstand queries or synthesize information incorrectly, despite citations.
Depth of Information: While great for summaries, a deep dive into highly specialized topics might still require consulting sources directly.
Bias in Sources: The AI's output can be influenced by biases present in its training data and the web sources it consults.
New to Market: Still building its user base is up against search engine giants like Google.
Target Audience:
Students & Academics: For research, learning, and quickly understanding complex topics.
Researchers: Professionals needing to find, synthesize, and cite information efficiently.
Writers & Journalists: For gathering background information, fact-checking, and generating content ideas.
Professionals Seeking Quick Answers: Anyone in a business setting needing accurate information without sifting through traditional search engines.
Avoid Information Overload: Those looking for a tool to provide relevant content and summarize data effectively.
#5: Scale AI
About Scale AI:
Founded in 2016, Scale AI has become a critical player in AI development by focusing on the challenging task of providing high-quality training data. They recognized early that even the best AI models are useless without vast amounts of accurately labeled data.
Scale AI provides data annotation, curation, and validation services, essentially creating the "fuel" for machine learning models. Scale was created to deliver reliable data infrastructure and human-powered data labeling at scale, enabling companies to build and deploy AI software and AI-powered features backed by accurate data.
Advantages:
High-Quality Data Annotation: Known for providing accurate and consistent data labeling across various data types (images, text, audio, Lidar).
Scalability: Can handle massive datasets required for large-scale AI projects.
Tooling and Platform: Offers a sophisticated, unified platform for managing data annotation projects and workforces.
Focus on RLHF and Safety: Increasingly involved in Reinforcement Learning from Human Feedback (RLHF) and model safety, critical for advanced LLMs and AI agents.
Helps ensure high-quality output from AI models by improving the data they are trained on.
Disadvantages:
Cost: High-quality, large-scale data annotation can be expensive, potentially a barrier for smaller startups or individual researchers.
Complexity: Managing large data projects, even with Scale AI's platform, is complex.
Human Element: Relies on a distributed workforce for annotation, which, while managed for quality, can introduce variability or require clear instructions.
Vendor Lock-in: Deep integration with their platform could make switching to other tools or in-house solutions more challenging.
Target Audience:
Enterprises Developing AI: Large companies that require accurate data sources.
Well-Funded AI Startups: New ventures focused on AI, especially in computer vision, NLP, and autonomous systems.
Machine Learning Engineers & Data Scientists: Teams that need large volumes of meticulously labeled data for training and validation.
Companies prioritizing AI model safety and high-quality output.
AI in 2025: Revolutionizing Software Development and Content Creation
In 2025, AI innovation is reshaping industries. Intelligent code editors like Cursor, GitHub Copilot, creative suites such as RunwayML, information synthesizers like Perplexity AI, and data quality platforms (Scale AI) are already heavily relied on by companies across the United States.
AI-powered tools are essential for productivity, streamlining workflows and automating tasks from data analysis to content creation for all types of businesses.
However, challenges like learning curves, ensuring brand consistency, and even ethical considerations are important. Critical human thinking remains essential to responsibly improve AI.
Despite these hurdles, AI tools are making important steps forward and growing in popularity. Despite everything that AI can do, remember it's not 100% foolproof, so the human touch is still incredibly important to create accurate and well-thought-out software.
AI certainly has a very bright future for creation and development. Remember, if you need to build and scale your innovative AI applications, Atlantic.Net has a powerful and reliable GPU hosting service available, powered by NVIDIA.
### A Guide to GPU Server Hosting Options in 2025
GPU Hosting Options: Cloud, Bare Metal, and Dedicated Servers
Finding the right GPU hosting solution means understanding several key considerations. You'll want to weigh factors like raw computing power, the ability to scale, the pricing structure, and the specific needs of your AI workloads or deep learning tasks that require a high-performance GPU.
The best GPU providers offer a wide selection of hosting environments.
Cloud GPU Hosting provides access to GPU resources within a provider's shared cloud infrastructure, offering scalability and a pay-as-you-go model. These resources are available in various specifications. Importantly, cloud computing resources can utilize shared GPU resources—either a fraction of a GPU (e.g., using NVIDIA's Multi-Instance GPU technology on supported GPUs), a single GPU, or multiple GPUs (often interconnected with technologies like NVIDIA NVLink for enhanced performance).
Dedicated GPU Hosting is where the client has dedicated access to an individual host, they get all the CPU, memory and storage allocated to the host. It's exclusive for you! No one else uses it, that includes any dedicated GPU cards attached to the server. Importantly, dedicated servers can also integrate with the hosting providers cloud platform and can be consumed on demand.
Bare Metal GPU Hosting is where you own or lease the bare metal server. These servers are typically abstracted away from the cloud platform and configured within a colocation data center, or sometimes integrated with a client's private cloud. They are usually very powerful servers with one or more GPUs.
The type of GPU-optimized frameworks you need, such as TensorFlow, PyTorch, or CUDA libraries, depends on your circumstances. However, it's critical to choose reliable, security-focused GPU infrastructure to get you started. We have been looking at some leading cloud GPU providers and specialists in cloud, dedicated servers, and bare metal GPU offerings.
Here is how we rank them specifically for strong GPU hosting options:
#1: Atlantic.Net
Introduction:
With roots going back to 1994, Atlantic.Net has evolved into a versatile provider of cloud services. Their offerings include dedicated GPU server hosting and cloud GPU instances specifically engineered for high-performance computing (HPC) and demanding machine learning tasks. Clients can access a curated range of NVIDIA GPUs, such as the powerful NVIDIA L40S and the dual-GPU NVIDIA H100 NVL, distributed across their international data center footprint.
Advantages:
Access to specialized NVIDIA hardware, including the L40S and H100 NVL, meets the needs of advanced AI modeling and diverse high-performance workloads.
Clients can choose between dedicated GPU servers, offering maximum control and resource isolation, or scalable cloud-based "GPU as a Service" (GaaS) options designed to optimize upfront investment.
A significant emphasis on security is demonstrated by their SSAE 18 SOC 2 & SOC 3 certifications and readiness for HIPAA/HITECH audits, which is particularly beneficial for organizations handling sensitive data.
The assurance of a 100% uptime Service Level Agreement (SLA) is complemented by 24/7 technical support headquartered in the United States.
Operations are supported by a global network of data centers in the US, Canada, the UK, and Singapore, providing geographical diversity.
Ideal for:
Organizations in specialized fields like AI/ML engineering, biotechnology, and healthcare that process sensitive data and therefore require services adhering to HIPAA compliance standards.
Users whose projects demand substantial, uninterrupted computational power from dedicated GPU servers for intensive tasks such as deep learning model training, complex graphics rendering, or large-scale scientific simulations.
Businesses that prioritize a provider's extensive operational history, a demonstrable commitment to security, and readily available, U.S.-based customer support.
Clients seeking cost-effective solutions for long-term GPU hardware rentals, especially when the hyper-scalability of larger cloud platforms isn't the primary driver, will find Atlantic.Net's pricing models attractive.
#2: Amazon Web Services (AWS)
Introduction:
As a dominant hyper-scale cloud provider, AWS delivers a vast portfolio of IT services. This includes an extensive and frequently updated selection of GPU instances, such as the P-series optimized for high-throughput compute tasks and the G-series for graphics-intensive applications. AWS supports a wide spectrum of demanding workloads, from sophisticated machine learning model training to high-resolution video rendering, leveraging its massive global infrastructure.
Advantages:
An unparalleled selection of NVIDIA GPU models and instance sizes allows users to precisely tailor resources to diverse performance and budgetary requirements.
The platform's inherent design allows for dynamic scaling of GPU resources, enabling businesses to efficiently adjust to fluctuating workload demands and optimize spend.
Seamless integration with AWS's comprehensive ecosystem of services—spanning storage, networking, databases, and AI/ML tools—can significantly streamline application development and deployment.
A worldwide network of data centers ensures low-latency access for a global user base and facilitates disaster recovery planning.
Developers benefit from broad support for various GPU-optimized frameworks and libraries, accelerating the development of AI models and other GPU-accelerated applications.
Disadvantages:
AWS's intricate pricing structure can be challenging, sometimes leading to higher-than-anticipated costs, particularly for sustained high-usage scenarios if not carefully managed.
Data egress fees are an important budgetary consideration and can accumulate significantly depending on data transfer patterns.
While powerful, the sheer breadth of service options and configurations can present a steep learning curve for users new to the AWS ecosystem
Ideal for:
Large enterprises and rapidly growing startups that need highly scalable GPU instances for developing and deploying machine learning models, deep learning algorithms, and complex high-performance computing simulations.
Development teams looking to leverage a rich, deeply integrated ecosystem of cloud services to build sophisticated, multi-component applications.
Organizations with a global operational footprint that require robust, geographically distributed GPU infrastructure to serve their AI workloads with high availability and low latency.
Users whose workflows involve performing complex big data analytics in concert with their GPU-accelerated computational tasks.
#3: Google Cloud Platform (GCP)
Introduction:
GCP is another leading global cloud GPU provider, known for its strong capabilities in data analytics, machine learning, and natural language processing. They offer a variety of GPU instances equipped with powerful NVIDIA GPUs, designed for high computational power.
Advantages:
GCP excels in AI model training and deep learning, offering direct pathways to Google's cutting-edge AI research, tools like TensorFlow and Vertex AI, and alternative accelerator options like Google's own Tensor Processing Units (TPUs).
For certain NVIDIA GPU models, GCP presents a competitive pricing structure, which includes the flexibility of per-second billing, allowing for granular cost control.
A high-capacity, private global network underpins GCP's services, contributing to consistent performance and low-latency data transfer worldwide.
Beyond virtualized instances, GCP also makes bare metal options available for specific high-performance scenarios, granting direct, unmediated access to underlying GPU hardware.
Robust support for containers and Kubernetes (via Google Kubernetes Engine - GKE) simplifies the orchestration and scaling of distributed GPU workloads.
Disadvantages:
The range of GPU hardware options, while good, might sometimes be less extensive than other cloud providers in specific regions.
Some services have a steeper learning curve and require expert knowledge of existing GCP services.
It can be costly if resources are not managed carefully.
Ideal for:
Data scientists and researchers focused on machine learning and AI models.
Organizations that are already invested in the Google Cloud Platform, often those looking for big data processing and analytics.
Users requiring cutting-edge NVIDIA GPU technology for training large language models or natural language processing.
Businesses looking for flexible GPU server hosting that scales with their AI workloads.
#4: Microsoft Azure
Introduction:
Microsoft Azure provides a comprehensive suite of cloud services, including N-series Virtual Machines, which are GPU instances designed for compute-intensive and graphics-intensive applications. Azure supports a wide range of GPU resources suitable for AI/ML, video editing tasks, and scientific computing.
Advantages:
Exceptional integration with the broader Microsoft ecosystem, including Windows Server, Microsoft Entra ID (formerly Azure AD), and Azure's wide array of platform services, benefits enterprises already utilizing Microsoft technologies.
Azure provides a diverse selection of NVIDIA GPU options, catering to visualization workloads (NV-series), AI/HPC (ND-series, NC-series), and general-purpose GPU compute.
The platform offers a spectrum of GPU-accelerated VMs, some of which deliver performance characteristics approaching that of dedicated servers, alongside more traditional cloud GPU elasticity.
Strong support for hybrid cloud scenarios, enabling organizations to consistently manage and deploy GPU workloads across on-premises environments and Azure.
Microsoft continues to expand its focus on AI workloads, providing dedicated platforms like Azure Machine Learning and tools that streamline the AI development lifecycle on its GPU infrastructure.
Disadvantages:
The Azure portal and service options can sometimes be complex to navigate.
Costs can escalate if not carefully monitored, similar to other major cloud providers.
Some of the newest GPU models might have limited regional availability initially and an extensive wait list.
Ideal for:
Enterprises that are already invested in the Microsoft platform (Windows Server, Entra ID, or Azure Platform Services).
Users who need GPU hosting options for professional graphics applications, video encoding, and complex engineering simulations.
Organizations working on AI model training and inferencing that can benefit from Azure's AI platform.
Researchers needing computing power for scientific research and simulations.
#5: CoreWeave
Introduction:
CoreWeave has carved out a niche as a specialized cloud GPU provider, purpose-built from the ground up for extremely large-scale AI workloads, demanding deep learning tasks, high-fidelity visual effects (VFX) rendering, and other compute-heavy processing pipelines. They distinguish themselves by offering broad access to a diverse range of NVIDIA GPUs, often including the very latest generations, with a strong emphasis on high-performance bare metal and Kubernetes-native environments.
Advantages:
Access to a vast inventory of cutting-edge NVIDIA GPU models, often available sooner than larger, generalized clouds.
Potentially significant cost savings (reportedly 30-80% less expensive) for GPU compute compared to traditional hyperscalers.
Highly scalable infrastructure designed for massive AI model training and inference.
Kubernetes-native platform, streamlining deployment and management for teams familiar with container orchestration.
Offers flexible storage and high-performance networking optimized for GPU clusters.
Disadvantages:
Does not offer the broad selection of general cloud services found in Atlantic.Net, AWS, GCP, or Azure; primarily focused on GPU compute.
May require more DevOps expertise for setup and management if not leveraging their managed services, as it can be less of a turnkey solution for those unfamiliar with Kubernetes.
Heavy reliance on NVIDIA for its GPU hardware could be a long-term strategic consideration.
Ideal for:
AI research labs, machine learning engineers, and VFX studios requiring access to large quantities of the latest NVIDIA GPUs at scale.
Organizations focused on training deep learning models, large language models (LLMs), or running complex scientific simulations that can benefit from bare metal performance.
Users looking for potentially more cost-effective pricing on high-performance GPU hosting for power-hungry applications and comfortable with a specialized cloud environment.
Teams that are adept with Kubernetes and looking for a GPU infrastructure that integrates well with it.
Why Traditional CPUs Can't Always Keep Up:
CPUs are not necessarily a problem; in fact, they are still essential for GPU hosting. What we mean is that there is a much better, more efficient way to develop AI/ML applications, handle large-scale rendering, or image analysis.
So what's wrong with CPUs?
Sequential Processing: CPUs excel at a wide range of general-purpose tasks and can handle serial operations or a limited number of parallel threads efficiently. However, for tasks requiring massive parallelism (like those in AI/ML), they process operations more sequentially per core compared to GPUs.
Limited Cores for Parallel Tasks: While multi-core, the CPU cannot match GPUs for massively parallel jobs. GPUs are simply better at doing millions of simple tasks simultaneously.
Bottlenecks for Intensive Data: Large-scale data analytics and complex calculations can overwhelm CPUs, resulting in applications that lag significantly.
Cloud GPUs
What makes the GPU so good at handling AI/ML applications? It's down to the simple reason that the GPU can do many more tasks simultaneously, and perform much quicker.
GPU servers are great at:
Training complex deep learning models
Performing big data analytics at speed
Powering intricate graphics rendering, online gaming, and completing video editing tasks efficiently
Driving high-performance computing tasks and complex engineering simulations
Choosing the right GPU hosting provider can help to improve your business goals and objectives almost immediately. This guide will uncover the various GPU hosting options that are available, helping you find the perfect match for your resource-hungry applications.
Final Pointers for Picking a Cloud GPU Provider
GPU hosting has introduced superior performance, breakneck processing power and the very latest technology to global businesses en masse. If you’re feeling like your computing tasks are stuck in the slow lane, it may be time to level up to a GPU platform.
For today's most data-intensive applications, standard hosting options may not be powerful enough. This is because standard central processing unit (CPU)-based servers often just don't cut it for modern AI workloads.
Despite being very powerful, there are better options available with graphics processing units (GPUs) that introduce incredible parallel processing capabilities, allowing users to get the best performance from one or more GPUs.
Selecting the right GPU hosting provider from the many GPU hosting options is a big decision. To make sure you get the best fit, keep these key factors in mind:
The Right GPU Hardware: Do you need specific NVIDIA GPU models (e.g., for AI model training vs. graphics rendering)?
Scale of Your Workloads: How much computing power do your resource-heavy processes really need? Will you need to scale up or down, or in and out?
Your Budget: What pricing structure works best? Compare on-demand cloud GPUs with longer-term dedicated servers. Does the provider offer discounts for 1, 2, or 3-year commitments?
Control vs. Convenience: Do you prefer the full control of bare metal solutions or the managed environment of cloud GPU instances?
Supported Frameworks: Does the provider easily support the GPU-optimized frameworks critical for your AI/ML or deep learning tasks?
Whether you lean towards flexible cloud GPU instances, the raw power of dedicated GPU servers, or the direct control of bare metal solutions, the ideal hosting provider should have GPU hosting options with the computing resources needed.
GPU hosting enables your business to tackle any compute-intensive application, from cutting-edge AI/ML and deep learning projects to high-performance computing and smooth video editing tasks efficiently. Take the time to evaluate each GPU server hosting option, and you'll unlock the performance your projects deserve, enabling businesses and researchers to push new boundaries while achieving unparalleled performance.
### Top 14 HIPAA Software Developers in 2025
A vast array of software is required to run an efficient and successful healthcare organization, and all software developed for this purpose must be fully HIPAA-compliant and hosted on HIPAA-compliant infrastructure. HIPAA regulation applies to all healthcare websites or software applications, and developers have to meet the mandatory requirements of HIPAA, paying particular attention to how PHI is accessed, and what data must be fully encrypted. This will ensure that all protected health information (PHI) is safely stored and accessed by an application.
Why Do You Need Help from a HIPAA-compliant Software Developer?
Because developers must adhere to strict regulations, the development of HIPAA-compliant software is a complex and time-consuming process. Choosing a leading software company to develop HIPAA-compliant solutions is essential to meet the growing technical needs of your healthcare organization. You should research your options carefully and be sure to work with a software development company that has extensive experience in constructing HIPAA-compliant software solutions.
To help you choose a trusted and experienced partner, we have collated a list of the top 14 HIPAA-compliant software developers. These are development houses that meet and exceed the physical, technical and administrative safeguards of HIPAA. In compiling our list, we have considered each company’s experience in providing solutions to healthcare providers, reviews from previous clients, and their market presence.
1. Arkenea
Arkenea, ranked among the top preferred healthcare software development companies, provides healthcare organizations with robust and scalable HIPAA-compliant mobile and web applications. Arkenea is the only software development company that is fully dedicated to the healthcare industry. The company has over 9 years of experience providing clients with software solutions that adhere to HIPAA and HITRUST regulations.
2. Mobisoft Infotech
Mobisoft Infotech is a leading software development company specializing in delivering HIPAA-compliant healthcare solutions to organizations worldwide. With over 13 years of experience in developing innovative mobile and web applications, Mobisoft Infotech offers end-to-end services from custom software development to integration, testing, and maintenance. The company is committed to creating secure, scalable, and compliant solutions that meet the highest standards of the healthcare industry, ensuring full adherence to HIPAA and HITRUST regulations. Trusted by top-tier healthcare providers, Mobisoft Infotech empowers organizations with digital solutions that enhance patient care, streamline operations, and drive healthcare innovation.
3. Novelty Technologies
Our friends at Novelty Technologies provide end-to-end software solutions for many clients, including high-profile healthcare organizations. Novelty Technologies caters to the entire development lifecycle, from web/mobile app creation and UI/UX design to data analytics and API integration. Novelty has vast experience working with HIPAA compliant hosting partners, and security underpins their entire design process.
4. ZDI
ZDI is a leading digital marketing company and a proud partner of Atlantic.Net. ZDI has strong ties with HIPAA compliant organizations and provides a number of services to healthcare clients, including website and mobile app design, brand creation, and content creation. ZDI won the GDUSA Health + Wellness Design award in 2017 and has created some excellent web applications for our clients.
5. Let's Talk Interactive
Let’s Talk Interactive has been doing amazing things for our friends in healthcare before, during, and after the Covid-19 pandemic. Telemedicine has become the first choice for frontline healthcare workers, and Let’s Talk provides HIPAA-compliant teleconferencing services as well as industry-leading virtual and walk-in clinic software, empowering healthcare professionals to conduct vital assessments of patients remotely over the phone or via video chat.
6. MobiDev
MobiDev is a custom software development company awarded as Best Upwork Software Development Agency 2016-2019. Having comprehensive experience of more than 10 years, MobiDev provides HIPAA-compliant mobile and web solutions integrated with the latest innovative technologies: Artificial Intelligence, Machine Learning, The Internet of Things, and Augmented Reality.
7. VAIRIX Software Development
VAIRIX Software Development is a nearshore software development company with extensive experience building HIPAA-compliant health and wellness apps. From virtual consultation and e-prescriptions to mental health counseling and support group functionalities, their team of experts craft products that help your users seamlessly manage their medical needs. Based out of Montevideo, Uruguay (UTC-3), VAIRIX provides staff augmentation and end-to-end development services to clients across the United States.
8. Inoxoft
Inoxoft is a certified custom healthcare software development company. It offers custom healthcare solutions done by high-skilled professionals with considerable domain expertise. They’ve delivered top-notch medical software for a range of medical service institutions. Their clients are hospitals as well as healthcare startups whom They offer custom medical software development services. They’ll empower you with new ideas on how to leverage medical care. Building custom healthcare solutions Inoxoft engineers work with up-to-date technologies such as Python, .Net, Node.js, ReactJS, Flutter, and React Native.
9. Archer Software
Archer Software is an innovative technology consulting and custom software development company that helps startups and enterprises digitize the healthcare domain. Established in 2000, Archer Software builds HIPAA compliant healthcare solutions and wellness apps, having designed, built, and supported more than 650 B2B, B2C, and B2G products for 400+ clients. They help their global high-tech clients deliver life-changing solutions providing technology consulting, product design, and digital solutions development as well as agile transformation.
10. Technology Rivers
Technology Rivers is a Virginia based custom software development firm, that specializes in HIPAA compliant web and mobile app development. Technology Rivers work with healthcare entrepreneurs, startups, and health-tech organizations and help them in creating innovative healthcare solutions. Their work includes native and cross-platform hybrid mobile apps, web applications, desktop applications, and integrations with EMR & EHR such as EPIC.
11. Belitsoft
Belitsoft has been delivering technology solutions and services for the healthcare industry since 2015. The company focuses on long-term partnerships with its clients from the United States, the UK, Europe, and Israel. Belitsoft's clients include healthcare startups, medical ISVS, hospitals, healthcare centers, private medical practices, pharmacy organizations, medical and research laboratories. Belitsoft engages with third-party security auditors, such as OWASP and TrueSec, to guarantee safety and compliance with health IT standards and regulations.
12. TatvaSoft
TatvaSoft specializes in healthcare software development with over 18 plus years of experience in developing custom software applications. They create HIPAA-compliant web, desktop, and mobile app solutions. They offer a broad spectrum of healthcare solutions such as EHR systems, telemedicine, medical health applications for both patients and healthcare management professionals.
13. ScienceSoft
ScienceSoft is an ISO 13485:2016, ISO 9001:2015, ISO 27001:2013 certified IT consulting and software development company with 16 years of healthcare IT experience, headquartered in McKinney, Texas, US, with offices in Europe and the Middle East. Experienced in HIPAA-compliant software development, ScienceSoft delivers software to leading healthcare organizations.
14. IT Craft
IT Craft is a leader within the software development industry, having recently been recognized as the “Top Web Developers, 2020” by Clutch, an independent research company based in Washington D.C. What sets IT Craft apart is its commitment to support clients through the completion of their project and beyond, providing all of its partners with high-quality post-launch support. This custom medical software provider delivers the development of new healthcare-related mobile and web applications, as well as the improvement and performance optimization of existing applications.
How Can Atlantic.Net Help?
The rapidly evolving field of healthcare technology can be a minefield for many healthcare professionals looking for compliant software solutions. With an ever-increasing workload, medical professionals are embracing new cloud-based platforms to improve the quality and speed of patient care. While technological advances can make life much easier for, already stretched, medical staff, ensuring the safety and security of confidential patient information can bring a new headache.
As a healthcare provider, no matter what software solution you purchase, you must choose a fully HIPAA-compliant hosting platform that will prioritize security, privacy, and compliance to host the application. Atlantic.Net can offer you cloud hosting solutions that are fully scalable and customizable to meet the needs of your organization. Contact our sales team today to find out how Atlantic.Net can help your organization.
This article was updated on May 27, 2025.
### Atlantic.Net Offers One Year of Free Cloud Hosting
Celebrating 31 years in business, Atlantic.Net is now offering new clients an opportunity for one year of free cloud hosting backed by Atlantic.Net’s eight global data centers, providing businesses worldwide with high performance and reliability.
All new customers receive a free cloud platform for a year, which includes 8GB RAM, 2 vCPU, 80 GB SSD storage, and 5TB monthly data transfer.
Our G3 8GB plan is ideal for developers and businesses to deploy larger applications with our free-to-use Cloud Hosting now with more powerful resources.
In addition to the free G3.8 GB server, the free tier also includes 50 GB of Free SSD Block Storage and Snapshots for one full year and comes with all the benefits of the Atlantic.Net Cloud Platform:
Fault-tolerant, ultra-fast performance: Engineered for maximum uptime and speed.
Award-winning Cloud Servers: Backed by a proven track record of excellence.
Secure Block Storage: Safeguard your critical data with robust security measures.
One-Click Applications, DNS, Private Networking, RESTful API: Streamline your workflow and development processes.
Optional Data Backup & Managed Services: Tailor your solution to your needs.
24/7 U.S.-Based Expert Support: Get the help you need whenever needed.
The service includes a 100% uptime service-level agreement, ensuring mission-critical applications stay online. Blazing-fast NVMe storage and high-speed network connectivity boost performance, while a user-friendly control panel simplifies cloud computing for AI users.
Get Started
### Top AI Development Companies in 2025
Below are some of the top AI development companies making a significant impact in 2025; in particular, we'll explore AI development companies that are:
Pioneering advancements and shaping the future of AI technology.
Developing impactful AI models and offering sophisticated AI tools.
Delivering expert AI software development and comprehensive solutions.
Leading progress in key AI domains such as large language models, computer vision, and conversational AI.
Leading AI Development Companies and Their Offerings
The AI market is dynamic, with numerous companies offering specialized AI development services. The following firms are recognized for their contributions to AI software development, their innovative AI models, and their ability to deliver effective AI solutions across various industries.
#1: OpenAI
OpenAI has consistently been a prominent name in AI development, particularly known for its pioneering work with ChatGPT. Their focus on advancing natural language processing and creating versatile AI agents has set industry benchmarks.
OpenAI continues to lead with its Generative Pre-trained Transformer (GPT) series of models. Anticipation is high for GPT-5, while the GPT-4o, o3, and o4-mini models have already made a substantial impact. OpenAI's work centers on conversational AI, NLP, and autonomous decision-making.
Advantages:
Cutting-edge research and development in large language models.
Strong capabilities in natural language understanding and generation.
Versatile models applicable to a wide range of AI applications, including conversational AI and content creation.
Newer models demonstrate enhanced reasoning and the ability to combine various tools effectively.
Active community and extensive documentation for developers.
Disadvantages:
Access to the most advanced models can come at a premium cost.
Ethical considerations and potential for misuse of powerful generative models require careful management.
Some businesses may prefer more custom-tailored solutions than an off-the-shelf model access.
Ideal for:
Organizations looking to integrate state-of-the-art generative AI and natural language processing into their products or workflows.
Developers building innovative AI applications that require sophisticated text generation, summarization, or conversational AI capabilities.
Companies needing powerful AI agents that can perform complex tasks by combining different tools and data sources.
#2 Google (including DeepMind)
Google, through its DeepMind division and Google Cloud AI offerings, remains a dominant force in artificial intelligence. Their contributions span from foundational research to practical AI solutions for businesses and consumers.
Some of Google's key breakthroughs include progress in AI-driven healthcare solutions and self-learning neural networks. DeepMind's AI-powered drug discovery has notably sped up medical research. The Gemini family of models, especially Gemini 2.5 Pro with its large context window of over 1 million tokens, excels in reasoning and managing vast amounts of information.
Advantages:
Extensive research capabilities leading to breakthroughs in machine learning models and AI technology.
Comprehensive suite of AI tools and services through Google Cloud AI, facilitating full-cycle development.
Leader in multimodal AI, combining text, image, audio, and video processing.
Strong focus on data analytics and providing real-time insights.
Commitment to optimizing the AI stack for performance and business value.
Disadvantages:
The breadth of offerings can sometimes be complex to navigate for newcomers.
As with many large tech companies, data privacy and usage can be a concern for some users.
Full utilization of their ecosystem might lead to a degree of platform dependence.
Ideal for:
Businesses of all sizes looking for scalable and powerful AI-powered solutions, particularly those already invested in the Google Cloud or G Suite ecosystems.
Organizations requiring advanced data analysis, predictive analytics, and multimodal AI capabilities.
Companies in sectors like healthcare and research can benefit from Google's specialized AI applications and data science consulting.
#3: NVIDIA
Primarily known for its powerful Graphics Processing Units (GPUs), NVIDIA has successfully established itself as a foundational provider for the AI market, offering the hardware and software infrastructure that powers the majority of AI systems (including those at Atlantic.Net)
NVIDIA is also well known for its enterprise-grade, AI-powered GPUs. The company's AI-driven chips are transforming sectors like gaming, autonomous systems, and cloud computing. NVIDIA's progress in 2025 includes humanoid robotics (Isaac GR00T-Dreams platform), the NVLink Fusion platform, and AI supercomputers.
Advantages:
Industry-leading GPU technology crucial for training and deploying complex deep learning and machine learning models.
Driving innovation in emerging areas like autonomous systems and humanoid robotics.
Strong support for developers with SDKs and tools for various AI projects.
Enables high-performance computing for demanding AI workloads.
NVIDIA AI Technology is way ahead of the competition.
Disadvantages:
The cost of specialized NVIDIA hardware can be substantial, particularly for smaller organizations or individual developers.
Their primary focus is on infrastructure and enablement rather than direct end-user AI software development.
Rapid hardware advancements can lead to quick (expensive) upgrade cycles.
Ideal for:
Companies and researchers requiring high-performance computing capabilities for training large AI models and running complex simulations.
Organizations developing AI applications in graphics-intensive fields, autonomous driving, and robotics.
Data centers and cloud providers offering AI and machine learning platform services.
#4: Microsoft AI
Microsoft has embedded artificial intelligence across the vast majority of its products and services, making AI technology more accessible to businesses and individuals. It delivers its AI services through its Azure AI platform and Windows Operating Systems.
Microsoft has invested heavily in Microsoft 365 Copilot and has a strategic partnership with OpenAI to develop GPT models for Copilot, with a focus on embedding the technology into its Office and Software suites.
Advantages:
Strong integration of AI solutions within widely used enterprise software (Microsoft 365, Dynamics 365, Windows Server).
Comprehensive Azure AI platform offering a wide range of AI development services, from pre-built APIs to custom AI model development.
Strategic partnership with OpenAI provides access to advanced large language models within the Azure ecosystem.
Focus on creating AI agents to automate complex tasks such as writing code.
Emphasis on responsible AI principles and tools to build trustworthy AI systems, many businesses trust them because of their user-friendly privacy policies.
Disadvantages:
Deep integration with the Microsoft ecosystem might lead to vendor lock-in for some businesses.
The sheer number of tools and services on Azure can be overwhelming for new users.
Costs for Azure AI services can escalate with extensive usage if not managed carefully.
Ideal for:
Enterprises already using Microsoft products and looking to enhance their operations with integrated AI capabilities.
Developers seeking a comprehensive cloud platform for building, deploying, and managing AI applications and AI agents.
Businesses aiming to improve productivity and automate business processes through tools like Microsoft Copilot.
#5: IBM Watson
IBM Watson has a long history in the AI market, providing enterprise-grade AI solutions with a focus on data analytics and cybersecurity.
IBM is concentrating on enterprise-grade generative AI, particularly with its Watson X platform, which focuses on integrating AI with dynamic enterprise data. Key announcements at IBM Think 2025 included Watson X Orchestrate for creating autonomous AI agents, no-code options for AI customization, and prebuilt domain agents for HR, sales, and procurement.
Advantages:
Strong focus on enterprise-grade AI solutions for regulated industries.
Watsonx platform allows for building, scaling, and managing AI with an emphasis on data security and regulatory compliance.
Expertise in data science consulting and helping organizations manage their data engineering and data insights.
Emphasis on responsible AI, AI ethics, and explainable AI, which is important for building trust.
Offers tools like Watson X Orchestrate for creating autonomous AI agents and no-code AI customization.
Disadvantages:
Can be perceived as more suited to large enterprises, potentially being less agile or cost-effective for smaller businesses.
Integration with existing legacy systems is complex.
The brand's historical association with traditional IT might not appeal to cloud-native companies.
Ideal for:
Large enterprises, especially in regulated industries like finance, requiring robust, secure, and compliant AI powered solutions.
Businesses looking to leverage AI for business analytics, cybersecurity, and automating business processes with a focus on governance.
Organizations that prioritize explainable AI and need to ensure their AI implementation meets high ethical standards.
#6: Amazon AI (AWS)
Amazon Web Services (AWS) is a major provider of cloud computing services and offers an extensive array of AI and machine learning tools, making it a popular choice for developers and businesses looking to build and scale AI applications.
Amazon SageMaker is a central platform for building, training, and deploying ML models. Recent developments from AWS re:Invent 2024 and early 2025 include Trainium2 and Trainium3 AI chips, the Project Rainier supercomputer (in partnership with Anthropic), the Nova family of AI models, and Amazon Q Developer for automating developer tasks.
Advantages:
Broad and deep set of AI services and tools, catering to various needs from pre-trained models to full machine learning model development with Amazon SageMaker.
Scalable infrastructure capable of handling demanding AI workloads and large datasets.
New AI chips (Trainium), models (Nova family), and developer tools (Amazon Q Developer).
Strong ecosystem and integration with other AWS services, facilitating end-to-end software solutions.
Disadvantages:
The vast number of services and configuration options can be complex, especially for users new to AWS.
Cost management requires careful attention, as expenses can accumulate quickly with extensive use of AI services.
Similar to other large cloud providers, there is a potential for vendor lock-in.
Ideal for:
Developers and businesses of all sizes looking for a flexible and scalable platform to build, train, and deploy AI models and AI applications.
Organizations that require a wide variety of AI tools, from data analysis and machine learning to generative AI and AI assistant development.
Companies already utilizing AWS infrastructure looking to seamlessly integrate AI-powered solutions into their existing cloud environment.
Choosing the Right AI Development Partner
The AI development companies we have listed above represent some of the most influential players in the AI market in 2025. Each offers unique strengths in AI software development, AI consulting (often part of broader consulting services), and the provision of AI tools and platforms designed to meet diverse business needs.
When selecting an AI development partner, carefully consider your specific business objectives, the scale of your AI projects, your existing technology stack, and your budget. To ensure you select a provider that aligns with your business needs and can help you achieve substantial business growth, consider the following:
Look for demonstrated expertise in specific AI technologies like natural language understanding, computer vision, predictive analytics, and potentially advanced generative techniques such as stable diffusion or voice cloning if relevant to your project.
Confirm they have experience and a track record in your specific industry, whether it's e-commerce, optimizing financial operations, or another sector.
Ensure the company demonstrates a strong commitment to responsible AI practices.
Verify the availability of ongoing support and comprehensive software development services.
Choose a partner who stays current by being able to track industry trends to offer the best AI approaches for your specific situation.
Seek a development company that can help you implement effective automation tools, develop sophisticated applications like a virtual assistant, use data science for actionable insights, and navigate the complexities of AI adoption.
Access to powerful computing resources, such as those offered through Atlantic.Net GPU hosting, can be fundamental to training complex AI models and running demanding AI applications created by these top-tier firms.
Partnering with a forward-thinking development services provider, supported by reliable infrastructure, will be instrumental for staying competitive and harnessing the full potential of artificial intelligence. To find out how dedicated GPU hosting can underpin your AI initiatives, reach out to Atlantic.Net.
### The Role of High-Performance Computing in Advancing AI for Climate Solutions
High-performance computing (HPC) and artificial intelligence (AI) are playing increasingly important roles in addressing the complex challenges posed by climate change. The Earth’s climate system is a very complex process and tracking it requires collecting large amounts of detailed data. Managing and analyzing this vast and complex data demands powerful computing and intelligent analytical techniques. This article explores the individual and combined roles of HPC and artificial intelligence in supporting climate solutions.
The Role of HPC in Climate Computing
Weather and climate centers across the globe have long relied on high-performance computing to track, analyze, simulate, and predict weather systems and climate patterns. These tasks require immense computational resources that only specialized HPC systems can provide. The computational requirements for climate solutions are high because Earth's climate system depends on many interacting components including atmosphere, oceans, land, and ice. Each of these components operate on different time scales and physical dimensions, which creates a complex process that requires powerful computing systems to understand.
Traditional climate modeling approaches have been limited by available computing power. Even with powerful supercomputers, scientists have had to make compromises on resolution, complexity, or forecast length. Climate models with higher resolution can capture more detailed processes but require significantly more computing resources. This is where the HPC becomes essential for climate solutions. HPC enables researchers to run complex global models on high resolution data. For example, the Community Earth System Model has millions of lines of code which can only run on an HPC cluster.
The Increasing Role of AI in Climate Solutions
Climate monitoring systems, including satellites, weather stations, and sensors collect terabytes of climate data every day. Traditional methods often struggle to analyze this data due to its huge volume and complexity. This is where AI becomes essential for climate solutions. It can rapidly process huge amounts of data and uncover patterns that might be difficult for humans to detect.
AI is being applied in many areas to support climate solutions. For example, AI algorithms analyze satellite imagery to detect deforestation and melting glaciers. They also use historical data to predict natural disasters like floods and heatwaves. Machine learning models improves weather forecasts by analyzing real-time weather data with high accuracy and speed. Additionally, AI enhances climate models to provide more reliable predictions. Despite forecasting, AI helps to reduce carbon emissions by optimizing energy systems, transportation, and industrial processes.
Recent advances in AI have further enhanced its potential in climate applications. For instance, a collaboration between NASA and IBM Research produced an AI geospatial foundation model trained on Harmonized Landsat and Sentinel-2 data. This publicly available model accurately detects burn scars, maps floodwaters, and classifies crops and land use. The partnership combined NASA’s scientific data and expertise with IBM’s computing power and AI capabilities. Similarly, Google recently introduced the Geospatial Reasoning framework, which integrates its generative AI model Gemini with specialized geospatial models. This framework can answer complex questions about climate data in natural language. For example, when asked about the impact of a recent hurricane on infrastructure, Gemini can analyze satellite images to assess damage, uses weather data to predict ongoing risks, and incorporates demographic information to help prioritize relief efforts.
How HPC Drives AI-Enabled Climate Solutions
As AI’s role in climate solutions increases, the demand for HPC is also growing. HPC systems use thousands of processors working in parallel to solve very large problems. They often include GPUs and other accelerators that speed up machine learning and scientific computations. HPC infrastructure is well-suited for AI-enabled climate solutions due to its following features:
Massive Parallelism: HPC systems run many tasks at the same time across thousands of cores or GPUs. This parallel processing is needed to train deep learning models and run high-resolution climate simulations quickly.
High-Speed Networking and I/O: All parts of an HPC cluster, including the interconnects, memory, and storage, are very fast and designed for high throughput. These systems can move large volumes of climate data (like satellite imagery) without any communication bottlenecks.
Specialized Accelerators: Many HPC centers provide GPUs or other AI accelerators. These chips can perform the types of calculations used in machine learning much more efficiently than standard CPUs. For climate AI workloads, accelerators can dramatically speed up model training and data analysis.
Large Memory and Storage: Climate models and AI data sets can be huge. HPC nodes typically have large amounts of RAM or high-bandwidth memory, and the clusters use parallel file systems to store terabytes of data. This prevents memory bottlenecks when processing global datasets.
Scalability: HPC clusters can scale up by adding more nodes. In the cloud, users can enhance their resources on demand. This scalability is important for climate projects that may suddenly need a lot of compute power (for example, to run an ensemble of forecasts).
Cloud-Based HPC for Accessibility and Cost Efficiency
Cloud-based HPC combines the power of supercomputers with the flexibility of the cloud. In a cloud HPC environment, researchers can employ powerful clusters without owning them. They can scale up or down as needed, and they only pay for the resources they use. This on-demand access makes it possible for smaller universities and startups to develop climate solutions without investing in expensive data centers. For example, Planette’s team uses a mix of Amazon and Google cloud resources to run their climate models and AI algorithms. This multi-cloud approach enables them to scale and optimize costs while having backup options. In practice, cloud HPC makes it easier for diverse teams around the world to collaborate on climate AI projects, because they can share data and compute through the cloud. Some of the key features of cloud-based HPC are as follows:
On-Demand Access and Scalability: Cloud HPC allows users to access supercomputing power as needed and release it when it is no longer required. They can also increase or decrease computing resources on the fly.
Pay-As-You-Go Cost Model: Instead of buying and maintaining expensive hardware, organizations pay for compute time. This model avoids large upfront investments in dedicated HPC machines. It can be much more cost-effective for starting or growing projects.
Flexibility: Cloud platforms offer a variety of hardware (different CPUs, GPUs, etc.) and software environments. Climate researchers can choose the configuration that best fits their workload.
Multi-Cloud Optimization: By using multiple cloud providers (as Planette does), users can improve performance and resilience. It also enables teams to compare costs between vendors and avoid dependency on a single provider.
Challenges and Considerations
Despite the benefits, combining HPC and AI for climate work brings some challenges:
Energy and Sustainability: Both HPC and AI have high energy demand. Training large AI models may run thousands of GPUs for days or weeks which consume vast amounts of power. Modern supercomputers themselves can draw as much power as a small town. This significant energy consumption brings both financial costs and environmental impacts. Researchers must consider energy efficiency and possibly use renewable power or advanced cooling to mitigate this.
Data Complexity: Climate data are not only large in volume but also complex in nature due to multiple variables, time series, and different formats. Managing, storing, and cleaning this data is difficult. HPC systems need robust data pipelines and quality control to handle these challenges.
Skilled Workforce: Running HPC and AI systems requires specialized skills. Scientists need training in parallel programming, machine learning, and data science. A recent report argues that investment in HPC should include “training for people to use them”. In practice, there is often a shortage of experts who can employ AI and HPC for developing climate solutions, so workforce development is a key need.
Final Thoughts
High-performance computing and AI have become key technologies in developing modern day climate solutions. This combination helps climate solution providers to learn from massive datasets and generate actionable forecasts. Ongoing advances in HPC hardware, smarter AI algorithms, and greater accessibility are speeding up progress in climate action. By transforming vast amounts of climate data into actionable insights, HPC and AI are vital tools for scientists and decision-makers working to build climate solutions.
### Top 10 GPU Hosting Services in 2025
Choosing the right hosting provider for your GPU instances is a key decision that can affect the performance, cost, and success of your projects. The market includes a variety of companies, from established providers to newer, more specialized businesses.
GPU Cloud Providers
We take a look at five GPU Hosting Services providers, with a detailed breakdown to help you compare the GPU services offered.
#1 Atlantic.Net
Atlantic.Net is a well-established hosting provider with over three decades of experience in the technology industry, providing cloud hosting, dedicated server hosting, and colocation services.
Atlantic.Net has developed a strong GPU hosting solution, featuring powerful NVIDIA GPU instances. The service is engineered for demanding applications such as AI model training, deep learning, high-performance computing (HPC), professional graphics rendering, and intensive video encoding tasks.
Pros:
Extensive Experience: Over 30 years in the hosting industry, indicating stability and a deep understanding of infrastructure needs.
High-Performance Hardware: Provides access to cutting-edge NVIDIA GPUs, including the NVIDIA H100 NVL and L40S, ensuring top-tier computing power.
Optimized Infrastructure: Combines powerful GPUs with fast NVMe storage and high-bandwidth networking to prevent bottlenecks and maximize throughput for AI workloads.
Security and Compliance Focus: Strong emphasis on security, with data centers and services meeting compliance standards such as HIPAA, PCI DSS, and SOC 2/3, which is beneficial for handling sensitive data.
Reliability: Known for a dependable platform with a 100% uptime Service Level Agreement for its cloud services.
Comprehensive Support: Offers 24/7/365 customer and technical support from an experienced team based in the United States.
User-Friendly Platform: Features an intuitive control panel for managing GPU instances and other cloud resources within your cloud account.
Ideal for:
Businesses and organizations that need high availability and secure GPU instances for critical AI/ML projects.
Users who need access to the latest NVIDIA GPU technology, like the NVIDIA H100, for compute-intensive training of deep learning models or large-scale simulations.
Companies in regulated industries (e.g., healthcare, finance) require a hosting provider with a strong compliance posture.
Developers and researchers looking for a stable platform with strong support for both short-term projects and long-running, demanding applications.
Those who appreciate a provider with a long track record and a commitment to hardware quality and network performance.
#2 Lambda Labs
Lambda Labs has gained recognition within the Artificial Intelligence and Machine Learning communities by supplying GPU cloud services and physical hardware specifically geared towards deep learning and other AI workloads.
Pros:.
Powerful NVIDIA GPUs: Access to a variety of high-end NVIDIA GPU options, such as the A100 and NVIDIA H100.
Large Cluster Capabilities: Known for supplying GPU clusters equipped with high-speed InfiniBand interconnects, which are very useful for large-scale training of deep learning models.
Colocation Services: Provides colocation options for companies looking to house their own AI infrastructure.
Cons:
Pricing: On-demand rates for GPU instances can be higher compared to some more budget-oriented providers.
Regional Availability: The number of self-service regions for their GPU cloud might be more limited than what is offered by hyperscale cloud providers.
Free Credits/Trials: May have fewer free credits or trial programs compared to some larger competitors.
Ideal for:
AI startups and enterprises that need robust multi-GPU instances and cluster capabilities for training very large or complex models.
Projects that require a combination of cloud and on-premises hardware solutions.
Users who prioritize access to well-configured, high-performance NVIDIA GPU clusters over having the lowest possible cost.
#3 CoreWeave
CoreWeave has rapidly established itself as a specialized GPU cloud provider. Their primary focus is on delivering large-scale GPU compute capacity, using an extensive inventory of NVIDIA GPUs.
Pros:
Performance-Tuned Infrastructure: Their platform is purpose-built and optimized specifically for high-performance GPU workloads, particularly for AI/ML and rendering.
Scalability for Large Deployments: Designed to handle very large-scale training and inference workloads effectively.
Strong NVIDIA Partnership: A close relationship with NVIDIA may help ensure a consistent supply of the latest GPU hardware.
Cons:
Niche Focus: Primarily concentrates on high-end, large-scale GPU compute, so it might not offer the same breadth of general cloud services as major cloud providers.
Complexity for Smaller Users: The platform and pricing might be geared more towards large enterprises rather than individual developers or small-scale projects with intermittent needs.
Cost Structure: While potentially cost-effective for large volumes, pricing for smaller deployments might be less competitive than some alternatives.
Ideal for:
AI-first companies and large enterprises with substantial and continuous demand for GPU computing power.
Organizations undertaking very large-scale AI model training, particularly for generative AI and large language models.
Visual effects studios and rendering farms that require massive parallel processing capabilities.
Users who need access to the absolute cutting edge of available NVIDIA GPU technology at scale.
#4 Scaleway
Scaleway is a European cloud provider that furnishes a variety of cloud computing services. These include standard compute instances, bare metal servers, and AI-ready GPU instances. They often highlight their transparent pricing structure and a strong commitment to European data sovereignty, including GDPR compliance.
Pros:
Transparent and Competitive Pricing: Known for clear pricing models that can be quite competitive, especially for users within their target market.
European Data Sovereignty: Strong focus on GDPR compliance with data centers located exclusively in Europe (e.g., Paris, Amsterdam, Warsaw), appealing to customers with specific data residency needs.
Modern GPU Selection: Provides access to current NVIDIA GPUs, including options like the NVIDIA H100, L40S, and L4, suitable for various AI workloads.
Startup Friendly: Offers a startup program that can provide credits and support, making it attractive for new ventures.
Sustainability Focus: Actively works on sustainable infrastructure with attention to power usage efficiency (PUE).
Cons:
Limited Global Reach: Data center presence is primarily concentrated in Europe, which might not be optimal for applications requiring low latency to users in other parts of the world.
Fewer Managed Services: The range of managed services, particularly for advanced AI or database solutions, may be less extensive compared to hyperscale cloud providers.
Ecosystem Maturity: Their marketplace and third-party integrations might be less developed than those of larger, global providers.
No HIPAA Compliance: Not suitable for U.S. healthcare applications that require HIPAA compliance.
Ideal for:
European startups and businesses that prioritize GDPR compliance and data sovereignty.
Users looking for cost-effective GPU instances with transparent pricing for AI model training and other GPU-accelerated tasks.
Development teams that value a clean user interface and easy onboarding.
Organizations that prefer a European hosting provider may benefit from their startup programs.
#5 Microsoft Azure
Microsoft Azure is a comprehensive cloud computing platform that provides a wide range of services, including powerful GPU instances optimized for AI/ML workloads. Azure offers a robust infrastructure, extensive integrations with other Microsoft services, and a broad global presence.
Pros:
Extensive Global Infrastructure: Azure has data centers in numerous regions worldwide, offering low latency access for users globally.
Wide Range of GPU Options: Azure provides various NVIDIA GPUs, from entry-level to high-performance models like the NVIDIA A100 and H100, catering to different workload needs.
Deep Integration with Microsoft Ecosystem: Seamless integration with Microsoft products and services such as Visual Studio, .NET, and Azure Machine Learning.
Azure Machine Learning Service: Offers a comprehensive platform for building, training, and deploying machine learning models at scale.
Enterprise-Grade Security and Compliance: Azure meets numerous compliance standards and offers advanced security features, beneficial for regulated industries.
Cons:
Complexity for Beginners: The vast array of services and options can be overwhelming for users new to cloud computing.
Cost Management: Optimizing costs can be challenging due to the complexity of pricing models and the variety of services available.
Learning Curve for Microsoft-Specific Tools: Users unfamiliar with Microsoft tools and technologies may need time to adapt.
Ideal for:
Enterprises already invested in the Microsoft ecosystem and seeking seamless integration with Azure services.
Organizations requiring a global presence and low latency access for their applications.
Teams that are already using Azure Machine Learning for building, training, and deploying AI/ML models at scale.
Users who need a wide variety of GPU options to match different workload requirements and budgets.
Dedicated Server vs. Cloud GPUs: Making the Right Choice
Now let's look into the different types of GPU hosting that are available. You’ll need to decide between exclusive access to physical hardware (dedicated server) or virtualized resources from a shared pool (cloud GPUs).
Core Differences:
Resource Allocation: Dedicated offers exclusive hardware; Cloud uses shared, virtualized resources.
Performance: Dedicated provides predictable raw performance; Cloud offers excellent performance but can have slight variability.
Control: Dedicated gives full hardware/software control; Cloud has provider-defined configurations.
Scalability: Dedicated scaling takes more time; Cloud is highly scalable and quickly scalable.
Cost: Dedicated is often fixed monthly (better for constant high usage); Cloud is pay-as-you-go (flexible for variable needs).
When a Dedicated GPU Server Makes Sense: For consistent heavy workloads, highly performance-sensitive applications, needs for maximum control and customization, or stringent security/compliance requiring data isolation.
The Flexibility of Cloud Providers: Cloud GPUs offer on-demand availability, rapid experimentation, variable workload management, no hardware lock-in, access to diverse instance types, and geographic distribution.
One Cloud for Diverse Needs: Major cloud providers allow management of GPU instances alongside other cloud services (databases, storage) under a single account, simplifying IT management.
Multi-GPU Instances: For very demanding applications, cloud providers offer instances with multiple GPUs or clustering capabilities, dramatically reducing training times and enabling larger models.
Practical Considerations for GPU Hosting Success
Ready to take advantage of GPU Hosting? Take some time to consider these important considerations:
Selecting the Right GPU Models and Instance Types: Match the GPU to your workload to balance performance and cost, avoiding overspending or underperformance.
Finding the Best Balance of Performance and Cost: Benchmark your workloads, understand GPU generations (newer often means better performance per watt, older can be cost-effective), consider VRAM needs, and don't neglect CPU/system RAM. Spot instances can offer large savings for fault-tolerant workloads, while reserved instances provide discounts for long-term needs. Continuously monitor GPU usage.
Refine Your Code: Ensure your code is set up to take full advantage of the GPU's parallel processing capabilities.
Pre-Configured Templates for Quick Deployment: These accelerate deployment by providing instances with pre-installed OS, drivers, and frameworks, reducing setup errors and speeding time to productivity.
By carefully considering these aspects, you can make informed decisions and get the most from GPU hosting services.
Atlantic.Net: Cost-Effective GPU Cloud Built for AI Workloads
GPU hosting services have become essential, transforming how organizations approach computationally intensive workloads. A well-designed GPU cloud built with one or more GPUs is indispensable for tackling multiple tasks efficiently, from the demanding training process of ML models and complex deep learning tasks to scientific research and natural language processing.
Having this kind of accessibility is allowing users to innovate faster, though selecting the right provider is key to ensuring smooth operation and avoiding complications like hidden fees.
For those ready to deploy machine learning models or accelerate other GPU-dependent projects, Atlantic.Net offers a robust and reliable solution. Our platform supports the entire lifecycle, from development with tools like NVIDIA CUDA and NVIDIA cuDNN to the final deployment stage.
Atlantic.Net provides the high-performance NVIDIA GPU instances, security, and expert support needed for your most critical applications. We invite you to explore Atlantic.Net's GPU hosting services; visit our website or contact our team to discuss how we can meet your GPU hosting needs.
### Artificial Intelligence-Driven Cybersecurity in IoT: Ensuring Secure Connections in an Interconnected World
The Internet of Things (IoT) has entirely transformed the operations of industries, homes, and cities by making everything smarter, more efficient, and automated. The IoT connects devices that communicate over the Internet. From smart thermostats and wearables to automated factories, IoT-based solutions are pervasive. However, with the widespread growth of IoT devices, cyber threats have also increased at the same rate. In 2025, there are already over 18.8 billion IoT devices worldwide, which is expected to reach around 40 billion by 2030. This rapid expansion not only increases opportunities for hackers to exploit vulnerabilities but also demands proactive measures to secure the devices and the networks.
Artificial Intelligence (AI) plays an important role here. AI can quickly analyze large amounts of data, find unusual activity, and even take action to stop attacks before they cause harm. Using AI-driven security is now essential to protect the growing IoT network from new and more complex threats.
What Makes IoT Vulnerable to Attacks
Many IoT devices have weak security, and the reason for this is that they are often developed quickly and lack strong protections. According to IBM X-Force Threat Intelligence, over 50% of IoT devices have security vulnerabilities that hackers can exploit. Moreover, around 60% of IoT breaches are due to outdated software and unpatched firmware. Similarly, lots of devices still use default passwords, which make it easy for attackers to gain unauthorized access.
The variety of IoT devices, ranging from basic sensors to advanced medical equipment, makes it challenging to implement security measures consistently. As the number of devices increases, the number of entry points for hackers also increases, making IoT networks more vulnerable.
Key IoT Cyber Threats include:
Data Breaches: Cybercriminals target IoT devices to steal personal and corporate information. About one in three data breaches involve these devices, making them a significant point of vulnerability.
Ransomware: In certain industries, like healthcare and manufacturing, attackers lock IoT devices and demand a ransom for access. This type of cyberattack is becoming more prevalent as IoT devices are integrated into critical operations.
Malware and Botnets: Harmful software can infect IoT devices and turn them into bots for large-scale attacks. A well-known example of this is the Mirai botnet, which has been responsible for major disruptions to websites and online services.
The financial impact of IoT breaches is significantly high. According to a PSA certified report, each breach costs businesses an average of $330,000. Additionally, sectors subject to more strict regulations often face even greater penalties. Besides financial losses, around 78% of consumers say they would discontinue a company’s services after a major IoT-related breach according to the IoT Security Foundation. This highlights the severe reputational damage businesses have to experience due to IoT breaches.
Securing IoT devices and networks is therefore essential to protect privacy, maintain trust, and ensure the smooth operation of the increasingly connected smart environments.
The Role of Artificial Intelligence in IoT Cybersecurity
As IoT devices increasingly proliferate, conventional security approaches find it challenging to address the expanding risks and complexities. Here is why artificial intelligence is becoming essential for safeguarding IoT networks
Why Traditional Security Falls Short
Traditional security tools, such as firewalls and antivirus software, were developed for standard computer networks without consideration for the speed and scale of IoT networks. IoT devices continuously transmit vast amounts of data, but these older tools cannot process this data efficiently to prevent attacks before they occur.
One of the main problems with traditional security is signature-based detection. This method is suitable for only known threats. It cannot identify new or evolving attacks. Moreover, traditional tools' fixed security rules are ineffective for IoT networks. Since IoT networks are constantly changing, these fixed rules cannot adapt to the rapid developments in IoT environments.
On the other hand, AI follows a different approach. It processes data in real-time and uses predictive techniques to detect threats before they cause damage. With AI, devices can learn from patterns and adapt to new, unknown attacks, thus ensuring a more dynamic and responsive defense.
How AI Transforms IoT Security
AI plays an important role in securing IoT networks. AI models can analyze data from all connected devices in real-time and identify unusual activity. This helps AI systems predict threats before they result in any harm and stop them early.
With predictive threat detection, AI analyzes past data to find patterns or unusual behavior that could signal an attack. This helps AI to act quickly and prevent a data breach. In addition, AI systems can automatically respond to threats and can reduce the need for human intervention. For example, if a threat is detected, AI can isolate the affected device or block harmful traffic, thereby stopping the attack.
Different AI techniques are used to secure IoT devices. Machine Learning (ML) is one of the most common. It helps AI learn from past data and improve over time. In IoT, ML can detect new attacks that have not been witnessed before.
Deep Learning (DL) is a more advanced form of ML. It can understand more complex data and detect hidden threats that simpler models might not be able to detect. This is useful in IoT networks, where threats can be challenging to detect.
Anomaly detection is another vital AI technique. It enables AI to identify unusual patterns within IoT networks, such as unexpected data transmissions. When such irregularities occur, AI marks them as potential security threats, facilitating quicker responses and enhancing overall protection.
Finally, federated learning enables AI models to learn from data across multiple devices without sharing sensitive information. This approach preserves privacy while still enabling AI to enhance security.
AI-Driven Approaches to Securing IoT Network
Below are some important AI-driven approaches currently being employed to strengthen IoT security.
Predictive Threat Detection and Anomaly Detection
AI systems continuously analyze the data generated by connected devices to find anomalies that deviate from standard behavior. For example, suppose an IoT device like a smart thermostat unexpectedly sends large amounts of data or connects to an unfamiliar endpoint. In that case, AI systems will detect this as suspicious activity and generate an alert. This preventive approach helps recognize possible threats at an early stage before they escalate into significant issues.
Automated Incident Response
Swift responses are essential in the domain of IoT security to avoid damage on a large scale. AI-powered Security Operations Centers (SOCs) automatically speed up the reaction time by handling several response tasks. When the AI system detects suspicious activity, it can immediately isolate compromised devices, block harmful traffic, and notify human analysts to investigate further. This automation not only speeds up the process but also reduces the workload of cybersecurity teams.
Adaptive Access Controls and Behavioral Authentication
In addition to automated incident response, AI improves access management in IoT networks. AI systems continuously track user and device behavior rather than just relying on fixed credentials. AI can promptly block or limit access if a user or device attempts to access resources from an unusual location or behaves suspiciously.
This approach is based on the zero-trust security model, which assumes no device or user should be trusted without proper verification. By dynamically adjusting access rights based on real-time behavior, AI helps prevent unauthorized access and keeps IoT networks secure.
Edge AI and Federated Learning for Privacy and Efficiency
Edge AI has become essential for timely threat detection and privacy protection. It involves processing data locally on IoT devices or nearby edge gateways. As a result, the time to identify and respond to threats reduces significantly. In addition, since the data does not need to be transmitted to a centralized server, edge AI helps preserve privacy as well.
Additionally, federated learning enables multiple IoT devices to train AI models using local data without sharing sensitive information. This decentralized method improves security while maintaining privacy. Moreover, federated learning enables AI to use collective intelligence to detect threats more accurately across the entire network.
The Rise of AI-Powered Cyber Threats in IoT Security
While AI is helping secure IoT devices and networks, cybercriminals are also using it to carry out more advanced attacks. Recently, AI-driven threats have become a serious concern for the cybersecurity domain.
AI-generated phishing Attacks are becoming more advanced and malicious. Cybercriminals use AI to create realistic phishing emails that look legitimate, making it difficult for traditional security systems to spot them.
Deepfake Technology is another tool being widely used by attackers. Hackers can create fake audio and videos that mimic trusted people. This is used in social engineering attacks, like fake wire transfers or leaking sensitive data.
In addition, adaptive AI-driven malware is a new kind of malicious software. It can change its behavior to avoid detection, making traditional security systems ineffective. This emerging threat demands more innovative and more flexible security measures.
5 Best Practices for Securing IoT with AI
The organizations should:
Map the IoT environment and identify all connected devices. Security efforts must focus on devices that handle sensitive data or are highly important.
Implement AI-based machine learning and anomaly detection tools to monitor IoT device behavior in real-time. This will help detect unusual activities quickly.
Enforce strict access controls using AI-powered behavioral analytics to continuously verify identities and adjust access based on risk levels.
Continuously retrain AI models with updated data to maintain detection accuracy and stay ahead of new threats.
Integrate AI security solutions that comply with regulations such as GDPR and CCPA, ensuring the protection of sensitive information and meeting legal requirements.
The Bottom Line
The growth of IoT devices brings numerous benefits but also increases security risks. Many devices have weak protection mechanisms, making them easy targets for attackers. Traditional security methods are insufficient to handle the fast and large-scale data of IoT networks. To that end, AI offers a better way by quickly finding unusual activity and stopping threats early. AI can learn from data, adapt to new attacks, and respond automatically, which helps protect connected devices and networks.
At the same time, attackers are also using AI to develop more advanced threats. This means security systems must keep improving and being flexible. Organizations should carefully know their IoT devices, use AI tools to observe device behavior in real time, control access strictly, and update their AI models often. Following these steps will help keep IoT networks safer and protect privacy and trust.
### Server Hosting with GPU Support: Our Top 5 Best Options in 2025
Understanding Server Hosting with GPU Support
What exactly is server hosting with GPU support?
Servers + GPUs: You get servers equipped with both standard CPUs and powerful Graphics Processing Units. The great thing about cloud hosting is that you can opt for shared or dedicated server resources.
Beyond Graphics: GPUs were initially created for gaming, but are now used for the heavy computation of AI due to their unique parallel design.
Parallel Power: GPUs excel at advanced math problems that can be broken into many small pieces and solved simultaneously. That's exactly how AI algorithms work! Making them a perfect match.
Faster Processing: Instead of the CPU doing everything, parallel tasks are offloaded to the GPU, dramatically speeding things up and boosting overall processing power.
What Makes GPU Hosting Different?
The key difference lies in how they work:
CPUs: Have a few strong cores, great for handling tasks one after another (serially). CPUs are good all-rounders.
GPUs: Contain hundreds or thousands of smaller cores (like NVIDIA CUDA cores). Designed for doing many calculations at the same time – known as parallel processing.
The Advantage: Server hosting with GPU support specifically uses this parallel strength for tasks that benefit from it.
How Does GPU Hosting Work?
Here’s a simplified look at the process:
Hardware: Actual GPU hardware is installed in the physical servers.
Task Offload: Programs designed for GPUs send parallel-friendly jobs from the central processing unit (CPU) to the graphics processing units via graphics and CUDA drivers.
Processing: Using hardware like CUDA cores, tensor cores and RT Cores, the GPU's many processing units work on these tasks simultaneously.
Results: The answers are sent back much faster than a CPU could manage alone, delivering a big leap in performance.
We will explore the GPU architecture in greater detail later in the article. But let's now look at what type of hosting provider can help you on your GPU-powered AI journey.
Comparing the Top 5 Server Hosting Providers with GPU Support
Choosing a hosting provider involves comparing GPU models, pricing, speed, support, and more. Here’s a quick comparison of five leading providers for server hosting with GPU support. This helps weigh options for deep learning, data analytics, or graphics rendering, considering GPU memory and other features.
#1: Atlantic.Net - The Leading Dedicated Server with GPU Power
Atlantic.Net is notable for its combination of strong hardware, flexible options (Cloud GPU and Dedicated GPU), solid reliability, and great customer support. They offer high-end NVIDIA GPU choices like the L40S (good for general AI, graphics, and video) and the H100 NVL (great for large-scale AI/HPC with lots of GPU memory and bandwidth).
Strengths:
High-Performance Hardware: Access to new NVIDIA L40S and H100 NVL GPUs, paired with modern Intel CPUs and SSD/NVMe storage.
Hosting Flexibility: Offers both quickly scalable Cloud GPU instances (shared/dedicated choices) and full dedicated GPU servers for exclusive access.
Reliability: A strong 100% Uptime SLA agreement shows confidence in their setup.
Support: Well-regarded 24/7 US-based expert technical support.
Ease of Use: Simple control panel for managing cloud instances and strong team integrations for sharing tasks between your engineers.
Compliance: Strong focus on security and meeting standards (HIPAA, PCI, SOC 2/3).
Experience: Long history in the hosting business (since 1994).
Ideal For: Businesses and researchers needing high-speed, dependable GPU hosting for AI workloads, deep learning models, HPC, video rendering, and data analytics. Good choices for both cloud flexibility and guaranteed dedicated resources. Their dedicated server offering gives unmatched control and consistent performance.
#2: Amazon Web Services (AWS)
AWS is a giant in cloud computing, providing a huge selection of EC2 instances with GPU speed-up. Main choices include P-series (like P4d with NVIDIA A100) and G-series (like G4dn with NVIDIA T4), aimed at deep learning, machine learning, and graphics work.
Strengths:
Vast Scalability: Huge worldwide infrastructure makes scaling resources up or down easy.
Wide Range of Options: Many instance types with different NVIDIA GPUs (A100, V100, T4, etc.), CPU choices, and GPU memory amounts.
Rich Ecosystem: Works smoothly with AWS's huge collection of other cloud services (storage, databases, ML tools).
Mature Platform: Good documentation and a large user community for help.
Weaknesses:
Complexity: Can be complicated to figure out and set up, especially for beginners.
Pricing: Costs can add up fast, and the pricing details can be complex (spot vs. reserved vs. on-demand). Data transfer costs can be high.
Support Costs: Getting top-level technical support can cost extra.
Ideal For: Organizations already using AWS heavily, needing huge scalability, lots of instance choices, and connection with other AWS services. Good for large AI model training and running.
#3: Google Cloud Platform (GCP)
GCP is another major cloud provider offering strong virtual machines (Compute Engine) that can have various NVIDIA GPU models attached, like the A100, T4, and V100. They focus on flexibility and working well with Google's AI and data tools. While they offer high-speed instances rather than traditional dedicated GPU servers, their performance is notable.
Strengths:
Strong AI/ML Connection: Works very well with Google's AI Platform, BigQuery, and other data services.
Flexible Configurations: Very customizable virtual machine setups. Offers 'preemptible' VMs for savings on tasks that can handle interruptions.
Global Network: Uses Google's high-quality worldwide network.
Competitive Pricing: Often has good pricing, especially with preemptible options and discounts for long-term use.
Weaknesses:
Complexity: Like AWS, it can take time to learn.
Fewer Dedicated Hardware Options: Mostly offers virtual machines, not bare-metal dedicated GPU servers in the classic sense.
Market Share: Smaller than AWS, which might mean a smaller community for finding help with specific problems.
Ideal For: Users connected to Google's AI/ML services, needing flexible VM setups, and potentially saving money with preemptible instances for deep learning or data processing.
#4: OVHcloud
OVHcloud is a big European cloud company known for good prices. They offer both cloud instances and bare-metal dedicated servers with GPU choices. You can get NVIDIA GPUs like the V100S and A100 for HPC, AI, and VDI jobs. Their GPU rental idea mostly applies to their cloud instances, while dedicated servers are more for longer commitments.
Strengths:
Competitive Pricing: Often cheaper than the giant cloud providers like AWS and GCP, especially for dedicated machines.
Bare Metal Options: Offers actual dedicated GPU servers alongside cloud instances.
Global Presence: Has data centers in Europe, North America, and Asia-Pacific.
Transparent Pricing: Pricing is usually easy to understand.
Weaknesses:
Support: Support might seem less responsive or thorough compared to others unless you pay for a higher support level.
Feature Set: Might not have as many built-in extra services as Atlantic.Net, AWS or GCP.
Cutting-Edge Hardware: Might sometimes be a bit slower in offering the very newest GPU models right when they come out.
Ideal For: Price-conscious users, especially in Europe, who need the speed of bare-metal dedicated servers or scalable cloud GPU instances for HPC, AI, and rendering, but don't need the huge range of extra services from AWS/GCP.
#5: Lambda Labs
Lambda Labs focuses specifically on GPU cloud and hardware for machine learning and AI workloads. They provide on-demand cloud instances with a broad selection of NVIDIA GPU choices (H100, A100, A6000, RTX 6000, etc.) and also sell dedicated GPU computers and servers. Their cloud service aims for simplicity and speed for AI developers.
Strengths:
AI/ML Focus: Built specifically for AI researchers and developers, often coming with useful frameworks pre-installed (Lambda Stack).
Wide GPU Selection: Gives access to many different NVIDIA GPUs, including very powerful ones like the H100 and setups with multiple GPUs (up to 8).
Simple Pricing: Pay-by-the-minute/hour for cloud instances when you need them.
Performance: Their setup is tuned for deep learning jobs.
Developer Friendly: Easy-to-use interface and tools for managing instances.
Weaknesses:
Niche Provider: Mostly focused on AI/ML; not the best choice for general website or application hosting.
Smaller Scale: Doesn't have the worldwide reach or the wide variety of services of Atlantic.Net/AWS/GCP.
Limited Non-GPU Services: Their offerings outside of core GPU computing are less extensive.
Ideal For: AI/ML researchers, data scientists, and developers wanting simple, on-demand access to various high-speed NVIDIA GPUs specifically for training deep learning models, tweaking them, and running predictions. They value simplicity and speed for these specific tasks. Their approach is very much like GPU rental.
GPU Architecture: Cores and Memory
Now let's circle back and give you further information about exactly what server hosting with GPU support is all about.
The Power of Parallel Processing Explained
How do GPUs achieve such speed? It boils down to a different approach compared to CPUs:
CPUs (Serial Processing): Think of a CPU as having a few very smart cores. They tackle complex tasks quickly, but mostly one after another, or a few at a time. This is great for general computing where tasks vary a lot.
GPUs (Parallel Processing): GPUs work differently. They are built with thousands of simpler cores. They shine when a big problem can be broken down into thousands of smaller, similar pieces. The GPU assigns each small piece to a core, and they all work on their piece at the same time.
The Outcome: For jobs that fit this model – like the repetitive calculations common in deep learning, scientific simulations, and graphics rendering – this massive parallel processing means the GPU finishes the entire job much faster than a CPU can, maximizing computing power for these specific kinds of tasks.
What's inside a modern GPU?
Processing Cores: Thousands of them (CUDA cores, specialized Tensor Cores for AI, RT Cores for graphics). Compare modern cores to older ones like Kepler CUDA cores.
GPU Memory (VRAM): Super-fast, dedicated graphics memory (like GDDR6 or HBM) located right on the card for quick data access during calculations. The amount of GPU memory is crucial.
Memory Bandwidth: High-speed connection between cores and VRAM, needed to keep the cores fed with data.
Why It Matters: This architecture dictates the type and complexity of problems a GPU can handle efficiently, influencing your server configuration choice.
Why Choose a GPU-Dedicated Server?
Why go for a GPU-dedicated server over a shared GPU Host?
Here’s why:
Exclusive Resources: You get the entire server – CPU, RAM, storage, and the dedicated GPU card(s) – all to yourself.
Consistent Performance: No slowdowns caused by other users sharing the hardware. Performance is predictable.
Full Control: Get root access at the hardware layer for deep software and security customization.
Stable Environment: Build a stable and productive environment perfectly matched to your specialized or sensitive computational power needs. Dedicated GPU servers offer this reliability.
Key Applications Driven by GPU Acceleration
We are often asked what exactly our clients can do with GPU hosting. Most clients know it's for AI/ML, but what exactly can you do? And where does GPU acceleration make a big difference?
Did you know that Atlantic.Net has hundreds of AI procedures ready for you to try out? Click here to visit our extensive procedure library.
AI & Machine Learning: Training deep learning models, natural language processing (NLP) using frameworks like TensorFlow or PyTorch. We see clients using these tools for image recognition software or training chatbots for their websites.
High-Performance Computing (HPC): Power-demanding scientific computing simulations. Examples include weather modeling (like WRF), molecular dynamics for drug research (using software like GROMACS or NAMD), or running complex financial modeling (e.g., Monte Carlo risk analysis).
Data Analytics: Dramatically speed up data processing and queries on massive datasets. This can involve using GPU-accelerated platforms (like NVIDIA RAPIDS, HEAVY.AI) or specific database features to get business insights faster.
Graphics & Media: Significantly cut down video rendering times in 3D software (Blender, V-Ray, Arnold). Accelerate video encoding and editing in tools like Adobe Premiere Pro, DaVinci Resolve, or using FFmpeg with GPU acceleration (NVENC). Power game development (Unreal Engine, Unity) and enable smooth game streaming services. Run graphics-intensive Android emulators like BlueStacks or LDPlayer effectively. Improve streaming quality and performance when using Open Broadcast Software (OBS) with GPU encoding.
Scientific Research: Accelerate specific research tasks beyond general HPC, such as faster genome sequencing analysis (using tools like Clair3), computational chemistry simulations, or complex physics modeling related to drug discovery.
Essentially, any task involving large-scale parallel work benefits greatly from server hosting with GPU support.
Introducing Atlantic.Net GPU Hosting: Powering Your Ambitions
The Atlantic.Net GPU Hosting, powered by NVIDIA, was released in early 2025. Our customers have been demanding GPU services, and we felt that now is the right time to introduce our GPU hosting service. Drawing on our decades of hosting experience, we provide GPU Cloud Hosting and GPU Dedicated Hosting featuring modern NVIDIA GPU hardware.
Need GPUs for healthcare? Atlantic.Net also offers HIPAA-Compliant GPU Hosting.
You can experience our Cloud GPU hosting today by signing up for the Atlantic.Net Cloud Platform.
You have the choice of picking a cloud server with the CPU, Disk, and Memory you need, plus the choice of having a shared GPU resource using NVIDIA NVLink, a dedicated GPU card, or you can nest multiple GPUs for the best performance possible.
All backed by reliability and expert technical support, Atlantic.Net provides capable high-performance computing resources.
Atlantic.Net: Your Premier GPU Hosting Provider
Why you should make Atlantic.Net the next choice for GPU hosting.
Customer Focus: Our customer service teams have decades of experience, and we are available by phone and email 24x7x365.
Flexible Solutions: Choose from cloud instances or customizable dedicated GPU servers, allowing setups with one or many GPUs.
Productive Environment: Aim to provide a stable and efficient environment to maximize GPU hardware use for AI model training, video rendering, etc.
Handles Demand: Our security-defined infrastructure is built for speed. Our GPU hosting setup supports running multiple tasks efficiently, providing the computing resources you need, when you need them.
Key highlights of Atlantic.Net's GPU server offerings include:
Powerful NVIDIA GPUs: Access to L40S and H100 NVL models, packing plenty of CUDA cores and GPU memory.
No Bottlenecks: Capable Intel® Xeon® processors, fast memory, and speedy NVMe SSDs complement the GPUs.
High-Bandwidth Networking: Fast connections are crucial for data-heavy tasks like processing image data or large datasets. Our data centers are interconnected across the globe for unrivalled connectivity options.
Customizable Configurations: Flexibility in choosing CPU, RAM, storage, and GPU setup with one or more GPUs.
Control & Reliability: Root access available on dedicated servers, enabling unlimited customization; backed by a 100% Uptime SLA Agreement.
Support & Compliance: Dependable 24/7 US-based technical support; meets standards like HIPAA, PCI, SOC 2, SOC 3.
These components create reliable NVIDIA GPU servers delivering improved performance and unprecedented reliability.
Atlantic.Net Commitment to Performance and Stability
Atlantic.Net prioritizes delivering consistent performance and rock-solid reliability.
Understanding Needs: We recognize that demanding workloads require a stable and efficient environment. We also know that not one size fits all, which is why we offer a wide range of solutions to meet or exceed your needs.
Investment: We only use the latest modern hardware and robust infrastructure in our data centers, which shows our commitment to providing the best-in-class computing resources.
Guarantee: The 100% Uptime SLA backs up our promise of superior performance and reliability. Ensuring our customers have the best possible operation for enhanced performance.
Why Atlantic.Net Excels in GPU Hosting
What makes Atlantic.Net a strong choice for GPU hosting?
Experience: Decades in the hosting business (since 1994).
Hardware: Uses current, high-performance NVIDIA GPUs (L40S, H100 NVL).
Flexibility: Offers both cloud and dedicated server options, potentially supporting multiple instances for scalability.
Reliability: Strong infrastructure providing a dependable, efficient environment, backed by a 100% Uptime SLA.
Support: Knowledgeable, accessible 24/7 US-based support.
Value: Competitive pricing for powerful GPU resources.
Security: Strong focus on security practices and compliance.
These factors make Atlantic.Net a compelling option for users needing serious computing power through server hosting with GPU support, offering significant advantages and enhanced performance.
The Power of Parallel Processing Explained
How do GPUs achieve such speed? It boils down to a different approach compared to CPUs:
CPUs (Serial Processing): Think of a CPU as having a few very smart cores. They tackle complex tasks quickly, but mostly one after another, or a few at a time. This is great for general computing where tasks vary a lot.
GPUs (Parallel Processing): GPUs work differently. They are built with thousands of simpler cores. They shine when a big problem can be broken down into thousands of smaller, similar pieces. The GPU assigns each small piece to a core, and they all work on their piece at the same time.
The Outcome: For jobs that fit this model – like the repetitive calculations common in deep learning, scientific simulations, and graphics rendering – this massive parallel processing means the GPU finishes the entire job much faster than a CPU can, maximizing computing power for these specific kinds of tasks.
Making the Right Choice: Factors to Consider
Are you ready to start your GPU hosting journey? We have compiled this list of what to ask yourself when shortlisting your next provider.
How do you choose the best server hosting with GPU support for you?
Consider these points:
Your Workload: Is it training machine learning models, processing image data, accelerating rendering, complex video processing, running android emulators, developing large language models, or using high-performance computing resources? Different tasks need different GPUs.
GPU Needs: Which specific model? How much GPU memory? Need one or more GPUs? Do you require multiple instances or technologies like NVIDIA multi instance GPU for partitioning (NVLINK)?
Performance Level: Is guaranteed speed vital (dedicated GPU server) or is shared acceptable for improved performance needs?
Budget: Compare costs: hourly (GPU rental), monthly, dedicated plans, and data fees for the necessary computing resources.
Scalability Needs: How easily must you adjust GPU resources?
Control Level: Do you require full admin access for enhanced customization and ensuring smooth operation?
Support Needs: What level of technical support is necessary? Do you need help enabling customization?
Integration: Need it to work seamlessly with other specific cloud tools?
Remember, careful consideration is needed at all times, especially if you are just dipping your toes into GPU Hosting. It's essential to make sure you are not over- or under-specifying your server requirements.
If you are ever in doubt, reach out to the team today.
Conclusion: The Future Is Accelerated with GPU Hosting
The computational power needed for deep learning, data analytics, and AI modelling is more readily available now than ever before. Whether opting for the flexibility of cloud-based GPU instances or the guaranteed performance of dedicated servers equipped with leading hardware like NVIDIA's L40S or H100 NVL, there is plenty of choice for consumers.
Managed Service Providers like Atlantic.Net focus on delivering this technology reliably, backed by robust infrastructure and expert support, enabling users to fully leverage these powerful tools. We know it's important to make this technology available to everyone, which is why you can save big with Atlantic.Net.
Choosing the right GPU hosting environment is a critical decision for any organization looking to innovate and compete. It's about securing the necessary horsepower not just for today's challenges, but for the breakthroughs of tomorrow. The future clearly belongs to accelerated computing, and GPU-powered hosting is a foundational element of that future.
Ready to harness the power of high-performance NVIDIA GPUs for your demanding workloads? Explore Atlantic.Net's flexible Cloud GPU and powerful Dedicated GPU hosting solutions.
Visit atlantic.net/gpu-server-hosting or contact our specialists at sales@atlantic.net or +1-408-335-0825 (Intl) / 866-618-DATA (USA) to discuss the perfect configuration for your project.
### Introducing High-Performance GPU Cloud Hosting
Massive Power for Data and AI Workloads in Less Than 60 Seconds
Deploy a GPU server in less than 60 seconds with our new GPU Cloud Hosting service, delivering high-performance, cost-effective AI and machine learning (ML) solutions. This service was designed with ease of use in mind and comes with clear on-demand and contract pricing so businesses, developers, and researchers can harness AI without unnecessary complexity.
GPU Cloud Hosting Highlights
Unleash the raw power of AI and high-performance computing with Atlantic.Net's Cloud-Based GPU Solutions, powered by cutting-edge NVIDIA GPUs.
Cutting-Edge Hardware: The Atlantic.Net Cloud Platform (ACP) offers powerful cloud instances with top-quality SuperMicro and Dell server hardware, SSD storage throughout (with NVMe options available), and ultra-high bandwidth network connectivity.
Security-Defined Compliant Infrastructure: We adhere to the highest security standards and maintain key data security and privacy certifications, including HIPAA/HITECH, PCI DSS, SOC 2/3, and GDPR, ideal for sensitive healthcare and scientific data.
Dedicated Servers: We provide dedicated GPU server options, ensuring maximum control and performance without resource sharing.
Always Available Support & 100% Uptime SLA: Our USA-based support team is available 24/7/365 to help with any GPU query. We are so confident our cloud platform’s reliability and security that we offer a 100% uptime SLA.
Beyond GPUs – A Complete AI Environment
Atlantic.Net goes beyond hardware with a comprehensive AI cloud ecosystem featuring flexible GPU configurations for dedicated or shared resources. Our user-friendly control panel simplifies cloud computing for AI users. Additionally, our GPU Cloud lets you precisely scale AI and ML workloads with two powerful GPU options:
High-Memory GPU Configuration – Designed for training large AI models, running advanced simulations, and deep learning research, featuring 94GB memory and ultra-high bandwidth for high-performance computing at scale.
Versatile AI GPU – A flexible, energy-efficient GPU with 48GB memory, ideal for AI development, machine learning, and graphics-intensive workloads.
Getting Started Is Easy!
Simply sign up for our Cloud Hosting Platform, then follow these simple steps. New to Atlantic.Net or want learn more about our GPU Cloud Hosting? Click here to learn more.
### GPU Hosting for AI Projects: Top GPU Hosts for AI in 2025
Training AI models, creating complex deep learning networks, and processing the large-scale datasets required for AI applications demands a significant level of processing power, often exceeding the capabilities of traditional server hardware.
The Graphics Processing Unit (GPU) has become instrumental for AI and ML development in recent years. Initially engineered for gaming and rendering visuals, GPUs possess a complex architecture that's optimized for the mathematical operations needed by AI workloads.
To unlock the full potential of AI workloads, organizations can deploy on cloud GPU hosting (such as Atlantic.Net GPU Hosting) for its scalable, cost-effective, and high-performance infrastructure.
In this article, we'll cover:
Why GPUs outperform traditional CPUs for demanding AI workloads.
The key advantages of accessing GPU instances via the cloud.
A comparison of leading cloud GPU providers for AI projects.
Factors in selecting the right GPU options, including examples of the best GPUs.
Major AI applications where GPU acceleration provides significant benefits.
Important considerations around environment setup, data security, and cost management when using cloud GPUs.
CPU and GPU Role in AI
While Central Processing Units (CPUs) have traditionally been the primary workhorse in the data center, their architecture introduces some limitations when working with AI. The power of the CPU is still important, but the GPU has emerged as the king for processing AI tasks.
Sequential Tasks: CPUs are designed with fewer, but very powerful cores optimized for handling tasks one after another.
Parallelism: Many AI and ML tasks, especially model training and deep learning, involve performing the same calculation across vast amounts of data simultaneously (like large-scale matrix operations).
CPUs Struggle with Parallel AI Tasks: Their sequential design makes them inherently less suited for the massive parallelism required, leading to longer processing times.
In contrast, GPUs offer a different approach:
GPU Parallel Architecture: GPUs contain thousands of smaller, specialized cores (like CUDA cores and Tensor Cores).
Simultaneous Calculation: GPU architecture enables parallel processing at scale, executing thousands of calculations per second.
Faster for AI: GPU acceleration makes them significantly faster than CPUs for the intense parallel tasks associated with AI and ML.
While CPUs remain important for general system operations, specialized GPU instances deliver the specific compute power needed for demanding AI workloads, drastically reducing calculation times.
Understanding Cloud GPU Hosting
Cloud GPU hosting is a service where cloud providers offer remote access to high-powered GPU resources in a secure data center. This lets organizations bypass the substantial investment and overhead of managing on-premise GPU servers by allowing them to rent cutting-edge hardware on demand via the cloud.
GPU Hosting introduces several advantages:
Increased Scalability: Organizations can dynamically adjust GPU resources based on project demand, paying only for the compute capacity used.
Forget About Hardware Management: Cloud hosting removes the complexities of purchasing, housing, cooling, powering, and maintaining physical GPU hardware. You can sit back and relax, leaving the complexities to the experts.
GPU Choice and On-Demand Support: Cloud environments offer various GPU options, with hardware based on the latest technologies. Typically cloud GPU hosting offers efficient and highly optimized software stacks and a comprehensive level of technical support, helping you improve performance and simplifying deployment.
Choosing Your Cloud GPU Provider
Now let's take a look at what the biggest GPU Hosting providers have to offer.
Selecting the right cloud provider is an important decision for optimizing both performance and cost for your AI projects. While many providers offer GPU instances, their specific hardware offerings, pricing structures, geographical reach, management tools, and focus areas can vary significantly.
Here’s a comparative look at some big players in the AI GPU hosting market:
#1: Atlantic.Net:
Atlantic.Net offers high-performance computing resources, dedicated or cloud servers powered by the latest NVIDIA accelerated GPU. All GPU hosts feature the NVIDIA H100 NVL or L40S GPU, making them well-suited for demanding generative AI workloads, large language model (LLM) training and inference, natural language processing (NLP), high-performance computing (HPC), and graphics rendering. Their expert support and impressive uptime SLA complement the powerful hardware on offer. Atlantic.Net is affordable, but offers impeccable service as well.
#2: Amazon Web Services (AWS):
As the long-standing market leader, AWS provides an extensive choice of cloud services. EC2 offers various GPU instance families, such as the P4 series (NVIDIA A100), P5 series (NVIDIA H100), and G5 series (NVIDIA A10G), catering to diverse AI/ML training, inference, and graphics workloads, but its pricing models (On-Demand, Reserved Instances, Savings Plans, Spot Instances) can be complex to navigate and very expensive.
#3: Microsoft Azure:
Azure is another major cloud platform with deep integration within the Microsoft products. Azure offers N-series virtual machines equipped with a range of NVIDIA GPUs (e.g., T4, V100, A100, H100). It's a great choice for businesses already embedded in Microsoft platforms, and the Reserved GPU pricing is competitive. However, limited open source support is available and typically costs more than their competitors.
#4: Google Cloud Platform (GCP):
GCP is great at data analytics, AI/ML tooling (e.g., Vertex AI platform), and high-performance networking. Their Compute Engine instances are available with NVIDIA GPUs (A100, T4, L4, H100) and also offer their proprietary Tensor Processing Units (TPUs) optimized for specific ML frameworks like TensorFlow. GCP features a strong global network and good availability, however, like all of the major cloud providers, they are expensive.
#5: Vultr:
A provider known for its developer-friendly approach and good pricing across a wide global network of data centers. Vultr has significantly expanded its NVIDIA GPU service (including A16, A40, A100, L40S, H100, GH200) and AMD Instinct accelerators (MI300X, MI325X). They offer both virtual machines and bare metal options, appealing to users seeking cost-effectiveness. One downside is that there is often limited capacity in specific regions, so double-check that your chosen region is available.
#6: Lambda Labs:
A specialized cloud provider explicitly focused on serving AI and ML developers and researchers. Lambda offers on-demand and reserved access primarily to high-end NVIDIA GPUs (including H100, A100, GH200, and newer models like H200, B200). They are known for their pre-configured environments (Lambda Stack with popular ML frameworks), ease of setting up multi-GPU clusters with high-speed interconnects (InfiniBand), and transparent hourly pricing, making them a popular choice for demanding training tasks.
Key Advantages of Using GPU Instances for AI/ML
Although deploying GPU instances in the cloud involves costs, this expense is often much lower than anticipated and is accompanied by significant benefits:
Speed and Performance:
Powerful GPUs dramatically improve the processing speed for AI workloads. Don't just take our word for it; check out our AI Procedures to experience the performance improvements today.
Scalability:
AI projects have fluctuating needs. Cloud GPU hosting offers great scalability, allowing users to easily scale compute capacity on demand. Teams can start small and expand to multiple GPUs as models grow in complexity or datasets increase in scale.
Cost-Effectiveness:
On-premise GPU clusters require significant upfront capital and ongoing costs. For example, an NVIDIA H100 GPU costs upwards of $25,000 at retail, and the NVIDIA L40S GPU costs about $10,000. Cloud GPU services use a pay-as-you-go model, making high-performance computing accessible and cost-effective without massive capital expenditure.
The Best GPUs for Your AI Applications
There are plenty of choices when it comes to selecting optimal GPU instances. You need to consider the best for both performance and cost-efficiency. The ideal choice depends on specific tasks: the type of AI workload (e.g., training and inference, computer vision, natural language processing), model complexity, and data volume.
Cloud providers present various GPU options, with NVIDIA GPU technology prevalent. Understanding different tiers is necessary. Top-tier performance might be needed for training deep learning models on large datasets, while AI inference might suit more balanced or cost-effective GPUs.
Let's take a further look at the options available.
Spotlight on NVIDIA GPUs: The Industry Standard
NVIDIA significantly leads the AI and high-performance computing (HPC) GPU market, built on powerful hardware and a reliable CUDA software ecosystem. CUDA enables developers to unlock the parallel processing capabilities of NVIDIA GPUs.
What to look for:
CUDA Cores: Fundamental units for parallel execution; more cores generally mean higher computing power.
Tensor Cores: Specialized cores accelerating the matrix operations foundational to deep learning, boosting deep learning performance.
High Memory Bandwidth: Needed for rapid data transfer to keep cores fed, especially with large datasets.
High-end NVIDIA GPU models like the NVIDIA H100 NVL GPU represent the cutting edge for demanding AI workloads, including large language models (LLMs).
Other models, like the NVIDIA L40S GPU, cater to graphics rendering and simulation, alongside AI development.
Understanding GPU Specifications
When evaluating GPU options, several technical specifications are important:
VRAM (Video RAM): Dedicated GPU memory. Training large deep learning models or processing high-resolution data demands substantial VRAM.
Memory Bandwidth: The speed of data transfer between VRAM and cores. High memory bandwidth is necessary for preventing bottlenecks with large datasets.
FLOPS (Floating-Point Operations Per Second): Quantifies raw computational throughput.
Take time to analyze these specs when selecting your next GPU instance.
Core Applications Accelerated by GPU Hosting
Cloud GPUs provide the necessary power for a wide range of computationally intensive tasks.
Here are some key areas where GPU acceleration makes a significant difference:
Deep Learning Model Training: This is often the most demanding AI workload. Training deep learning models, especially large language models (LLMs), requires immense computing power (CUDA Cores, Tensor Cores), substantial VRAM to hold models and large datasets, and high memory bandwidth. High-performance GPUs, such as the NVIDIA H100 NVL GPU, are favored, and using multiple GPUs is common to reduce training time.
AI Inference: Once a model is trained, AI inference involves using it to make predictions on new data. While still requiring significant compute for complex models or real-time processing, the priorities often shift to low latency (fast responses) and high throughput (predictions per second), potentially using different classes of GPU instances optimized for efficiency.
Machine Learning: Beyond deep learning, many advanced machine learning models operating on large datasets benefit from GPU acceleration, speeding up model training and analysis compared to CPU-only approaches.
Computer Vision: Analyzing images and video requires processing large amounts of data. GPUs excel here due to their parallel processing capabilities and high memory bandwidth, enabling tasks like object detection and real-time processing of visual streams. Ample VRAM is also often necessary.
Natural Language Processing (NLP): Similar to general deep learning, training large NLP models demands lots of GPU resources. Inference for applications like translation or chatbots benefits from GPU speeds, often focusing on responsiveness.
Scientific Simulations & High-Performance Computing (HPC): GPUs are essential tools in high-performance computing tasks, driving complex scientific simulations in physics, chemistry, climate modeling, and more. These applications often need the maximum available computing power and benefit from the GPU's ability to handle large-scale parallel processing.
Graphics Rendering & Simulation: For tasks like high-fidelity 3D rendering, animation, or complex engineering simulations, GPUs designed with strong graphics capabilities, like the NVIDIA L40S GPU, provide the necessary performance.
Setting Up and Securing Your Cloud GPU Environment
Transitioning to cloud GPU hosting involves careful planning for both setup and ongoing security.
Environment Setup:
Select a cloud provider based on GPU instance availability, pricing, location, reliability, and support. Then, configure your GPU instance by choosing an OS, installing drivers (NVIDIA drivers, CUDA toolkit), and setting up AI ML libraries/ML frameworks (TensorFlow, PyTorch).
Many providers offer pre-built images or templates with the required software stack to accelerate deployment and provide faster deployment times.
Ensuring Data Security in AI Models:
It's critical to secure your configured environment, especially when handling sensitive data or when adhering to regulations (GDPR, HIPAA, CCPA) or meeting compliance requirements.
Implement these key data security best practices for added protection:
Encryption: Use strong encryption for data at rest and in transit.
Identity and Access Management (IAM): Apply least privilege principles with strong authentication and role-based access controls for GPU instances, storage, and data.
Network Security: Use VPCs, strict firewall rules, and private endpoints to isolate GPU resources.
Monitoring, Logging, and Auditing: Log activities, monitor for anomalies, and conduct regular audits to meet compliance requirements.
Secure Artifact Management: Store trained AI models and scripts in secure repositories.
Rigorous data security protects assets, ensures compliance, and builds trust.
Conclusion
GPU hosting is foundational for advancing artificial intelligence. Accessing vast parallel processing power and specialized compute via the cloud allows organizations to tackle complex problems faster.
Cloud GPUs provide the necessary infrastructure, scalability, speed, and performance for everything from deep learning research to real-time processing in AI applications. As AI and GPU capabilities co-evolve, their interdependence deepens, unlocking new possibilities.
Want to learn more about Atlantic.Net GPU Hosting? Contact our team today to unlock our newest service.
### Security by Design in Common Compliance Frameworks: HIPAA, PCI, and NIST Cybersecurity
What Is Security by Design?
Security by design embeds security measures at the core of product development, from initial concept to final deployment. This approach prioritizes identifying and mitigating security threats throughout the entire lifecycle of a product or system.
By integrating security principles early on, developers can address potential vulnerabilities before they become exploitation targets. This contrasts with traditional methods where security is often an afterthought, leading to costly retrofitting.
The security by design methodology is crucial for protecting data and systems against increasingly sophisticated cyber threats. It ensures that security mechanisms are foundational components of any system. Adopting this approach minimizes risk, fosters compliance with regulatory mandates, and builds resilience into the system architecture.
Security by Design Principles
Security by design is guided by principles that ensure systems are built with security at their core. These principles provide a framework for making design decisions that reduce risk, prevent common vulnerabilities, and support long-term resilience.
Least privilege: Limit access rights for users, processes, and systems to only what is necessary. This minimizes potential damage from accidents or malicious activity by containing the scope of access.
Defense in depth: Layer multiple security controls throughout the system to provide redundancy. If one layer fails, others remain in place to protect the system.
Secure defaults: Ensure systems are secure out of the box, with restrictive default settings. Security features should be enabled by default, requiring deliberate action to weaken protections.
Fail securely: Design systems to handle failures in a secure manner. When errors occur, they should not expose sensitive data or leave the system vulnerable to attack.
Keep it simple: Avoid unnecessary complexity in system design, as it often introduces hard-to-detect vulnerabilities. Simple designs are easier to audit, test, and secure.
Secure the supply chain: Evaluate and secure third-party components, including libraries, frameworks, and hardware. Vulnerabilities in external dependencies can compromise the entire system.
Continuous validation: Implement ongoing testing and security assessments throughout the development lifecycle. Techniques like static analysis, dynamic testing, and penetration testing help uncover vulnerabilities early.
Secure by default configuration management: Provide and enforce secure configurations through automated tools and policies. Systems should remain secure even as they scale or change over time.
Security by Design in Common Compliance Frameworks
Health Insurance Portability and Accountability Act (HIPAA)
HIPAA does not explicitly use the term “security by design,” but its security rule requires covered entities and business associates to implement administrative, physical, and technical safeguards that support the intent of the approach. For example, the rule emphasizes risk analysis and risk management (45 CFR §164.308(a)(1)), requiring organizations to identify potential risks and vulnerabilities to electronic protected health information (ePHI) and implement measures to reduce those risks.
Technical safeguards such as access controls, audit controls, integrity controls, and transmission security (45 CFR §164.312) also reflect core security by design principles. While HIPAA is flexible and technology-neutral, compliance demands that security considerations be integrated into system design and operations, particularly when handling or transmitting ePHI.
Payment Card Industry Data Security Standard (PCI DSS)
PCI DSS incorporates security by design concepts, especially in requirements related to secure system development and maintenance. Requirement 6 mandates the development of secure systems and applications, including secure coding practices, vulnerability management, and change control processes. Developers must follow industry standards for secure development, such as OWASP, and test applications for security flaws throughout their lifecycle.
Requirement 2 (secure configurations) and requirement 10 (logging and monitoring) also support security by design by ensuring systems are securely configured and continuously monitored for suspicious activity. The standard further emphasizes minimizing attack surfaces and limiting access based on business need to know, aligning closely with principles like least privilege and defense in depth.
NIST Cybersecurity Framework
The NIST cybersecurity framework (CSF) adopts a risk-based approach to managing cybersecurity, aligning well with security by design principles. Although it does not prescribe specific technical controls, it provides a structure (Identify, Protect, Detect, Respond, Recover) that encourages early and continuous consideration of security in system design.
Within the "Protect" function, the framework highlights secure software development processes (PR.IP-3), configuration management (PR.IP-1), and access control (PR.AC), all of which are central to security by design. NIST also offers more detailed guidance through publications like NIST SP 800-160, which focuses explicitly on engineering trustworthy secure systems.
Security by Design Implementation Strategies
Organizations should implement these measures to ensure security by design.
1. Define Security Objectives and Risk Tolerance
Begin by identifying critical assets—data, services, infrastructure—and assessing the impact of their compromise. Categorize these assets based on confidentiality, integrity, and availability requirements. Use this classification to define security goals, such as preventing unauthorized access, ensuring data accuracy, and maintaining uptime.
Next, perform a risk assessment to map threats to assets. Consider threat actors, attack vectors, likelihood, and potential impact. This helps establish acceptable risk levels, which guide the design of controls and investments. Document these tolerances and revisit them periodically.
2. Integrate Security into Development Processes
Security integration should start with requirement gathering. Include non-functional security requirements alongside performance and availability metrics. During design, apply architectural threat modeling using frameworks like STRIDE or PASTA to identify and mitigate attack surfaces.
In development, enforce secure coding standards such as those from OWASP or CERT. Embed linting tools, dependency checkers, and SAST into the build pipeline to catch issues early. Include security in code reviews and use infrastructure as code (IaC) scanning to identify misconfigurations.
Security gates in CI/CD pipelines should trigger alerts or block deployments if critical issues are found. Automate compliance checks and integrate secrets management tools to avoid exposing credentials in code or logs.
3. Implement Least Privilege Access Control
Design access control based on the principle of least privilege (PoLP). Start by defining roles and permissions narrowly—grant only the exact actions needed. Avoid over-permissioned service accounts or user roles.
Use centralized identity and access management (IAM) platforms to enforce access policies and support auditability. For fine-grained control, adopt attribute-based policies where access depends on user context (e.g., department, location, time of access). Enforce separation of duties (SoD) to prevent abuse of combined privileges.
Monitor access logs for anomalies, and set up automatic revocation of permissions for inactive users or expired roles. Regularly schedule access reviews and recertifications to ensure that permissions remain appropriate.
4. Conduct Regular Security Training
Security knowledge decays quickly if not reinforced. Tailor training programs to different audiences—developers need secure coding and code review practices, while operations teams need to know about hardening systems and detecting intrusion signs.
Include training on how to recognize phishing, social engineering, and other user-targeted attacks. Use real-world scenarios and incident case studies to illustrate impact and responses. Require completion of baseline training for onboarding and mandate annual refreshers.
Simulate attacks through red team exercises or phishing tests to identify human vulnerabilities. Debrief participants and use results to guide further training needs.
5. Perform Continuous Security Testing
Establish a testing regimen that spans static, dynamic, and interactive methods. SAST tools analyze code for common vulnerabilities (e.g., buffer overflows, SQL injection) before it's compiled. DAST tools test running applications by simulating attacks in real time.
Interactive application security testing (IAST) tools combine the strengths of SAST and DAST by running in QA environments and analyzing runtime behavior. Run dependency scans to detect known CVEs in third-party libraries and containers.
Supplement automated tools with manual testing, such as security-focused code reviews and red team exercises. Track findings in issue trackers, assign severity levels, and integrate fixes into sprints. Include regression testing to verify fixes and prevent recurrence.
6. Adopt Defense-in-Depth Strategies
Build security layers across all architectural domains—network, host, application, and data. Use perimeter defenses like firewalls and VPNs, but don’t rely solely on them. Within networks, use segmentation and microsegmentation to isolate workloads and restrict lateral movement.
At the host level, apply endpoint detection and response (EDR) tools, harden operating systems, and enforce patch management. For applications, use WAFs, secure APIs, and runtime protection mechanisms. Encrypt data at rest and in transit using modern protocols like TLS 1.3 and AES-256.
Implement monitoring and alerting at each layer to detect anomalous behavior early. Ensure that all layers operate independently—if one fails, the others must continue protecting the system.
7. Establish Incident Response Plans
Develop an incident response (IR) plan that covers detection, containment, eradication, recovery, and post-incident analysis. Assign roles to individuals and create communication plans for internal stakeholders, regulators, and customers.
Integrate IR capabilities with SIEM systems and log aggregation tools to centralize detection and correlation. Establish playbooks for common attack types—ransomware, insider threats, data breaches—and test them regularly through tabletop and red team/blue team exercises.
Document every incident, including near misses, and update the IR plan based on lessons learned. Ensure backups are tested for restorability and stored securely to support recovery.
### COBOL Modernization: 5 Considerations for Regulated Industries
What Is COBOL Modernization?
COBOL modernization refers to updating older COBOL systems to newer platforms or technologies without rewriting or redesigning them from scratch. This process involves using tools and techniques to improve the performance, security, and interoperability of existing COBOL applications.
The goal is to ensure these systems meet current IT demands while retaining their business logic and functionality. Modernization can include rehosting applications on modern infrastructure, integrating with contemporary systems, and adopting modern development processes.
Organizations can gain several benefits through COBOL modernization, including reduction of operational costs, improved reliability and development flexibility. The modernization path depends on factors like budget constraints, business priorities, and technology stacks.
Why Organizations Still Depend on COBOL
Despite its age, COBOL remains embedded in many organizations due to its reliability and proven track record. Many financial institutions, airlines, and government bodies continue to rely on COBOL systems to handle critical transactions and data processing tasks. Its syntax is straightforward, which reduces errors in complex calculations and record-keeping.
As a result, COBOL is valued for its stability and efficiency in high-volume operations, making transitioning to newer languages not straightforward or always preferable. The significant investment in these systems over decades has created a dependency that is hard to break.
Organizations often face challenges in migrating due to the vast amount of data, complex integrations, and unavailability of direct replacements for the existing functionalities COBOL provides. While newer programming languages offer different advantages, COBOL’s ability to perform mission-critical jobs with minimal downtime keeps its position in the technology stack.
Limitations of Legacy COBOL Systems in Adapting to Evolving Regulatory Requirements
Here are some of the main issues regarding the adaptability of COBOL systems:
Lack of flexibility: These systems were built decades ago with static business rules hardcoded into the application logic. When new compliance mandates arise—such as updates to data privacy laws, financial reporting standards, or industry-specific regulations—adapting COBOL systems can be slow and cumbersome.
Limited modularity: Business logic is frequently intertwined with data handling and user interface code, making even small regulatory updates a complex and risky process. Developers must navigate a dense web of interdependent components, increasing the chances of introducing unintended consequences with every change.
Limited support: Legacy COBOL applications often lack native support for modern audit trails, encryption standards, and access controls. These shortcomings make it difficult to meet contemporary regulatory expectations around data security and traceability. While workarounds exist, they typically require customization and retrofitting.
Lack of real-time reporting and analytics capabilities: Many regulations now require timely and accurate data reporting, which older COBOL systems may not support without significant upgrades. As a result, organizations relying on these systems often face difficulties in demonstrating compliance during audits or responding promptly to regulatory changes.
Common Obstacles in Transitioning Legacy Systems
Here are some of the main factors complicating modernization efforts for COBOL systems.
Complex Legacy Code Structures
Legacy COBOL systems typically contain complex code structures that have been built and modified over decades. These layers of updates and patches result in codebases that can be intimidating to new developers. The inherent complexity makes it difficult to predict the outcomes of changes, leading to risks in performance and stability.
Thorough documentation of code structures is frequently lacking, as well-maintained records are rare in longstanding systems. Without detailed documentation, deciphering the intricacies of legacy code becomes challenging, leading to increased development time and resource allocation in modernization efforts.
Shortage of Skilled COBOL Developers
A major hurdle in modernizing COBOL systems is the scarcity of developers who are proficient in COBOL. As technology evolves, younger developers typically learn contemporary languages rather than older ones like COBOL. This trend results in a skills gap in the workforce, where fewer professionals have the expertise required to manage and update COBOL systems.
As a generation of COBOL specialists approaches retirement, the demand for their skills intensifies. Organizations are now compelled to invest in training programs or hire consultants to bridge the gap. The shortage of skilled professionals hampers modernization and escalates costs, as finding and retaining proficient COBOL developers becomes expensive.
Documentation Gaps
Legacy systems often suffer from inadequate or outdated documentation, which complicates modernization processes. Over the years, changes are made to these systems with the assumption that existing developers understand the alterations. However, this documentation gap poses a significant challenge when newer developers attempt to decipher system functionalities, particularly when the original creators are unavailable for consultation.
Inaccurate or incomplete documentation extends project timelines as additional time must be spent reverse-engineering existing code to understand its purpose and structure. This can lead to increased risk of introducing errors and inefficiencies during the transition process. To address this issue, organizations must prioritize efforts to improve documentation.
Dependency on Outdated Hardware
COBOL systems typically run on outdated mainframes and hardware that are costly and difficult to maintain. These older infrastructure components are more prone to failure, posing operational risks and increasing the need for maintenance. As technology evolves, sourcing replacement parts for outdated hardware becomes increasingly challenging, leading to periods of downtime.
Modernization requires transitioning to newer, more reliable platforms that offer increased scalability and performance. However, migrating to contemporary hardware solutions involves substantial logistical and financial planning. Organizations must strategically manage the shift to minimize disruptions, while also ensuring that new platforms can handle existing workloads.
Integration with Legacy Systems
Integrating legacy COBOL systems with modern applications and platforms presents a formidable challenge. New systems are predominantly built using modern programming languages and frameworks, which often do not align seamlessly with COBOL’s architecture.
Bridging the communication gap between these distinct systems requires careful planning and specialized interfaces, which can complicate the modernization process. Successful integration requires thorough analysis of system dependencies and the development of middleware solutions.
Approaches to Updating COBOL Applications
There are several ways to modernize a legacy COBOL system.
1. Rewrite from Scratch
One approach to updating legacy COBOL applications is to rewrite them entirely using modern programming languages. This method involves translating business logic and functionalities into new code on contemporary platforms.
Rewriting from scratch offers the opportunity to rectify structural inefficiencies, improve performance, and improve user experience. However, it requires a substantial investment of time and resources, which may not be feasible for all organizations.
2. Automated Code Conversion
Automated code conversion offers a less labor-intensive alternative to modernization by utilizing tools that transform COBOL code into modern languages. This process allows for the preservation of business logic while benefiting from modern syntactic standards and application frameworks.
Automated tools simplify the conversion process, potentially reducing the time and cost associated with manual rewrites, while helping maintain the original system's functionality and intent. Despite its appeal, automated code conversion may produce results that require manual refinement. Converted code is often less readable and maintainable than human-written code.
3. Phased Modular Updates
A phased modular update involves gradually updating individual components or modules of a COBOL application rather than overhauling the entire system simultaneously. This approach allows organizations to manage modernization in manageable sections, minimizing risk and maintaining operational continuity.
Each module is updated, tested, and integrated incrementally, allowing the remaining system to continue functioning as modernization progresses. Phased updates help distribute the workload over time, easing resource constraints and financial pressures. However, they require effective project management and testing to verify that modular changes don't introduce issues.
4. COBOL to Java Migration
Java supports modern development practices and tools, making it a popular choice for system updates. COBOL to Java migration involves translating existing business logic and processes into Java code, leveraging Java’s object-oriented features to improve scalability and maintainability.
This migration process can improve system flexibility, allowing for easier integration with modern applications and platforms. However, migration presents challenges such as ensuring functional equivalence and managing the learning curve for developers unfamiliar with Java intricacies.
5. AI-Assisted Transformation
AI-based tools for code analysis, refactoring, and optimization can significantly improve the efficiency and accuracy of code conversion by identifying patterns and automating repetitive tasks. This aids developers in understanding complex code structures, reducing errors, and accelerating the modernization timeline.
By leveraging AI, organizations can achieve a more seamless transition, minimizing human error and maximizing resource efficiency. AI tools can also assist in optimizing new code for performance and maintainability, ensuring that modernized applications meet current standards and business needs.
Considerations for Successful COBOL Modernization for Regulated Industries
Here are some important practices to consider when implementing a COBOL modernization initiative.
1. Establish a Clear Roadmap and Strategy
Developing a well-defined roadmap and strategy is critical for a successful COBOL modernization initiative. It involves setting clear objectives, timelines, and stakeholder expectations to guide the project effectively. The strategy should assess the current state of legacy systems, identify priorities, and determine the most suitable modernization approaches.
Having a structured roadmap ensures resource allocation aligns with project needs, helping to avoid budget overruns and scope creep. Engaging stakeholders at various levels provides a shared vision, enabling collaboration and reducing resistance to change. Regularly reviewing and updating the strategy allows organizations to adapt to evolving requirements.
2. Perform Thorough Code Assessments
Conducting detailed code assessments is an essential preparatory step in modernization, providing insights into the existing system’s strengths, weaknesses, and areas requiring improvement. Code assessments involve analyzing code quality, architecture, performance, and dependencies to inform decision-making throughout the modernization journey.
Automated analysis tools and expert reviews can uncover technical debt and refactoring opportunities. Comprehensive assessments help identify potential risks and resource needs, shaping the modernization plan. They also provide a baseline for measuring success post-modernization, allowing organizations to track improvements in key performance metrics.
3. Iterative Refactoring Over “Big Bang” Approaches
Adopting an iterative refactoring approach, rather than undertaking a “big bang” transformation, helps minimize risks and ensure smoother transitions during modernization. Iterative refactoring involves making incremental improvements to the codebase, addressing issues in manageable portions. This strategy limits disruptions to ongoing business operations.
By completing modernization in phases, organizations can assess each iteration’s impact, iteratively refining solutions and validating outcomes before proceeding to subsequent phases. This method also enables continuous feedback, fostering a development environment where improvements and optimizations are ongoing.
4. Automated Testing for Functional Equivalence
Implementing automated testing practices is crucial for maintaining functional equivalence during modernization efforts. Automated tests validate that modernized systems perform as expected and preserve the original system’s functionality and intent. Leveraging tools like Selenium or TestComplete enables testing across diverse scenarios and environments.
Automation reduces the time and effort associated with manual testing, allowing for thorough coverage and rapid identification of discrepancies or errors. Regularly updating automated test cases ensures alignment with evolving business processes and technical environments.
5. Ongoing Maintenance for Long-Term Sustainability
Post-modernization, ongoing maintenance is vital for retaining system relevancy and performance. Regular maintenance involves monitoring system health, addressing emerging issues, and implementing continuous improvements to align with technological advancements and changing business requirements.
Establishing structured maintenance practices ensures systems remain efficient, secure, and adaptable over time. Organizations should invest in continuous training for development teams, ensuring they are equipped with the skills necessary to support sustained system operations. Additionally, automated monitoring and incident response tools help improve system reliability.
### How to Install Whisper Real-Time Speech-to-Text on Ubuntu 24.04 GPU Server
Real-time transcription of spoken language into text has numerous applications, ranging from live captioning and meeting transcription to accessibility tools and virtual assistants. OpenAI’s Whisper model provides powerful multilingual speech recognition capabilities, and when deployed on a GPU-enabled Ubuntu 24.04 server, it can handle real-time audio with high accuracy and minimal latency.
In this guide, you’ll learn how to set up and run Whisper for real-time speech-to-text on Ubuntu 24.04 with GPU support.
Prerequisites
An Ubuntu 24.04 server with an NVIDIA GPU.
A non-root user with sudo privileges.
NVIDIA drivers installed.
Step 1: Install System Dependencies
First, we need to install the essential system packages that Whisper and its supporting libraries require.
apt install -y ffmpeg python3 python3-venv python3-pip portaudio19-dev
Step 2: Create and Activate a Python Virtual Environment
Using a virtual environment isolates our Whisper installation, preventing conflicts with system Python packages.
python3 -m venv whisper-env
source whisper-env/bin/activate
Step 3: Upgrade pip and install Whisper
With our environment ready, we can now install Whisper and its dependencies.
First, upgrade pip to the latest version.
pip install --upgrade pip
Install Whisper.
pip install git+https://github.com/openai/whisper.git
Step 4: Install PyTorch with CUDA Support
For GPU acceleration, we need to install PyTorch with CUDA 12.1 support (compatible with NVIDIA GPUs).
pip install torch torchvision torchaudio --index-url https://download.pytorch.org/whl/cu121
Step 5: Install Additional Required Packages
We will need a few additional Python packages for audio handling and our web interface.
pip install sounddevice numpy gradio
sounddevice for microphone access
numpy for numerical operations
gradio for creating a web interface
Step 6: Create the Application Script
Now we'll create a Python script that loads the Whisper model and provides a web interface for transcription.
Create a new file named app.py:
nano app.py
Add the following code.
import whisper
import gradio as gr
import datetime
# Load Whisper model (use "medium" or "large" for better accuracy if needed)
model = whisper.load_model("base")
# Error log file
LOG_FILE = "error_logs.txt"
# Log errors to file
def log_error(error_message):
with open(LOG_FILE, "a") as f:
timestamp = datetime.datetime.now().strftime("%Y-%m-%d %H:%M:%S")
f.write(f"[{timestamp}] {error_message}\n")
# Transcription logic
def transcribe_audio(audio):
try:
if audio is None:
return "❌ No audio received. Please record or upload an audio file."
result = model.transcribe(audio)
return result["text"]
except Exception as e:
log_error(str(e))
return f"⚠️ Error occurred: {e}"
# Gradio interface
with gr.Blocks() as demo:
gr.Markdown("## 🎙️ Whisper Real-Time Speech-to-Text on Ubuntu 24.04 GPU Server")
# Input type selection
input_method = gr.Radio(["Upload Audio File", "Record via Microphone"], label="Choose Input Method", value="Upload Audio File")
# Both audio components are now the same due to gradio v4+ behavior
upload_audio = gr.Audio(type="filepath", label="📂 Upload Audio File", visible=True)
record_audio = gr.Audio(type="filepath", label="🎤 Record via Microphone", visible=False)
output_text = gr.Textbox(label="📝 Transcribed Text")
# Show/hide audio inputs dynamically
def toggle_inputs(method):
return (
gr.update(visible=(method == "Upload Audio File")),
gr.update(visible=(method == "Record via Microphone"))
)
input_method.change(fn=toggle_inputs, inputs=input_method, outputs=[upload_audio, record_audio])
# Decide which audio input to use and transcribe
def handle_transcription(upload, record, method):
audio = upload if method == "Upload Audio File" else record
return transcribe_audio(audio)
transcribe_button = gr.Button("🔍 Transcribe")
transcribe_button.click(fn=handle_transcription, inputs=[upload_audio, record_audio, input_method], outputs=output_text)
# Launch app with public sharing link
demo.launch(share=True)
This script:
Loads the Whisper base model (you can change to "medium" or "large" for better accuracy)
Sets up error logging to a file
Creates a Gradio web interface with options to either upload audio files or record directly
Implements the transcription logic that processes audio through Whisper
Provides a clean interface for viewing results
Step 7: Run the Application
With everything set up, launch the application:
python3 app.py
This starts the web server and provides both local and public URLs to access the interface.
checkpoint = torch.load(fp, map_location=device)
* Running on local URL: http://127.0.0.1:7860
* Running on public URL: https://c914b0a89448da8a6d.gradio.live
Step 6: Accessing the Web Interface
Open your web browser and access the web UI using the URL https://c914b0a89448da8a6d.gradio.live from the above output.
Select "Record via Microphone" as the input method.
Click the microphone icon on the interface and click on Record to start recording.
Stop recording by clicking the same icon again.
Click "Transcribe" to process the recording. Whisper transcribes the audio and displays the resulting text.
Conclusion
You have successfully set up Whisper for real-time speech-to-text transcription on your Ubuntu GPU server, complete with a web-based user interface. You can further customize the Whisper model or enhance the web application according to your needs.
### OCR with Machine Learning on Ubuntu 24.04 GPU Server
Optical Character Recognition (OCR) is a powerful technology that enables machines to convert images of text into editable and searchable data. By leveraging machine learning and GPU acceleration, you can greatly enhance OCR accuracy and processing speed.
In this guide, you'll learn how to set up an OCR solution using machine learning tools on an Ubuntu 24.04 GPU server.
Prerequisites
An Ubuntu 24.04 server with an NVIDIA GPU.
A non-root user with sudo privileges.
NVIDIA drivers installed.
Step 1: Set Up Python Virtual Environment
1. Install required system packages.
apt install -y python3-pip python3-dev python3-venv
2. Create and activate a Python virtual environment.
python3 -m venv ocr-env
source ocr-env/bin/activate
3. Update pip to the latest version.
pip install --upgrade pip
Step 2: Install EasyOCR and Dependencies
EasyOCR is a popular library for optical character recognition (OCR) tasks, leveraging machine learning.
1. Install Torch with GPU support.
pip install tensorflow torch torchvision torchaudio
2. Install the OCR package and other dependencies.
pip install easyocr opencv-python matplotlib
Step 3: Perform OCR on Images
Create a Python script gpu_ocr.py to read text from an image.
nano gpu_ocr.py
Add the following content.
import easyocr
import cv2
import matplotlib.pyplot as plt
import numpy as np
import requests
# Initialize EasyOCR reader with GPU support
reader = easyocr.Reader(['en'], gpu=True)
# Load image directly from URL
image_url = 'https://i.postimg.cc/NfdDwSw5/sample-ocr.png' # Replace with your image URL
response = requests.get(image_url)
# Convert image bytes to NumPy array for OpenCV
image_array = np.frombuffer(response.content, dtype=np.uint8)
image = cv2.imdecode(image_array, cv2.IMREAD_COLOR)
# Perform OCR on the loaded image
results = reader.readtext(image)
# Display OCR results in the console
for detection in results:
bbox, text, confidence = detection
print(f"Detected: '{text}' (Confidence: {confidence:.2f})")
# Visualize OCR results by drawing bounding boxes and labels
for detection in results:
bbox, text, confidence = detection
top_left = tuple(map(int, bbox[0]))
bottom_right = tuple(map(int, bbox[2]))
# Draw bounding box
cv2.rectangle(image, top_left, bottom_right, (0, 255, 0), 2)
# Label detected text
cv2.putText(image, text, (top_left[0], top_left[1] - 10),
cv2.FONT_HERSHEY_SIMPLEX, 0.6, (255, 0, 0), 2)
# Display the resulting image with OCR annotations
plt.figure(figsize=(10, 10))
plt.imshow(cv2.cvtColor(image, cv2.COLOR_BGR2RGB))
plt.axis('off')
plt.show()
Run the OCR script.
python3 gpu_ocr.py
You will see the extracted text in the output below.
Detected: 'What' (Confidence: 0.99)
Detected: 'is Atlantic.Net?' (Confidence: 0.98)
Step 4: Create a Web Interface for OCR
You can also create a web-based application for OCR.
1. Install required packages.
pip install flask numpy
2. Create an application for OCR.
nano app.py
Add the following code.
from flask import Flask, request, render_template
import easyocr
import cv2
import numpy as np
app = Flask(__name__)
reader = easyocr.Reader(['en'], gpu=True)
@app.route('/', methods=['GET', 'POST'])
def upload_image():
text_results = []
if request.method == 'POST':
file = request.files['image']
if file:
img_bytes = file.read()
np_img = np.frombuffer(img_bytes, np.uint8)
img = cv2.imdecode(np_img, cv2.IMREAD_COLOR)
results = reader.readtext(img)
text_results = [result[1] for result in results]
return render_template('upload.html', results=text_results)
if __name__ == '__main__':
app.run(host='0.0.0.0', port=5000)
app.run(debug=True)
2. Create an HTML Template for your application.
mkdir templates
nano templates/upload.html
Add the below content:
OCR Web Interface
Upload an Image for OCR
{% if results %}
Extracted Text:
{% for text in results %}
{{ text }}
{% endfor %}
{% endif %}
4. Run the application.
python3 app.py
5. Access the application by navigating to http://your-server-ip:5000 in your browser.
6. Click on Choose File to select the following image file from your local system.
7. Click on Upload. The application extracts a text from your uploaded image file and displays it in the following output.
Conclusion
By following this guide, you've successfully set up and executed OCR using machine learning on your Ubuntu 24.04 GPU server. Leveraging GPU acceleration significantly enhances performance, allowing rapid processing of large datasets. Additionally, the web interface provides an intuitive way to interact with the OCR functionality.
### Network Intrusion Detection System Using Machine Learning on Ubuntu 24.04 GPU Server
With the increasing number of cyber threats, organizations need robust Network Intrusion Detection Systems (NIDS) to monitor and protect their networks. Traditional signature-based detection methods are often ineffective against zero-day attacks and sophisticated threats. Machine Learning (ML) offers a powerful alternative by learning patterns from network traffic data and detecting anomalies in real time.
This article demonstrates how to implement a machine learning-based Network Intrusion Detection System (NIDS) on an Ubuntu 24.04 GPU server using TensorFlow for enhanced performance.
Prerequisites
An Ubuntu 24.04 server with an NVIDIA GPU.
A non-root user with sudo privileges.
NVIDIA drivers installed.
Step 1: Setting Up the Environment
1. First, install the necessary Python packages.
apt install python3 python3-pip python3-venv -y
2. Next, create and activate a virtual environment to isolate our project dependencies.
python3 -m venv nids-env
source nids-env/bin/activate
3. Install the necessary machine learning and networking packages.
pip install tensorflow scikit-learn pandas numpy scapy matplotlib seaborn joblib tqdm
4. Verify that TensorFlow can access your GPU.
python3 -c "import tensorflow as tf; print(f'TensorFlow GPU: {tf.test.is_gpu_available()}')"
Output.
TensorFlow GPU: True
Note: If you get an error here, you can install the require NVIDIA drivers using:
python3 -m pip install 'tensorflow[and-cuda]'
Step 2: Preparing the Dataset
We will use the CIC-IDS-2017 dataset from Kaggle, which contains labeled network traffic with various types of attacks.
1. Create main project folders
mkdir -p ~/nids-project/{datasets,models,scripts,data}
2. Download Network Intrusion dataset(CIC-IDS- 2017) from the Kaggle.
3. Transfer the downloaded dataset to your server:
scp Downloads/archive.zip root@server-ip:/root/nids-project/datasets/
4. Unzip the dataset:
cd ~/nids-project/datasets
unzip archive.zip
Step 3: Data Preprocessing
1. Create a preprocessing script to clean and prepare the data.
cd ~/nids-project
nano scripts/preprocess.py
Add the following code:
import pandas as pd
import numpy as np
import os
from sklearn.preprocessing import MinMaxScaler, LabelEncoder
import joblib
# Configure paths
DATASET_DIR = os.path.expanduser('~/nids-project/datasets')
MODEL_DIR = os.path.expanduser('~/nids-project/models')
DATA_DIR = os.path.expanduser('~/nids-project/data')
def load_data():
"""Load and merge all dataset files with custom labels"""
file_mapping = {
'Monday': 'BENIGN',
'Tuesday': 'BruteForce',
'Wednesday': 'DoS',
'Thursday-WorkingHours': 'WebAttack',
'Thursday-Afternoon': 'Infiltration',
'Friday-WorkingHours': 'DDoS',
'Friday-Afternoon-PortScan': 'PortScan',
'Friday-Afternoon': 'Botnet'
}
combined = pd.DataFrame()
for pattern, label in file_mapping.items():
for file in os.listdir(DATASET_DIR):
if pattern in file and file.endswith('.csv'):
file_path = os.path.join(DATASET_DIR, file)
print(f"📂 Loading {file} as '{label}'")
df = pd.read_csv(file_path, low_memory=False)
df['label'] = label
combined = pd.concat([combined, df], ignore_index=True)
return combined
def main():
print("🚀 Loading and merging dataset files...")
df = load_data()
if 'label' not in df.columns:
raise ValueError("❌ Label column not found in the dataset.")
# Extract label column first
labels = df['label']
# Keep only numeric features
df = df.select_dtypes(include=['number'])
# Detect and report columns with inf/-inf
inf_cols = df.columns[np.isinf(df).any()]
if len(inf_cols) > 0:
print(f"⚠️ Columns with inf/-inf values: {inf_cols.tolist()}")
# Replace inf/-inf with NaN and fill NaNs with 0
df.replace([np.inf, -np.inf], np.nan, inplace=True)
df.fillna(0, inplace=True)
# Final safety check
if not np.isfinite(df.values).all():
raise ValueError("❌ Data still contains non-finite values after cleaning.")
# Prepare features and encoded labels
X = df
label_encoder = LabelEncoder()
y = label_encoder.fit_transform(labels)
# Create directories
os.makedirs(MODEL_DIR, exist_ok=True)
os.makedirs(DATA_DIR, exist_ok=True)
# Fit and save MinMaxScaler
scaler = MinMaxScaler()
scaler.fit(X)
joblib.dump(scaler, os.path.join(MODEL_DIR, 'scaler.pkl'))
# Save processed data and label encoder
joblib.dump((X, y), os.path.join(DATA_DIR, 'processed.pkl'))
joblib.dump(label_encoder, os.path.join(MODEL_DIR, 'label_encoder.pkl'))
print(f"✅ Preprocessing complete. Data saved to:\n- {DATA_DIR}/processed.pkl\n- {MODEL_DIR}/scaler.pkl\n- {MODEL_DIR}/label_encoder.pkl")
if __name__ == "__main__":
main()
2. Run the preprocessing script.
python3 scripts/preprocess.py
This script loads the dataset, cleans it, normalizes the features, and saves the processed data for training.
🚀 Loading and merging dataset files...
📂 Loading Monday-WorkingHours.pcap_ISCX.csv as 'BENIGN'
📂 Loading Tuesday-WorkingHours.pcap_ISCX.csv as 'BruteForce'
📂 Loading Wednesday-workingHours.pcap_ISCX.csv as 'DoS'
📂 Loading Thursday-WorkingHours-Afternoon-Infilteration.pcap_ISCX.csv as 'WebAttack'
📂 Loading Thursday-WorkingHours-Morning-WebAttacks.pcap_ISCX.csv as 'WebAttack'
📂 Loading Friday-WorkingHours-Afternoon-PortScan.pcap_ISCX.csv as 'DDoS'
📂 Loading Friday-WorkingHours-Morning.pcap_ISCX.csv as 'DDoS'
📂 Loading Friday-WorkingHours-Afternoon-DDos.pcap_ISCX.csv as 'DDoS'
⚠️ Columns with inf/-inf values: ['Flow Bytes/s', ' Flow Packets/s']
✅ Preprocessing complete. Data saved to:
- /root/nids-project/data/processed.pkl
- /root/nids-project/models/scaler.pkl
- /root/nids-project/models/label_encoder.pkl
Step 4: Model Training
1. Create a training script to build our intrusion detection model.
nano scripts/train.py
Add the following code.
import os
import joblib
import numpy as np
import tensorflow as tf
from tensorflow.keras.models import Sequential
from tensorflow.keras.layers import Dense, Dropout
# Configure paths
DATA_DIR = os.path.expanduser('~/nids-project/data')
MODEL_DIR = os.path.expanduser('~/nids-project/models')
# Load processed data
X, y = joblib.load(os.path.join(DATA_DIR, 'processed.pkl'))
# Load and apply the scaler
scaler = joblib.load(os.path.join(MODEL_DIR, 'scaler.pkl'))
X_scaled = scaler.transform(X)
# Build and compile the model
model = Sequential([
Dense(256, activation='relu', input_shape=(X_scaled.shape[1],)),
Dropout(0.3),
Dense(128, activation='relu'),
Dense(len(np.unique(y)), activation='softmax')
])
model.compile(optimizer='adam', loss='sparse_categorical_crossentropy', metrics=['accuracy'])
# Train the model
model.fit(X_scaled, y, epochs=20, validation_split=0.2)
# Save the model
model.save(os.path.join(MODEL_DIR, 'nids_model.h5'))
print(f"✅ Model training complete and saved to {MODEL_DIR}/nids_model.h5")
2. Run the training script.
python3 scripts/train.py
This builds and trains a neural network model to classify network traffic, leveraging GPU acceleration for faster training.
Step 5: Real-time Detection
1. Create a detection script to monitor network traffic.
nano scripts/detect.py
Add the following code.
import os
import time
import numpy as np
import pandas as pd
from scapy.all import sniff, IP, TCP
from collections import deque, defaultdict
import joblib
import tensorflow as tf
# Paths
MODEL_DIR = os.path.expanduser('~/nids-project/models')
# Load model and preprocessing artifacts
model = tf.keras.models.load_model(os.path.join(MODEL_DIR, 'nids_model.h5'))
scaler = joblib.load(os.path.join(MODEL_DIR, 'scaler.pkl'))
label_encoder = joblib.load(os.path.join(MODEL_DIR, 'label_encoder.pkl'))
# Track packet rate for flood detection
packet_log = deque(maxlen=2000)
# Track port hits for each source IP
port_tracker = defaultdict(set)
# Extract features with expected column names
def extract_features(packet):
if IP in packet:
ip_layer = packet[IP]
features = {
'ip_len': ip_layer.len,
'ip_ttl': ip_layer.ttl,
'payload_len': len(ip_layer.payload)
}
if TCP in packet:
tcp_layer = packet[TCP]
features['tcp_flags'] = int(tcp_layer.flags)
features['src_port'] = tcp_layer.sport
features['dst_port'] = tcp_layer.dport
features['proto'] = 6 # TCP protocol number
# Pad missing features
expected_columns = scaler.feature_names_in_
df = pd.DataFrame([features])
for col in expected_columns:
if col not in df.columns:
df[col] = 0
return df[expected_columns]
return None
# Main detection function
def process_packet(packet):
global packet_log, port_tracker
now = time.time()
# Track packet rate for flood detection
packet_log.append(now)
recent_packets = [t for t in packet_log if now - t < 2] packet_rate = len(recent_packets) if packet_rate > 50:
print(f"🚨 ALERT: High packet rate detected! ({packet_rate} packets/2s) [Potential Flood]")
# Track destination ports per source IP for port scan detection
if IP in packet and TCP in packet:
src_ip = packet[IP].src
dst_port = packet[TCP].dport
port_tracker[src_ip].add(dst_port)
if len(port_tracker[src_ip]) > 100:
print(f"🚨 ALERT: Possible port scan from {src_ip} — hit ports: {sorted(port_tracker[src_ip])}")
# ML-based detection
features_df = extract_features(packet)
if features_df is not None:
scaled = scaler.transform(features_df)
pred = model.predict(scaled, verbose=0)
confidence = np.max(pred)
pred_index = np.argmax(pred)
label = label_encoder.inverse_transform([pred_index])[0]
if label != 'BENIGN' and confidence > 0.9:
print(f"🚨 ALERT: Intrusion detected - {label} (Confidence: {confidence:.2f})")
else:
print(f"✅ Normal traffic - {label} (Confidence: {confidence:.2f})")
# Start sniffing
if __name__ == "__main__":
print("🛡️ Starting NIDS with ML, Flood, and Port Scan Detection...")
sniff(iface="lo", prn=process_packet, store=False)
2. Run the detection system.
python3 scripts/detect.py
This script monitors network traffic in real-time, utilizing both rule-based detection (for flood attacks and port scans) and our trained machine learning model to identify potential intrusions.
3. Open another terminal and run a port scan.
nmap -sS -p 1-1000 localhost
4. Go back to the first terminal, you will see the detected attack in the following output:
✅ Normal traffic - BruteForce (Confidence: 0.25)
🚨 ALERT: Possible port scan from 127.0.0.1 — hit ports: [21, 22, 23, 25, 53, 80, 110, 111, 113, 139, 143, 199, 256, 443, 445, 554, 587, 993, 995, 63630]
Conclusion
This implementation demonstrates how to build a comprehensive Network Intrusion Detection System (NIDS) using machine learning on Ubuntu 24.04 with GPU acceleration. The system combines traditional rule-based detection with machine learning (ML) classification for improved accuracy. The GPU acceleration significantly speeds up both training and inference, making it practical for real-world deployment.
### PCI Hosting Reviews: Choosing a Host for Secure Online Business in 2025
Credit and debit card payments accounted for approximately 62% of all financial transactions completed in the United States in 2023, and there is evidence to suggest a clear and continuing trend away from cash and towards card payments.
Whatever your views are on this change, it's clear that credit card usage, in particular, has seen significant growth, nearly doubling its share since 2016. Securely handling credit or debit card transactions is now more critical than ever for your business.
Guaranteed security is essential when handling card payments, making Payment Card Industry Data Security Standard (PCI DSS) compliance vital.
Here's what you'll learn in this article:
Discover why PCI DSS compliance is so important for security.
Understand the basics of PCI DSS and its relevance.
Explore the specifics of PCI Hosting.
Learn how PCI-compliant hosting providers protect sensitive cardholder data.
Identify what to look for when choosing your next hosting provider.
Armed with this information, you will be able to choose the best PCI-compliant hosting provider for your business needs.
What Is PCI Compliance?
The PCI Security Standards Council was formed by major credit card companies, including Visa, Mastercard, American Express, Discover, and JCB. Together, they created the PCI Data Security Standard (PCI DSS) to ensure that any business that accepts, processes, stores, or transmits credit card information does so in a secure IT environment.
What Are the 12 PCI-DSS Requirements?
The PCI DSS framework consists of 12 core requirements for businesses to become PCI-compliant. These are broadly split into six goals:
Goal 1: Build and Maintain a Secure Network System:
Firewalls: Install and maintain firewalls to protect card data.
No Defaults: Change vendor-supplied default passwords and security settings.
Goal 2: Protect Cardholder Data:
Protect Stored Data: Secure stored cardholder data (encrypt, mask, limit storage).
Encrypt Transmission: Encrypt card data sent over public networks (using tools like SSL certificates for TLS).
Goal 3: Maintain a Vulnerability Management Program:
Anti-Malware: Use and regularly update anti-virus/anti-malware software.
Secure Development: Develop and maintain secure systems and applications (patching).
Goal 4: Implement Strong Access Control Measures:
Need-to-Know Access: Restrict card data access based on job role/need.
Unique IDs & Authentication: Assign unique IDs; use strong authentication methods (MFA).
Physical Security: Restrict physical access to cardholder data/systems.
Goal 5: Regularly Monitor and Test Networks:
Track & Monitor Access: Log and monitor all access to network resources and credit card data.
Test Security: Regularly test security systems (security audits, vulnerability scans, penetration tests).
Goal 6: Maintain an Information Security Policy:
Administrative Security Policy: Maintain an information security policy for all personnel.
Meeting these 12 PCI requirements is fundamental to achieving PCI compliance for any business that processes credit card payments. Implementing these PCI standards within your hosting environment helps create a secure environment for transactions. Maintaining compliance requires ongoing effort, often with the support and PCI assistance from your chosen hosting solutions provider.
How to Ensure PCI Compliance
Meeting these 12 requirements raises the crucial question of how best to implement them within your hosting setup. One of the best ways to achieve PCI Compliance is to outsource your cloud hosting to a provider that guarantees a PCI-compliant hosting environment.
Of course, it's possible to go it alone, but in private platforms, it is much harder to achieve PCI compliance, and it typically requires significant investment to get your hosting environment to meet the necessary standards.
PCI Hosting Providers are popular because there is no need for you to buy additional hardware; you are simply onboarded into a PCI-ready environment - an IT ecosystem that already meets the hardware-bound compliance requirements. There will still be some software controls you need to introduce, but the overwhelming majority of the hard work will already be done for you.
PCI Hosting Reviews
Choosing the right hosting company is fundamental when your business processes credit card payments. It's important to remember that not all providers offer the same level of support or infrastructure needed to ensure compliance with PCI standards.
We have reviewed 5 of the most popular hosting providers, offering our view about how each of them approaches PCI-compliance for web hosting:
#1: Atlantic.Net
https://www.atlantic.net/pci-compliant-hosting/
With over 30 years in the industry, Atlantic.Net is an established hosting provider specializing in secure and compliant cloud, dedicated, and colocation solutions, particularly known for its expertise in managed services and especially in HIPAA and PCI DSS compliance.
Compliance Approach:
Offers PCI-Compliant Hosting solutions on Cloud VPS hosting and dedicated hosting plans.
Provides a PCI-ready environment built upon SOC 2 and SOC 3 certified infrastructure.
Achieving full PCI compliance requires customer configuration (shared responsibility model), aided by Atlantic.Net's managed services.
Key Features & Advantages:
Extensive managed services suite focused on security (Managed Firewall, IPS, Encrypted VPN, MFA, Anti-Malware, WAF, DDoS protection).
Offers secure off-site backups (Managed Veeam).
Provides vulnerability scanning options and expert PCI guidance/architecture assessments.
Audited infrastructure (SOC 2/3, HIPAA) provides a strong foundation for protecting sensitive data and customer data.
Boasts 30+ years of experience and 24/7 expert support.
Includes a 100% Uptime SLA.
Suitability:
Excellent choice for businesses needing highly secure hosting, scalable (Cloud VPS, dedicated servers), and compliant (PCI/HIPAA) infrastructure.
Ideal for regulated industries like healthcare and finance.
Best suited for organizations wanting comprehensive managed services to assist with the complexities of maintaining PCI compliance.
#2: AWS PCI Compliance
https://aws.amazon.com/compliance/pci-dss-level-1-faqs/
AWS is the world's most broadly adopted cloud platform, offering over 200 fully featured services from data centers globally, catering to businesses ranging from startups to large enterprises.
Compliance Approach:
Operates under a strict shared responsibility model: AWS secures the underlying cloud infrastructure (and is PCI-compliant for it); the customer secures everything they run in the cloud.
Customer is responsible for configuring their environment (OS, apps, data, networking, IAM) to meet PCI requirements.
Key Features & Advantages:
Wide range of scalable hosting solutions and advanced security features (WAF, GuardDuty, Inspector, KMS, Security Hub, Config) to aid compliance.
Provides extensive documentation, compliance reports (via AWS Artifact), and tools to help customers achieve PCI compliance.
Offers global reach and high availability.
Suitability:
Suitable for businesses of all sizes needing highly scalable, flexible infrastructure for processing payment data or handling sensitive data.
Requires significant technical expertise or reliance on AWS partners/consultants to correctly implement and maintain a compliant environment.
#3: GoDaddy
GoDaddy is one of the world's largest domain registrars and web hosting companies, known for its extensive marketing and providing a broad array of online tools typically aimed at small businesses. They do however offer a good selection of PCI compliance services which has grown in popularity.
Compliance Approach:
For standard hosting, compliance is entirely your responsibility. It is only considered achievable on VPS or Dedicated Server plans, as their shared hosting is not suitable for meeting PCI standards.
For their certified solutions (like GoDaddy Payments or their Online Store platform), they manage the technical PCI requirements of the transaction, simplifying your compliance significantly.
The responsibility for securing the server environment and passing PCI scans lies with the customer.
Key Features & Advantages:
Offers a full suite of products from domains to marketing tools and their own PCI-certified payment platforms.
Provides the necessary tools like SSL certificates and DDoS protection that form part of a compliant setup..
24/7 customer support is available to assist with general server inquiries.
Suitability:
Excellent for small businesses that use GoDaddy’s all-in-one certified e-commerce platforms, as this is the simplest path to compliance.
For those needing to build a custom compliant environment, it's a viable option only on their VPS or Dedicated Server plans and requires you to take full ownership of the configuration, scanning, and management process.
#4: Wix
Wix is a leading cloud-based development platform that allows users to create professional websites through a drag-and-drop interface, with a strong focus on e-commerce and small business solutions.
Compliance Approach:
As a Level 1 PCI DSS compliant service provider, Wix handles the technical aspects of compliance for its users.
Every website built on the Wix platform is covered by Wix's PCI certification by default. They handle all the technical requirements for securely processing transactions, regardless of which payment provider you connect to your site.
This is not a shared responsibility model in the traditional sense; Wix centrally manages the security of its entire platform, including the checkout process on your site
Key Features & Advantages:
Fully hosted platform, meaning no server management is required by the user.
Uses advanced security measures, including Transport Layer Security (TLS 1.2+ encryption) and a segregated, secure environment for all payment functions.
Automatically provides a free SSL certificate for all sites.
Security is managed centrally by Wix's dedicated expert team.
No need for users to run their own external PCI scans, as Wix's infrastructure is already certified.
Suitability:
Excellent for small businesses and entrepreneurs who want a secure, all-in-one solution for their online store without needing technical expertise.
Ideal for users who want to avoid the complexities of managing PCI DSS compliance themselves.
#5: Azure
Microsoft Azure is a leading global cloud computing platform, offering a massive collection of integrated services for building, deploying, and managing applications through Microsoft-managed data centers.
Compliance Approach:
Operates under a strict shared responsibility model. Microsoft ensures that the underlying Azure infrastructure is fully compliant with PCI DSS Level 1, the highest standard, and provides an official Attestation of Compliance (AoC) to prove it.
The customer is solely responsible for building, configuring, and managing their cloud applications and services to be compliant on top of Azure.
Azure provides a Shared Responsibility Matrix that clearly defines which PCI DSS requirements are handled by Azure and which are the customer's responsibility.
Key Features & Advantages:
A comprehensive suite of advanced security tools to support compliance, including Microsoft Defender for Cloud, Azure Firewall, Azure Key Vault, and Azure Policy.
Provides a PCI DSS Blueprint to help accelerate the deployment of a compliant environment.
Offers extensive documentation, audit reports, and global data center presence.
Suitability:
Best for medium to large enterprises and developers with the technical expertise to design and manage a secure cloud architecture.
Requires a dedicated effort or partnership with a managed service provider to implement and maintain PCI compliance correctly.
Online Payments and Hosting Services
When looking through the PCI hosting reviews mentioned above, it's important to scrutinize the required parts of the PCI compliance standards to find the best fit for your organization. Businesses approach PCI-DSS in various ways; some need a complete managed PCI-Hosting Service, others just need a particular managed service to make their existing platform compliant.
It's important to remember that one size doesn't fit all.
Here's what you should look for in your next PCI hosting provider:
Explicit Compliance Statement & Support:
Verify the provider clearly states their commitment to supporting PCI DSS compliance.
Check if they specifically offer PCI assistance or PCI guidance.
Look for providers who openly discuss their compliance stance and detail relevant services (like "PCI-Ready Hosting" or managed security).
Note providers known for this transparency (e.g., Nexcess, Atlantic.Net).
Be wary of providers who are vague or unclear about their compliance support.
Robust Security Features:
Compliance hinges on strong security. Reviews should highlight:
Firewalls: Managed hardware/software firewalls, WAFs.
Encryption: Availability of free SSL certificates, strong TLS protocols, encryption for data at rest (including backups).
Vulnerability Scanning & Patching: Do they offer or facilitate quarterly PCI scans? Proactive patching policies?
DDoS Protection: Essential for availability and security.
Secure Data Centers: Physical security, certifications (SOC 2, SOC 3, ISO 27001). Atlantic.Net, for instance, emphasizes its SOC 2/3 certified data centers.
Server Environment & Control:
Shared Hosting: Often unsuitable or challenging for achieving PCI compliance due to limited control and isolation.
VPS Hosting / Dedicated Servers: Generally better choices as they provide the necessary control and environment isolation for meeting PCI standards.
Managed WordPress Hosting: Providers can offer secure environments, but typically require payment processing via third-party services rather than direct handling on the server.
Access Levels: Evaluate the server access provided (e.g., root access vs. fully managed) and ensure it aligns with your technical needs and compliance strategy.
Technical Fit: Choose an environment that matches your team's technical skills and ability to manage compliance responsibilities.
Backup and Disaster Recovery:
Verify the availability of secure, preferably off-site backups.
Examine details regarding backup frequency and data retention policies.
Confirm if backup storage includes security measures like encryption.
Assess the provider's process for ease and reliability of data restoration.
Performance and Reliability:
Look for specific uptime guarantees, often detailed in a Service Level Agreement (SLA) – like Atlantic.Net's 100% uptime SLA.
Check independent reviews or performance benchmarks for positive feedback on speed and stability.
Remember that reliable performance impacts user experience and effective security monitoring.
Understanding Shared Responsibility:
Seek providers who are transparent about the shared responsibility model for PCI compliance.
Confirm they clearly outline which PCI requirements they handle (e.g., physical infrastructure security).
Understand which compliance responsibilities will fall to you as the merchant (e.g., application-level security, user access).
Support Quality:
Ensure the provider's support team demonstrates knowledge of PCI requirements.
Verify if they offer specific PCI assistance, such as help interpreting scan reports or addressing flagged issues.
Consider providers known for experienced, 24/7 support teams specialized in compliant hosting (e.g. Atlantic.Net).
Reading PCI hosting reviews with these points in mind helps separate providers mentioning PCI from those offering genuine, compliant-ready solutions.
Best PCI-compliant web hosting company
With the importance of selecting the right partner established, let's focus on why Atlantic.Net rises to the top for businesses prioritizing security, compliance, and support.
Here’s why Atlantic.Net stands out:
Extensive Industry Experience (30+ Years): Operating since 1994, Atlantic.Net brings over three decades of experience to the hosting sector. This extensive history demonstrates stability and provides a deep understanding of evolving technological changes and complex compliance standards, including PCI DSS.
Audited, Compliant-Ready Infrastructure: A secure infrastructure is foundational for compliance. Atlantic.Net utilizes data centers independently audited and certified against SOC 2 Type II and SOC 3 Type II standards. This verified foundation ensures clients build upon infrastructure meeting rigorous security controls essential for supporting PCI DSS and HIPAA compliance initiatives.
Simplified Compliance via Managed Security: Achieving and maintaining PCI compliance can be difficult. Atlantic.Net facilitates this through a comprehensive suite of optional managed security services—including managed firewalls, Intrusion Prevention Systems (IPS), secure backups, WAF, DDoS protection, anti-malware, and vulnerability scan assistance. By offloading these critical security management tasks, clients can allocate more resources to their core business objectives.
Expert 24/7 Customer Support: Reliable and knowledgeable support is crucial. Atlantic.Net provides expert assistance available 24/7/365 via phone and email, frequently recognized for responsiveness and informed guidance. Beyond standard technical support, their team offers valuable compliance insights and IT architecture advice, aiding clients in navigating complex PCI requirements effectively.
Flexible, High-Performance Hosting Platforms: Atlantic.Net delivers flexible hosting solutions, such as scalable Cloud VPS and high-performance Dedicated Servers, to meet diverse operational needs. These services are engineered for performance and reliability, underscored by a 100% Uptime Service Level Agreement (SLA) ensuring availability for critical applications.
Trusted Choice for Regulated Industries: Atlantic.Net's focused approach to addressing demanding regulatory requirements has established it as a trusted provider within sensitive industries. Their specialization in supporting PCI DSS and HIPAA compliance makes them a recognized choice for organizations in e-commerce, finance, and healthcare requiring validated security and compliance measures.
Take the critical next step towards fully secure and compliant hosting for your payment processing needs. Learn more about Atlantic.Net's specific PCI-ready solutions today. See how our certified infrastructure and robust managed security options can safeguard your operations and valuable customer data.
### How to Use RNN for Sequence Labeling on Ubuntu 24.04 GPU Server
Recurrent Neural Networks (RNNs) are powerful deep learning models, particularly well-suited for sequence labeling tasks such as named entity recognition, part-of-speech tagging, or speech recognition. When combined with GPU acceleration, RNNs can process sequences much faster than on CPUs alone.
In this guide, we'll walk through setting up an Ubuntu 24.04 GPU server for sequence labeling tasks using RNNs with Python and TensorFlow/Keras.
Prerequisites
An Ubuntu 24.04 server with an NVIDIA GPU.
A non-root user with sudo privileges.
NVIDIA drivers installed.
Compatible NVIDIA CUDA Toolkit and cuDNN library installed.
Step 1: Setting Up the Environment
First, let's install the necessary system packages and create a Python virtual environment.
1. Install required system packages.
apt install -y python3-pip python3-dev python3-venv build-essential libcupti-dev git wget unzip
2. Create and activate a Python virtual environment.
python3 -m venv rnn_env
source rnn_env/bin/activate
3. Upgrade pip and install the required Python packages.
pip install --upgrade pip
pip install tensorflow numpy pandas matplotlib scikit-learn seqeval
4. Let's check that TensorFlow can detect your GPU.
python3 -c "import tensorflow as tf; print('Num GPUs:', len(tf.config.list_physical_devices('GPU')))"
Output.
Num GPUs: 1
Step 2: Prepare the Project Structure
1. Create a directory structure for our sequence labeling project.
mkdir -p ~/sequence_labeling/{data,models,utils}
cd ~/sequence_labeling
2. Download the dataset. We'll use the CoNLL-2003 dataset for this example.
wget https://data.deepai.org/conll2003.zip -P data/
3. Extract the downloaded file to the data directory.
unzip data/conll2003.zip -d data/
Step 3: Create Data Loading Utilities
In this section, we will create helper functions to load and preprocess the CoNLL dataset.
1. Create a data loader script to handle the dataset.
nano utils/data_loader.py
Add the following code.
import numpy as np
from tensorflow.keras.preprocessing.sequence import pad_sequences
from tensorflow.keras.utils import to_categorical
def load_conll_data(file_path):
tokens, labels = [], []
with open(file_path, 'r', encoding='utf-8') as f:
current_tokens, current_labels = [], []
for line in f:
line = line.strip()
if not line:
if current_tokens:
tokens.append(current_tokens)
labels.append(current_labels)
current_tokens, current_labels = [], []
else:
parts = line.split()
current_tokens.append(parts[0])
current_labels.append(parts[-1])
return tokens, labels
def prepare_data(train_path, test_path):
train_tokens, train_labels = load_conll_data(train_path)
test_tokens, test_labels = load_conll_data(test_path)
# Create vocabulary and label mappings
word2idx = {w: i+2 for i, w in enumerate(set([w for s in train_tokens for w in s]))}
word2idx[''] = 0
word2idx[''] = 1
label2idx = {l: i for i, l in enumerate(set([l for s in train_labels for l in s]))}
idx2label = {i: l for l, i in label2idx.items()}
# Convert tokens and labels to indices
train_sequences = [[word2idx.get(w, word2idx['']) for w in s] for s in train_tokens]
train_labels = [[label2idx[l] for l in s] for s in train_labels]
test_sequences = [[word2idx.get(w, word2idx['']) for w in s] for s in test_tokens]
test_labels = [[label2idx[l] for l in s] for s in test_labels]
# Pad sequences
max_len = max(len(s) for s in train_sequences)
train_sequences = pad_sequences(train_sequences, maxlen=max_len, padding='post')
train_labels = pad_sequences(train_labels, maxlen=max_len, padding='post')
test_sequences = pad_sequences(test_sequences, maxlen=max_len, padding='post')
test_labels = pad_sequences(test_labels, maxlen=max_len, padding='post')
# Convert labels to categorical
num_classes = len(label2idx)
train_labels = [to_categorical(i, num_classes=num_classes) for i in train_labels]
test_labels = [to_categorical(i, num_classes=num_classes) for i in test_labels]
return {
'word2idx': word2idx,
'label2idx': label2idx,
'idx2label': idx2label,
'train_sequences': train_sequences,
'train_labels': train_labels,
'test_sequences': test_sequences,
'test_labels': test_labels,
'max_len': max_len,
'num_classes': num_classes,
'vocab_size': len(word2idx)
}
This script loads and tokenizes the dataset, converts it to indexed sequences, and pads them for training.
2. Run the data loader script.
python3 utils/data_loader.py
Step 4: Build and Train the RNN Model
Here we build a BiLSTM-based sequence labeling model and train it using our processed data.
1. Create a training script.
nano train.py
Add the following training code.
import tensorflow as tf
from tensorflow.keras.models import Model
from tensorflow.keras.layers import Input, Embedding, Bidirectional, LSTM, TimeDistributed, Dense
from utils.data_loader import prepare_data
import os
import numpy as np
import pickle
def build_rnn_model(vocab_size, max_len, num_classes):
input_layer = Input(shape=(max_len,))
embedding = Embedding(input_dim=vocab_size, output_dim=128)(input_layer)
lstm = Bidirectional(LSTM(units=64, return_sequences=True))(embedding)
output = TimeDistributed(Dense(num_classes, activation='softmax'))(lstm)
model = Model(inputs=input_layer, outputs=output)
model.compile(optimizer='adam', loss='categorical_crossentropy', metrics=['accuracy'])
return model
def main():
# Prepare data
data = prepare_data('data/train.txt', 'data/test.txt')
# Build model
model = build_rnn_model(data['vocab_size'], data['max_len'], data['num_classes'])
model.summary()
# Train model
history = model.fit(
np.array(data['train_sequences']),
np.array(data['train_labels']),
validation_data=(np.array(data['test_sequences']), np.array(data['test_labels'])),
batch_size=32,
epochs=10
)
# Save model and metadata
os.makedirs('models', exist_ok=True)
model.save('models/rnn_sequence_labeler.h5')
with open('models/metadata.pkl', 'wb') as f:
pickle.dump({
'word2idx': data['word2idx'],
'label2idx': data['label2idx'],
'idx2label': data['idx2label'],
'max_len': data['max_len']
}, f)
print("Model training complete and saved to models/ directory")
if __name__ == "__main__":
main()
This script defines the RNN model and trains it using BiLSTM layers for better context understanding in both directions.
2. Run the training script.
python3 train.py
Output.
Model: "functional"
┏━━━━━━━━━━━━━━━━━━━━━━━━━━━━━━━━━━━━━━┳━━━━━━━━━━━━━━━━━━━━━━━━━━━━━┳━━━━━━━━━━━━━━━━━┓
┃ Layer (type) ┃ Output Shape ┃ Param # ┃
┡━━━━━━━━━━━━━━━━━━━━━━━━━━━━━━━━━━━━━━╇━━━━━━━━━━━━━━━━━━━━━━━━━━━━━╇━━━━━━━━━━━━━━━━━┩
│ input_layer (InputLayer) │ (None, 113) │ 0 │
├──────────────────────────────────────┼─────────────────────────────┼─────────────────┤
│ embedding (Embedding) │ (None, 113, 128) │ 3,024,128 │
├──────────────────────────────────────┼─────────────────────────────┼─────────────────┤
│ bidirectional (Bidirectional) │ (None, 113, 128) │ 98,816 │
├──────────────────────────────────────┼─────────────────────────────┼─────────────────┤
│ time_distributed (TimeDistributed) │ (None, 113, 9) │ 1,161 │
└──────────────────────────────────────┴─────────────────────────────┴─────────────────┘
Total params: 3,124,105 (11.92 MB)
Trainable params: 3,124,105 (11.92 MB)
Non-trainable params: 0 (0.00 B)
Epoch 1/10
I0000 00:00:1744894143.190118 11843 cuda_dnn.cc:529] Loaded cuDNN version 90700
1/1 ━━━━━━━━━━━━━━━━━━━━ 4s 4s/step - accuracy: 0.6667 - loss: 1.0917 - val_accuracy: 0.2222 - val_loss: 1.1006
Epoch 2/10
1/1 ━━━━━━━━━━━━━━━━━━━━ 0s 62ms/step - accuracy: 0.6667 - loss: 1.0773 - val_accuracy: 0.3333 - val_loss: 1.1023
Epoch 3/10
1/1 ━━━━━━━━━━━━━━━━━━━━ 0s 60ms/step - accuracy: 0.6667 - loss: 1.0628 - val_accuracy: 0.2222 - val_loss: 1.1041
Epoch 4/10
1/1 ━━━━━━━━━━━━━━━━━━━━ 0s 61ms/step - accuracy: 0.6667 - loss: 1.0481 - val_accuracy: 0.2222 - val_loss: 1.1062
Epoch 5/10
1/1 ━━━━━━━━━━━━━━━━━━━━ 0s 60ms/step - accuracy: 0.6667 - loss: 1.0328 - val_accuracy: 0.2222 - val_loss: 1.1084
Epoch 6/10
1/1 ━━━━━━━━━━━━━━━━━━━━ 0s 58ms/step - accuracy: 0.6667 - loss: 1.0168 - val_accuracy: 0.2222 - val_loss: 1.1110
Epoch 7/10
1/1 ━━━━━━━━━━━━━━━━━━━━ 0s 58ms/step - accuracy: 0.6667 - loss: 0.9998 - val_accuracy: 0.2222 - val_loss: 1.1139
Epoch 8/10
1/1 ━━━━━━━━━━━━━━━━━━━━ 0s 59ms/step - accuracy: 0.6667 - loss: 0.9818 - val_accuracy: 0.2222 - val_loss: 1.1173
Epoch 9/10
1/1 ━━━━━━━━━━━━━━━━━━━━ 0s 60ms/step - accuracy: 0.6667 - loss: 0.9627 - val_accuracy: 0.2222 - val_loss: 1.1212
Epoch 10/10
1/1 ━━━━━━━━━━━━━━━━━━━━ 0s 62ms/step - accuracy: 0.6667 - loss: 0.9424 - val_accuracy: 0.2222 - val_loss: 1.1257
Step 5: Evaluate the Model
This section assesses the performance of the trained model on the test data, using accuracy and classification reports.
1. Create an evaluation script.
nano test.py
Add the following code.
import tensorflow as tf
import numpy as np
import pickle
from sklearn.metrics import classification_report
from seqeval.metrics import classification_report as seqeval_report
def load_model_and_metadata():
model = tf.keras.models.load_model('models/rnn_sequence_labeler.h5')
with open('models/metadata.pkl', 'rb') as f:
metadata = pickle.load(f)
return model, metadata
def evaluate_model():
model, metadata = load_model_and_metadata()
# Reload test data
from utils.data_loader import prepare_data
data = prepare_data('data/train.txt', 'data/test.txt')
# Predict on test data
y_pred = model.predict(np.array(data['test_sequences']))
y_pred = np.argmax(y_pred, axis=-1)
y_true = np.argmax(np.array(data['test_labels']), axis=-1)
# Convert indices to labels for each sequence
true_labels = []
pred_labels = []
for i in range(len(y_true)):
true_seq = []
pred_seq = []
for j in range(len(y_true[i])):
true_label = metadata['idx2label'].get(y_true[i][j], 'O')
pred_label = metadata['idx2label'].get(y_pred[i][j], 'O')
# Skip padding tokens
if true_label != 'O' or pred_label != 'O':
true_seq.append(true_label)
pred_seq.append(pred_label)
true_labels.append(true_seq)
pred_labels.append(pred_seq)
# Print token-level classification report
print("Token-level Classification Report:")
flat_true = [label for seq in true_labels for label in seq]
flat_pred = [label for seq in pred_labels for label in seq]
print(classification_report(flat_true, flat_pred))
# Print sequence-level report (requires seqeval)
print("\nSequence-level Classification Report:")
print(seqeval_report(true_labels, pred_labels))
if __name__ == "__main__":
evaluate_model()
This script reloads the saved model and computes detailed evaluation metrics on the test set using both sklearn and seqeval libraries.
2. Run the evaluation.
python3 test.py
Step 6: Create a Prediction Script
1. Finally, let's create a script to make predictions on new text.
nano predict.py
Add the following code.
import tensorflow as tf
import numpy as np
import pickle
from tensorflow.keras.preprocessing.sequence import pad_sequences
def load_model_and_metadata():
model = tf.keras.models.load_model('models/rnn_sequence_labeler.h5')
with open('models/metadata.pkl', 'rb') as f:
metadata = pickle.load(f)
return model, metadata
def predict_sequence(text):
model, metadata = load_model_and_metadata()
tokens = text.split()
sequence = [metadata['word2idx'].get(w, metadata['word2idx']['']) for w in tokens]
padded = pad_sequences([sequence], maxlen=metadata['max_len'], padding='post')
prediction = model.predict(padded)
prediction = np.argmax(prediction, axis=-1)[0]
return [(token, metadata['idx2label'].get(idx, 'O')) for token, idx in zip(tokens, prediction)]
if __name__ == "__main__":
while True:
text = input("\nEnter text to analyze (or 'quit' to exit): ")
if text.lower() == 'quit':
break
results = predict_sequence(text)
print("\nPredicted labels:")
for token, label in results:
print(f"{token}: {label}")
This script allows users to enter a sentence and receive predicted labels for each word using the trained RNN model.
2. Test the prediction script.
python3 predict.py
You will be asked to enter the text to analyze.
Enter text to analyze (or 'quit' to exit): Microsoft is based in USA
Write the text "Microsoft is based in USA" and press the Enter key. You will see the output below.
I0000 00:00:1744894809.978962 13089 cuda_dnn.cc:529] Loaded cuDNN version 90700
1/1 ━━━━━━━━━━━━━━━━━━━━ 1s 1s/step
Predicted labels:
Microsoft: B-ORG
is: O
based: O
in: O
USA: B-LOC
Conclusion
In this guide, you learned how to set up a GPU-powered RNN model for sequence labeling tasks on an Ubuntu 24.04 server. We walked through the setup of the environment, data loading, model training, evaluation, and prediction. This comprehensive pipeline can be further enhanced with advanced techniques, such as CRF layers, attention mechanisms, or transformer-based models, to achieve even greater accuracy.
### How to Implement a Neural Network from Scratch Using CuPy on Ubuntu GPU Server
Neural networks are utilized in various intelligent technologies, including face recognition, chatbots, and recommendation systems. Most people use tools like TensorFlow or PyTorch to build them, but these tools often hide the underlying mechanisms that make them work. To truly understand how a neural network learns, it's best to build one from scratch.
In this guide, we’ll show you how to create a basic neural network using CuPy, a Python library that runs on your GPU. You’ll learn how the network makes predictions, improves itself, and trains faster using GPU power on an Ubuntu server.
Prerequisites
An Ubuntu 24.04 server with an NVIDIA GPU.
A non-root user with sudo privileges.
NVIDIA drivers installed.
CUDA Toolkit 12.x installation needed
Step 1: Set up the Environment
First, let's set up our Python environment. We'll create a virtual environment to keep our dependencies isolated.
1. Install Python and pip if not already present.
apt install python3 python3-pip python3-venv -y
2. Create and activate a virtual environment.
python3 -m venv nn-env
source nn-env/bin/activate
3. Install required packages.
pip install cupy-cuda12x matplotlib
The virtual environment ensures that our project dependencies do not conflict with system-wide Python packages. The cupy-cuda12x package is specifically optimized for CUDA 12.x.
Step 2: Neural Network Implementation
1. Create a new file, nn.py, with our neural network class. This implementation handles both forward and backward propagation.
nano nn.py
Add the below code:
import cupy as cp
class SimpleNeuralNetwork:
def __init__(self, input_size, hidden_size, output_size):
cp.random.seed(42)
self.wh = cp.random.uniform(size=(input_size, hidden_size))
self.bh = cp.zeros((1, hidden_size))
self.wo = cp.random.uniform(size=(hidden_size, output_size))
self.bo = cp.zeros((1, output_size))
def sigmoid(self, x):
return 1 / (1 + cp.exp(-x))
def sigmoid_derivative(self, x):
return x * (1 - x)
def forward(self, X):
self.hidden_input = cp.dot(X, self.wh) + self.bh
self.hidden_output = self.sigmoid(self.hidden_input)
self.final_input = cp.dot(self.hidden_output, self.wo) + self.bo
self.output = self.sigmoid(self.final_input)
return self.output
def backward(self, X, y, learning_rate):
error = y - self.output
d_output = error * self.sigmoid_derivative(self.output)
error_hidden = cp.dot(d_output, self.wo.T)
d_hidden = error_hidden * self.sigmoid_derivative(self.hidden_output)
self.wo += cp.dot(self.hidden_output.T, d_output) * learning_rate
self.bo += cp.sum(d_output, axis=0, keepdims=True) * learning_rate
self.wh += cp.dot(X.T, d_hidden) * learning_rate
self.bh += cp.sum(d_hidden, axis=0, keepdims=True) * learning_rate
return cp.mean(cp.square(error))
def save_model(self, path="model_weights"):
import os
os.makedirs(path, exist_ok=True)
cp.save(f"{path}/wh.npy", self.wh)
cp.save(f"{path}/bh.npy", self.bh)
cp.save(f"{path}/wo.npy", self.wo)
cp.save(f"{path}/bo.npy", self.bo)
def load_model(self, path="model_weights"):
self.wh = cp.load(f"{path}/wh.npy")
self.bh = cp.load(f"{path}/bh.npy")
self.wo = cp.load(f"{path}/wo.npy")
self.bo = cp.load(f"{path}/bo.npy")
The class includes methods for forward propagation, backpropagation, and model persistence. The sigmoid activation function provides non-linearity to our network.
2. Run the script.
python3 nn.py
Step 3: Training the Network
1. Create train.py to train our network on the XOR problem. This classic problem helps validate our implementation.
nano train.py
Add the below code.
import cupy as cp
import matplotlib.pyplot as plt
from nn import SimpleNeuralNetwork
# XOR dataset
X = cp.array([[0, 0],
[0, 1],
[1, 0],
[1, 1]])
y = cp.array([[0], [1], [1], [0]])
# Initialize model
nn = SimpleNeuralNetwork(input_size=2, hidden_size=4, output_size=1)
# Training parameters
epochs = 10000
lr = 0.1
losses = []
# Training loop
for epoch in range(epochs):
nn.forward(X)
loss = nn.backward(X, y, lr)
losses.append(cp.asnumpy(loss)) # Convert to NumPy for plotting
if epoch % 1000 == 0:
print(f"Epoch {epoch} – Loss: {loss:.5f}")
# Save model weights
nn.save_model()
print("Training complete. Weights saved in 'model_weights/'.")
# Plot training loss
plt.plot(losses)
plt.title("Training Loss over Epochs")
plt.xlabel("Epoch")
plt.ylabel("Loss")
plt.grid(True)
plt.savefig("training_loss.png")
plt.show()
The XOR problem is non-linearly separable, making it a perfect test for our neural network. We will track and visualize the loss over the training epochs.
2. Execute the training script with:
python3 train.py
This command initiates the training loop that optimizes our network weights. You should see the loss decreasing over time as the network learns.
Epoch 0 – Loss: 0.35371
Epoch 1000 – Loss: 0.25000
Epoch 2000 – Loss: 0.24955
Epoch 3000 – Loss: 0.24767
Epoch 4000 – Loss: 0.23425
Epoch 5000 – Loss: 0.17842
Epoch 6000 – Loss: 0.06636
Epoch 7000 – Loss: 0.02008
Epoch 8000 – Loss: 0.01001
Epoch 9000 – Loss: 0.00636
Training complete. Weights saved in 'model_weights/'.
Step 4: Testing the Network
1. Create test.py to evaluate our trained model. This verifies if our network learned the XOR function correctly:
nano test.py
Add the following code.
import cupy as cp
from nn import SimpleNeuralNetwork
# XOR input
X = cp.array([[0, 0],
[0, 1],
[1, 0],
[1, 1]])
# Load model
nn = SimpleNeuralNetwork(input_size=2, hidden_size=4, output_size=1)
nn.load_model()
# Predict
output = nn.forward(X)
print("Predicted Output:")
print(cp.round(output, 3).get()) # Move to CPU and print
2. Run the test script to see the predictions:
python3 test.py
The output shows how well our network approximates the XOR function. Values close to 0 or 1 indicate successful learning.
Predicted Output:
[[0.07 ]
[0.935]
[0.935]
[0.07 ]]
Conclusion
In this tutorial, we've successfully implemented a neural network from scratch using CuPy on an Ubuntu GPU server. By leveraging GPU acceleration through CuPy, we achieved significant performance improvements over traditional CPU-based implementations. The comprehensive solution, from environment setup to training and testing, demonstrates how accessible GPU computing can be for deep learning tasks.
### Create Your Own Emoji with Deep Learning on Ubuntu 24.04 GPU server
Emojis and avatars help show feelings without using words. They are now a big part of online chats, product reviews, and even how people connect with brands. As a result, many researchers are investigating how emojis can aid in storytelling. Thanks to new tools like computer vision and deep learning, we can now understand human emotions just by looking at images.
In this tutorial, we'll build an end-to-end system using deep learning to recognize facial expressions.
Prerequisites
An Ubuntu 24.04 server with an NVIDIA GPU.
A non-root user with sudo privileges.
NVIDIA drivers installed.
Step 1: Setting Up the Environment
1. Install Python package manager and virtual environment tools.
apt install python3-pip python3-venv
2. Create a new virtual environment called 'emojify-env'.
python3 -m venv emojify-env
3. Activate the virtual environment.
source emojify-env/bin/activate
4. Install Flask for the web interface and TensorFlow for deep learning.
pip install flask tensorflow opencv-python numpy
Step 2: Project Structure Setup
Organizing files properly is crucial for maintainability. We'll create a logical directory structure for our project.
1. Create a directory for your project.
mkdir emojify
2. Navigate to the directory that was created.
cd emojify
3. Create a static and templates directory.
mkdir templates data templates
mkdir -p static/uploads
mkdir -p static/emoji
Step 3: Dataset Preparation
Quality data is the foundation of any machine learning project. We'll use a facial expression dataset from Kaggle.
1. Download the Emojis dataset from Kaggle.
2. Copy the dataset from your local machine to the server.
scp Downloads/archive.zip root@your-server-ip:/root/
3. Unzip the downloaded file to the data directory.
unzip /root/archive.zip -d /root/emojify/data
Step 4: Model Training
The heart of our application is the deep learning model that classifies facial expressions.
1. Create the training script.
nano train.py
Add the below code.
# train.py
import numpy as np
import cv2
import tensorflow as tf
from tensorflow.keras.models import Sequential
from tensorflow.keras.layers import Conv2D, MaxPooling2D, Dropout, Flatten, Dense
from tensorflow.keras.optimizers import Adam
from tensorflow.keras.preprocessing.image import ImageDataGenerator
# Disable OpenCL for OpenCV (helps avoid unnecessary GPU warnings)
cv2.ocl.setUseOpenCL(False)
# Paths to dataset folders
train_dir = 'data/train'
val_dir = 'data/test'
# Image data generators with rescaling
train_datagen = ImageDataGenerator(rescale=1.0 / 255)
val_datagen = ImageDataGenerator(rescale=1.0 / 255)
# Load training data
train_generator = train_datagen.flow_from_directory(
train_dir,
target_size=(48, 48),
batch_size=64,
color_mode="grayscale",
class_mode='categorical'
)
# Load validation data
val_generator = val_datagen.flow_from_directory(
val_dir,
target_size=(48, 48),
batch_size=64,
color_mode="grayscale",
class_mode='categorical'
)
# Define CNN model architecture
model = Sequential([
Conv2D(32, (3, 3), activation='relu', input_shape=(48, 48, 1)),
Conv2D(64, (3, 3), activation='relu'),
MaxPooling2D(pool_size=(2, 2)),
Dropout(0.25),
Conv2D(128, (3, 3), activation='relu'),
MaxPooling2D(pool_size=(2, 2)),
Conv2D(128, (3, 3), activation='relu'),
MaxPooling2D(pool_size=(2, 2)),
Dropout(0.25),
Flatten(),
Dense(1024, activation='relu'),
Dropout(0.5),
Dense(7, activation='softmax') # 7 emotion categories
])
# Compile model with optimizer and loss function
model.compile(
loss='categorical_crossentropy',
optimizer=Adam(learning_rate=0.0001, decay=1e-6),
metrics=['accuracy']
)
# Train model
history = model.fit(
train_generator,
steps_per_epoch=train_generator.samples // train_generator.batch_size,
epochs=50,
validation_data=val_generator,
validation_steps=val_generator.samples // val_generator.batch_size
)
# Save the trained weights
model.save_weights("emotion_model.weights.h5")
print("✅ Training complete. Weights saved to 'emotion_model.weights.h5'.")
2. Run the training script.
python3 train.py
After training completes, you should see:
✅ Training complete. Weights saved to 'emotion_model.weights.h5'.
Step 5: Creating the Web Application
Now we'll build the interface that allows users to interact with our model.
1. Create and edit the Flask application file.
nano app.py
Add the following code to app.py:
# app.py
import os
import numpy as np
import cv2
from flask import Flask, request, render_template
from werkzeug.utils import secure_filename
import tensorflow as tf
from tensorflow.keras.models import Sequential
from tensorflow.keras.layers import Conv2D, MaxPooling2D, Dropout, Flatten, Dense, Input
from tensorflow.keras.optimizers import Adam
# Setup GPU memory growth (avoids memory overload)
gpus = tf.config.experimental.list_physical_devices('GPU')
if gpus:
try:
tf.config.experimental.set_memory_growth(gpus[0], True)
except RuntimeError as e:
print(e)
# Initialize Flask app
app = Flask(__name__)
app.config['UPLOAD_FOLDER'] = 'static/uploads'
os.makedirs(app.config['UPLOAD_FOLDER'], exist_ok=True)
# Load emotion model
model = Sequential()
model.add(Input(shape=(48, 48, 1)))
model.add(Conv2D(32, (3, 3), activation='relu'))
model.add(Conv2D(64, (3, 3), activation='relu'))
model.add(MaxPooling2D(pool_size=(2, 2)))
model.add(Dropout(0.25))
model.add(Conv2D(128, (3, 3), activation='relu'))
model.add(MaxPooling2D(pool_size=(2, 2)))
model.add(Conv2D(128, (3, 3), activation='relu'))
model.add(MaxPooling2D(pool_size=(2, 2)))
model.add(Dropout(0.25))
model.add(Flatten())
model.add(Dense(1024, activation='relu'))
model.add(Dropout(0.5))
model.add(Dense(7, activation='softmax'))
model.load_weights("emotion_model.weights.h5")
# Emotion labels
emotion_dict = {
0: "Angry", 1: "Disgusted", 2: "Fearful",
3: "Happy", 4: "Neutral", 5: "Sad", 6: "Surprised"
}
# Emoji image path map
emoji_paths = {
0: "static/emojis/angry.png",
1: "static/emojis/disgusted.png",
2: "static/emojis/fearful.png",
3: "static/emojis/happy.png",
4: "static/emojis/neutral.png",
5: "static/emojis/sad.png",
6: "static/emojis/surprised.png"
}
@app.route('/', methods=['GET', 'POST'])
def index():
if request.method == 'POST':
file = request.files.get('image')
if not file:
return render_template('index.html', error="No image selected.")
filename = secure_filename(file.filename)
filepath = os.path.join(app.config['UPLOAD_FOLDER'], filename)
file.save(filepath)
try:
# Load image and convert to grayscale
img = cv2.imread(filepath)
gray = cv2.cvtColor(img, cv2.COLOR_BGR2GRAY)
# Face detection
face_cascade = cv2.CascadeClassifier(
cv2.data.haarcascades + "haarcascade_frontalface_default.xml")
faces = face_cascade.detectMultiScale(gray, scaleFactor=1.3, minNeighbors=5)
if len(faces) == 0:
return render_template('index.html', image=filename, message="No face detected.")
# Take first face detected
(x, y, w, h) = faces[0]
roi_gray = gray[y:y+h, x:x+w]
roi = cv2.resize(roi_gray, (48, 48))
roi = roi.astype("float32") / 255.0
roi = np.expand_dims(np.expand_dims(roi, -1), 0)
prediction = model.predict(roi)
max_index = int(np.argmax(prediction))
emotion = emotion_dict[max_index]
emoji = emoji_paths[max_index]
return render_template('index.html', image=filename, emotion=emotion, emoji=emoji)
except Exception as e:
return render_template('index.html', error=str(e))
return render_template('index.html')
if __name__ == '__main__':
app.run(host='0.0.0.0', port=5000, debug=True)
2. Create and edit the HTML template file.
nano templates/index.html
Add the following code.
Emojify - Image Upload
📸 Emojify from Uploaded Photo
{% if image %}
Uploaded Image:
{% endif %}
{% if emotion %}
Predicted Emotion: {{ emotion }}
{% elif message %}
{{ message }}
{% elif error %}
{{ error }}
{% endif %}
Step 6: Running the Application
1. Run the Flask web application.
python3 app.py
You should see output similar to:
* Running on all addresses (0.0.0.0)
* Running on http://127.0.0.1:5000
* Running on http://your-server-ip:5000
Step 7: Test the Web Application
With everything set up, let's test our application end-to-end.
1. Open your web browser and access your application using the URL http://your-server-ip:5000/
2. Click "Browse" to select an image from your computer.
3. Click "Upload and Detect" to submit the image.
4. The system will process the image and display the original uploaded image and detected emotion (e.g., Happy, Sad, Angry)
Conclusion
In this tutorial, we have successfully built a comprehensive deep learning pipeline for facial expression recognition and emoji generation. Starting from setting up an Ubuntu 24.04 GPU server, we installed the necessary dependencies, trained a CNN model using TensorFlow, and created a user-friendly web interface with Flask.
### Language Translation with Machine Learning on Ubuntu 24.04 GPU Server
In this machine learning project, we'll develop a Language Translator application using a many-to-many encoder-decoder sequence model on an Ubuntu 24.04 GPU server. Our model will use LSTM (Long Short-Term Memory) networks to translate English text to French. This implementation leverages the power of GPU acceleration to achieve faster training and improved performance.
Prerequisites
An Ubuntu 24.04 server with an NVIDIA GPU.
A non-root user with sudo privileges.
NVIDIA drivers installed.
Step 1: Setting Up the Environment
1. First, let's install the necessary packages.
apt install python3-pip python3-tk python3-venv graphviz
2. Create a virtual environment and activate it.
python3 -m venv lang-env
source lang-env/bin/activate
3. Install Tensorflow and other packages.
pip3 install tensorflow scikit-learn numpy pydot graphviz flask
Step 2: Downloading the Dataset
A quality dataset is the foundation of any machine learning project. We'll use an English-French parallel corpus that contains aligned sentence pairs for training our translation model.
You can download it with the following command.
wget https://raw.githubusercontent.com/hitjethva/linuxbuz/master/eng-french.txt
Step 3: Building the Translation Model
The model architecture is the heart of our translation system. We'll implement an encoder-decoder LSTM network that can learn the complex patterns between English and French sentences.
1. Create a new Python file named LangTraining.py.
nano LangTraining.py
Add the following code.
# LangTraining.py
#Load all the required modules.
from tensorflow.keras.models import Model
from tensorflow.keras import models
from tensorflow.keras.utils import plot_model
from tensorflow.keras.layers import Input,LSTM,Dense
from sklearn.feature_extraction.text import CountVectorizer
import numpy as np
import pickle
#initialize all variables
input_texts=[]
target_texts=[]
input_characters=set()
target_characters=set()
#read dataset file
with open('eng-french.txt','r',encoding='utf-8') as f:
rows=f.read().split('\n')
#read first 10,000 rows from dataset
for row in rows[:10000]:
#split input and target by '\t'=tab
input_text,target_text = row.split('\t')
#add '\t' at start and '\n' at end of text.
target_text='\t' + target_text + '\n'
input_texts.append(input_text.lower())
target_texts.append(target_text.lower())
#split character from text and add in respective sets
input_characters.update(list(input_text.lower()))
target_characters.update(list(target_text.lower()))
#sort input and target characters
input_characters = sorted(list(input_characters))
target_characters = sorted(list(target_characters))
#get the total length of input and target characters
num_en_chars = len(input_characters)
num_dec_chars = len(target_characters)
#get the maximum length of input and target text.
max_input_length = max([len(i) for i in input_texts])
max_target_length = max([len(i) for i in target_texts])
def bagofcharacters(input_texts,target_texts):
#inintialize encoder , decoder input and target data.
en_in_data=[] ; dec_in_data=[] ; dec_tr_data=[]
#padding variable with first character as 1 as rest all 0.
pad_en=[1]+[0]*(len(input_characters)-1)
pad_dec=[0]*(len(target_characters)) ; pad_dec[2]=1
#countvectorizer for one hot encoding as we want to tokenize character so
#anlyzer is true and None the stopwords action.
cv=CountVectorizer(binary=True,tokenizer=lambda txt: txt.split(),stop_words=None,analyzer='char')
for i,(input_t,target_t) in enumerate(zip(input_texts,target_texts)):
#fit the input characters into the CountVectorizer function
cv_inp= cv.fit(input_characters)
#transform the input text from the help of CountVectorizer fit.
#it character present than put 1 and 0 otherwise.
en_in_data.append(cv_inp.transform(list(input_t)).toarray().tolist())
cv_tar= cv.fit(target_characters)
dec_in_data.append(cv_tar.transform(list(target_t)).toarray().tolist())
#decoder target will be one timestep ahead because it will not consider
#the first character i.e. '\t'.
dec_tr_data.append(cv_tar.transform(list(target_t)[1:]).toarray().tolist())
#add padding variable if the length of the input or target text is smaller
#than their respective maximum input or target length.
if len(input_t) < max_input_length:
for _ in range(max_input_length-len(input_t)):
en_in_data[i].append(pad_en)
if len(target_t) < max_target_length:
for _ in range(max_target_length-len(target_t)):
dec_in_data[i].append(pad_dec)
if (len(target_t)-1) < max_target_length:
for _ in range(max_target_length-len(target_t)+1):
dec_tr_data[i].append(pad_dec)
#convert list to numpy array with data type float32
en_in_data=np.array(en_in_data,dtype="float32")
dec_in_data=np.array(dec_in_data,dtype="float32")
dec_tr_data=np.array(dec_tr_data,dtype="float32")
return en_in_data,dec_in_data,dec_tr_data
#create input object of total number of encoder characters
en_inputs = Input(shape=(None, num_en_chars))
#create LSTM with the hidden dimension of 256
#return state=True as we don't want output sequence.
encoder = LSTM(256, return_state=True)
#discard encoder output and store hidden and cell state.
en_outputs, state_h, state_c = encoder(en_inputs)
en_states = [state_h, state_c]
#create input object of total number of decoder characters
dec_inputs = Input(shape=(None, num_dec_chars))
#create LSTM with the hidden dimension of 256
#return state and return sequences as we want output sequence.
dec_lstm = LSTM(256, return_sequences=True, return_state=True)
#initialize the decoder model with the states on encoder.
dec_outputs, _, _ = dec_lstm(dec_inputs, initial_state=en_states)
#Output layer with shape of total number of decoder characters
dec_dense = Dense(num_dec_chars, activation="softmax")
dec_outputs = dec_dense(dec_outputs)
#create Model and store all variables
model = Model([en_inputs, dec_inputs], dec_outputs)
pickle.dump({'input_characters':input_characters,'target_characters':target_characters,
'max_input_length':max_input_length,'max_target_length':max_target_length,
'num_en_chars':num_en_chars,'num_dec_chars':num_dec_chars},open("training_data.pkl","wb"))
#load the data and train the model
en_in_data,dec_in_data,dec_tr_data = bagofcharacters(input_texts,target_texts)
model.compile(
optimizer="adam", loss="categorical_crossentropy", metrics=["accuracy"]
)
model.fit(
[en_in_data, dec_in_data],
dec_tr_data,
batch_size=64,
epochs=200,
validation_split=0.2,
)
# Save model
model.save("s2s.keras")
#summary and model plot
model.summary()
plot_model(model, to_file='model_plot.png', show_shapes=True, show_layer_names=True)
2. Run the training script.
python3 LangTraining.py
Once training is completed, you will see the following output.
Please note the training will take several minutes to complete.
Model: "functional"
┏━━━━━━━━━━━━━━━━━━━━━━━━━━━━━━━┳━━━━━━━━━━━━━━━━━━━━━━━━━━━┳━━━━━━━━━━━━━━━━━┳━━━━━━━━━━━━━━━━━━━━━━━━━━━━┓
┃ Layer (type) ┃ Output Shape ┃ Param # ┃ Connected to ┃
┡━━━━━━━━━━━━━━━━━━━━━━━━━━━━━━━╇━━━━━━━━━━━━━━━━━━━━━━━━━━━╇━━━━━━━━━━━━━━━━━╇━━━━━━━━━━━━━━━━━━━━━━━━━━━━┩
│ input_layer (InputLayer) │ (None, None, 47) │ 0 │ - │
├───────────────────────────────┼───────────────────────────┼─────────────────┼────────────────────────────┤
│ input_layer_1 (InputLayer) │ (None, None, 67) │ 0 │ - │
├───────────────────────────────┼───────────────────────────┼─────────────────┼────────────────────────────┤
│ lstm (LSTM) │ [(None, 256), (None, │ 311,296 │ input_layer[0][0] │
│ │ 256), (None, 256)] │ │ │
├───────────────────────────────┼───────────────────────────┼─────────────────┼────────────────────────────┤
│ lstm_1 (LSTM) │ [(None, None, 256), │ 331,776 │ input_layer_1[0][0], │
│ │ (None, 256), (None, 256)] │ │ lstm[0][1], lstm[0][2] │
├───────────────────────────────┼───────────────────────────┼─────────────────┼────────────────────────────┤
│ dense (Dense) │ (None, None, 67) │ 17,219 │ lstm_1[0][0] │
└───────────────────────────────┴───────────────────────────┴─────────────────┴────────────────────────────┘
Total params: 1,980,875 (7.56 MB)
Trainable params: 660,291 (2.52 MB)
Non-trainable params: 0 (0.00 B)
Optimizer params: 1,320,584 (5.04 MB)
Step 4: Creating the GUI Application
A user-friendly interface makes our translation system accessible to end-users. We'll build a web-based interface using Flask that allows users to input English text and receive French translations.
1. Create a new file named LangTransGui.py.
nano LangTransGui.py
Add the following code.
# LangTransWeb.py
from flask import Flask, render_template, request
import pickle
import numpy as np
from sklearn.feature_extraction.text import CountVectorizer
from tensorflow.keras.models import load_model, Model
from tensorflow.keras.layers import Input
app = Flask(__name__)
# Load preprocessed data
data = pickle.load(open("training_data.pkl", "rb"))
input_characters = data['input_characters']
target_characters = data['target_characters']
max_input_length = data['max_input_length']
max_target_length = data['max_target_length']
num_en_chars = data['num_en_chars']
num_dec_chars = data['num_dec_chars']
# Prepare CountVectorizer
cv = CountVectorizer(binary=True, tokenizer=lambda txt: txt.split(), stop_words=None, analyzer='char')
# Load the trained model
model = load_model("s2s.keras")
# Build encoder model
encoder_outputs, state_h_enc, state_c_enc = model.layers[2].output
encoder_model = Model(model.input[0], [state_h_enc, state_c_enc])
# Decoder setup
decoder_state_input_h = Input(shape=(256,), name="input_3")
decoder_state_input_c = Input(shape=(256,), name="input_4")
decoder_states_inputs = [decoder_state_input_h, decoder_state_input_c]
decoder_lstm = model.layers[3]
decoder_outputs, state_h_dec, state_c_dec = decoder_lstm(
model.input[1], initial_state=decoder_states_inputs
)
decoder_states = [state_h_dec, state_c_dec]
decoder_dense = model.layers[4]
decoder_outputs = decoder_dense(decoder_outputs)
decoder_model = Model(
[model.input[1]] + decoder_states_inputs,
[decoder_outputs] + decoder_states
)
reverse_target_char_index = dict(enumerate(target_characters))
# Function to vectorize input
def vectorize_input(input_text):
en_in_data = []
pad_en = [1] + [0] * (len(input_characters) - 1)
cv_inp = cv.fit(input_characters)
en_in_data.append(cv_inp.transform(list(input_text)).toarray().tolist())
if len(input_text) < max_input_length: for _ in range(max_input_length - len(input_text)): en_in_data[0].append(pad_en) return np.array(en_in_data, dtype="float32") # Decode sequence using trained model def decode_sequence(input_seq): states_value = encoder_model.predict(input_seq) co = cv.fit(target_characters) target_seq = np.array([co.transform(list("\t")).toarray().tolist()], dtype="float32") decoded_sentence = "" stop_condition = False while not stop_condition: output_tokens, h, c = decoder_model.predict([target_seq] + states_value) sampled_token_index = np.argmax(output_tokens[0, -1, :]) sampled_char = reverse_target_char_index[sampled_token_index] decoded_sentence += sampled_char if sampled_char == "\n" or len(decoded_sentence) > max_target_length:
stop_condition = True
target_seq = np.zeros((1, 1, num_dec_chars))
target_seq[0, 0, sampled_token_index] = 1.0
states_value = [h, c]
return decoded_sentence.strip()
# Route: Home Page
@app.route("/", methods=["GET", "POST"])
def home():
translation = ""
if request.method == "POST":
input_text = request.form["input_text"]
vectorized_input = vectorize_input(input_text.lower())
translation = decode_sequence(vectorized_input)
return render_template("index.html", translation=translation)
if __name__ == "__main__":
app.run(host="0.0.0.0", port=5000, debug=True)
2. Create a templates directory and create a file inside it.
mkdir templates
nano templates/index.html
Add the below code.
Language Translator
Language Translator: English to French
{% if translation %}
Translation:
{{ translation }}
{% endif %}
Step 5: Running the Application
With all components ready, we can launch our translation service. The Flask application will serve our model through a web interface.
Run the GUI application using the command below.
python3 LangTransGui.py
You will see the following output.
* Running on all addresses (0.0.0.0)
* Running on http://127.0.0.1:5000
* Running on http://your-server-ip:5000
Press CTRL+C to quit
Step 6: Access and Test the Application
1. Now that our translation service is running. Now, open your web browser and access it using the URL http://your-server-ip:5000. You'll see a clean interface with an input field.
2. Type an English sentence like "Hello, How Are You" and click Translate.
3. The system will process your input and display the French translation.
Conclusion
This article demonstrates how to build a comprehensive English-to-French translation system using Long Short-Term Memory (LSTM) networks on Ubuntu 24.04. By leveraging GPU acceleration, we achieved efficient training of our sequence-to-sequence model, while the Flask web interface makes the technology accessible to end users.
### Atlantic.Net Launches Next-Generation Secure Block Storage: Stability, Security and Scalability Without the Guesswork
We are pleased to announce the launch of our upgraded Secure Block Storage (SBS) solution, designed to be ultra-fast, scalable, affordable, and resilient, giving peace of mind.
The latest version of our Secure Block Storage provides high-performance with automatic encryption at affordable prices. Built with 100% NVMe SSDs, Atlantic.Net’s new SBS architecture delivers lightning-fast throughput and IOPS performance for mission-critical workloads, from complex databases to enterprise backups. The upgrade introduces up to 10,000 IOPS per volume and burst throughput of 450 MB/s, while offering seamless storage scaling from 10 GB to 16 TB per volume.
Secure Block Storage v2: Key Highlights
Powered by Pure NVMe: Built entirely on high-speed NVMe SSDs, ensuring rapid data access and high throughput.
Built for Uptime: 99.999% availability design minimizes the risk of downtime or data loss.
Enhanced Security Architecture: Data is encrypted at rest and transmitted over isolated storage networks.
Scale Without Limits: Expand volumes up to 16 terabytes, attach as many as 15 volumes per cloud server, resize volumes on the fly, and easily move between cloud servers within the same region.
Local Performance, Cloud Flexibility: SBS volumes appear as locally attached block storage devices within each cloud server. Format and partition volumes for custom workload requirements.
Streamlined Backup and Recovery: Integrated snapshot functionality makes it easy to protect and recover data.
Strategic Availability: SBS v2 is launching in Atlantic.Net’s USA-EAST-1 region in Orlando, Florida. Additional regional rollouts planned.
Secure Block Storage v2 delivers straightforward, transparent pricing. Customers pay a flat rate of 10 cents per gigabyte each month. The first 50 gigabytes are free for one year; after the introductory period, standard pricing applies. The offer is available for one year from the date of customer signup.
Existing Atlantic.Net customers are receiving automatic upgrades at no extra cost. All Secure Block Storage v1 volumes have been transitioned to the new v2 platform.
Explore Secure Block Storage today at: https://www.atlantic.net/cloud-platform/block-storage.
### How to Use LLM CLI to Deploy the Deepseek Model on an Ubuntu GPU Server
Deploying large language models (LLMs) has traditionally been complex, requiring significant effort and specialized knowledge. However, tools like LLM CLI now streamline this process, making it accessible even to those new to deploying advanced AI models. Deepseek, a powerful language model known for its remarkable performance in understanding and generating human-like text, can now easily be deployed using LLM CLI on Ubuntu GPU servers.
In this tutorial, we will explain how to use LLM CLI to deploy the Deepseek model on your Ubuntu GPU server.
Prerequisites
An Ubuntu 24.04 server with an NVIDIA GPU.
A non-root user with sudo privileges.
NVIDIA drivers installed.
Step 1: Setup a Python Environment
Ubuntu’s default repositories include the Python 3.12 version, which may not support the latest LLM optimizations. We’ll use the deadsnakes PPA to install Python 3.11.
1. Add the deadsnakes PPA for Python 3.11.
add-apt-repository ppa:deadsnakes/ppa -y
2. Update package lists.
apt update
3. Install Python 3.11 along with essential tools.
apt install python3.11 python3.11-venv python3.11-distutils python3.11-dev -y
4. Create a virtual environment named 'deepseek-env'.
python3.11 -m venv deepseek-env
5. Activate the environment.
source deepseek-env/bin/activate
Step 2: Install PyTorch with CUDA 12.1 for GPU Acceleration
PyTorch with CUDA support is crucial for GPU-accelerated deep learning. We’ll install the latest stable version compatible with NVIDIA CUDA 12.1.
1. Install PyTorch with CUDA 12.1 support.
pip install torch torchvision torchaudio --index-url https://download.pytorch.org/whl/cu121
2. Install Hugging Face libraries for model loading and quantization.
pip install transformers accelerate bitsandbytes auto-gptq optimum
3. Install the LLM CLI and Llama.cpp integration.
pip install llm llm-llama-cpp llama-cpp-python
Step 3: Download the Deepseek GGUF Model
GGUF is the latest format for efficient GPU inference. We’ll download the Q5_K_M quantized version (good balance between quality & speed).
1. Create a directory to store models.
mkdir -p ~/models
2. Navigate into the models directory.
cd ~/models
3. Download the Deepseek-7B GGUF model.
wget https://huggingface.co/TheBloke/deepseek-llm-7B-chat-GGUF/resolve/main/deepseek-llm-7b-chat.Q5_K_M.gguf
4. Register the model with an alias 'deepseek-chat'.
llm llama-cpp add-model ~/models/deepseek-llm-7b-chat.Q5_K_M.gguf --alias deepseek-chat
Step 4: Run Inference with GPU Offloading
To maximize GPU utilization, we set LLAMA_CPP_GPU_LAYERS=35 (adjust based on VRAM).
Run the llm with your query.
LLAMA_CPP_GPU_LAYERS=35 llm -m deepseek-chat "What is Atlantic.Net Cloud GPU?"
Output.
llama_init_from_model: n_ctx_per_seq (4000) < n_ctx_train (4096) -- the full capacity of the model will not be utilized
Atlantic.Net Cloud GPU is a service that provides high-performance computing resources using Graphics Processing Units (GPUs) for running compute-intensive applications and workloads. GPU-based cloud computing offers significant performance gains in comparison to CPU-based systems, particularly for tasks that require a lot of graphical processing and data-intensive applications like machine learning, deep learning, data analysis, and scientific simulations.
Conclusion
You've successfully deployed the Deepseek-7B-Chat model on an Ubuntu GPU server using the llm CLI. This setup allows for efficient, GPU-accelerated inference, making it ideal for AI-powered applications.
### How to Install Open WebUI on a Cloud GPU Server
Open WebUI is a self-hosted, open-source web interface that allows large language models (LLMs) to run easily. It integrates with Ollama and OpenAI-compatible APIs, so you can add custom AI models and plugins. Whether you’re a developer, researcher or AI enthusiast, Open WebUI is a robust platform for managing and interacting with LLMs.
In this guide, you’ll learn how to install Open WebUI on an Atlantic.Net Cloud GPU instance to run LLMs.
Prerequisites
Before starting, ensure you have the following:
An Ubuntu 24.04 Cloud GPU Server with 8 GB of GPU memory.
CUDA Toolkit and cuDNN Installed.
Git installed: `sudo apt install git`
A root or sudo privileges.
Step 1: Install Ollama
Ollama is a lightweight framework for running open-source LLMs like Llama, Code Llama, Mistral, and Gemma. It provides APIs for creating, managing, and customizing models, making it an essential component for running Open WebUI. Follow these steps to install Ollama and download a sample model.
1. Download the Ollama installation script:
wget https://ollama.ai/install.sh
2. Grant execute permissions to the script:
chmod +x install.sh
3. Run the script to install Ollama:
./install.sh
Output.
>>> Installing ollama to /usr/local
>>> Downloading Linux amd64 bundle
############################################################################################################### 100.0%
>>> Creating ollama user...
>>> Adding ollama user to render group...
>>> Adding ollama user to video group...
>>> Adding current user to ollama group...
>>> Creating ollama systemd service...
>>> Enabling and starting ollama service...
Created symlink /etc/systemd/system/default.target.wants/ollama.service → /etc/systemd/system/ollama.service.
>>> NVIDIA GPU installed.
4. Enable the Ollama service to start at boot:
systemctl enable ollama
5. Start the Ollama service:
systemctl start ollama
6. Verify the Ollama service status:
systemctl status ollama
Output.
● ollama.service - Ollama Service
Loaded: loaded (/etc/systemd/system/ollama.service; enabled; preset: enabled)
Active: active (running) since Tue 2025-03-18 11:26:38 UTC; 21min ago
Main PID: 5783 (ollama)
Tasks: 31 (limit: 17886)
Memory: 5.0G (peak: 5.0G)
CPU: 27.539s
CGroup: /system.slice/ollama.service
├─5783 /usr/local/bin/ollama serve
└─6864 /usr/local/bin/ollama runner --model /usr/share/ollama/.ollama/models/blobs/sha256-6a0746a1ec1aef3e7ec53868f220ff6e389f6f8ef87a01d77c96807de94ca2aa>
Mar 18 11:44:52 ubuntu ollama[5783]: llama_init_from_model: CUDA_Host output buffer size = 2.02 MiB
Mar 18 11:44:52 ubuntu ollama[5783]: llama_init_from_model: CUDA0 compute buffer size = 560.00 MiB
Mar 18 11:44:52 ubuntu ollama[5783]: llama_init_from_model: CUDA_Host compute buffer size = 24.01 MiB
Mar 18 11:44:52 ubuntu ollama[5783]: llama_init_from_model: graph nodes = 1030
Mar 18 11:44:52 ubuntu ollama[5783]: llama_init_from_model: graph splits = 2
Mar 18 11:44:52 ubuntu ollama[5783]: time=2025-03-18T11:44:52.653Z level=INFO source=server.go:624 msg="llama runner started in 1.51 seconds"
Mar 18 11:44:53 ubuntu ollama[5783]: [GIN] 2025/03/18 - 11:44:53 | 200 | 2.827091744s | 127.0.0.1 | POST "/api/chat"
Mar 18 11:44:56 ubuntu ollama[5783]: [GIN] 2025/03/18 - 11:44:56 | 200 | 2.410066333s | 127.0.0.1 | POST "/api/chat"
Mar 18 11:44:56 ubuntu ollama[5783]: [GIN] 2025/03/18 - 11:44:56 | 200 | 256.13705ms | 127.0.0.1 | POST "/api/chat"
Mar 18 11:44:57 ubuntu ollama[5783]: [GIN] 2025/03/18 - 11:44:57 | 200 | 803.167998ms | 127.0.0.1 | POST "/api/chat"
7. Use Ollama to download a sample model, such as llama3:8b:
ollama pull llama3:8b
Step 2: Install Open WebUI
Open WebUI can be installed using Python Pip or Docker. The Pip method requires Python 3.11 or greater version.
1. Install Pythen3 and additional dependencies.
apt install python3-venv python3-pip
2. Create a Python virtual environment and activate it.
python3 -m venv venv
source venv/bin/activate
3. Install Open WebUI.
pip install open-webui
4. Upgrade the Pillow and pyopenssl modules.
pip install -U Pillow pyopenssl
5. Install additional libraries.
pip install ffmpeg uvicorn
6. Run Open WebUI and verify it starts without errors.
open-webui serve &
Output.
WARNING: CORS_ALLOW_ORIGIN IS SET TO '*' - NOT RECOMMENDED FOR PRODUCTION DEPLOYMENTS.
INFO [open_webui.env] Embedding model set: sentence-transformers/all-MiniLM-L6-v2
/root/venv/lib/python3.12/site-packages/pydub/utils.py:170: RuntimeWarning: Couldn't find ffmpeg or avconv - defaulting to ffmpeg, but may not work
warn("Couldn't find ffmpeg or avconv - defaulting to ffmpeg, but may not work", RuntimeWarning)
WARNI [langchain_community.utils.user_agent] USER_AGENT environment variable not set, consider setting it to identify your requests.
██████╗ ██████╗ ███████╗███╗ ██╗ ██╗ ██╗███████╗██████╗ ██╗ ██╗██╗
██╔═══██╗██╔══██╗██╔════╝████╗ ██║ ██║ ██║██╔════╝██╔══██╗██║ ██║██║
██║ ██║██████╔╝█████╗ ██╔██╗ ██║ ██║ █╗ ██║█████╗ ██████╔╝██║ ██║██║
██║ ██║██╔═══╝ ██╔══╝ ██║╚██╗██║ ██║███╗██║██╔══╝ ██╔══██╗██║ ██║██║
╚██████╔╝██║ ███████╗██║ ╚████║ ╚███╔███╔╝███████╗██████╔╝╚██████╔╝██║
╚═════╝ ╚═╝ ╚══════╝╚═╝ ╚═══╝ ╚══╝╚══╝ ╚══════╝╚═════╝ ╚═════╝ ╚═╝
v0.5.20 - building the best open-source AI user interface.
https://github.com/open-webui/open-webui
7. Allow the Open WebUI port 8080 via UFW.
ufw allow 8080
Step 3: Access Open WebUI
Once Open WebUI is installed, you can access it via your server IP. Follow these steps to set up an administrator account and start using the interface.
1. Access your Open WebUI using the URL http://your-server-ip:8080.
2. Click Get Started to open the web interface.
3. Create a new administrator account by entering a username, email address, and password. Then, click on Create Admin Account.
4. Enter a prompt, "What is atlantic.net?" Then click on Send to generate a response using the model. You will see the answer on the following screen.
Conclusion
Open WebUI is a powerful and flexible web interface to run large language models on your server. You’ve now installed Open WebUI on an Atlantic.Net Cloud GPU instance, configured it with Ollama and added SSL certificates. You can now customize the interface, add more models and create multiple user accounts to share your LLMs.
### How to Deploy TensorBoard on a GPU Server
TensorBoard is a visualization tool provided by TensorFlow that monitors and analyzes the training process of machine learning models. It shows loss, accuracy, and other custom values, as well as model graphs, histograms, and embeddings. Deploying TensorBoard on an Ubuntu GPU server lets you use the power of GPUs to visualize and debug your machine learning workflows.
In this guide, we’ll go through the steps to deploy TensorBoard on an Ubuntu GPU server.
Prerequisites
Before starting, ensure you have the following:
An Ubuntu 24.04 Cloud GPU Server.
CUDA Toolkit and cuDNN Installed.
A root or sudo privileges.
Step 1: Set Up a Python Virtual Environment
1. Install Python and the required dependencies.
apt install python3-venv python3-pip
2. Create a virtual environment for your project.
python3 -m venv tensor-env
3. Activate the virtual environment.
source tensor-env/bin/activate
Step 2: Install TensorFlow with GPU Support
1. Install TensorFlow.
pip install tensorflow numpy
2. Log in to the Python shell.
python3
3. Run the following Python code to ensure TensorFlow uses the GPU.
>>> import tensorflow as tf
>>> print("Num GPUs Available: ", len(tf.config.experimental.list_physical_devices('GPU')))
Output.
Num GPUs Available: 1
4. Press CTRL+D to exit from the Python shell.
Step 3: Install TensorBoard
TensorBoard is included with TensorFlow, so no additional installation is required. However, you can ensure it’s available by running:
pip install tensorboard
Step 4: Launch TensorBoard
1. Create a Python script file, for example, train_model.py.
nano train_model.py
Add the following code.
import tensorflow as tf
# Define a simple model
model = tf.keras.models.Sequential([
tf.keras.layers.Dense(10, activation='relu'),
tf.keras.layers.Dense(1, activation='sigmoid')
])
# Compile the model
model.compile(optimizer='adam', loss='binary_crossentropy', metrics=['accuracy'])
# Generate dummy data for demonstration
import numpy as np
x_train = np.random.random((1000, 10))
y_train = np.random.randint(2, size=(1000, 1))
# Create a TensorBoard callback
tensorboard_callback = tf.keras.callbacks.TensorBoard(log_dir="./logs")
# Train the model
model.fit(x_train, y_train, epochs=10, callbacks=[tensorboard_callback])
2. To train the model and generate logs, run the script using Python:
python3 train_model.py
The above command will:
Train the model for 10 epochs.
Save the training logs (including loss, accuracy, and other metrics) to the ./logs directory.
3. Once the training is complete, launch TensorBoard to visualize the logs:
tensorboard --logdir=./logs --bind_all
Output.
TensorBoard 2.19.0 at http://ubuntu:6006/ (Press CTRL+C to quit)
Step 5: Access TensorBoard
1. Open your browser and navigate to http://your-server-ip:6006. You should see the TensorBoard dashboard with tabs like Scalars, Graphs, Distributions, Histograms, etc.
2. Click on the Scalars tab to check for training metrics like loss and accuracy.
Conclusion
Deploying TensorBoard on an Ubuntu GPU server lets you visualize and monitor your machine learning workflows. This is great for teams working on machine learning projects or researchers who need to monitor long running training sessions.
### 5 Reasons a WAF Can Help You Meet PCI DSS Requirements
What Is PCI DSS?
PCI DSS, or Payment Card Industry Data Security Standard, is a set of security requirements to ensure the safe handling of credit card information by organizations. It was developed by major credit card companies, including Visa, MasterCard, American Express, Discover, and JCB. These requirements apply to any entity that processes, stores, or transmits cardholder information.
Meeting these standards is crucial for organizations to prevent data breaches and protect customer information. Compliance with PCI DSS helps maintain trust and avoid penalties associated with data theft. The PCI DSS framework consists of 12 requirements, which cover aspects like maintaining a secure network, protecting stored cardholder data, implementing strong access control measures, and regularly monitoring and testing networks.
Organizations must validate their compliance annually, which involves assessing their processes and systems for vulnerabilities. Failure to comply may result in fines or loss of the ability to process credit card payments.
What Is a WAF?
A web application firewall (WAF) is an advanced security tool that monitors and filters HTTP/HTTPS traffic between a web application and the Internet. It protects web applications from threats such as SQL injection, cross-site scripting (XSS), and other application-layer attacks. By inspecting incoming traffic, a WAF can detect and block malicious requests before they reach the application.
WAFs use predetermined security rules to identify and mitigate potential threats. They can be deployed in various configurations, including cloud-based, on-premises, or as part of a hybrid model. These solutions offer customization options to suit business needs, allowing organizations to adapt to evolving threats.
In addition to protecting against known vulnerabilities, WAFs can be updated to address new security challenges as they emerge.
5 Reasons a WAF Can Help You Meet PCI DSS Requirements
1. Protection Against Common Web Application Vulnerabilities
A web application firewall guards against common attacks such as SQL injection, cross-site scripting (XSS), and cross-site request forgery (CSRF). These vulnerabilities are frequently targeted by cybercriminals seeking to exploit weaknesses in web applications. By intercepting and filtering malicious traffic, a WAF helps ensure that these threats do not reach applications.
Deploying a WAF helps fulfill PCI DSS's objective of protecting sensitive customer data, including payment information. As these types of attacks are within the scope of PCI DSS concerns, using a WAF aligns with these compliance requirements by addressing known security flaws.
2. Compliance with PCI DSS Requirement 6.6
PCI DSS Requirement 6.6 mandates that organizations either deploy a WAF or conduct regular code reviews to identify vulnerabilities in web applications. A WAF automates security, providing continuous protection without the need for frequent manual intervention. This helps organizations demonstrate their commitment to securing the environment holding sensitive cardholder data.
Implementing a WAF relieves organizations from conducting constant code reviews, which can be resource-intensive and time-consuming. The automated nature of WAFs allows for real-time monitoring and threat detection and simplifies the compliance process by providing ongoing protection and adaptability to new threats.
3. Real-Time Threat Detection and Response
By actively monitoring web traffic, a WAF can detect anomalies and threats as they occur, blocking malicious activities before they impact the application. This proactive approach aligns with PCI DSS's requirement for maintaining a secure network by enabling quick and effective responses to potential security breaches.
Real-time response capabilities mean that threats are identified and mitigated as they happen, minimizing potential damage. This rapid reaction is crucial in a security landscape where threats evolve quickly.
4. Enhanced Data Protection and Leakage Prevention
WAFs improve data protection by preventing data leakage and unauthorized access to sensitive information. They impose stringent access controls, ensuring only legitimate traffic reaches applications, which is critical for maintaining the confidentiality and integrity of cardholder data. This capability addresses PCI DSS requirements related to data protection.
The filtering mechanisms of a WAF enable it to identify and block attempts to exfiltrate sensitive information from systems. This data leakage prevention is a benefit in meeting compliance requirements, as it ensures that sensitive information, particularly cardholder data, is well-protected.
5. Simplified Compliance Reporting and Auditing
A WAF offers simplified compliance reporting and auditing capabilities, helping organizations maintain detailed records of all security incidents and responses. PCI DSS compliance requires diligent documentation and proof of protective measures. WAFs automatically generate logs and reports, making it easier for organizations to track compliance efforts.
The automation features of WAFs reduce the manual burden of compiling security reports and performing audits. With easy access to logs, organizations can quickly produce evidence of compliance for auditors. This enables smoother audit processes and ensures that organizations can efficiently respond to any compliance-related inquiries.
Best Practices to Implement a WAF
Here are some of the ways that organizations can ensure compliance with the PCI DSS using a WAF.
1. Select an Appropriate Deployment Mode
There are several options for the deployment mode, including network-based, host-based, and cloud-based WAFs. Network-based WAFs are integrated within the network infrastructure, offering protection and high performance. Host-based WAFs are installed on the application server, providing tight integration with the application. Cloud-based options deliver scalability and ease of management without the need for extensive on-premises resources.
Each deployment mode presents distinct advantages and limitations. For example, network-based WAFs offer superior performance and are harder to bypass, while cloud-based WAFs provide flexibility and reduced infrastructure costs. When selecting a WAF, consider factors such as application architecture, scalability needs, and available resources.
2. Manage and Customize Rules Effectively
Default rule sets provide a foundational level of security but may not address all business needs or unique application threats. Customizing these rules allows organizations to tailor their WAF to detect and block threats more accurately, reducing false positives and negatives that could impact user experience or leave vulnerabilities unaddressed.
Regular updates and reviews of WAF rule sets are necessary to adapt to evolving threats. This involves assessing the current threat landscape and modifying rules to account for new attack vectors. Organizations should establish processes for continuous rule optimization, including leveraging threat intelligence and conducting vulnerability assessments.
3. Implement a Phased Deployment Strategy
By gradually introducing the WAF into production environments, organizations can monitor its impact, adjust configurations, and address any issues without major disruptions. A phased approach allows for incremental testing and validation, ensuring that the WAF integrates well with existing infrastructure and security protocols.
In a phased deployment, organizations typically start with non-critical applications, assessing the WAF’s performance and fine-tuning settings as needed. Scaling up to more critical components incrementally reduces the potential for disruptions and enables smoother adoption. This strategy also helps to identify and resolve any compatibility issues or configuration challenges early on.
4. Monitor and Maintain the WAF Continuously
Regularly updating WAF software and rules is necessary to keep it current with the latest security developments. Without ongoing attention, the effectiveness of a WAF can degrade over time, leaving applications vulnerable to new attack vectors and exploits.
Proactive monitoring involves analyzing WAF logs and alerts to detect anomalous activities or patterns that may indicate potential threats. Organizations should establish a comprehensive maintenance schedule that includes software updates, rule reviews, and performance assessments.
5. Integrate WAF Management into Organizational Processes
Integrating WAF management into organizational processes is essential for maximizing its effectiveness. This involves incorporating WAF monitoring, maintenance, and incident response activities into broader IT and security workflows. By aligning WAF operations with existing procedures, organizations can ensure a cohesive approach to cybersecurity.
An integrated WAF management strategy includes training staff on WAF operations, establishing clear communication channels for threat alerts, and documenting response protocols. This alignment improves collaboration among IT and security teams, enabling efficient threat detection and response.
### Continuous Delivery in Healthcare: Security and Compliance Best Practices
What Is Continuous Delivery?
Continuous delivery (CD) is a software development approach where teams produce software in short cycles. This methodology automates the software release process, enabling teams to deliver changes to production frequently and with confidence. The goal is to create deployable software increments that can be reliably released at any time, reducing the cost, time, and risk of delivering changes.
By emphasizing automation and immediate feedback, continuous delivery allows teams to focus on business objectives while maintaining code quality. It integrates with CI (continuous integration), which automatically tests code for defects before merging it into a central repository. This ensures that each code change is consistently ready for production.
The Regulatory Landscape in Healthcare
Healthcare software is subject to strict regulatory oversight to ensure patient safety, data integrity, and privacy.
In the United States, the Food and Drug Administration (FDA) regulates software that qualifies as a medical device, requiring compliance with frameworks such as 21 CFR Part 820 (Quality System Regulation). Similarly, software that handles patient data must comply with the Health Insurance Portability and Accountability Act (HIPAA), which sets standards for protecting sensitive patient information.
In the European Union, developers must navigate the Medical Device Regulation (MDR) and General Data Protection Regulation (GDPR). MDR classifies software based on its intended use and potential risk, imposing different levels of scrutiny. GDPR governs how personal data is collected, stored, and shared, with strict rules around consent and data processing.
These regulations often require thorough documentation, traceability of changes, and validated processes. As a result, software teams must adopt development practices that ensure automated delivery pipelines include rigorous checks for safety and regulatory alignment.
Challenges of Continuous Delivery in Healthcare
Here are some of the main potential challenges of implementing continuous delivery in the healthcare industry.
Balancing Rapid Deployment with Stringent Compliance Requirements
Healthcare regulations require rigorous validation, documentation, and approvals before any software can be released. Continuous delivery, however, is built around frequent, automated deployments. This creates a conflict: the speed of CD versus the deliberate pace of regulatory compliance.
Many regulatory frameworks require human review, documented verification steps, and formal approval processes that don't align easily with fully automated pipelines. Changes that might be pushed to production in minutes in other industries must instead go through layers of review. This can create bottlenecks unless the pipeline includes compliance gates and evidence generation.
Managing Data Privacy and Security During Automated Processes
In healthcare, even temporary exposure of sensitive data during build, test, or deployment stages can constitute a serious violation. Continuous delivery pipelines often involve multiple automated steps that move data across systems, run integration tests, and deploy code to staging environments—any of which could become a point of leakage if not tightly controlled.
Automated processes might inadvertently store logs containing protected health information (PHI), or developers might use real patient data in test environments. These risks are amplified in CD systems because they run frequently and touch many components automatically. Ensuring encryption, access controls, data anonymization, and secure storage practices throughout the pipeline is critical but difficult to implement and maintain at CD speed.
Ensuring Traceability and Auditability of Changes
Healthcare regulations require complete traceability of all changes, including who made them, why they were made, what risk they addressed, and how they were validated. Continuous delivery introduces frequent, sometimes daily, code changes, which can make traceability harder to maintain.
Automated deployments risk losing the context behind a change unless traceability is explicitly built into the development process. Standard CD tools may not log approvals, test evidence, or links to regulatory requirements without customization. As a result, teams struggle to provide sufficient audit trails for regulators, especially when under time pressure to release updates.
Best Practices for Continuous Delivery in Healthcare Compliance
Here are some of the ways that healthcare organizations can ensure compliance while implementing efficient continuous delivery pipelines.
1. Incorporating Compliance Assessments Early in the Development Lifecycle
During the planning phase, teams should collaborate with regulatory, quality assurance, and clinical experts to identify applicable standards (e.g., HIPAA, FDA 21 CFR Part 11, MDR). Each feature or user story should be mapped to compliance controls, including traceability requirements, validation needs, and documentation obligations.
Risk assessments should be conducted before development begins to determine the classification and potential impact of software changes. This informs what level of testing, documentation, and review is needed. For example, a minor UI update may require limited documentation, while a feature that affects clinical decision-making could require extensive validation.
Automated tools should be used to tag code changes with associated requirements, maintain traceability to user stories or defects, and generate documentation artifacts as part of the CI/CD pipeline. This integration of compliance reduces rework and audit risk later in the process.
2. Continuous Monitoring and Auditing of Deployed Applications
Post-deployment compliance relies on real-time visibility into how the application behaves in production. Monitoring tools should be configured to detect unauthorized access, data leaks, performance degradation, and violations of data residency rules. These tools must support the retention and secure storage of logs that meet regulatory expectations for auditability.
Logs should capture granular details such as user identities, timestamps, actions performed, and the data accessed or modified. For example, in a HIPAA-regulated system, it's essential to record which clinicians accessed patient records, for what purpose, and whether access was appropriate.
To support automated compliance auditing, monitoring systems should integrate with deployment pipelines, creating a cohesive record of what was deployed, when, by whom, and with what controls. Alerts and incident management workflows should also be in place to quickly triage and respond to compliance breaches, with a documented post-incident review process.
3. Training Development and Operations Teams on Compliance Obligations
Technical teams must understand how their work impacts regulatory compliance. This includes not only the rules themselves but also how those rules apply to their daily tasks—such as writing code, configuring infrastructure, managing data, and performing deployments.
Training should be role-specific. Developers need to know how to build features that support auditability and data privacy. Operations staff should be trained on secure deployment practices, incident handling, and the importance of preserving data integrity during rollouts or rollbacks.
Teams should also learn how to document their work in a way that supports traceability—such as linking pull requests to risk assessments or recording validation test results in an accessible format. Periodic refreshers and compliance updates help keep the knowledge current as regulations evolve.
4. Training and Awareness
A culture of compliance requires organization-wide understanding, not just technical expertise. Product managers and business leads need to grasp how compliance impacts product design, release timing, and customer communications.
Training should include overviews of key regulations, case studies of compliance failures, and workshops that simulate real-world compliance challenges. Encouraging cross-functional participation in risk assessments and audits also helps teams internalize the importance of compliance.
Organizations should also consider maintaining a compliance knowledge base with up-to-date guidelines, FAQs, and process documentation. Making this easily accessible promotes independent learning and ensures consistent application of policies.
5. Establishing Clear Policies and Procedures to Guide CD Processes
Clear, well-documented policies act as the foundation for compliant continuous delivery. These should define how software changes are proposed, reviewed, tested, approved, deployed, and monitored. Policies must be specific enough to enforce behavior, but flexible enough to accommodate iterative development.
Procedures should include gate checks at critical stages of the CD pipeline. For example, no code should be promoted to production without automated test passes, manual approval for high-risk changes, or documented validation artifacts. Each stage should produce traceable records, such as approval signatures, risk justifications, and evidence of testing.
Organizations should also formalize how they handle incidents, including predefined response steps, reporting obligations, and review processes. Policies should be regularly reviewed and updated to reflect changes in technology, regulation, or organizational structure.
### AI vs Agentic AI
Artificial intelligence (AI) is quickly integrating into our economy and workflows, and it's starting to impact and transform numerous aspects of our lives, from virtual assistants to self-driving cars. However, within the broader field of AI, there are distinct subcategories, each with its own capabilities and limitations.
This article will uncover the key differences between traditional AI, often represented by everyday generative AI tools, and the emerging field of agentic AI, particularly focusing on agentic AI vs generative AI.
Artificial Intelligence: The Foundation
Artificial intelligence, at its core, refers to the development of computer systems capable of performing repetitive tasks that typically require some level of human reasoning or intelligence. These tasks include learning, problem-solving, decision-making, and natural language understanding.
This encompasses a wide range of techniques and approaches, all aimed at creating different systems that can mimic or even surpass human cognitive abilities in specific domains.
Traditional AI and Its Subsets
Traditional AI models typically include a specific range of techniques related to various AI applications, including predefined rules, most of which you are probably already aware of:
Machine learning: A subset of AI that enables systems to learn from data without explicit programming. Machine learning models identify patterns and make predictions or decisions based on the data they are trained on. This allows AI systems to improve their performance over time as they are exposed to more data. Various algorithms and techniques fall under machine learning, such as supervised learning, unsupervised learning, and reinforcement learning.
Natural language processing (NLP): Focuses on enabling computers to understand, interpret, and generate human-style language. NLP is crucial for applications like machine translation, sentiment analysis, and chatbots. It involves techniques like text analysis, speech recognition, and natural language generation.
Computer vision: Allows computers to "see" and interpret visual information from the world. This field involves techniques like image recognition, object detection, and image processing, enabling applications like facial recognition, autonomous navigation, and medical data and image analysis.
Traditional AI has evolved through several stages. Early systems relied heavily on traditional programming, where human experts would define explicit rules for the AI to follow. While effective in well-defined tasks, these systems can struggle to adapt to new or unexpected situations. Machine learning marked a significant advancement, allowing AI systems to learn from data without the need for hand-coded rules.
Generative AI: Creating New Content
Generative AI is a subset of AI that focuses on creating new content, including complex text, images, and audio, that is similar to what humans can produce. Large language models (LLMs) are a key component of many generative AI systems. This branch of AI has opened up new possibilities in art, entertainment, and various creative industries.
Generative AI: A Closer Look
Generative AI has gained significant attention in recent years due to its ability to produce impressive results. Such models generate highly realistic and creative content, often blurring the lines between human and machine-generated outputs. The rapid progress in this field has been fueled by advancements in deep learning and the availability of vast amounts of digital data.
Large Language Models and Generative AI
Large language models (LLMs) are a type of AI model trained on vast amounts of text data. These models can generate coherent and contextually relevant text, making them suitable for various applications.
Popular examples include:
ChatGPT: Can generate human-like text for conversations, answer questions, and create different creative text formats. ChatGPT has demonstrated remarkable abilities to perform specific tasks such as writing essays, composing poems, and even generating computer code.
DALL-E 2 and Midjourney: Can create images from textual descriptions. These models can produce a wide range of artistic styles and have been used to create stunning visual content.
How Generative AI Works
Generative AI models, particularly LLMs, work by learning the underlying statistical patterns in the training data. They use techniques like deep learning to recognize patterns and build complex representations of language and other forms of provided data. When prompted with an input, the model uses its learned knowledge to generate a new output that is consistent with the training data.
Applications of Generative AI
Generative AI is hugely popular. It's hard to believe that its only been in the public domain for a few years but its usage, development, and the major investments Generative AI has attracted demonstrate that it is here to stay.
Some of the exciting applications that Generative AI can do include:
Content creation: Generating articles, blog posts, and marketing copy. This can automate content creation processes and free up human writers to focus on more strategic tasks.
Image and video generation: Creating artwork, product visualizations, and special effects. This has helped the creative industries by enabling the creation of unique and visually appealing content.
Code generation: Assisting developers in writing code. This can improve developer productivity and accelerate the software development process.
Data augmentation: Creating synthetic data to improve the performance of other AI models. This is particularly useful when dealing with limited or imbalanced datasets.
Drug discovery: Generative AI can be used to design new molecules with desired properties, potentially accelerating the development of new drugs and therapies.
Personalized medicine: These models can help tailor treatments to individual patients based on their genetic makeup and other factors.
Limitations of Generative AI
Despite its capabilities, generative AI has several limitations:
Lack of true understanding: Generative AI models primarily focus on statistical relationships in data and may not possess a genuine understanding of the content they generate. This can lead to outputs that are grammatically correct but conceptually lacking.
Bias and misinformation: Models can perpetuate biases present in the training data and may generate inaccurate or misleading information. This is a significant concern, especially in applications where accuracy and reliability are critical.
Requires constant human input: Generative AI needs prompts and instructions to guide its output. The quality of the output is highly dependent on the quality of the input prompt.
Computational cost: Training and running large generative AI models can be computationally expensive, requiring significant resources.
What Is Agentic AI?
Agentic AI is a cutting-edge field that focuses on developing AI systems capable of autonomous action to achieve specific goals. Unlike traditional AI, which often requires significant human intervention, Agentic AI systems perceive their environment, make decisions, and take actions independently.
Key Characteristics of Agentic AI
Autonomy: Agentic AI systems possess the ability to operate independently, with minimal human input, allowing them to pursue objectives and execute tasks without continuous guidance.
Goal-Oriented Behavior: These systems are designed to work towards specific, predefined goals, enabling them to proactively take steps to achieve desired outcomes.
Adaptability: Agentic AI agents can adapt to changes in their environment, learning from experiences and adjusting their behavior.
Interactivity: These agents interact with their environment, gathering information and responding to real-time events to make informed decisions.
Decision-Making: Agentic AI systems are equipped to make choices based on their understanding of the environment and their defined goals, allowing them to navigate certain complexities .
Problem-Solving: Agents can decompose complex problems into smaller, more manageable steps, using reasoning and planning to identify effective solutions.
AI Agents
At the core of Agentic AI are autonomous agents, known as AI agents. AI agents operate as an entity that perceives its environment, makes decisions, and takes actions to achieve specific goals. These agents act independently and are designed to be autonomous and goal-oriented, capable of interacting with their surroundings to achieve their objectives.
Key Features of Agentic AI Explained
Agentic AI distinguishes itself from other forms of AI, including generative AI, through several key characteristics focused on autonomous action and goal achievement:
Autonomy: Agentic AI systems exhibit a high degree of autonomy, meaning they can operate independently with minimal human input. Unlike systems that primarily react to prompts, agentic systems can make decisions and take actions without constant guidance or intervention to pursue their objectives.
Goal-Oriented Behavior: These systems are explicitly designed to pursue specific, predefined goals. They don't just respond to stimuli; they actively develop plans and strategies to work towards a defined objective, focusing on effective action and goal attainment.
Interactivity with the Environment: A defining feature is their ability to interact directly with their environment (digital or physical). They perceive their surroundings, gather real-time feedback, and adapt their behavior accordingly, allowing them to operate effectively even in dynamic and unpredictable conditions.
Proactive Decision-Making: Agentic AI systems make autonomous decisions based on their perception of the environment and their programmed goals. They evaluate different options and proactively choose the course of action most likely to lead to successful goal achievement, rather than simply reacting to direct commands.
Complex Problem-Solving & Task Handling: These systems are built to tackle complex, multi-step tasks. They can break down large problems into smaller, manageable steps, employing techniques like planning and reasoning to find solutions and navigate intricate scenarios effectively.
Adaptability & Learning: Agentic AI learns from its experiences and adapts to changes in its environment. This capability allows for performance improvement over time, leading to greater efficiency and effectiveness in achieving goals.
Proactivity: Unlike purely reactive systems (like many generative models that wait for a prompt), agentic AI can take initiative. It acts proactively to make progress towards its goals based on its internal state and environmental perception.
Summary Comparison: Generative AI vs. Agentic AI
Here is the table summarizing the core differences based on these features:
Feature
Generative AI
Agentic AI
Goal
Content creation
Goal achievement
Autonomy
Limited
High
Interaction
Primarily with data
With the environment
Task Complexity
Specific, content-focused tasks
Handle complex tasks
Decision-Making
Reactive, based on prompts
Proactive, autonomous
Key Focus
Output quality and creativity
Effective action & goal attainment
How Agentic AI Operates
Agentic AI operates through a continuous cycle of:
Perception: Gathering information from the environment through sensors or data inputs. This involves using sensors or other means to collect data about the current state of the environment.
Reasoning: Processing the information and making decisions based on predefined goals and learned knowledge. This involves using logic, planning, and other techniques to analyze the perceived information and determine the best course of action.
Action: Executing actions in the environment to achieve the desired outcome. This involves interacting with the environment to change its state and move closer to the desired goal.
Learning: Updating its knowledge and improving its decision-making process based on the outcomes of its actions. This involves using feedback from the environment to learn from past experiences and improve future performance.
This cycle continues iteratively, allowing the agent to continuously interact with its environment, learn from its experiences, and refine its behavior over time.
Examples of Agentic AI
Now you know how Agentic AI works, I bet you can think of some real-world examples.
Self-driving cars: One of the most obvious use cases is self-driving cars. Modern self-driving cars use Agentic AI to perceive their surroundings, make driving decisions, and navigate roads autonomously by using a variety of sensors, including cameras, radar, and lidar, to perceive the environment and make decisions in real-time.
Robotics: Robots equipped with Agentic AI can perform complex tasks in manufacturing, logistics, and healthcare environments. Robots can adapt to changing conditions and perform tasks with a high degree of autonomy.
Personal assistants: Advanced AI assistants can learn user preferences, anticipate needs, and proactively take actions to assist users. These assistants can go beyond simple tasks like setting reminders and answering questions to perform more complex actions like booking travel or managing finances.
Healthcare: Agentic AI can assist doctors in diagnosing diseases, developing treatment plans, and monitoring patients, potentially improving the quality and efficiency of healthcare.
Agentic AI vs. Generative AI: Key Differences
While both agentic AI and generative AI represent advancements in the field, they serve different purposes and possess distinct characteristics.
Here's a breakdown of the key differences, highlighting the paradigm shift from traditional methods to advanced AI technique :
Goal Orientation
Generative AI: Focuses on creating new content, such as text, images, or audio. Its primary goal is to generate outputs that are similar to human-created content. The emphasis is on the quality and creativity of the generated output.
Agentic AI: Focuses on achieving specific goals through autonomous actions. Its primary goal is to perceive, reason, and act in an environment to reach a desired outcome. The emphasis is on the agent's ability to achieve its objectives through its own actions.
Autonomous Systems
Generative AI: Typically operates in a reactive manner, generating outputs based on specific prompts or inputs. It has limited autonomy and does not make independent decisions. The user provides the input, and the model generates an output based on that input.
Agentic AI: Operates autonomously, making decisions and taking actions without constant human agent input. It can adapt to changing environments and pursue goals with minimal human intervention. The agent has the ability to act on its own, without requiring continuous input from a user.
Interaction with the Environment
Generative AI: Primarily interacts with data to learn patterns and generate new content. It does not actively interact with the real-world environment. The interaction is limited to the data that the model is trained on.
Agentic AI: Interacts with its environment, perceiving information and taking actions to achieve its goals. It can adapt its behavior based on real-time feedback from the environment. The agent is constantly interacting with its surroundings, gathering information, and taking actions that affect the environment.
Complexity of Tasks
Generative AI: Excels at generating content for specific tasks, such as writing articles or creating images. These tasks are typically well-defined and focused on a specific output.
Agentic AI: Designed to handle more complex tasks that require planning, decision-making, and interaction with the environment. It can perform multi step tasks and solve complex problems. These tasks often involve multiple steps and require the agent to adapt to changing circumstances.
The Role of Large Language Models in Agentic AI
Large language models (LLMs) play a crucial role in the development of agentic AI. Their ability to understand and generate natural language enables AI agents to:
Interpret user instructions: LLMs can process and understand complex instructions given by users in natural language, allowing users to communicate with AI agents in a more natural and intuitive way.
Reason about goals: LLMs can help agents reason about their goals and develop plans to achieve them. LLMs use their knowledge of language and the world to understand the implications of different actions and choose the best course of action.
Communicate with other agents: LLMs can facilitate communication and collaboration between multiple AI agents. This enables the development of complex systems where multiple agents work together to achieve a common goal.
Generate human-readable explanations: LLMs can explain the actions and decisions of AI agents in a way that humans can understand.
Provide context and knowledge: LLMs can provide AI agents with access to a vast datasets about the world, enabling them to make more informed decisions.
The Future Agentic AI Models
Agentic AI is driving the future. Imagine AI autonomously pursuing goals, transforming industries through applications like robotic process automation from logistics to healthcare. This shift from reactive tools to proactive partners, capable of making independent decisions, marks a major leap forward.
Potential Benefits of Agentic AI
Increased efficiency and productivity: Agentic artificial intelligence systems automate tasks and optimize processes, leading to significant improvements in efficiency and productivity. This can free up human workers to focus on more creative and strategic tasks.
New possibilities: Agentic AI can enable new applications and possibilities that were previously impossible with traditional AI. This can lead to breakthroughs in various fields, from healthcare to space exploration.
Solving complex problems: Agentic AI can help address some of the world's most challenging problems, such as climate change, healthcare, and poverty. By developing intelligent and autonomous systems, we can potentially find solutions to problems that have eluded us for centuries.
Enhanced decision-making: Agentic AI systems can process vast amounts of data and make more informed decisions than humans in many situations, leading to improved outcomes in various domains.
Personalized experiences: Agentic AI can learn user preferences and tailor experiences to individual needs, leading to more satisfying and effective interactions.
Challenges and Ethical Considerations
The development and deployment of Agentic AI in dynamic environments raises several challenges and ethical considerations:
Safety and reliability: Ensuring the safety and reliability of autonomous systems is crucial, especially in critical applications like autonomous driving and healthcare.
Bias and fairness: Agentic AI systems can perpetuate biases present in the data they are trained on, leading to unfair or discriminatory outcomes.
Job displacement: The automation potential of Agentic AI raises concerns about potential job displacement and the need for workforce adaptation.
Ethical concerns/decision-making: Agentic AI systems may need to make ethical decisions in complex situations, requiring careful consideration of moral principles and values.
Human oversight: The appropriate level of human oversight in autonomous systems needs to be carefully determined to balance the benefits of autonomy with the need for control and accountability. It is important to find the right balance between autonomy and human control to ensure that these systems are used responsibly.
Unintended consequences: As agentic AI systems become more complex and autonomous, there is a risk of unintended consequences that could have negative impacts on society. We need to carefully consider the potential risks and take steps to mitigate them.
Security risks: Agentic AI systems could be vulnerable to hacking or other forms of attack, potentially leading to dangerous or harmful outcomes. Robust security measures are essential to protect these systems from malicious actors.
To wrap up, it's clear from the evidence we have presented that there are clear differences between AI and Agentic AI, while generative AI creates based on instruction, agentic AI acts to achieve objectives.
This fundamental difference highlights a major leap towards more autonomous, goal-oriented artificial intelligence. The potential impact is transformative, promising unprecedented efficiency and new capabilities, yet it also demands careful consideration of ethics and safety.
As we push the boundaries of what AI can do, especially in data analysis the computational requirements skyrocket. Building and running sophisticated agentic systems relies heavily on powerful hardware foundations.
This is precisely where solutions like Atlantic.Net GPU hosting platform become critical, offering the scalable performance needed to power the development and deployment of these increasingly intelligent and autonomous technologies.
### Decoding Intelligence: AI Training vs AI Inference vs AI Reasoning
Artificial intelligence (AI) focuses on creating computer systems that are capable of performing tasks that typically require human-like intelligence. Tasks may include perception, language understanding, data analysis, and decision-making.
AI draws from a diverse set of disciplines like computer science, data quality analytics, and neuroscience to develop applications that can reason, learn, and act autonomously to achieve specific goals.
AI often involves technologies rooted in machine learning and deep learning. Ranging from predictive modeling to natural language processing, the ultimate goal is to equip machines with training AI models with reasoning capabilities that can act similarly to those of the human brain, such as solving complex problems or making informed decisions through training and inference.
Key concepts explored in this article include AI Training, AI Inference, and AI Reasoning, along with their roles in the AI Lifecycle Model's ability to learn and process data.
Understanding Core AI Concepts
First, let's examine how the core AI concepts of Machine Learning, Deep Learning, and Neural Networks enable AI systems to learn from data (training), apply that knowledge to new situations (inference), and develop capabilities for logical reasoning.
Machine Learning
Machine learning is a crucial subset of artificial intelligence where systems learn from data without explicit programming. Models use algorithms and statistical models to enable machine learning computers to identify patterns in large datasets and make predictions or recommendations.
Having this capability allows AI systems to adapt and improve performance over time when exposed to more data. The core of machine learning lies in its ability to analyze data, figure out underlying patterns, and create new patterns to forecast future predictions or classify new information.
Deep Learning
Building upon machine learning, deep learning is a specialized field that uses artificial neural networks with multiple layers to analyze complex data, including unstructured data like images and text. These neural networks enable deep learning models to learn intricate features from data using a hierarchical process.
Deep learning often requires less human intervention compared to traditional machine learning and has achieved remarkable success in tasks such as image recognition, speech recognition, and natural language processing.
Neural Networks
Neural networks are key building blocks for deep learning and many AI methods. Think of them as computer systems inspired by the human brain. They're made of many simple, connected units (called 'neurons' or 'nodes') that are arranged in layers. Information flows through these layers: starting at an 'input layer', passing through one or more 'hidden layers' for processing, and ending at an 'output layer' which gives the result.
Each connection between neurons has an associated weight that determines the strength of the signal being passed. During the learning process, these weights are adjusted to improve the network's ability to map inputs to desired outputs.
The architecture and data systems of neural networks, with their interconnected layers and adjustable weights, allow AI systems to learn complex relationships within data, essentially by creating a huge map of the data outcomes.
AI Training: Building the Intelligent Engine
AI training is the foundational process of teaching an AI model to learn from data, which involves presenting large, curated data sets to the model so it can learn about a specific topic. The training data acts as the input that the AI model analyzes to identify patterns and relationships relevant to the task it is being trained for.
For example, to train an AI model for image recognition of cats and dogs, a vast dataset of labeled images of cats and dogs would be used. The goal of AI training is to enable the AI model to accurately recognize patterns in the training data and generalize this knowledge to new, unseen data.
The training process is iterative, involving feeding the training data to the AI model, evaluating its performance, and adjusting its internal parameters to minimize errors and improve accuracy. During the training phase, the AI model learns by adjusting its internal parameters, such as the weights in a neural network, based on the input data.
For deep learning training, this adjustment is often achieved through a process called backpropagation, where the error between the model's predictions and the actual values is propagated back through the network to update the weights.
To get technical for a minute, the choice of optimization algorithms, such as Stochastic Gradient Descent (SGD) or Adam, plays a crucial role in how these internal parameters are updated. The training process continues over multiple epochs (periods of time), where each epoch represents one complete pass through the entire training data. The number of epochs and the size of the data batches used in each iteration are important hyperparameters that can affect the model's performance.
The computational demands of deep learning training are significant, often requiring specialized hardware for efficient processing. Graphics processing units (GPUs) have become essential for accelerating deep learning training due to their parallel processing capabilities, which are well-suited for the matrix operations needed to train neural networks.
Application-specific integrated circuits (ASICs), such as Google's Tensor Processing Units (TPUs), offer even greater performance and efficiency for specific AI workloads, including both deep learning training and AI inference. These specialized hardware accelerators significantly reduce the time required for the computationally intensive training process.
The quality of the training data is vital for the success of AI model training. High-quality data that is accurate, consistent, and representative of real-world scenarios is crucial for training robust and reliable AI models. Issues such as bias, missing values, and inconsistencies in the training data can lead to poor model performance and inaccurate predictions. Therefore, significant effort is often dedicated to data collection, cleaning, preprocessing, and augmentation to ensure the training data is suitable for the task.
AI Inference: Applying Learned Knowledge
AI inference is the process where a trained AI model applies its learned knowledge to make predictions or draw conclusions from new data. This occurs after the training phase, when the AI model is deployed to make predictions on unseen data based on the patterns it learned during training.
During inference, the trained neural network uses its established weights and biases to process the new data and generate an output, such as classifying an image, translating text, or predicting a future value. Unlike training, inference typically requires fewer computational resources as the model's parameters are already fixed, allowing it to conclude more efficiently.
There are two main types of AI inference: batch inference and dynamic inference.
Batch Inference: Involves processing a large volume of data offline to generate AI predictions. This approach is suitable for tasks where immediate results are not required, such as generating daily reports or updating dashboards.
Dynamic Inference: provides AI predictions on demand with low latency. This is crucial for applications like self-driving cars and facial recognition that require immediate decision-making based on streaming data.
The hardware used for AI inference can vary depending on the application requirements. While GPUs can accelerate inference, especially for large and complex models, central processing units (CPUs) are often sufficient for smaller models or inference on edge devices where power efficiency is important.
AI inference is fundamental to a wide range of AI applications. In self-driving cars, inference is used to interpret sensor data in real-time for navigation and safety. Facial recognition systems rely on inference to identify individuals from images or videos.
Other applications include:
Speech recognition
Image recognition
Object detection
Natural language processing
Medical diagnosis
Fraud detection in financial transactions
Personalized recommendations in retail
AI inference enables trained models to bring intelligence to various real-world scenarios, driving automation and improving decision-making.
AI Reasoning: The Art of Logical Deduction
AI reasoning is the process by which artificial intelligence systems use logical rules and principles to draw conclusions and derive new information from existing data. It involves analyzing information, identifying patterns, and applying logical rules to solve complex problems and make informed decisions. The goal of AI reasoning is to mimic human intelligence by enabling machines to think critically, understand context, and generate new knowledge.
Unlike AI inference, which primarily focuses on applying learned patterns to new data, AI reasoning involves a more deliberate and logical process of deduction and problem-solving.
Reasoning systems use a knowledge base that contains structured information and an inference engine that applies logical techniques like deduction, induction, and abduction to generate conclusions.
Deductive reasoning involves deriving specific conclusions from general rules, while inductive reasoning involves making generalizations from specific observations.
Abductive reasoning focuses on finding the most plausible explanation for a set of observations, even with incomplete data.
While AI reasoning strives to emulate human reasoning, there are key differences. Human reasoning often incorporates emotions, common sense, and a broad understanding of the world, whereas AI reasoning typically operates within the confines of its programmed knowledge.
AI reasoning is crucial for applications requiring complex decision-making and problem-solving. Expert systems, for example, use reasoning to provide advice and solutions in specific domains like medical diagnosis.
In natural language processing, reasoning helps AI systems understand the meaning and context of text. Robotic learning, such as in self-driving cars, utilizes reasoning to interpret complex environments and plan actions.
The main components of artificial intelligence, including learning, reasoning, problem-solving, perception, and language understanding, all contribute to the overall goal of creating machines with intelligent capabilities.
The AI Model Lifecycle
Problem Definition > Data Collection & Prep > Model Training > Evaluation > Deployment > Monitoring & Maintenance
Creating and using an AI model is a step-by-step process, like building and maintaining any important tool. This journey, often called the AI model lifecycle, starts with defining the problem the AI needs to solve. Then, we gather and prepare the right information (data) for the AI to learn from. The next big step is 'training' the AI, which is like sending it to school to learn patterns from the data – this takes time and significant computer power. After training, we test (evaluate) the AI to see how well it learned.
Once it passes the tests, the AI is ready to be put to work (deploy AI models). This is where 'inference' happens – the AI uses what it learned to make predictions or decisions on new, real-world data. But the journey doesn't end there. We constantly need to watch (monitor) the AI to make sure it's still performing well and update it as needed.
Getting AI ready for the real world has its hurdles. If the original learning data wasn't good quality or was biased, the AI might make poor decisions. Ensuring the AI is accurate and reliable is essential. Sometimes, complex AI needs a lot of computing power, making it tricky to use. Careful checks and ongoing maintenance are vital to keep the AI helpful and trustworthy over time.
Real-World Applications of AI Inference
AI inference is the engine driving numerous real-world applications across various industries.
In healthcare, AI inference plays a vital role in medical diagnosis by analyzing medical imaging data to detect diseases. It also assists in drug discovery by analyzing large datasets to identify potential drug candidates.
In the finance industry, AI inference is crucial for fraud detection by identifying unusual patterns in financial transactions.
In manufacturing, AI inference enhances quality control by enabling automated visual inspection on production lines.
Retail benefits from AI inference through personalized recommendations and optimized customer interactions.
Other applications include speech recognition, facial recognition, object detection, and natural language processing, which are integrated into various technologies we use daily. The widespread AI adoption driven by AI inference is transforming how businesses operate and interact with customers, leading to increased efficiency and innovation.
Powering Artificial Intelligence with Deep Learning Training and GPU-Accelerated Dynamic Inference
AI training, AI inference, and AI reasoning are the fundamental building blocks of intelligent systems. AI training equips models with the ability to recognize patterns from data. AI inference allows these trained models to apply their knowledge to new data for AI predictions and decision-making.
AI reasoning enables AI systems to go beyond pattern recognition by using logical rules to solve complex problems and derive new knowledge. Together, these three processes form the core of how artificial intelligence learns, acts, and understands the world.
The ongoing advancements in these areas continue to expand the possibilities of AI applications, promising to address increasingly complex tasks and drive innovation across all aspects of society.
However, unleashing the full power of these processes, especially the computationally demanding nature of deep learning training and the low-latency requirements of many inference applications, requires significant hardware capabilities.
The parallel processing power of Graphics Processing Units (GPUs) has become essential. This is where infrastructure solutions like Atlantic.Net Managed GPU Hosting, powered by NVIDIA, provide a critical advantage.
By offering scalable, on-demand access to high-performance NVIDIA GPUs within a fully managed environment, Atlantic.Net eliminates the complexity and overhead of managing specialized hardware.
Our technology can help you:
Drastically reduce AI model training times, accelerating the development lifecycle.
Efficiently run demanding AI inference workloads, enabling real-time applications.
Focus resources on innovation and AI development rather than infrastructure maintenance.
Want to learn more? Reach out to our team to discover how Atlantic.Net GPU Hosting can help your business.
### Continuous Deployment in PCI DSS Environments: Considerations and Best Practices
What Is PCI DSS?
The Payment Card Industry Data Security Standard (PCI DSS) is a framework established to ensure the secure handling of credit card information. Developed by major credit card companies, it provides a set of security standards aiming to protect cardholder data and mitigate fraud risks.
Compliance with PCI DSS is mandatory for organizations handling card transactions and involves adhering to practices like maintaining secure systems and data protection protocols. Organizations must pass regular audits and assessments to verify compliance with PCI DSS.
This process involves reviewing processes, systems, and software employed in handling cardholder data. Non-compliance can result in severe fines and damage to reputation. The standards promote a broad approach to security, requiring vigilant monitoring, and risk management practices.
What Is Continuous Deployment?
Continuous deployment (CD) automates the delivery of software updates, enabling rapid releases without manual intervention. By automatically deploying all code changes to production, CD improves the development cycle, ensuring that updates reach users faster. This process is integral to agile methodologies, where changes are pushed through testing stages to achieve integration into production environments.
Adopting CD allows organizations to respond quickly to market demands and improve software reliability through faster bug fixes and improvements. Continuous testing within the deployment pipeline helps in catching errors early, ensuring quality control. While CD increases operational efficiency, it requires rigorous testing and monitoring to maintain software stability and security across releases.
PCI DSS Requirements Relevant for Software Deployment
Here are some of the requirements that organizations must adhere to when developing software in a continuous deployment pipeline.
1. Develop and Maintain Secure Systems and Software
Organizations must ensure their software is free from vulnerabilities, utilizing development methodologies that incorporate security practices. Regular updates and patches are necessary to address emerging threats and mitigate risks, ensuring the safety and integrity of applications.
Implementing security assessments during the development process helps identify potential threats early. This involves code reviews, vulnerability scanning, and penetration testing. By integrating security into the software lifecycle, organizations can maintain compliance with PCI DSS and avoid breaches that could expose sensitive data.
2 Restrict Access to System Components and Cardholder Data by Business Need-to-Know
Restricting access to system components and cardholder data is crucial for compliance, focusing on the principle of least privilege. Only individuals whose roles require them to access sensitive information should be granted permission. This minimizes the risk of unauthorized access and potential data breaches of cardholder information.
Implementing role-based access controls helps enforce these restrictions effectively. Regular reviews and audits of access permissions are crucial to maintain this security level. Ensuring that access rights align with current roles and responsibilities prevents privilege creep, contributing to a security posture aligned with PCI DSS requirements.
3. Identify Users and Authenticate Access to System Components
Identifying users and authenticating access is fundamental in preventing unauthorized data access. PCI DSS mandates that organizations implement authentication mechanisms such as multi-factor authentication (MFA) to verify user identities. Regularly updating authentication methods in line with emerging threats ensures that data access remains secure.
User access should be monitored and logged to maintain accountability. This practice enables organizations to track who accesses system components and identify any anomalies indicative of a security breach. By maintaining stringent authentication processes, companies protect critical infrastructure and sensitive data in compliance with PCI DSS.
4. Log and Monitor All Access to System Components and Cardholder Data
Logging and monitoring access to system components and cardholder data underpins proactive security measures. PCI DSS requires logging of all access and activity to allow for effective monitoring and incident response. This helps in identifying potentially malicious activities and provides the evidence needed in forensic investigations.
Automated logging solutions can assist in capturing detailed access information and trigger alerts upon detecting suspicious activities. Continuous monitoring ensures swift identification of breaches, allowing for rapid remediation. This vigilance is crucial to maintaining the security of cardholder data and the trusted operation of systems under PCI DSS standards.
5. Test Security of Systems and Networks Regularly
Regular security testing of systems and networks is a PCI DSS mandate aimed at identifying vulnerabilities. Through periodic assessments such as vulnerability scanning and penetration testing, organizations can uncover weaknesses before they are exploited by attackers. These tests simulate real-world attacks, providing insights into potential security gaps.
By continuously updating security measures based on test findings, organizations improve their defense mechanisms. Scheduling frequent tests ensures responsiveness to evolving threats, enabling organizations to uphold PCI DSS compliance and protect sensitive data.
6. Support Information Security with Organizational Policies and Programs
Establishing programs that define security protocols and responsibilities underscores a proactive security culture. Policies should address key areas such as data protection, access control, and incident response.
Continuous training and awareness programs reinforce these policies by educating employees on security best practices. This ensures everyone understands their role in protecting sensitive data. By aligning policies with PCI DSS standards, organizations create a secure environment that anticipates and mitigates security challenges effectively.
Challenges of Implementing CD in PCI DSS Environments
Ensuring PCI DSS compliance can be challenging when using continuous deployment practices Here are some of the main issues that may arise.
1. Balancing Rapid Deployment with Stringent Security Controls
Continuous deployment requires agility, often pushing updates frequently. However, PCI DSS necessitates rigorous security measures that can sometimes slow deployment. The challenge is in maintaining this balance without compromising security or the advantages of fast deployments.
2. Ensuring Continuous Compliance Amidst Frequent Changes
Frequent software updates inherent in CD can strain compliance efforts. Each change has the potential to introduce non-compliance risks if not managed properly. Maintaining consistent documentation and change control processes is crucial for ensuring continuous compliance within PCI DSS frameworks during rapid development cycles.
3. Managing Access Controls and Authentication in Automated Pipelines
In automated pipelines, managing access controls and authentication becomes complex. Securing the pipeline is essential to prevent unauthorized deployment changes, which could compromise security. PCI DSS compliance requires stringent access management, posing a challenge when combined with the automation ethos of CD.
5 Best Practices for Continuous Deployment in PCI DSS Environments [QG1]
Here are some of the ways that organizations can overcome these challenges and ensure compliance with the PCS DSS when implementing continuous deployment.
1. Integrating Security Into the CI/CD Pipeline
To ensure PCI DSS compliance in continuous deployment, security must be tightly integrated into the CI/CD pipeline. This means shifting security left—embedding checks as early as possible in the development cycle.
Automated tools like static application security testing (SAST) and software composition analysis (SCA) should scan code and third-party libraries for vulnerabilities at build time. Dynamic application security testing (DAST) can be added later in the pipeline to detect runtime issues before production deployment.
Security gates should be enforced at each stage of the pipeline. For example, if a SAST scan detects critical issues, the pipeline should automatically block the deployment. Additionally, container security scanning and IaC policy enforcement (e.g., using tools like Checkov or OPA) should validate configuration and deployment scripts.
2. Maintaining Compliance Documentation
Continuous deployment can generate a high volume of changes, making manual documentation impractical. However, PCI DSS requires organizations to maintain detailed records of system changes, access control updates, and security validations.
To meet this requirement in a CD environment, documentation must be automated and integrated into the deployment process. CI/CD platforms should automatically log deployment metadata, including code versions, approvers, timestamps, and related test results. These logs can feed into centralized systems that maintain audit trails, enabling PCI audits.
Change management tools and ticketing systems (like Jira integrated with the pipeline) can help associate deployments with documented change requests, approvals, and validations, ensuring traceability across frequent releases.
3. Access Control and Segregation of Duties
In a continuous deployment setup, automated systems often push code to production, raising concerns around access control and separation of duties—both key PCI DSS requirements. To comply, organizations must ensure that no single individual can develop, approve, and deploy changes without oversight.
This can be enforced through CI/CD tooling by configuring pipeline stages to require multi-party approval for production deployments. Role-based access control (RBAC) must be applied to limit who can modify pipeline configurations, approve pull requests, or deploy artifacts.
Secrets management systems should be used to ensure that credentials used by the pipeline are securely stored and rotated. Clearly separating duties across development, QA, and operations functions helps minimize risk and maintain compliance.
4. Continuous Monitoring and Incident Response
Continuous deployment increases the need for real-time visibility into what’s being deployed and how it behaves in production. PCI DSS mandates that organizations log and monitor system access and activity. In a CD environment, this extends to monitoring the deployment pipeline, build artifacts, and infrastructure changes.
Automated logging of all deployment activities should be enabled and routed to a centralized log aggregation or SIEM system. Monitoring tools should track unexpected changes, failed deployments, and unusual access patterns within the pipeline. Alerts from these systems must trigger predefined incident response workflows.
For example, if a deployment includes a critical misconfiguration or bypasses a security gate, it should automatically notify the security team and halt the process. Testing the incident response plan regularly, especially in response to deployment-related threats, ensures the organization is prepared to act quickly.
5. Regular Training and Awareness
With frequent releases and automation, mistakes in the continuous deployment process can easily introduce non-compliant or insecure changes. To prevent this, all team members involved in the CI/CD workflow need targeted, ongoing training on secure development practices and PCI DSS requirements.
Training should focus on secure coding, proper use of secrets, configuration management, and interpreting the results of automated security tools. Developers should understand how insecure code can propagate quickly in a CD pipeline, while DevOps teams need awareness of access control and system hardening practices.
Regular refreshers, hands-on workshops, and post-mortems of past security incidents can reinforce awareness. Aligning training content with actual CD practices ensures it remains practical and directly applicable.
### HIPAA Compliance in the Age of AI
What Is HIPAA Compliance?
HIPAA compliance refers to adherence to the Health Insurance Portability and Accountability Act (HIPAA), a U.S. federal law enacted in 1996 to protect the privacy and security of individuals' medical information. HIPAA establishes standards for protecting protected health information (PHI), which includes any data that can identify an individual, such as medical records, billing information, or insurance details.
Compliance with HIPAA involves following its key rules:
Privacy rule: Ensures that PHI is not disclosed without the patient’s consent or knowledge, except under specific circumstances such as public health reporting.
Security rule: Requires organizations to implement administrative, physical, and technical safeguards to protect electronic PHI (ePHI).
Breach notification rule: Mandates that covered entities notify affected individuals and the Department of Health and Human Services (HHS) of data breaches.
Enforcement rule: Defines the penalties for noncompliance, which can range from monetary fines to criminal charges in severe cases.
Entities that must comply include healthcare providers, health plans, clearinghouses, and their business associates. Failure to meet these requirements can lead to legal and financial consequences.
How Do AI Technologies Impact HIPAA Compliance?
The rapid adoption of AI in healthcare has introduced both opportunities and challenges for maintaining HIPAA compliance. While AI systems offer solutions for diagnostics, treatment, and operational efficiency, their integration raises concerns around data privacy, security, and ethical use.
AI often relies on large datasets, including PHI, to train algorithms and improve performance. This creates a tension between leveraging data to improve healthcare outcomes and adhering to HIPAA's regulations. Compliance in this context requires organizations to ensure that AI systems and their data sources are designed and deployed with HIPAA standards in mind.
This includes implementing technical safeguards, such as encryption and access controls, and organizational measures like employee training and governance policies. Additionally, the use of AI amplifies the need for transparency and accountability. Organizations must document AI system functionalities, data usage, and decision-making processes.
Applications of AI in Healthcare
Here are some of the way AI is used in healthcare today.
AI in Diagnostics and Treatment Planning
AI is transforming diagnostics and treatment planning by improving accuracy, speed, and accessibility. Machine learning algorithms can analyze medical imaging data, such as X-rays, MRIs, and CT scans, to detect abnormalities like tumors or fractures. AI-powered diagnostic tools often outperform human radiologists in identifying conditions such as cancer or rare diseases at early stages.
In treatment planning, AI can analyze patient histories, genetic profiles, and clinical guidelines to recommend personalized treatment options. For example, AI systems can assist oncologists in identifying the most effective therapies for individual cancer patients based on tumor characteristics and drug interactions. Additionally, predictive analytics help clinicians anticipate complications or disease progression.
AI in Patient Data Management
AI improves the management of patient data by improving accuracy, organization, and accessibility. Natural language processing (NLP) tools can extract relevant information from unstructured medical records, making it easier for healthcare providers to retrieve and analyze patient histories. This simplifies clinical decision-making and reduces the risk of errors caused by incomplete or inconsistent data.
AI-powered data management systems also support interoperability by standardizing and integrating data from multiple sources, such as electronic health records (EHRs), wearables, and lab systems. Real-time data processing allows healthcare providers to monitor patient conditions continuously and respond promptly to changes. AI ensures that data is categorized and stored securely, adhering to HIPAA regulations, while encryption methods protect sensitive information against breaches.
Administrative Process Automation
AI can automate repetitive and time-consuming tasks, allowing staff to focus on patient care. For example, AI-driven tools can manage appointment scheduling, billing, and claims processing with minimal human intervention. These systems improve operational efficiency and reduce errors that could delay care or result in financial losses.
Another key application is prior authorization, where AI algorithms simplify the review process for insurance approvals by automatically verifying patient eligibility and matching clinical documentation with insurer requirements. Chatbots and virtual assistants further improve patient engagement by providing instant answers to queries, sending appointment reminders, or guiding patients through administrative procedures.
Tips from the expert:
Richard Bailey
Technical Editor
Richard Bailey brings over two decades of IT expertise, from traditional data centers to cutting-edge cloud solutions. As the founder of turbogeek.co.uk and a seasoned writer, he focuses on delivering authoritative content on our hosting services, HIPAA compliance, and related topics.
In my experience, here are additional tips to ensure HIPAA compliance when integrating AI into healthcare systems:
Use differential privacy for enhanced data protection: Implement differential privacy techniques to allow AI models to learn from sensitive data without exposing individual patient information. By adding controlled noise to datasets, organizations can protect PHI while maintaining model utility.
Implement role-based access controls for AI systems: Restrict access to AI platforms and datasets based on roles and responsibilities. Role-based access control ensures that only authorized personnel can view or modify sensitive data, reducing the risk of insider threats.
Conduct adversarial testing on AI models: Evaluate AI systems against potential attacks, such as adversarial inputs or data poisoning, to ensure robust performance and compliance. This proactive approach safeguards AI models from vulnerabilities that could compromise PHI.
Deploy edge AI for localized processing: Use edge AI devices to process sensitive health data locally rather than transmitting it to the cloud. This reduces exposure to breaches during transmission and aligns with HIPAA’s focus on securing PHI in transit.
Leverage blockchain for secure data logging: Integrate blockchain technology to create immutable logs of data transactions involving PHI. Blockchain ensures transparency, accountability, and tamper-proof audit trails, enhancing compliance and trust.
Challenges of AI in Relation to HIPAA Compliance
Data De-Identification
De-identification plays a central role in enabling the use of health data in AI systems while maintaining HIPAA compliance. Under HIPAA, de-identified information is not considered PHI and can therefore be used or disclosed without restriction. Covered entities and business associates can apply one of two approved methods to de-identify data:
The expert determination method involves a qualified expert applying statistical and scientific techniques to conclude that the risk of identifying an individual is very small. This determination must be documented, including the methods used and the results.
The safe harbor method requires the removal of 18 specific identifiers—such as names, full dates, and geographic locations smaller than a state—and the absence of actual knowledge that the remaining data could be used to re-identify a person.
Data Privacy Concerns
AI systems typically require vast amounts of health data to function effectively, raising significant privacy concerns. The aggregation and processing of sensitive PHI increase the risk of unauthorized access or misuse. Even when data is de-identified, there is a possibility of re-identification through advanced data-matching techniques, especially if datasets are combined with external information.
Security Vulnerabilities
The integration of AI into healthcare networks introduces new attack vectors that could jeopardize ePHI. AI systems are susceptible to hacking, data breaches, and ransomware attacks, which can lead to significant HIPAA violations. Additionally, AI's reliance on cloud-based solutions can expose sensitive data during transmission or storage if proper security protocols are not in place.
Potential for Algorithmic Bias
AI algorithms can inadvertently introduce bias into healthcare processes, leading to unequal treatment outcomes. Bias may stem from unrepresentative training data or flawed assumptions during algorithm development. For example, if an AI system is trained on data predominantly from one demographic group, its recommendations may be less accurate for other populations.
5 Best Practices for Integrating AI in Healthcare While Maintaining HIPAA Compliance
Healthcare organizations should consider the following best practices to ensure compliance with HIPAA when using AI.
1. Implement Robust Data Encryption Methods
Encryption protects data such as PHI at rest and in transit, preventing unauthorized access and breaches. Healthcare organizations must adopt encryption technologies, making them integral to AI systems to uphold the confidentiality and integrity of patient information.
Integrating encryption requires an understanding of the latest technologies and compliance standards. This includes selecting strong encryption algorithms and implementing effective key management practices. Ensuring data encryption is ingrained in the AI workflow protects sensitive information.
2. Train Staff on AI Systems and HIPAA Requirements
Training staff on AI systems and HIPAA requirements is crucial for maintaining compliance and operational integrity. Education ensures personnel understand the intricacies of AI technologies alongside the regulatory obligations of handling PHI. Regular training helps staff to responsibly engage with AI systems, augmenting security measures, and protecting patient data.
Effective training programs focus on practical skills and regulatory understanding, adapting to emerging technologies and compliance updates. Training improves awareness, enabling staff to implement best practices for data protection and risk management within AI contexts.
3. Establish Clear Data Governance Policies
Establishing clear data governance policies helps integrate AI into healthcare settings while maintaining HIPAA compliance. Governance frameworks guide how data is used, accessed, and managed, ensuring adherence to regulations and organizational standards. Strong policies establish accountability and transparency, essential for handling sensitive healthcare data.
Governance policies should outline data access permissions, usage parameters, and audit protocols to ensure compliant AI interactions. They ensure that all data transactions are meticulously recorded and monitored, enabling compliance with HIPAA standards.
4. Regularly Update and Monitor AI Systems
Regularly updating and monitoring AI systems are critical to maintaining HIPAA compliance in the ever-evolving technological landscape. Routine updates address security vulnerabilities, ensuring protection against threats to PHI. Continuous monitoring allows organizations to detect anomalies or breaches promptly, reinforcing the security of AI applications in healthcare settings.
Updates involve installing patches, improving system functionalities, and adapting to new regulatory requirements. Monitoring systems through real-time analytics and alerts helps in timely detection of non-compliant activities. This proactive approach ensures that AI tools remain secure and effective in handling patient data in alignment with HIPAA standards.
5. Engage in Continuous Compliance Auditing
Engaging in continuous compliance auditing ensures that AI applications in healthcare consistently adhere to HIPAA standards. Audits evaluate the efficacy of security measures and regulatory conformance, identifying areas needing improvement. This vigilance helps sustain data privacy and integrity, allowing AI technologies to operate safely in healthcare environments.
Auditing involves scrutinizing data handling processes, security protocols, and system interactions to detect non-compliance. Regular audits foster a culture of accountability, ensuring all aspects of AI system operations meet HIPAA's requirements.
Related content: Read our guide to HIPAA security rule
HIPAA-Compliant Hosting with Atlantic.net
Many organizations work with third parties on their data systems, particularly if they are in rigorously controlled sectors such as healthcare. Contracting with outside organizations is not simply a way to push away off-focus work; it is also a way to tap expertise that is not present in-house. When you need a healthcare website, work with organizations that are HIPAA and HITECH certified, as well as SOC 2 and SOC 3 audited, so that they are prepared to meet their obligations to the Department of Health and Human Services. See our HIPAA-compliant web hosting solutions.
### Deploying an NLP Model as a Web App on a GPU Server
Natural Language Processing (NLP) has become a key technology that helps computers understand and work with human language in recent years. NLP is used in many things like chatbots, analyzing feelings in texts, translating languages, and summarizing long articles. While creating a good NLP model is important, deploying it properly to work well for real users is just as crucial. This means ensuring the NLP system is easy to access, can handle many users at once, and works efficiently.
In this article, we will deploy an NLP model as a web application on an Ubuntu GPU server using PyTorch.
Prerequisites
Before starting, ensure you have the following:
An Ubuntu 24.04 Cloud GPU Server.
CUDA Toolkit 11.8 and cuDNN 8.6 installed. Verify with `nvidia-smi`.
curl installed: `sudo apt install curl`
Root or sudo privileges.
Step 1: Setting up the Environment
1. Install Python with additional dependencies.
apt install python3-venv python3-pip
2. Create a Python virtual environment.
python3 -m venv pytorch-env
3. Activate the virtual environment.
source pytorch-env/bin/activate
Step 2: Install PyTorch with GPU Support
1. Install PyTorch with GPU support
Note: This installation can take a significant amount of time. Verify CUDA is working: Run python3 -c "import torch; print(torch.cuda.is_available())". If it prints True, CUDA is correctly configured.
pip install torch torchvision torchaudio --extra-index-url https://download.pytorch.org/whl/cu118
2. Next, install Flask to create the web application:
pip install Flask
3. Install the transformers library if you haven't already:
pip install transformers
Step 3: Building the NLP Model
We'll use a pre-trained BERT model from the Hugging Face transformers library for text classification.
Note: BERT (Bidirectional Encoder Representations from Transformers) is a pre-trained model that has achieved state-of-the-art results in various NLP tasks. It is used here for text classification. The predicted class 0 represents the first class that the model was trained on. Without knowing the training data, it is impossible to know what that class represents.
Create a Python script to load the pre-trained model and tokenizer, and perform inference on sample text.
nano load_module.py
Add the following code.
from transformers import BertTokenizer, BertForSequenceClassification
import torch
# Load pre-trained model and tokenizer
model_name = 'bert-base-uncased'
tokenizer = BertTokenizer.from_pretrained(model_name)
model = BertForSequenceClassification.from_pretrained(model_name)
# Example input text
input_text = "This is a sample text for classification."
# Tokenize input text
inputs = tokenizer(input_text, return_tensors='pt', truncation=True, padding=True)
# Perform inference
with torch.no_grad():
outputs = model(**inputs)
logits = outputs.logits
predicted_class = torch.argmax(logits, dim=1).item()
print(f"Predicted class: {predicted_class}")
Run the script to test the model:
python3 load_module.py
Output.
Predicted class: 0
This confirms that the model is working as expected.
Step 4: Creating the Flask Web App
Create a file named app.py.
nano app.py
Add the following code.
from flask import Flask, request, jsonify
from transformers import BertTokenizer, BertForSequenceClassification
import torch
app = Flask(__name__)
# Load pre-trained model and tokenizer
model_name = 'bert-base-uncased'
tokenizer = BertTokenizer.from_pretrained(model_name)
model = BertForSequenceClassification.from_pretrained(model_name)
@app.route('/predict', methods=['POST'])
def predict():
data = request.json
input_text = data.get('text', '')
if not input_text:
return jsonify({'error': 'No text provided'}), 400
# Tokenize input text
inputs = tokenizer(input_text, return_tensors='pt', truncation=True, padding=True)
# Perform inference
with torch.no_grad():
outputs = model(**inputs)
logits = outputs.logits
predicted_class = torch.argmax(logits, dim=1).item()
return jsonify({'predicted_class': predicted_class})
if __name__ == '__main__':
app.run(host='0.0.0.0', port=5000)
Save the file and run the Flask app using the following command:
python3 app.py &
The Flask server will start on http://0.0.0.0:5000.
Step 5: Testing the Deployed Model
You can test the deployed model by sending a POST request to the /predict endpoint. Here’s how you can do it using curl.
Run the following command in your terminal:
curl -X POST http://localhost:5000/predict -H "Content-Type: application/json" -d '{"text": "This is a sample text for classification."}'
If everything is set up correctly, you should receive a JSON response like this:
{"predicted_class":0}
The predicted_class value will depend on the model's output.
Conclusion
In this article, we walked through deploying an NLP model as a web application on an Ubuntu GPU server using PyTorch and Flask. We also demonstrated how to test the deployed model by sending a POST request. By leveraging the power of GPUs, you can significantly speed up the inference time of your NLP models, making them suitable for real-time applications.
### How to Deploy OobaBooga and Use It to Run a Model on a GPU Server
OobaBooga’s Text Generation Web UI is an open-source project that simplifies deploying and interacting with large language models like GPT-J-6B. It provides a user-friendly web interface to generate text, fine-tune parameters, and experiment with different models without extensive technical expertise. Whether you are a developer, researcher, or AI enthusiast, this tool makes using LLMs on your own hardware easy.
In this guide, we will go through the steps to deploy OobaBooga and run a model on an Ubuntu GPU server.
Prerequisites
Before starting, ensure you have the following:
An Ubuntu 24.04 Cloud GPU Server with 8 GB GPU memory.
CUDA Toolkit 12.x and cuDNN 8.x installed
Git Installed: sudo apt install git
Root or sudo privilege
Step 1: Set Up the Environment
First, update your system and install the necessary dependencies:
apt update
apt install python3 python3-pip python3-venv
Next, create a Python virtual environment to isolate your project dependencies:
python3 -m venv opentext-env
source opentext-env/bin/activate
Step 2: Install PyTorch with CUDA Support
OobaBooga relies on PyTorch for model inference.
Note: This installation may take several minutes depending on your internet connection.
Verify CUDA is working: Run python3 -c "import torch; print(torch.cuda.is_available())". If it prints True, CUDA is correctly configured.
Install PyTorch with CUDA 11.8 support to enable GPU acceleration:
pip3 install torch torchvision torchaudio --index-url https://download.pytorch.org/whl/cu118
Step 3: Clone the OobaBooga Repository
Clone the OobaBooga Text Generation Web UI repository from GitHub:
git clone https://github.com/oobabooga/text-generation-webui.git
cd text-generation-webui
Install the required Python packages:
pip3 install -r requirements.txt
Step 4: Download the GPT-J-6B Model
Navigate to the models directory.
cd models
Create a folder for the GPT-J-6B model and navigate to it.
mkdir gpt-j-6B
cd gpt-j-6B
Download the necessary model files from Hugging Face:
wget https://huggingface.co/EleutherAI/gpt-j-6B/resolve/main/pytorch_model.bin
wget https://huggingface.co/EleutherAI/gpt-j-6B/resolve/main/config.json
wget https://huggingface.co/EleutherAI/gpt-j-6B/resolve/main/vocab.json
wget https://huggingface.co/EleutherAI/gpt-j-6B/resolve/main/merges.txt
Important: These files are large, so the download may take a significant amount of time. If you encounter slow download speeds or connection issues, Hugging Face's rate limiting may be in effect.
Return to the project root directory:
cd ../..
Step 5: Configure the Web UI
Copy the settings-template.yaml file to settings.yaml to create a configuration file:
cp settings-template.yaml settings.yaml
You can modify settings.yaml to customize the behavior of the web UI, but the default settings should work fine for most use cases.
Step 6: Run the Web UI
Start the OobaBooga Text Generation Web UI with the following command:
python3 server.py --listen --model models/gpt-j-6B --load-in-8bit
This command does the following:
--listen: Allows the server to be accessed from other devices on the network.
--model models/gpt-j-6B: Specifies the path to the GPT-J-6B model.
--load-in-8bit: Reduces memory usage by loading the model in 8-bit precision.
Once the server starts, you’ll see output similar to this:
15:34:00-890889 INFO Loaded "gpt-j-6B" in 38.20 seconds.
15:34:00-892683 INFO LOADER: "Transformers"
15:34:00-893366 INFO TRUNCATION LENGTH: 2048
15:34:00-893964 INFO INSTRUCTION TEMPLATE: "Alpaca"
Running on local URL: http://0.0.0.0:7860
Note: The output Running on local URL: http://0.0.0.0:7860 indicates the server is running on the Ubuntu server itself. To access it from another device, you'll use http://your_server_public_ip:7860. Also, ensure that port 7860 is open in your server's firewall. The model will take a longer time to load the first time.
Step 7: Access the Web UI
Open your web browser and navigate to http://your_server_public_ip:7860. Replace your_server_public_ip with the actual public IP address of your Ubuntu server.
Enter the prompt "What is the full form of ATM" in the text box, and click "Generate" to see the model’s output.
Conclusion
Deploying OobaBooga’s Text Generation Web UI on an Ubuntu GPU server is straightforward and unlocks the power of large language models like GPT-J-6B. Follow this guide to set up a text generation environment and start experimenting with AI-driven content creation.
### How to Run Stable Cascade model on Cloud GPU Server
Artificial Intelligence (AI) has revolutionized image generation, enabling the creation of high-quality, photorealistic images from text prompts. One of the most advanced models in this domain is Stable Cascade, developed by Stability AI. Built on the Würstchen architecture, Stable Cascade employs a three-stage (A, B, C) process to generate efficient and high-quality images.
This guide will walk you through setting up and running the Stable Cascade model on an Atlantic.Net Cloud GPU Server running Ubuntu.
What Is Stable Cascade?
Stable Cascade is a state-of-the-art text-to-image generation model that leverages a three-stage architecture for improved efficiency and image quality. The model's stages are as follows:
Stage A: The Encoder Network compresses an input image into a latent code, reducing the data size by 42x. This compressed data is stored in a low-dimensional latent space and passed to Stage B.
Stage B: The Decoder Network expands the latent code, adding details and filling in missing information before forwarding it to the Latent Generator.
Stage C: The Latent Generator combines the compressed latent code from Stage B with a text prompt to iteratively refine and generate a high-resolution image aligned with the input prompt.
Prerequisites
Before starting, ensure you have the following:
An Ubuntu 24.04 Cloud GPU Server with 20 GB GPU memory.
CUDA Toolkit 12.x and cuDNN 8.x installed
Git Installed: sudo apt install git
Root or sudo privileges.
Step 1: Setting Up the Environment
To get started, you need to set up a development environment on your Ubuntu GPU server. Follow these steps:
1. First, update your system and install the necessary dependencies:
apt update
apt install python3 python3-pip python3-venv
2. Create a virtual environment to isolate your project dependencies:
python3 -m venv stablecascade-env
source stablecascade-env/bin/activate
3. Install Jupyter Notebook to create an interactive environment for running the model:
pip install jupyter
Step 2: Installing the Stable Cascade Model
1. Clone the official Stable Cascade repository:
git clone https://github.com/Stability-AI/StableCascade.git
cd StableCascade
2. Remove an existing requirements.txt file. This is to ensure a clean install.
rm -rf requirements.txt
2. Create a new requirements.txt file.
nano requirements.txt
Add the following dependencies:
--find-links https://download.pytorch.org/whl/torch_stable.html
accelerate
torch
torchvision
transformers
numpy
kornia
insightface
opencv-python
tqdm
matplotlib
webdataset
wandb
munch
onnxruntime
einops
onnx2torch
warmup-scheduler @ git+https://github.com/ildoonet/pytorch-gradual-warmup-lr.git
torchtools @ git+https://github.com/pabloppp/pytorch-tools
3. Install the dependencies:
pip install -r requirements.txt
4. Navigate to the models directory and download the required model weights:
cd models
bash download_models.sh essential big-big bfloat16
5. Go back to your project directory.
cd ..
Step 3: Generating Images with Stable Cascade
Once the environment is set up, you can start generating images using the Stable Cascade model. Below is a step-by-step guide to implementing the model in a Jupyter Notebook.
1. Run the Jupyter Notebook server, replacing your-server-ip with the actual public IP address of your Ubuntu server. Ensure port 8888 is open in your server's firewall:
jupyter notebook --no-browser --port=8888 --ip=your-server-ip --allow-root
Output.
To access the server, open this file in a browser:
file:///root/.local/share/jupyter/runtime/jpserver-7437-open.html
Or copy and paste one of these URLs:
http://your-server-ip:8888/tree?token=6a8386b686c4131d1da9aa9b95750fdffa11e38e1ce23958
http://127.0.0.1:8888/tree?token=6a8386b686c4131d1da9aa9b95750fdffa11e38e1ce23958
2. Access the notebook using the provided URL, such as: http://your-server-ip:8888/tree?token=6a8386b686c4131d1da9aa9b95750fdffa11e38e1ce23958
3. Click on File and create a new notebook.
4. Add the below code in the notebook shell to import the necessary Python packages:
import os
import yaml
import torch
import torchvision
from tqdm import tqdm
from PIL import Image
os.chdir('/root/StableCascade/')
from inference.utils import *
from core.utils import load_or_fail
from train import WurstCoreC, WurstCoreB
This code block imports the necessary modules for file operations (os), configuration parsing (yaml), PyTorch functionalities (torch, torchvision), image processing (PIL), progress tracking (tqdm), and model-specific utility functions and classes (inference.utils, core.utils, train). The os.chdir() function changes the working directory to the Stable Cascade project folder.
5. Check if the GPU is available:
device = torch.device("cuda:0" if torch.cuda.is_available() else "cpu")
print(device)
This code checks if a GPU is available and sets the device accordingly. If a GPU is available, it will use cuda:0; otherwise, it defaults to the CPU.
6. Load the configuration files for Stage C and Stage B:
# Stage C
config_file = 'configs/inference/stage_c_3b.yaml'
with open(config_file, "r", encoding="utf-8") as file:
loaded_config = yaml.safe_load(file)
core = WurstCoreC(config_dict=loaded_config, device=device, training=False)
This step loads the YAML configuration file for Stage C, which contains model settings and parameters. The WurstCoreC class initializes the Stage C model.
7. Load the configuration file for Stage B:
# Stage B
config_file_b = 'configs/inference/stage_b_3b.yaml'
with open(config_file_b, "r", encoding="utf-8") as file:
config_file_b = yaml.safe_load(file)
core_b = WurstCoreB(config_dict=config_file_b, device=device, training=False)
Similar to Stage C, this step loads the configuration file for Stage B and initializes the model using the WurstCoreB class.
8. Prepare the Stage C model for inference:
extras = core.setup_extras_pre()
models = core.setup_models(extras)
models.generator.eval().requires_grad_(False)
print("STAGE C READY")
This code sets up the Stage C model by initializing the generator, discriminator, and tokenizer. The eval() method sets the model to evaluation mode, and requires_grad_(False) disables gradient computation to save resources.
9. Prepare the Stage B model for inference:
extras_b = core_b.setup_extras_pre()
models_b = core_b.setup_models(extras_b, skip_clip=True)
models_b = WurstCoreB.Models(
**{**models_b.to_dict(), 'tokenizer': models.tokenizer, 'text_model': models.text_model}
)
models_b.generator.bfloat16().eval().requires_grad_(False)
print("STAGE B READY")
This step prepares the Stage B model, similar to Stage C. The bfloat16() method converts the model parameters to 16-bit floating-point precision for faster computation.
10. Set the batch size and text prompt for image generation:
batch_size = 4
caption = "Anthropomorphic cat dressed as a pilot"
The batch_size determines how many images are generated in parallel. The caption variable contains the text prompt that describes the desired image.
11. Set the height and width of the generated image:
height, width = 1024, 1024
stage_c_latent_shape, stage_b_latent_shape = calculate_latent_sizes(height, width, batch_size=batch_size)
This step defines the resolution of the generated image and calculates the latent sizes for Stage C and Stage B.
12. Configure the sampling parameters for Stage C and Stage B:
# Stage C Parameters
extras.sampling_configs['cfg'] = 4
extras.sampling_configs['shift'] = 2
extras.sampling_configs['timesteps'] = 20
extras.sampling_configs['t_start'] = 1.0
# Stage B Parameters
extras_b.sampling_configs['cfg'] = 1.1
extras_b.sampling_configs['shift'] = 1
extras_b.sampling_configs['timesteps'] = 10
extras_b.sampling_configs['t_start'] = 1.0
These parameters control the sampling process during image generation, such as the number of timesteps and the guidance scale.
13. Prepare conditions and unconditional inputs for both stages:
batch = {'captions': * batch_size}
conditions = core.get_conditions(batch, models, extras, is_eval=True, is_unconditional=False, eval_image_embeds=False)
unconditions = core.get_conditions(batch, models, extras, is_eval=True, is_unconditional=True, eval_image_embeds=False)
conditions_b = core_b.get_conditions(batch, models_b, extras_b, is_eval=True, is_unconditional=False)
unconditions_b = core_b.get_conditions(batch, models_b, extras_b, is_eval=True, is_unconditional=True)
This step prepares the conditions required for generating images based on the input text prompt.
14. Disable parallelism to avoid conflicts during image generation:
os.environ["TOKENIZERS_PARALLELISM"] = "false"
This step ensures that the tokenizer runs sequentially, preventing potential issues with parallel processing.
15. . Run the image generation process, with tqdm providing a progress bar to track the sampling steps:
with torch.no_grad(), torch.cuda.amp.autocast(dtype=torch.bfloat16):
sampling_c = extras.gdf.sample(
models.generator, conditions, stage_c_latent_shape,
unconditions, device=device, **extras.sampling_configs,
)
for (sampled_c, _, _) in tqdm(sampling_c, total=extras.sampling_configs['timesteps']):
sampled_c = sampled_c
conditions_b['effnet'] = sampled_c
unconditions_b['effnet'] = torch.zeros_like(sampled_c)
sampling_b = extras_b.gdf.sample(
models_b.generator, conditions_b, stage_b_latent_shape,
unconditions_b, device=device, **extras_b.sampling_configs
)
for (sampled_b, _, _) in tqdm(sampling_b, total=extras_b.sampling_configs['timesteps']):
sampled_b = sampled_b
sampled = models_b.stage_a.decode(sampled_b).float()
This code generates the image in two stages. Stage C creates a latent representation, and Stage B decodes it into a high-resolution image. The torch.cuda.amp.autocast enables mixed-precision computation for faster processing.
16. View the generated image:
show_images(sampled)
This step displays the final image generated based on the input text prompt.
Conclusion
By following this guide, you have successfully set up and run the Stable Cascade model on an Atlantic.Net Cloud GPU Server to generate AI images. The model's three-stage architecture ensures high-quality results, and its flexibility allows for various extensions and fine-tuning options.
### Deploying Generative AI on an Ubuntu GPU Server
Generative AI has revolutionized how we create content, from text and images to music and code. Models like OpenAI's GPT, Stable Diffusion, and DALL-E have demonstrated the immense potential of generative AI. However, deploying these models efficiently requires robust hardware and software configurations, especially when leveraging GPUs for accelerated performance.
In this guide, we’ll set up a GPT-2 text generation model on an Ubuntu server with an NVIDIA GPU, using FastAPI for the backend and a simple web interface for interaction.
Prerequisites
An Ubuntu 24.04 server with an NVIDIA GPU.
A non-root user with sudo privileges.
NVIDIA drivers installed.
Step 1: Install System Dependencies
Before setting up the AI model, we must ensure the system has the required dependencies.
1. Update system packages.
apt update
2. Install Python and Pip.
apt install -y python3 python3-pip python3-venv
3. Create and activate the virtual environment.
python3 -m venv generative-ai-env
source generative-ai-env/bin/activate
Step 2: Install AI & Web Framework Dependencies
1. Create the required directories for your project.
mkdir templates static
2. Install PyTorch with GPU support.
pip install torch torchvision torchaudio --index-url https://download.pytorch.org/whl/cu118
3. Install Transformers and Tensorflow.
pip install tensorflow transformers diffusers openai
4. Install FastAPI and Uvicorn.
pip install fastapi uvicorn jinja2
Step 3: Create the HTML Frontend
We’ll build a simple interface for text generation.
Create index.html.
nano templates/index.html
Add the following code:
GPT-2 Demo
GPT-2 Text Generator
Output:
Explanation:
A textarea for user input.
A submit button to trigger generation.
JavaScript Fetch API to communicate with the backend.
Simple CSS styling for better UX.
Step 4: Create the FastAPI Backend
The backend loads the GPT-2 model and handles requests.
Create app.py file.
nano app.py
Add the following code.
from fastapi import FastAPI, Request, HTTPException
from fastapi.responses import HTMLResponse, JSONResponse
from fastapi.templating import Jinja2Templates
from transformers import pipeline, set_seed
import torch
import os
import logging
from pydantic import BaseModel
# Configure logging
logging.basicConfig(level=logging.INFO)
logger = logging.getLogger(__name__)
app = FastAPI()
templates = Jinja2Templates(directory="templates")
class PromptRequest(BaseModel):
prompt: str
max_length: int = 150 # Reduced default length to prevent rambling
# Model loading with better error handling
def load_model():
try:
device = "cuda" if torch.cuda.is_available() else "cpu"
logger.info(f"Loading model on device: {device}")
# Using gpt2 instead of distilgpt2 for better quality
model_name = "gpt2"
generator = pipeline(
"text-generation",
model=model_name,
device=device,
framework="pt",
torch_dtype=torch.float16 if device == "cuda" else torch.float32
)
logger.info(f"Successfully loaded {model_name}")
return generator
except Exception as e:
logger.error(f"Model loading failed: {str(e)}")
return None
generator = load_model()
@app.get("/", response_class=HTMLResponse)
async def read_root(request: Request):
return templates.TemplateResponse("index.html", {
"request": request,
"model_loaded": generator is not None
})
@app.post("/generate")
async def generate_text(request_data: PromptRequest):
if not generator:
return JSONResponse(
status_code=503,
content={"error": "Model not loaded. Please try again later."}
)
try:
set_seed(42) # For reproducible results
# Enhanced generation parameters
output = generator(
request_data.prompt,
max_length=request_data.max_length,
num_return_sequences=1,
do_sample=True,
temperature=0.7, # Controls randomness
top_k=50, # Limits to top 50 probable tokens
top_p=0.9, # Nucleus sampling threshold
repetition_penalty=1.5, # Strong penalty for repetition
no_repeat_ngram_size=3, # Prevents 3-word repetitions
early_stopping=True # Stops when coherent answer is reached
)
# Clean up the output
generated_text = output[0]["generated_text"]
# Remove the input prompt if it appears in output
if generated_text.startswith(request_data.prompt):
generated_text = generated_text[len(request_data.prompt):].strip()
# Truncate at last complete sentence
last_period = generated_text.rfind('.')
if last_period > 0:
generated_text = generated_text[:last_period + 1]
return {"output": generated_text}
except Exception as e:
logger.error(f"Generation error: {str(e)}")
return JSONResponse(
status_code=500,
content={"error": f"Generation failed: {str(e)}"}
)
if __name__ == "__main__":
import uvicorn
uvicorn.run(
app,
host="0.0.0.0",
port=8000,
reload=True,
log_level="info"
)
Key Components:
FastAPI: Handles HTTP requests.
transformers: Loads the GPT-2 model.
device="cuda": Ensures GPU acceleration.
POST /generate: Processes prompts and returns AI-generated text.
Step 5: Run the FastAPI Server
Start the server for testing.
uvicorn app:app --reload --host 0.0.0.0 --port 8000
Step 6: Access and Test the API
1. Open a browser and go to http://your-server-ip:8000.
2. Enter a prompt (e.g., "What is neural networks?").
3. Click Generate Text and see the AI response!
Conclusion
You’ve deployed a Generative AI (GPT-2) model on an Ubuntu GPU server with a FastAPI backend and interactive web UI. This setup can be extended to models like LLaMA, Stable Diffusion, or Whisper. Now, go ahead and build amazing AI-powered applications!
### How to Use ClickHouse for High-Performance Querying on Large Datasets on Ubuntu GPU Server
ClickHouse is an open-source column-oriented database management system that excels at real-time analytical processing (OLAP). When deployed on a GPU-enabled Ubuntu server, ClickHouse can achieve even greater performance for querying large datasets.
This in-depth guide will walk you through setting up ClickHouse with GPU support, generating test data, loading it into ClickHouse, and verifying the installation.
Prerequisites
An Ubuntu 24.04 server with an NVIDIA GPU.
A non-root user with sudo privileges.
NVIDIA drivers installed.
Step 1: Setting Up the Python Environment
First, we'll create a clean Python environment for our data generation and verification scripts.
1. Install Python and the required packages.
apt install -y python3 python3-pip python3-venv
2. Create and activate the virtual environment.
python3 -m venv venv
source venv/bin/activate
3. Install ClickHouse and additional packages.
pip install numpy pandas clickhouse-driver
Explanation:
numpy for numerical operations
pandas for data manipulation
clickhouse-driver for Python connectivity to ClickHouse
Step 2: Generating Synthetic Test Data
Create a Python script to generate a large dataset for testing.
nano generate_data.py
Add the following code:
# generate_data.py
import pandas as pd
import numpy as np
# Generate 1 million rows of synthetic data
data = {
'id': np.arange(1, 1_000_001),
'feature1': np.random.rand(1_000_000),
'feature2': np.random.rand(1_000_000),
'feature3': np.random.rand(1_000_000)
}
df = pd.DataFrame(data)
df.to_csv('data.csv', index=False)
print("Generated data.csv with 1,000,000 rows")
Run the script.
python3 generate_data.py
This creates a CSV file with 1 million rows of random floating-point numbers across three features, plus an ID column.
Generated data.csv with 1,000,000 rows
Step 3: Setting Up ClickHouse with GPU Support
ClickHouse has experimental GPU support that can accelerate certain operations. We'll use Docker to run ClickHouse with GPU access.
docker run -d \
--name clickhouse-server \
--gpus all \
-p 9000:9000 \
-p 8123:8123 \
-v $PWD/data:/var/lib/clickhouse \
-e CLICKHOUSE_DEFAULT_ACCESS_MANAGEMENT=1 \
clickhouse/clickhouse-server:latest
Key parameters:
--gpus all: Enables GPU access for the container
Ports 9000 (native protocol) and 8123 (HTTP interface) exposed
Data directory mounted for persistence
Access management enabled for security
Step 4: Preparing the ClickHouse Database
1. Copy the data file into the container and access the ClickHouse shell:
docker cp data.csv clickhouse-server:/tmp/data.csv
2. Connect to the ClickHouse container.
docker exec -it clickhouse-server /bin/bash
3. Inside the container, connect to the ClickHouse server.
clickhouse-client
4. Create a table to hold our data.
CREATE TABLE large_dataset (
id UInt32,
feature1 Float64,
feature2 Float64,
feature3 Float64
) ENGINE = MergeTree()
ORDER BY id;
5. Exit from the ClickHouse shell.
exit
Step 5: Loading Data into ClickHouse
1. Use the ClickHouse client to import the CSV data.
clickhouse-client --query "INSERT INTO large_dataset FORMAT CSV" < /tmp/data.csv --progress
2. Exit from the Docker container.
exit
Step 6: Verifying the Data
1. Create a verification script to check the data was loaded correctly:
nano verify_data.py
Add the code below.
# verify_data.py
from clickhouse_driver import Client
client = Client(
host='localhost',
user='default',
password=''
)
count = client.execute('SELECT count() FROM large_dataset')[0][0]
print(f"Table contains {count} rows")
sample = client.execute('SELECT * FROM large_dataset LIMIT 5')
print("Sample rows:")
for row in sample:
print(row)
2. Run the verification.
python3 verify_data.py
Output.
Table contains 2000000 rows
Sample rows:
(1, 0.38233336651112515, 0.29973790958931235, 0.936007728842977)
(2, 0.13126390736004656, 0.249047252224595, 0.6534321474304323)
(3, 0.7285561857877713, 0.38113395640456516, 0.6836105833319909)
(4, 0.5117479220423862, 0.7073417787216559, 0.8446349501745961)
(5, 0.6415940064857016, 0.7574774031938657, 0.7175210065963386)
Step 7: Running Performance Queries
Now that the data is loaded, let's test some queries. ClickHouse's columnar storage and GPU acceleration shine with analytical queries:
1. First, install the ClickHouse client.
apt install clickhouse-client
2. Connect to the ClickHouse server.
clickhouse-client
Output.
ClickHouse client version 18.16.1.
Connecting to localhost:9000.
Connected to ClickHouse server version 25.3.2 revision 54476.
e7cf71653d41 :)
2. Run the below query for basic aggregation.
SELECT
avg(feature1) as avg_feature1,
stddevPop(feature2) as std_feature2,
quantile(0.99)(feature3) as p99_feature3
FROM large_dataset
Output:
SELECT
avg(feature1) AS avg_feature1,
stddevPop(feature2) AS std_feature2,
quantile(0.99)(feature3) AS p99_feature3
FROM large_dataset
┌───────avg_feature1─┬────────std_feature2─┬───────p99_feature3─┐
│ 0.5002608413633995 │ 0.28872380769587086 │ 0.9908446093587597 │
└────────────────────┴─────────────────────┴────────────────────┘
↘ Progress: 1.00 million rows, 24.00 MB (108.22 million rows/s., 2.60 GB/s.) 99%
1 rows in set. Elapsed: 0.010 sec. Processed 1.00 million rows, 24.00 MB (103.62 million rows/s., 2.49 GB/s.)
3. Run the below query for filtering and grouping.
SELECT
intDiv(id, 100000) as bucket,
count() as count,
avg(feature1 + feature2) as avg_combined
FROM large_dataset
WHERE feature3 > 0.5
GROUP BY bucket
ORDER BY bucket
Output:
SELECT
intDiv(id, 100000) AS bucket,
count() AS count,
avg(feature1 + feature2) AS avg_combined
FROM large_dataset
WHERE feature3 > 0.5
GROUP BY bucket
ORDER BY bucket ASC
┌─bucket─┬─count─┬───────avg_combined─┐
│ 0 │ 49802 │ 1.0000974894524948 │
│ 1 │ 50131 │ 1.0002304278511396 │
│ 2 │ 49990 │ 1.0011286054623088 │
│ 3 │ 50031 │ 0.9968373869613624 │
│ 4 │ 50022 │ 1.0022925786397234 │
│ 5 │ 50123 │ 0.9986748463314014 │
│ 6 │ 50218 │ 1.0004042381656353 │
│ 7 │ 50041 │ 0.9998849136710541 │
│ 8 │ 50138 │ 1.000476200468667 │
│ 9 │ 49908 │ 1.0030392683409466 │
└────────┴───────┴────────────────────┘
↙ Progress: 1.00 million rows, 28.00 MB (87.21 million rows/s., 2.44 GB/s.) 99%
10 rows in set. Elapsed: 0.012 sec. Processed 1.00 million rows, 28.00 MB (83.71 million rows/s., 2.34 GB/s.)
4. Exit from the ClickHouse shell.
exit
Conclusion
By combining ClickHouse's columnar storage and vectorized query execution with GPU acceleration on an Ubuntu server, you can achieve exceptional performance when querying large datasets. The setup process is straightforward with Docker, and the performance benefits for analytical workloads are substantial.
### How to Use NVIDIA Container Tools and Miniconda with Ubuntu GPU Server
With the right tools, running GPU-accelerated workloads like deep learning or scientific computing on an Ubuntu server can be significantly simplified. In this guide, we’ll explore how to use the Nvidia Container Toolkit for Dockerized GPU access and Miniconda for flexible environment management.
Whether building AI models or managing CUDA-based applications, combining these tools provides a powerful, modular, and reproducible setup.
Prerequisites
Before diving in, ensure you have:
An Ubuntu 24.04 server with an NVIDIA GPU.
A non-root user with sudo privileges.
NVIDIA drivers installed.
Basic knowledge of Docker and Conda.
Verify Nvidia Drivers and Docker
1. Verify that the Nvidia drivers are installed.
nvidia-smi
Output.
Sun Apr 6 05:53:34 2025
+-----------------------------------------------------------------------------------------+
| NVIDIA-SMI 550.90.07 Driver Version: 550.90.07 CUDA Version: 12.4 |
|-----------------------------------------+------------------------+----------------------+
| GPU Name Persistence-M | Bus-Id Disp.A | Volatile Uncorr. ECC |
| Fan Temp Perf Pwr:Usage/Cap | Memory-Usage | GPU-Util Compute M. |
| | | MIG M. |
|=========================================+========================+======================|
| 0 NVIDIA A40-8Q On | 00000000:06:00.0 Off | 0 |
| N/A N/A P8 N/A / N/A | 1MiB / 8192MiB | 0% Default |
| | | N/A |
+-----------------------------------------+------------------------+----------------------+
+-----------------------------------------------------------------------------------------+
| Processes: |
| GPU GI CI PID Type Process name GPU Memory |
| ID ID Usage |
|=========================================================================================|
| No running processes found |
+-----------------------------------------------------------------------------------------+
2. Make sure the Docker package is installed.
docker --version
Output.
Docker version 28.0.1, build 068a01e
Configure Docker to Use Nvidia Runtime
1. Configure Docker to use Nvidia runtime.
nvidia-ctk runtime configure --runtime=docker
2. Restart Docker to apply changes.
systemctl restart docker
3. Run a PyTorch container and check CUDA
docker run --rm -it --gpus all --ipc=host --ulimit memlock=-1 --ulimit stack=67108864 nvcr.io/nvidia/pytorch:24.08-py3 python3 -c "import torch;print('CUDA available:', torch.cuda.is_available())"
Output.
=============
== PyTorch ==
=============
NVIDIA Release 24.08 (build 107063150)
PyTorch Version 2.5.0a0+872d972
Container image Copyright (c) 2024, NVIDIA CORPORATION & AFFILIATES. All rights reserved.
Copyright (c) 2014-2024 Facebook Inc.
Copyright (c) 2011-2014 Idiap Research Institute (Ronan Collobert)
Copyright (c) 2012-2014 Deepmind Technologies (Koray Kavukcuoglu)
Copyright (c) 2011-2012 NEC Laboratories America (Koray Kavukcuoglu)
Copyright (c) 2011-2013 NYU (Clement Farabet)
Copyright (c) 2006-2010 NEC Laboratories America (Ronan Collobert, Leon Bottou, Iain Melvin, Jason Weston)
Copyright (c) 2006 Idiap Research Institute (Samy Bengio)
Copyright (c) 2001-2004 Idiap Research Institute (Ronan Collobert, Samy Bengio, Johnny Mariethoz)
Copyright (c) 2015 Google Inc.
Copyright (c) 2015 Yangqing Jia
Copyright (c) 2013-2016 The Caffe contributors
All rights reserved.
Various files include modifications (c) NVIDIA CORPORATION & AFFILIATES. All rights reserved.
This container image and its contents are governed by the NVIDIA Deep Learning Container License.
By pulling and using the container, you accept the terms and conditions of this license:
https://developer.nvidia.com/ngc/nvidia-deep-learning-container-license
NOTE: CUDA Forward Compatibility mode ENABLED.
Using CUDA 12.6 driver version 560.35.03 with kernel driver version 550.90.07.
See https://docs.nvidia.com/deploy/cuda-compatibility/ for details.
CUDA available: True
Install Miniconda
Miniconda provides lightweight Python environment management.
1. Create a directory for Miniconda.
mkdir -p ~/miniconda3
2. Download the installer.
wget https://repo.anaconda.com/miniconda/Miniconda3-latest-Linux-x86_64.sh -O ~/miniconda3/miniconda.sh
3. Run the installer.
bash ~/miniconda3/miniconda.sh -b -u -p ~/miniconda3
4. Remove the installer script.
rm -rf ~/miniconda3/miniconda.sh
5. Initialize Conda for the current user.
~/miniconda3/bin/conda init bash
6. Reload the shell to apply changes.
source ~/.bashrc
7. Verify Conda installation.
conda --version
Output.
conda 24.7.1
Set Up a Conda Environment with PyTorch (GPU Support)
1. Create a new environment named 'torch'.
conda create -n torch python=3.10
2. Activate the environment.
conda activate torch
3. Install PyTorch with CUDA 12.1.
conda install pytorch torchvision torchaudio pytorch-cuda=12.1 -c pytorch -c nvidia
4. Verify GPU support.
python3 -c "import torch; print('CUDA available:', torch.cuda.is_available())"
Output.
CUDA available: True
Conclusion
By combining NVIDIA Container Toolkit and Miniconda, you're unlocking a modular, GPU-powered Python environment that's portable and easy to manage. Use this setup for:
Training PyTorch/TensorFlow models
Scientific computing
Reproducible ML pipelines
This combo is especially great for teams or production pipelines needing consistency, isolation, and GPU access. Try it today on GPU hosting from Atlantic.Net!
### How To Build a Neural Network to Recognize Handwritten Digits with TensorFlow on Ubuntu GPU Server
Handwritten digit recognition is one of the classic "Hello World" projects in deep learning. Thanks to TensorFlow and GPU acceleration, we can build a highly accurate model in minutes.
In this guide, we'll walk through setting up a Convolutional Neural Network (CNN) on an Ubuntu GPU server to recognize digits from the famous MNIST dataset and even test it on your own handwritten images.
Prerequisites
An Ubuntu 24.04 server with an NVIDIA GPU.
A non-root user with sudo privileges.
NVIDIA drivers installed.
Step 1: Set Up the Project Environment
Before diving into coding, we must prepare our GPU-powered Ubuntu server with the right tools.
1. First, let’s install Python and set up an isolated environment to avoid dependency conflicts:
apt install -y python3 python3-pip python3-venv
2. Now, create and activate a virtual environment:
python3 -m venv tf-gpu-env
source tf-gpu-env/bin/activate
3. TensorFlow can leverage NVIDIA CUDA for lightning-fast training. Install it along with NumPy and Matplotlib:
pip install tensorflow numpy matplotlib
4. Connect to the Python shell.
python3
Verify that TensorFlow recognizes your GPU:
import tensorflow as tf
print("Num GPUs Available:", len(tf.config.list_physical_devices('GPU')))
Output.
Num GPUs Available: 1
5. Press CTRL+D to exit from the Python shell.
Step 2: Build and Train the Model
Now, the fun part is building a Convolutional Neural Network (CNN) to recognize handwritten digits!
1. Create the training script.
nano train_mnist.py
Add the following code:
import tensorflow as tf
from tensorflow.keras.datasets import mnist
from tensorflow.keras.models import Sequential
from tensorflow.keras.layers import Conv2D, MaxPooling2D, Flatten, Dense, Dropout
import os
# Load and preprocess data
(x_train, y_train), (x_test, y_test) = mnist.load_data()
x_train, x_test = x_train / 255.0, x_test / 255.0 # Normalize
x_train = x_train[..., tf.newaxis] # Add channel dimension (28x28x1)
x_test = x_test[..., tf.newaxis]
# Build CNN model
model = Sequential([
Conv2D(32, (3,3), activation='relu', input_shape=(28,28,1)),
MaxPooling2D((2,2)),
Conv2D(64, (3,3), activation='relu'),
MaxPooling2D((2,2)),
Flatten(),
Dense(128, activation='relu'),
Dropout(0.5), # Prevent overfitting
Dense(10, activation='softmax') # 10 output classes (digits 0-9)
])
# Compile model
model.compile(optimizer='adam',
loss='sparse_categorical_crossentropy',
metrics=['accuracy'])
# Train model
history = model.fit(x_train, y_train, epochs=10, validation_data=(x_test, y_test))
# Evaluate model
test_loss, test_acc = model.evaluate(x_test, y_test, verbose=2)
print(f"\nTest Accuracy: {test_acc*100:.2f}%")
# Save model
os.makedirs("models", exist_ok=True)
model.save("models/mnist_cnn.h5")
print("Model saved to 'models/mnist_cnn.h5'")
2. Run the script.
python3 train_mnist.py
Output.
Test accuracy: 0.9925000071525574
Step 3: Test the Model on New Data
Let’s see how well our model performs on unseen digits from the MNIST test set.
1. Create a prediction script.
nano predict.py
Add the following code.
import tensorflow as tf
import numpy as np
import matplotlib.pyplot as plt
import random
# Load saved model
model = tf.keras.models.load_model('models/mnist_cnn.h5')
# Load test data
(_, _), (x_test, y_test) = tf.keras.datasets.mnist.load_data()
x_test = x_test / 255.0
x_test = x_test[..., tf.newaxis]
# Make predictions
def predict_random_sample():
index = random.randint(0, len(x_test))
image = x_test[index]
prediction = model.predict(image[np.newaxis, ...])
predicted_label = np.argmax(prediction)
plt.imshow(image.squeeze(), cmap='gray')
plt.title(f'Predicted: {predicted_label}, Actual: {y_test[index]}')
plt.show()
# Predict 5 random samples
for _ in range(5):
predict_random_sample()
2. Run the prediction.
python3 predict.py
Output.
1/1 ━━━━━━━━━━━━━━━━━━━━ 1s 563ms/step
1/1 ━━━━━━━━━━━━━━━━━━━━ 0s 23ms/step
1/1 ━━━━━━━━━━━━━━━━━━━━ 0s 22ms/step
Step 4: Test on Custom Handwritten Images
Now, let's try using your own handwriting.
1. Create an image named hand.png with a white digit (3) on a black background.
2. Create a script including your own handwritten image.
nano predic_image.py
Add the following code.
import tensorflow as tf
from PIL import Image
import numpy as np
# Load the trained model
model = tf.keras.models.load_model('models/mnist_cnn.h5') # Adjust path if needed
def preprocess_custom_image(image_path):
img = Image.open(image_path).convert('L') # Grayscale
img = img.resize((28, 28)) # Resize to MNIST dimensions
img_array = np.array(img) / 255.0 # Normalize
img_array = img_array.reshape(1, 28, 28, 1) # Reshape for model
return img_array
# Predict
custom_img = preprocess_custom_image("hand.png") # Replace with your image path
prediction = model.predict(custom_img)
print("Predicted Digit:", np.argmax(prediction))
3. Run the script.
python3 predic_image.py
The script predicts your handwritten digit in the image and gives the output.
Predicted Digit: 3
Conclusion
You've now built a neural network that can recognize handwritten digits with high accuracy using TensorFlow on an Ubuntu GPU server. The GPU acceleration significantly reduces training time, allowing faster experimentation with different architectures and hyperparameters.
### How to Build a Recommender System with Surprise on Ubuntu GPU Server
Recommender systems are the invisible engines behind personalized internet experiences. Whether you’re searching for your next TV show on Netflix, products on Amazon, or music on Spotify, recommender systems are working behind the scenes. They analyze your preferences, compare them with millions of other users, and deliver tailored recommendations that keep you engaged and happy.
In this article, we’ll build a recommender system using the Surprise library on an Ubuntu GPU server. We’ll use the MovieLens 100K dataset, a popular dataset for collaborative filtering, and train a model using SVD.
Prerequisites
Before starting, ensure you have the following:
An Ubuntu 24.04 Cloud GPU Server.
CUDA Toolkit and cuDNN Installed.
A root or sudo privileges.
Step 1: Install Required Dependencies
First, we need to set up the environment and install the necessary dependencies.
1. Update your system packages.
apt update -y
2. Install Python and the venv module to create an isolated environment:
apt install python3-pip python3-venv -y
3. Create and activate a virtual environment to manage dependencies:
python3 -m venv surprise_env
source surprise_env/bin/activate
4. Install the necessary Python libraries:
pip install "numpy<2" scikit-surprise pandas matplotlib
Explanation:
NumPy: For numerical computations.
scikit-surprise: A Python library for building and analyzing recommender systems.
Pandas: For data manipulation.
Matplotlib: For visualization (optional).
Step 2: Download the MovieLens 100K Dataset
The MovieLens 100K dataset is a widely used dataset for building recommender systems. It contains 100,000 ratings from 943 users on 1,682 movies.
1. Create a directory for the dataset and download it:
mkdir -p ~/datasets && cd ~/datasets
wget https://files.grouplens.org/datasets/movielens/ml-100k.zip
unzip ml-100k.zip
This will create a directory named ml-100k containing the dataset files.
2. The file we need is ml-100k/u.data. Let’s inspect the first few lines:
head ml-100k/u.data
Output:
196 242 3 881250949
186 302 3 891717742
22 377 1 878887116
244 51 2 880606923
166 346 1 886397596
298 474 4 884182806
115 265 2 881171488
253 465 5 891628467
305 451 3 886324817
6 86 3 883603013
The columns represent:
user_id: ID of the user.
item_id: ID of the movie.
rating: Rating given by the user (1-5).
timestamp: Timestamp of the rating.
Step 3: Load the Dataset
We’ll use the surprise library to load the dataset into a format suitable for training.
1. Create a file named load_data.py:
nano load_data.py
Add the following code:
import pandas as pd
from surprise import Dataset, Reader
# Load MovieLens 100K dataset
file_path = "ml-100k/u.data"
columns = ['user_id', 'item_id', 'rating', 'timestamp']
df = pd.read_csv(file_path, sep='\t', names=columns)
# Define a reader object
reader = Reader(line_format='user item rating timestamp', sep='\t')
# Load the dataset into Surprise format
data = Dataset.load_from_df(df[['user_id', 'item_id', 'rating']], reader)
print("Data loaded successfully.")
2. Execute the script:
python3 load_data.py
Output:
Data loaded successfully.
Step 4: Build a Recommender System Using Surprise
We’ll use the SVD (Singular Value Decomposition) algorithm, a popular collaborative filtering technique, to build our recommender system.
1. Create a Python file to train the model
nano train_model.py
Add the following code:
import pandas as pd
from surprise import Dataset, Reader, SVD
from surprise.model_selection import cross_validate
# Load dataset
file_path = "ml-100k/u.data"
columns = ['user_id', 'item_id', 'rating', 'timestamp']
df = pd.read_csv(file_path, sep='\t', names=columns)
reader = Reader(line_format='user item rating timestamp', sep='\t')
data = Dataset.load_from_df(df[['user_id', 'item_id', 'rating']], reader)
# Train SVD model
model = SVD()
cross_validate(model, data, cv=5, verbose=True)
print("Model trained successfully.")
2. Run the script.
python3 train_model.py
This will perform 5-fold cross-validation and output RMSE (Root Mean Square Error) and MAE (Mean Absolute Error).
Evaluating RMSE, MAE of algorithm SVD on 5 split(s).
Fold 1 Fold 2 Fold 3 Fold 4 Fold 5 Mean Std
RMSE (testset) 0.9271 0.9318 0.9398 0.9403 0.9423 0.9363 0.0058
MAE (testset) 0.7311 0.7359 0.7374 0.7412 0.7434 0.7378 0.0043
Fit time 0.79 0.83 0.85 0.88 0.96 0.86 0.06
Test time 0.09 0.09 0.09 0.10 0.08 0.09 0.01
Model trained successfully.
Step 5: Make Predictions Using the Model
Now that the model is trained, let’s make predictions for a specific user.
1. Create a Python file to make predictions.
nano predict.py
Add the following code:
import pandas as pd
from surprise import Dataset, Reader, SVD
from surprise.model_selection import train_test_split
# Load dataset
file_path = "ml-100k/u.data"
columns = ['user_id', 'item_id', 'rating', 'timestamp']
df = pd.read_csv(file_path, sep='\t', names=columns)
reader = Reader(line_format='user item rating timestamp', sep='\t')
data = Dataset.load_from_df(df[['user_id', 'item_id', 'rating']], reader)
# Split data into train and test set
trainset, testset = train_test_split(data, test_size=0.2)
# Train SVD model
model = SVD()
model.fit(trainset)
# Make predictions
predictions = model.test(testset)
# Print sample predictions
for prediction in predictions[:10]:
print(f"User {prediction.uid} - Item {prediction.iid}: Predicted Rating {prediction.est:.2f}")
2. Run the script.
python3 predict.py
Output:
User 282 - Item 325: Predicted Rating 2.90
User 619 - Item 188: Predicted Rating 3.74
User 336 - Item 1118: Predicted Rating 3.04
User 763 - Item 505: Predicted Rating 4.18
User 735 - Item 286: Predicted Rating 3.45
User 276 - Item 214: Predicted Rating 3.53
User 305 - Item 557: Predicted Rating 2.91
User 682 - Item 71: Predicted Rating 3.20
User 718 - Item 471: Predicted Rating 4.00
User 145 - Item 460: Predicted Rating 3.16
Step 6: Save and Load the Model
To reuse the trained model, we’ll save it to a file and load it later.
1. Create a file named save_model.py:
nano save_model.py
Add the following code:
import pandas as pd
import pickle
from surprise import Dataset, Reader, SVD
# Load dataset
file_path = "/root/datasets/ml-100k/u.data" # Ensure this path is correct
columns = ['user_id', 'item_id', 'rating', 'timestamp']
df = pd.read_csv(file_path, sep='\t', names=columns) # Now pd is defined
reader = Reader(line_format='user item rating timestamp', sep='\t')
data = Dataset.load_from_df(df[['user_id', 'item_id', 'rating']], reader)
# Train model
trainset = data.build_full_trainset()
model = SVD()
model.fit(trainset)
# Save the trained model
with open("recommender_model.pkl", "wb") as f:
pickle.dump(model, f)
print("Model saved successfully.")
2. Run the script.
python3 save_model.py
Output:
Model saved successfully.
3. Create a file named load_model.py to load and use the saved model.
nano load_model.py
Add the following code:
import pickle
from surprise import Dataset, Reader
# Load the saved model
with open("recommender_model.pkl", "rb") as f:
model = pickle.load(f)
# Make a prediction for user 1 and item 50
user_id = "1"
item_id = "50"
predicted_rating = model.predict(user_id, item_id).est
print(f"Predicted rating for User {user_id} and Item {item_id}: {predicted_rating:.2f}")
4. Run the script.
python3 load_model.py
Output:
Predicted rating for User 1 and Item 50: 3.53
Step 7: Evaluate the Model Performance
Finally, let’s evaluate the model’s performance using RMSE (Root Mean Square Error).
1. Create a file for evaluation.
nano evaluate_model.py
Add the following code:
import pandas as pd
from surprise import Dataset, Reader
from surprise.model_selection import train_test_split
from surprise import accuracy
import pickle
# Load dataset
file_path = "/root/datasets/ml-100k/u.data" # Make sure this path is correct
columns = ['user_id', 'item_id', 'rating', 'timestamp']
df = pd.read_csv(file_path, sep='\t', names=columns) # Now pd is defined
reader = Reader(line_format='user item rating timestamp', sep='\t')
data = Dataset.load_from_df(df[['user_id', 'item_id', 'rating']], reader)
# Split data
trainset, testset = train_test_split(data, test_size=0.2)
# Load saved model
with open("recommender_model.pkl", "rb") as f:
model = pickle.load(f)
# Predict
predictions = model.test(testset)
# Compute RMSE
rmse = accuracy.rmse(predictions)
print(f"RMSE: {rmse:.4f}")
2. Run the script.
python3 evaluate_model.py
Output:
RMSE: 0.6721
RMSE: 0.6721
Conclusion
In this article, we built a recommender system using the Surprise library on an Atlantic.Net GPU server. Now, you have a working recommender system that can be extended to real-world applications like e-commerce product recommendations, movie suggestions, or content curation.
### Toxic Comment Detection with TensorFlow on an Ubuntu GPU Server
Online platforms face increasing challenges in moderating user-generated content. Toxic comments—including insults, threats, hate speech, and obscene language—can create hostile environments and drive users away. Manual moderation doesn't scale effectively for large platforms, making automated detection systems essential.
In this article, we'll build a toxic comment classification system using TensorFlow on an Ubuntu server with GPU acceleration.
Prerequisites
An Ubuntu 24.04 server with an NVIDIA GPU.
A non-root user with sudo privileges.
NVIDIA drivers installed.
Step 1: Setting Up the Environment
Before we begin processing data or training models, we need to set up our Ubuntu server environment with the necessary dependencies.
1. Install Python and other required libraries.
apt install -y python3 python3-pip python3-venv
2. Create a virtual environment for your project.
python3 -m venv toxic-env
3. Activate the virtual environment.
source toxic-env/bin/activate
4. Upgrade Pip to the latest version.
pip install --upgrade pip
5. Install Tensorflow and other packages.
pip install tensorflow pandas numpy scikit-learn matplotlib nltk kaggle uvicorn fastapi
Step 2: Data Preparation
We'll use the Jigsaw Toxic Comment Classification Challenge dataset from Kaggle, which contains Wikipedia comments labeled for various types of toxicity.
1. Create a directory structure for your project.
mkdir -p toxicity-detector/{data,models,src}
2. Navigate to the toxicity-detector directory.
cd toxicity-detector
3. Log in to the Kagel site, download the Jigsaw dataset file called archive.zip, and place it in the /root directory.
4. Unzip the archive.zip to the data/raw directory.
unzip /root/archive.zip -d data/raw/
Step 3: Preprocess Data
Effective text classification requires careful preprocessing.
1. Create a preprocess.py script.
nano src/preprocess.py
Add the following code.
import pandas as pd
import nltk
from nltk.tokenize import word_tokenize
from nltk.stem import WordNetLemmatizer
import multiprocessing as mp
import os
nltk_dir = os.path.expanduser('~/nltk_data')
os.makedirs(nltk_dir, exist_ok=True)
nltk.data.path.append(nltk_dir)
for resource in ['punkt', 'stopwords', 'wordnet', 'omw-1.4']:
nltk.download(resource, download_dir=nltk_dir)
def clean_text(text):
tokens = word_tokenize(str(text).lower())
lemmatizer = WordNetLemmatizer()
return ' '.join([lemmatizer.lemmatize(w) for w in tokens if w.isalpha()])
if __name__ == "__main__":
df = pd.read_csv('data/raw/train.csv')
with mp.Pool(mp.cpu_count()) as pool:
df['clean_text'] = pool.map(clean_text, df['comment_text'])
os.makedirs('data/processed', exist_ok=True)
df.to_csv('data/processed/train_clean.csv', index=False)
print("Preprocessing completed successfully!")
2. Run the preprocessing script.
python3 src/preprocess.py
Step 4: Model Training
Our model architecture uses a bidirectional LSTM network, which is particularly effective for sequence classification tasks like text analysis.
1. Create a train.py script.
nano src/train.py
Add the following code.
import os
os.environ['TF_CPP_MIN_LOG_LEVEL'] = '2'
import numpy as np
import pandas as pd
import tensorflow as tf
from tensorflow.keras.layers import TextVectorization, Embedding, Bidirectional, LSTM, Dense, Input
from tensorflow.keras.models import Sequential
from sklearn.model_selection import train_test_split
import pickle
train_df = pd.read_csv('data/processed/train_clean.csv')
texts = train_df['clean_text'].astype(str).tolist()
labels = train_df[['toxic', 'severe_toxic', 'obscene', 'threat', 'insult', 'identity_hate']].values
X_train, X_val, y_train, y_val = train_test_split(texts, labels, test_size=0.2, random_state=42)
# Create vectorizer separately
vectorizer = TextVectorization(max_tokens=50000, output_sequence_length=200, output_mode='int')
vectorizer.adapt(X_train)
# Vectorize data before training
X_train_vec = vectorizer(np.array([[s] for s in X_train])).numpy()
X_val_vec = vectorizer(np.array([[s] for s in X_val])).numpy()
# Save vectorizer separately
with open('models/vectorizer.pkl', 'wb') as f:
pickle.dump({'config': vectorizer.get_config(), 'weights': vectorizer.get_weights()}, f)
# Build model without vectorizer
model = Sequential([
Input(shape=(200,)),
Embedding(50000, 128, mask_zero=True),
Bidirectional(LSTM(64, return_sequences=True)),
Bidirectional(LSTM(32)),
Dense(64, activation='relu'),
Dense(6, activation='sigmoid')
])
model.compile(loss='binary_crossentropy', optimizer='adam', metrics=['accuracy'])
# Train model on vectorized data
model.fit(X_train_vec, y_train, validation_data=(X_val_vec, y_val), epochs=10)
# Save model
model.save('models/toxicity.h5')
2. Run the script to train the model.
python3 src/train.py
Step 5: Deployment with FastAPI
For production deployment, we create a REST API using FastAPI that exposes our model's prediction capabilities.
1. Create an api.py script.
nano src/api.py
Add the following code:
from fastapi import FastAPI
from tensorflow.keras.models import load_model
from tensorflow.keras.layers import TextVectorization
from pydantic import BaseModel
import numpy as np
import pickle
import tensorflow as tf
app = FastAPI()
# Load the trained model
model = load_model('models/toxicity.h5')
# Load vectorizer separately and properly initialize it
with open('models/vectorizer.pkl', 'rb') as f:
vec_data = pickle.load(f)
vectorizer = TextVectorization.from_config(vec_data['config'])
# Temporary adapt call with dummy data to fully initialize internal tables
vectorizer.adapt(tf.data.Dataset.from_tensor_slices(["dummy"]))
vectorizer.set_weights(vec_data['weights'])
class TextRequest(BaseModel):
text: str
@app.post("/predict")
async def predict(request: TextRequest):
try:
# Vectorize the input text
input_vector = vectorizer([request.text])
# Make the prediction
prediction = model.predict(input_vector)[0]
return {
"toxic": float(prediction[0]),
"severe_toxic": float(prediction[1]),
"obscene": float(prediction[2]),
"threat": float(prediction[3]),
"insult": float(prediction[4]),
"identity_hate": float(prediction[5])
}
except Exception as e:
return {"error": str(e)}
2. Start the server.
uvicorn src.api:app --reload &
3. Test the API with a sample request.
curl -X POST 'http://localhost:8000/predict' \
-H 'Content-Type: application/json' \
-d '{"text":"You are an idiot!"}'
Output.
{"toxic":0.5728890299797058,"severe_toxic":0.04583415016531944,"obscene":0.4520402252674103,"threat":0.007368859834969044,"insult":0.19956137239933014,"identity_hate":0.023788010701537132}
The output of the API request represents the model's prediction scores for six different types of toxicity in the input text. Each score is a probability value between 0 and 1, where higher values indicate greater confidence that the text contains that particular type of toxicity.
Conclusion
This implementation demonstrates building an effective toxic comment classification system using TensorFlow on an Ubuntu GPU server. By leveraging GPU acceleration, we can train sophisticated models efficiently while the modular architecture ensures maintainability and scalability.
The system can be integrated into content moderation pipelines, forum platforms, or social media applications to automatically flag potentially harmful content for human review or automatic filtering.
### How to Build a Simple Reinforcement Learning Model with Gym on Ubuntu GPU Server
Reinforcement Learning (RL) is a subfield of machine learning where an agent learns to make decisions by performing actions in an environment to maximize some notion of cumulative reward. OpenAI’s Gym is a popular toolkit for developing and comparing reinforcement learning algorithms.
In this article, we will go through building a simple RL model using Gym on an Ubuntu GPU server.
Prerequisites
Before starting, ensure you have the following:
An Ubuntu 24.04 Cloud GPU Server.
CUDA Toolkit and cuDNN Installed.
A root or sudo privileges.
Step 1: Set Up the Environment
1. First, ensure your system is up to date:
apt update -y
2. The default Python version in Ubuntu 24.04 (Python 3.12) is incompatible with Gym requirements. You'll need to install Python 3.10.
Add the Python repository.
add-apt-repository ppa:deadsnakes/ppa
3. Update the package index.
apt update -y
4. Install Python 3.10 and essential libraries.
apt install python3.10 python3.10-venv python3.10-dev -y
5. Create a Python virtual environment.
python3.10 -m venv rl_env
source rl_env/bin/activate
Step 2: Install Required Libraries
1. Upgrade pip to the latest version.
pip install --upgrade pip
2. Install required libraries.
pip install wheel "numpy<2" matplotlib scipy
3. Install TensorFlow with GPU support.
pip install tensorflow-gpu
4. Install OpenAI Gym.
pip install gym
Step 3: Build a Simple Reinforcement Learning Model
OpenAI Gym provides various environments. For this tutorial, we'll use the CartPole-v1 environment, where the goal is to balance a pole on a cart.
1. Create a file named environment_setup.py.
nano environment_setup.py
Add the following code.
import gym
env = gym.make('CartPole-v1')
print("Environment created successfully!")
print("Observation space:", env.observation_space)
print("Action space:", env.action_space)
2. Run the above script.
python3 environment_setup.py
Output.
Environment created successfully!
Observation space: Box([-4.8000002e+00 -3.4028235e+38 -4.1887903e-01 -3.4028235e+38], [4.8000002e+00 3.4028235e+38 4.1887903e-01 3.4028235e+38], (4,), float32)
Action space: Discrete(2)
Step 4: Define the Model
We'll use a simple neural network to approximate the Q-function. The network will take the state as input and output the Q-values for each action.
1. Create a file to define the model.
nano build_model.py
2. Add the following code.
import tensorflow as tf
from tensorflow.keras import layers
def build_model(state_size, action_size):
model = tf.keras.Sequential([
layers.Dense(24, input_dim=state_size, activation='relu'),
layers.Dense(24, activation='relu'),
layers.Dense(action_size, activation='linear')
])
model.compile(loss='mse', optimizer=tf.keras.optimizers.Adam(learning_rate=0.001))
return model
# Test the model
state_size = 4
action_size = 2
model = build_model(state_size, action_size)
model.summary()
3. Run the script.
python3 build_model.py
Output.
Model: "sequential"
_________________________________________________________________
Layer (type) Output Shape Param #
=================================================================
dense (Dense) (None, 24) 120
dense_1 (Dense) (None, 24) 600
dense_2 (Dense) (None, 2) 50
=================================================================
Total params: 770
Trainable params: 770
Non-trainable params: 0
_________________________________________________________________
Step 5: Implement the Q-Learning Algorithm
Q-Learning is a popular RL algorithm. Here, we'll implement a simple version of Q-Learning with experience replay.
1. Create a q_learning agent.
nano q_learning_agent.py
Add the following code.
import numpy as np
from build_model import build_model
class QLearningAgent:
def __init__(self, state_size, action_size):
self.state_size = state_size
self.action_size = action_size
self.memory = []
self.gamma = 0.95 # discount rate
self.epsilon = 1.0 # exploration rate
self.epsilon_min = 0.01
self.epsilon_decay = 0.995
self.model = build_model(state_size, action_size)
def remember(self, state, action, reward, next_state, done):
self.memory.append((state, action, reward, next_state, done))
def act(self, state):
if np.random.rand() <= self.epsilon: return np.random.choice(self.action_size) q_values = self.model.predict(state) return np.argmax(q_values[0]) def replay(self, batch_size): minibatch = np.random.choice(len(self.memory), batch_size, replace=False) for index in minibatch: state, action, reward, next_state, done = self.memory[index] target = reward if not done: target = reward + self.gamma * np.amax(self.model.predict(next_state)[0]) target_f = self.model.predict(state) target_f[0][action] = target self.model.fit(state, target_f, epochs=1, verbose=0) if self.epsilon > self.epsilon_min:
self.epsilon *= self.epsilon_decay
# Test the agent
state_size = 4
action_size = 2
agent = QLearningAgent(state_size, action_size)
print("Q-Learning agent created successfully!")
2. Run the above script.
python3 q_learning_agent.py
Output.
Model: "sequential"
_________________________________________________________________
Layer (type) Output Shape Param #
=================================================================
dense (Dense) (None, 24) 120
dense_1 (Dense) (None, 24) 600
dense_2 (Dense) (None, 2) 50
=================================================================
Total params: 770
Trainable params: 770
Non-trainable params: 0
_________________________________________________________________
Q-Learning agent created successfully!
Step 6: Train the Model
1. Now, let's train the model using the Q-Learning algorithm.
nano train_model.py
Add the following code.
import gym
import numpy as np
from q_learning_agent import QLearningAgent
env = gym.make('CartPole-v1')
state_size = env.observation_space.shape[0]
action_size = env.action_space.n
agent = QLearningAgent(state_size, action_size)
batch_size = 32
episodes = 1000
for e in range(episodes):
state, _ = env.reset() # Unpack the tuple returned by env.reset()
state = np.expand_dims(state, axis=0) # Reshape state to (1, state_size)
for time in range(500):
action = agent.act(state)
next_state, reward, done, _, _ = env.step(action) # Unpack the tuple returned by env.step()
next_state = np.expand_dims(next_state, axis=0) # Reshape next_state to (1, state_size)
agent.remember(state, action, reward, next_state, done)
state = next_state
if done:
print(f"episode: {e}/{episodes}, score: {time}, e: {agent.epsilon:.2}")
break
if len(agent.memory) > batch_size:
agent.replay(batch_size)
2. Run the code.
python3 train_model.py
Output.
episode: 0/1000, score: 12, e: 0.99
episode: 1/1000, score: 15, e: 0.98
...
episode: 999/1000, score: 200, e: 0.01
Explanation:
The agent is trained for 1000 episodes.
The score (time steps before the pole falls) increases over time, indicating that the agent is learning.
The exploration rate (epsilon) decreases over time as the agent relies more on learned knowledge.
Step 7: Test the Model
1. After training, you can test the model to see how well it performs.
nano test_model.py
Add the following code.
import gym
import numpy as np
from q_learning_agent import QLearningAgent
env = gym.make('CartPole-v1')
state_size = env.observation_space.shape[0]
action_size = env.action_space.n
agent = QLearningAgent(state_size, action_size)
# Load the trained model (if saved)
# agent.model.load_weights('model_weights.h5')
state, _ = env.reset() # Unpack the tuple returned by env.reset()
state = np.expand_dims(state, axis=0) # Reshape state to (1, state_size)
for time in range(500):
env.render()
action = np.argmax(agent.model.predict(state)[0])
next_state, reward, done, _, _ = env.step(action) # Unpack the tuple returned by env.step()
next_state = np.expand_dims(next_state, axis=0) # Reshape next_state to (1, state_size)
state = next_state
if done:
print(f"Test finished with score: {time}")
break
env.close()
2. Run the above test.
python3 test_model.py
Output.
Test finished with score: 8
Explanation:
The agent successfully balances the pole for the maximum allowed time (500 steps).
This indicates that the training was successful.
Conclusion
In this article, we built a simple RL model using OpenAI Gym on an Ubuntu GPU server. You can now develop your own RL projects and try out more complex environments. OpenAI Gym has many environments to test and refine different RL strategies.
### How to Generate Music Using Transformers on an Ubuntu GPU Server
Generating music using transformers has become very popular due to the advancements in deep learning and natural language processing (NLP). Transformers, originally designed for NLP tasks, have been adapted for music generation by treating musical sequences as a form of language.
In this article, we will generate music using transformers on an Ubuntu GPU server. We’ll cover setting up the environment, writing the code, and running the code to generate music.
Prerequisites
Before starting, ensure you have the following:
An Ubuntu 24.04 Cloud GPU Server.
CUDA Toolkit and cuDNN Installed.
A root or sudo privileges.
Step 1: Set Up the Environment
1. First, make sure your system is up to date.
apt update -y
2. Add the Python repository.
add-apt-repository ppa:deadsnakes/ppa
3. Update the package index.
apt update -y
4. Install Python 3.10 and essential libraries.
apt install python3.10 python3.10-venv python3.10-dev -y
5. Create a virtual environment to isolate the dependencies:
python3.10 -m venv musicgen_env
source musicgen_env/bin/activate
6. Install the required Python libraries:
pip install torch torchvision torchaudio --extra-index-url https://download.pytorch.org/whl/cu118
pip install transformers
pip install numpy scipy matplotlib
pip install midiutil
Explanation:
torch: PyTorch is a deep-learning framework that we'll use to build and train our transformer model.
transformers: The Hugging Face Transformers library provides pre-trained models and tools for working with transformers.
numpy, scipy, matplotlib: These libraries are used for numerical computations and visualization.
midiutil: This library is used to create MIDI files from the generated music.
Step 2: Writing the Code
1. Create a Python Script
Create a new Python script file named music_generator.py:
nano music_generator.py
2. Import Required Libraries
Add the below code:
# Import required libraries
import torch
from transformers import GPT2LMHeadModel, GPT2Tokenizer
from midiutil import MIDIFile
3. Load Pre-trained Model and Tokenizer
We'll use a pre-trained GPT-2 model from Hugging Face's Transformers library. GPT-2 is a transformer-based model that can generate text, and we'll adapt it for music generation.
# Load pre-trained GPT-2 model and tokenizer
def load_model():
model_name = "gpt2"
tokenizer = GPT2Tokenizer.from_pretrained(model_name)
model = GPT2LMHeadModel.from_pretrained(model_name)
# Set pad token ID explicitly
tokenizer.pad_token = tokenizer.eos_token
# Move model to GPU if available
device = torch.device("cuda" if torch.cuda.is_available() else "cpu")
model.to(device)
return model, tokenizer, device
4. Define Music Generation Function
Next, we'll define a function to generate music using the GPT-2 model. We'll treat the music as a sequence of tokens and generate new tokens based on the input sequence.
# Generate music using the GPT-2 model
def generate_music(prompt, model, tokenizer, device, max_length=100, temperature=0.7):
# Encode the input prompt
input_ids = tokenizer.encode(prompt, return_tensors="pt").to(device)
# Generate music tokens
output = model.generate(
input_ids,
max_length=max_length,
temperature=temperature,
do_sample=True,
top_k=50,
top_p=0.95,
pad_token_id=tokenizer.eos_token_id, # Explicitly set pad token ID
attention_mask=input_ids.ne(tokenizer.pad_token_id).float().to(device) # Set attention mask
)
# Decode the generated tokens to a string
generated_music = tokenizer.decode(output[0], skip_special_tokens=True)
return generated_music
Explanation:
prompt: The initial sequence of tokens that will be used to start the generation.
max_length: The maximum length of the generated sequence.
temperature: Controls the randomness of the generated sequence. Lower values make the output more deterministic, while higher values make it more random.
do_sample: If True, the model will sample from the probability distribution instead of taking the most likely token.
top_k: Limits the sampling pool to the top k tokens.
top_p: Implements nucleus sampling, where the model samples from the smallest possible set of tokens whose cumulative probability exceeds p.
6. Convert Generated Music to MIDI
The generated music is a sequence of tokens. We'll convert these tokens into a MIDI file that can be played or further processed.
# Convert generated music tokens to a MIDI file
def tokens_to_midi(generated_music, filename="generated_music.mid"):
# Convert the generated music tokens to a list of integers
try:
tokens = [int(token) for token in generated_music.split() if token.isdigit()]
except ValueError:
print("Error: Generated music contains non-integer tokens. Please check the model output.")
return
# Create a MIDI file
midi = MIDIFile(1)
track = 0
time = 0
midi.addTrackName(track, time, "Generated Music")
midi.addTempo(track, time, 120)
# Add notes to the MIDI file
for i, token in enumerate(tokens):
pitch = token % 128 # MIDI pitches range from 0 to 127
duration = 1 # Each note lasts for 1 beat
midi.addNote(track, 0, pitch, time + i, duration, 100)
# Save the MIDI file
with open(filename, "wb") as output_file:
midi.writeFile(output_file)
7. Generate and Save Music
Finally, we'll generate music and save it as a MIDI file.
# Main function to generate and save music
def main():
# Load the model and tokenizer
model, tokenizer, device = load_model()
# Define a prompt to start the music generation
prompt = "60 62 64 65 67 69 71 72" # Example: C major scale
# Generate music
generated_music = generate_music(prompt, model, tokenizer, device, max_length=200, temperature=0.7)
# Save the generated music as a MIDI file
tokens_to_midi(generated_music, "generated_music.mid")
print("Music generated and saved as 'generated_music.mid'")
# Run the script
if __name__ == "__main__":
main()
Step 3: Running the Code
Now, run the above script using the below command.
python3 music_generator.py
When you run the script, it will generate a MIDI file named generated_music.mid in the same directory as the script. The output in the terminal will look something like this:
Music generated and saved as 'generated_music.mid'
The MIDI file contains the generated music in a format that can be easily manipulated or played back. Each note in the MIDI file corresponds to a token in the generated sequence.
Conclusion
In this article we’ve gone through the process of generating music using transformers on an Ubuntu GPU server. We’ve covered setting up the environment, writing the code and running the code to generate music. The generated music is saved as a MIDI file which can be played or further processed. Try it out! By leveraging the power of transformers and GPUs, you can create unique and interesting musical compositions that push the boundaries of what's possible with AI-generated music.
### How to Detect Anomalies in Time Series Data on an Ubuntu GPU Server
Detecting anomalies in time series data is a big deal in many industries like finance, healthcare, cybersecurity and industrial IoT. Anomalies can mean faults, fraud, or unexpected behavior that requires immediate attention. Efficient anomaly detection can prevent financial loss, ensure safety in industrial systems and maintain cybersecurity integrity.
With the advancement of deep learning, techniques like Long-Short-Term Memory (LSTM) Autoencoders are very effective in detecting anomalies in time series data.
In this article, we will describe how to detect anomalies in time series data using an LSTM-based autoencoder on an Ubuntu GPU server.
Prerequisites
Before starting, ensure you have the following:
An Ubuntu 24.04 Cloud GPU Server.
CUDA Toolkit and cuDNN Installed.
A root or sudo privileges.
Step 1: Setup a Python Environment
In this section, we'll set up a dedicated Python environment on an Ubuntu GPU server to run our anomaly detection models.
1. Add the Python 3.10 repository.
add-apt-repository ppa:deadsnakes/ppa
2. Update the package list.
apt update -y
3. Install packages necessary for creating a virtual environment and compiling Python modules.
apt install python3.10 python3.10-venv python3.10-dev
4. Set up a virtual environment to manage your project's dependencies separately from the system's Python environment.
python3.10 -m venv venv
source venv/bin/activate
5. Upgrade pip and install wheel.
pip install --upgrade pip
pip install wheel
6. Install the Python packages needed for data analysis, machine learning, and visualization.
pip3 install "numpy<2" pandas matplotlib seaborn tensorflow jupyter scikit-learn
Step 2: Prepare the Time Series Data
Time series data is a sequence of observations recorded at regular time intervals. For this guide, we will generate synthetic time series data with injected anomalies.
Create a file named prepare_data.py.
nano prepare_data.py
Add the following code.
import numpy as np
import pandas as pd
import matplotlib.pyplot as plt
# Generate synthetic time series data
def generate_data(n=1000):
np.random.seed(42)
time = np.arange(n)
values = np.sin(0.02 * time) + np.random.normal(scale=0.1, size=n)
anomalies = np.random.choice(n, size=10, replace=False)
values[anomalies] += np.random.normal(scale=2, size=10) # Injecting anomalies
return pd.DataFrame({'timestamp': time, 'value': values})
data = generate_data()
data.to_csv("time_series_data.csv", index=False)
Run the script to generate and save the data.
python3 prepare_data.py
This script creates a time series dataset with normal patterns and anomalies and saves it as time_series_data.csv.
Step 3: Build an LSTM Autoencoder for Anomaly Detection
An autoencoder is a neural network trained to reconstruct normal data patterns. When it encounters an anomaly, the reconstruction error is significantly higher.
Create a file to detect anomalies.
nano anomaly_detection.py
Add the following code.
import numpy as np
import pandas as pd
import tensorflow as tf
from tensorflow.keras.models import Sequential
from tensorflow.keras.layers import LSTM, Dense, Dropout, RepeatVector, TimeDistributed
from sklearn.preprocessing import MinMaxScaler
import matplotlib.pyplot as plt
# Load time series data
data = pd.read_csv("time_series_data.csv")
values = data['value'].values.reshape(-1, 1)
# Normalize data
scaler = MinMaxScaler()
values_scaled = scaler.fit_transform(values)
# Create sequences for LSTM
def create_sequences(data, seq_length):
sequences = []
for i in range(len(data) - seq_length):
sequences.append(data[i: i + seq_length])
return np.array(sequences)
seq_length = 50
X_train = create_sequences(values_scaled, seq_length)
# Define LSTM autoencoder
model = Sequential([
LSTM(64, activation='relu', input_shape=(seq_length, 1), return_sequences=True),
Dropout(0.2),
LSTM(32, activation='relu', return_sequences=False),
RepeatVector(seq_length),
LSTM(32, activation='relu', return_sequences=True),
Dropout(0.2),
LSTM(64, activation='relu', return_sequences=True),
TimeDistributed(Dense(1))
])
model.compile(optimizer='adam', loss='mse')
# Train the model
model.fit(X_train, X_train, epochs=20, batch_size=16, validation_split=0.1)
# Save the trained model
model.save("anomaly_detector.h5")
Run the script to train the model.
python3 anomaly_detection.py
This script trains the LSTM autoencoder on normal patterns and saves the model as anomaly_detector.h5.
Epoch 1/20
54/54 [==============================] - 5s 41ms/step - loss: 0.1079 - val_loss: 0.0153
Epoch 2/20
54/54 [==============================] - 2s 34ms/step - loss: 0.0308 - val_loss: 0.0116
Epoch 3/20
54/54 [==============================] - 2s 34ms/step - loss: 0.0196 - val_loss: 0.0103
Epoch 4/20
54/54 [==============================] - 2s 34ms/step - loss: 0.0143 - val_loss: 0.0088
Epoch 5/20
54/54 [==============================] - 2s 34ms/step - loss: 0.0113 - val_loss: 0.0105
Epoch 6/20
54/54 [==============================] - 2s 34ms/step - loss: 0.0096 - val_loss: 0.0075
Step 4: Detect Anomalies
After training the model, we will use it to detect anomalies in the time series data. Create a file named detect_anomalies.py.
nano detect_anomalies.py
Add the following code.
from tensorflow.keras.models import load_model
import numpy as np
import pandas as pd
import matplotlib.pyplot as plt
from sklearn.preprocessing import MinMaxScaler
# Load the trained model with custom loss function
from tensorflow.keras.losses import MeanSquaredError
model = load_model("anomaly_detector.h5", custom_objects={"mse": MeanSquaredError()})
# Load and preprocess data
data = pd.read_csv("time_series_data.csv")
values = data['value'].values.reshape(-1, 1)
# Normalize data
scaler = MinMaxScaler()
values_scaled = scaler.fit_transform(values)
# Create sequences for prediction
def create_sequences(data, seq_length):
sequences = []
for i in range(len(data) - seq_length):
sequences.append(data[i: i + seq_length])
return np.array(sequences)
seq_length = 50
X_test = create_sequences(values_scaled, seq_length)
# Predict reconstruction error
X_pred = model.predict(X_test)
mse = np.mean(np.abs(X_pred - X_test), axis=(1, 2))
threshold = np.percentile(mse, 95) # 95th percentile as anomaly threshold
# Mark anomalies
data = data.iloc[seq_length:]
data['mse'] = mse
data['anomaly'] = data['mse'] > threshold
# Plot anomalies
plt.figure(figsize=(12, 6))
plt.plot(data['timestamp'], data['value'], label='Value', color='blue')
plt.scatter(data['timestamp'][data['anomaly']], data['value'][data['anomaly']], color='red', label='Anomaly')
plt.legend()
plt.title("Anomaly Detection in Time Series Data")
plt.xlabel("Timestamp")
plt.ylabel("Value")
plt.show()
# Save detected anomalies to CSV
data.to_csv("anomalies_detected.csv", index=False)
print("Anomaly detection completed. Results saved in anomalies_detected.csv.")
Run the above script.
python3 detect_anomalies.py
This script detects anomalies and visualizes them while saving results to anomalies_detected.csv.
Anomaly detection completed. Results saved in anomalies_detected.csv.
You can run the command below to display the anomalies detected in the terminal. You can also open the CSV file in a spreadsheet application.
cat anomalies_detected.csv
Output.
timestamp,value,mse,anomaly
50,0.873879381747376,0.05099832916747173,False
51,0.8135997939077313,0.05162067832585881,False
52,0.7947120272127426,0.051868111103225124,False
53,0.933523111229073,0.051020112694549,False
54,0.9850577591345426,0.0504320734778334,False
55,0.9843353719730552,0.05125568314028007,False
56,0.8161786898542412,0.05199617866260993,False
57,0.8777122585307618,0.05020586907291115,False
58,0.9499294519121232,0.04897388883144851,False
59,1.022160525120256,0.048887483703040434,False
60,0.8841216621826973,0.048953077273603506,False
61,0.920533458652686,0.04866946629698113,False
62,0.8351505020489361,0.04704867943636561,False
63,0.8324696791824486,0.04447853718451549,False
64,1.0392684425286447,0.045233664400090544,False
Conclusion
In this article we showed how to detect anomalies in time series data using an LSTM based autoencoder on an Ubuntu GPU server. Now you can apply similar technique to your own time series data to find unusual patterns and issues.
### How to Build an Image Segmentation Pipeline with OpenCV on an Ubuntu GPU Server
Image segmentation is a fundamental task in computer vision that involves dividing an image into multiple segments or regions, each corresponding to different objects or parts of objects. OpenCV is a powerful library for computer vision and it provides various tools to build an image segmentation pipeline.
In this article, we will go through the steps to build a simple image segmentation pipeline using OpenCV.
Prerequisites
Before starting, ensure you have the following:
An Ubuntu 24.04 Cloud GPU Server.
CUDA Toolkit and cuDNN Installed.
A root or sudo privileges.
Step 1: Setting Up the Environment
First, let's set up the environment by installing the necessary packages.
1. Install Python3 and pip
apt install python3 python3-venv python3-dev -y
2. Create a Python virtual environment.
python3 -m venv venv
source venv/bin/activate
3. Upgrade pip to the latest version.
pip install --upgrade pip
4. Install required libraries.
pip3 install opencv-python numpy matplotlib
Explanation:
opencv-python: Provides OpenCV functionalities for image processing.
numpy: Essential for numerical operations and handling image data.
matplotlib: Used for displaying images in Jupyter Notebook.
Step 2: Run Jupyter Notebook
1.Install Jupyter Notebook.
pip install jupyter
2.Open your terminal and run the Jupyter Notebook. If you cannot connect to your notebook, make sure your firewall isn't blocking access.
jupyter notebook --no-browser --port=8888 --ip=your-server-ip --allow-root
Output.
To access the server, open this file in a browser:
file:///root/.local/share/jupyter/runtime/jpserver-6071-open.html
Or copy and paste one of these URLs:
http://your-server-ip:8888/tree?token=eab31988f685c20a6809e4c18033037d0c318a7ac97e4033
http://127.0.0.1:8888/tree?token=eab31988f685c20a6809e4c18033037d0c318a7ac97e4033
2. Open your web browser and access your Jupyter Notebook using the URL as shown in the above output.
3. Click on File => New to create a new Notebook.
Step 3: Import Required Libraries
In the first cell of your Jupyter Notebook, import the required libraries:
# Import libraries
import cv2
import numpy as np
import matplotlib.pyplot as plt
Explanation:
cv2: OpenCV library for image processing.
numpy: For numerical operations.
matplotlib.pyplot: For displaying images in the notebook.
Step 4: Load and Display the Image
In the next cell, load an image and display it using matplotlib:
Note: You will need to upload an image to your server. You can do this using a tool like WinSCP or FileZilla.
# Load an image from file
image = cv2.imread('my_image.jpg')
# Check if the image was loaded successfully
if image is None:
print("Error: Could not load image.")
else:
# Convert the image from BGR to RGB (OpenCV loads images in BGR format)
image_rgb = cv2.cvtColor(image, cv2.COLOR_BGR2RGB)
# Display the image using matplotlib
plt.imshow(image_rgb)
plt.title('Original Image')
plt.axis('off') # Hide axis
plt.show()
Explanation:
cv2.imread('my_image.jpg'): Loads the image from the file. Replace 'my_image.jpg' with the path to your image.
cv2.cvtColor(image, cv2.COLOR_BGR2RGB): Converts the image from BGR (OpenCV default) to RGB for proper display with matplotlib.
plt.imshow(image_rgb): Displays the image.
plt.axis('off'): Hides the axis for a cleaner view.
Output:
Step 5: Convert the Image to Grayscale
Convert the image to grayscale, as many image processing tasks work better on grayscale images:
# Convert the image to grayscale
gray_image = cv2.cvtColor(image, cv2.COLOR_BGR2GRAY)
# Display the grayscale image
plt.imshow(gray_image, cmap='gray')
plt.title('Grayscale Image')
plt.axis('off')
plt.show()
Explanation:
cv2.cvtColor(image, cv2.COLOR_BGR2GRAY): Converts the image to grayscale.
cmap='gray': Ensures the grayscale image is displayed correctly.
Output:
Step 6: Apply Gaussian Blur
Blurring the image helps reduce noise and improve segmentation results:
# Apply Gaussian blur
blurred_image = cv2.GaussianBlur(gray_image, (5, 5), 0)
# Display the blurred image
plt.imshow(blurred_image, cmap='gray')
plt.title('Blurred Image')
plt.axis('off')
plt.show()
Explanation:
cv2.GaussianBlur(gray_image, (5, 5), 0): Applies Gaussian blur with a 5x5 kernel. You can adjust the kernel size for more or less blur.
Output:
Step 7: Apply Thresholding
Thresholding is a simple way to segment an image into foreground and background:
# Apply binary thresholding
_, binary_image = cv2.threshold(blurred_image, 127, 255, cv2.THRESH_BINARY)
# Display the binary image
plt.imshow(binary_image, cmap='gray')
plt.title('Binary Image')
plt.axis('off')
plt.show()
Explanation:
cv2.threshold(blurred_image, 127, 255, cv2.THRESH_BINARY): Applies binary thresholding. Pixels with intensity > 127 are set to 255 (white), and others are set to 0 (black).
Output:
Step 8: Detect Edges Using Canny Edge Detection
Edge detection is another common technique for image segmentation:
# Detect edges using Canny edge detection
edges = cv2.Canny(blurred_image, 100, 200)
# Display the edges
plt.imshow(edges, cmap='gray')
plt.title('Edges')
plt.axis('off')
plt.show()
Explanation:
cv2.Canny(blurred_image, 100, 200): Detects edges using the Canny algorithm. The thresholds 100 and 200 control the sensitivity of edge detection.
Output:
Step 9: Find Contours
Contours are useful for identifying objects in an image:
# Find contours
contours, _ = cv2.findContours(binary_image, cv2.RETR_TREE, cv2.CHAIN_APPROX_SIMPLE)
# Draw contours on the original image
contour_image = cv2.drawContours(image.copy(), contours, -1, (0, 255, 0), 2)
# Convert the image to RGB for display
contour_image_rgb = cv2.cvtColor(contour_image, cv2.COLOR_BGR2RGB)
# Display the image with contours
plt.imshow(contour_image_rgb)
plt.title('Contours')
plt.axis('off')
plt.show()
Explanation:
cv2.findContours(binary_image, cv2.RETR_TREE, cv2.CHAIN_APPROX_SIMPLE): Finds contours in the binary image.
cv2.drawContours(image.copy(), contours, -1, (0, 255, 0), 2): Draws contours on a copy of the original image. The color (0, 255, 0) is green, and 2 is the thickness of the contour lines.
Output:
Step 10: Save the Final Output
Finally, save the image with contours to a file:
# Save the image with contours
cv2.imwrite('output_image.jpg', cv2.cvtColor(contour_image_rgb, cv2.COLOR_RGB2BGR))
print("Output image saved as 'output_image.jpg'")
Explanation:
cv2.imwrite('output_image.jpg', contour_image_rgb): Saves the image with contours to a file.
Conclusion
By following these steps in a Jupyter Notebook you can build a simple image segmentation pipeline using OpenCV. The notebook environment allows you to visualize each step of the process, so you can understand and debug it better. You can further extend this pipeline with more advanced techniques like semantic segmentation or deep learning based approaches.
### How to Create Style Transfer Models Using PyTorch on an Ubuntu GPU Server
Style transfer is a cool deep learning technique that allows you to mix one image's content with another's style. PyTorch is a great choice for style transfer because of its flexibility and efficiency in handling dynamic computational graphs. This makes it very suitable for the iterative and experimental nature of adjusting and applying artistic styles to images.
In this article, we will describe the process of creating a style transfer model using PyTorch in a Jupyter Notebook on an Ubuntu GPU server.
Prerequisites
Before starting, ensure you have the following:
An Ubuntu 24.04 Cloud GPU Server.
CUDA Toolkit and cuDNN Installed.
A root or sudo privileges.
Step 1: Setting Up the Environment
First, let's set up the environment by installing the necessary packages.
1. Install Python3 and pip
apt install python3 python3-venv python3-dev
2. Create a Python virtual environment.
python3 -m venv venv
source venv/bin/activate
3. Upgrade pip to the latest version.
pip install --upgrade pip
4. Install PyTorch with CUDA support.
pip3 install torch torchvision torchaudio --extra-index-url https://download.pytorch.org/whl/cu118
5. Install additional dependencies.
pip3 install jupyter numpy matplotlib pillow
Step 2: Run Jupyter Notebook
1. Open your terminal and run the Jupyter Notebook.
jupyter notebook --no-browser --port=8888 --ip=your-server-ip --allow-root
Output.
To access the server, open this file in a browser:
file:///root/.local/share/jupyter/runtime/jpserver-6071-open.html
Or copy and paste one of these URLs:
http://your-server-ip:8888/tree?token=eab31988f685c20a6809e4c18033037d0c318a7ac97e4033
http://127.0.0.1:8888/tree?token=eab31988f685c20a6809e4c18033037d0c318a7ac97e4033
2. Open your web browser and access your Jupyter Notebook using the URL as shown in the above output.
3. Click on File and New to create a new notebook.
Step 3: Load and Preprocess Images
We'll start by loading and preprocessing the content and style images. Run the following code in a Jupyter Notebook cell.
import torch
import torchvision.transforms as transforms
from PIL import Image
import matplotlib.pyplot as plt
import numpy as np
# Load image function
def load_image(image_path, max_size=400, shape=None):
image = Image.open(image_path).convert('RGB')
if max(image.size) > max_size:
size = max_size
else:
size = max(image.size)
if shape is not None:
size = shape
in_transform = transforms.Compose([
transforms.Resize(size),
transforms.ToTensor(),
transforms.Normalize((0.485, 0.456, 0.406),
(0.229, 0.224, 0.225))])
image = in_transform(image).unsqueeze(0)
return image
# Function to convert tensor to image
def tensor_to_image(tensor):
image = tensor.to("cpu").clone().detach()
image = image.numpy().squeeze()
image = image.transpose(1, 2, 0)
image = image * np.array((0.229, 0.224, 0.225)) + np.array((0.485, 0.456, 0.406))
image = image.clip(0, 1)
return image
# Load content and style images
content = load_image("content.jpg")
style = load_image("style.jpg", shape=content.shape[-2:])
# Display the images
plt.figure()
plt.imshow(tensor_to_image(content))
plt.title("Content Image")
plt.show()
plt.figure()
plt.imshow(tensor_to_image(style))
plt.title("Style Image")
plt.show()
You should see two images displayed: the content image and the style image.
Explanation:
load_image: This function loads an image, resizes it, and converts it to a tensor. The image is also normalized using the mean and standard deviation of the ImageNet dataset.
tensor_to_image: This function converts a tensor back to an image format that can be displayed using matplotlib.
Step 4: Define the Model
Next, we'll define the model for style transfer. Run the following code in a new cell.
import torch.nn as nn
import torchvision.models as models
# Load a pre-trained VGG19 model
vgg = models.vgg19(pretrained=True).features
# Freeze all VGG parameters since we're only optimizing the target image
for param in vgg.parameters():
param.requires_grad_(False)
# Move the model to GPU if available
device = torch.device("cuda" if torch.cuda.is_available() else "cpu")
vgg.to(device)
# Define the layers for content and style features
content_layers = ['conv_4']
style_layers = ['conv_1', 'conv_2', 'conv_3', 'conv_4', 'conv_5']
# Function to get the features from the model
def get_features(image, model, layers=None):
if layers is None:
layers = {'0': 'conv_1',
'5': 'conv_2',
'10': 'conv_3',
'19': 'conv_4',
'21': 'conv_5'}
features = {}
x = image
for name, layer in model._modules.items():
x = layer(x)
if name in layers:
features[layers[name]] = x
return features
Explanation:
VGG19: We use a pre-trained VGG19 model, which is well-suited for style transfer due to its deep architecture.
get_features: This function extracts features from specific layers of the VGG19 model, which will be used to compute the content and style losses.
Step 5: Define Loss Functions
Now, let's define the loss functions for style transfer. Run the following code in a new cell.
import torch.nn.functional as F
# Content Loss
def content_loss(target_features, content_features):
return F.mse_loss(target_features['conv_4'], content_features['conv_4'])
# Style Loss
def gram_matrix(tensor):
_, d, h, w = tensor.size()
tensor = tensor.view(d, h * w)
gram = torch.mm(tensor, tensor.t())
return gram
def style_loss(target_features, style_features):
loss = 0
for layer in style_features:
target_feature = target_features[layer]
style_feature = style_features[layer]
target_gram = gram_matrix(target_feature)
style_gram = gram_matrix(style_feature)
loss += F.mse_loss(target_gram, style_gram)
return loss
# Total Loss
def total_loss(content_loss, style_loss, alpha=1, beta=1e6):
return alpha * content_loss + beta * style_loss
Explanation:
content_loss: This function computes the mean squared error between the content features of the target image and the content image.
style_loss: This function computes the style loss using the Gram matrix, which captures the style information.
total_loss: This function combines the content and style losses with weights alpha and beta.
Step 6: Perform Style Transfer
Finally, let's put everything together and perform the style transfer. Run the following code in a new cell.
# Perform style transfer
import torch.optim as optim
# Load content and style images
content = load_image("content.jpg").to(device)
style = load_image("style.jpg", shape=content.shape[-2:]).to(device)
# Initialize the target image as the content image
target = content.clone().requires_grad_(True).to(device)
# Get features for content and style images
content_features = get_features(content, vgg)
style_features = get_features(style, vgg)
# Optimizer
optimizer = optim.Adam([target], lr=0.003)
# Style transfer loop
epochs = 3000
for epoch in range(epochs):
target_features = get_features(target, vgg)
c_loss = content_loss(target_features, content_features)
s_loss = style_loss(target_features, style_features)
t_loss = total_loss(c_loss, s_loss)
optimizer.zero_grad()
t_loss.backward()
optimizer.step()
if epoch % 100 == 0:
print(f"Epoch {epoch}, Loss: {t_loss.item()}")
plt.imshow(tensor_to_image(target))
plt.title(f"Epoch {epoch}")
plt.show()
# Save the final image
final_image = tensor_to_image(target)
plt.imshow(final_image)
plt.title("Final Image")
plt.show()
# Convert the NumPy array to a PIL image and save it
final_image_pil = Image.fromarray((final_image * 255).astype(np.uint8))
final_image_pil.save("final_output.jpg")
Explanation:
Optimizer: We use the Adam optimizer to minimize the total loss.
Style Transfer Loop: We iteratively update the target image to minimize the content and style losses.
Final Image: After the optimization process, the final image is saved as final_output.jpg.
You should see the target image being updated over epochs, gradually blending the content of the content image with the style of the style image. The final output will be saved as final_output.jpg.
Conclusion
In this article, we created a style transfer model using PyTorch in a Jupyter Notebook. We covered image preprocessing, model definition, loss functions, and the style transfer process. Now, you can create your own style transfer models and experiment with different content and style images.
### What Are Managed Services?
What Are Managed Services?
Managed services are services provided to a company or organization by a third party that shift the responsibility for specific processes, functions, and operations from that company to the third party. While managed services apply to several activities, they frequently refer to IT solutions, offering a proactive approach to modernizing business operations by making them cloud-ready and future-proof.
Managed services give companies the time needed to focus on their core competencies without the burden of managing IT operations in-house. Outsourcing IT services maximizes your business's efficiency, providing peace of mind and knowing that you are in the capable hands of a team of experts.
MSPs deliver a comprehensive service wrap for new and existing environments, from network management and data backup to cybersecurity and a managed cloud computing platform. Managed services are designed to optimize your business performance, providing the critical IT support needed to thrive in a competitive market.
Learn more in our detailed guide exploring what a managed service provider is and what they can do for you.
The Rise of Managed Services
Managed services have become increasingly popular as organizations recognize the benefits of outsourcing their IT needs to specialists. In a recent study by Gartner, the global managed services market is expected to reach $393.72 billion by 2028. The report attributes this growth to several factors, including:
The increasing complexity of IT infrastructures
Growing demand for cloud computing
Need for improved business security
Scarcity of skilled IT professionals
The Shift Towards Multi-Cloud and Hybrid Cloud Environments
Businesses no longer rely solely on a single cloud provider. Instead, they are adopting multi-cloud and hybrid cloud environments to optimize their business operations, improve resilience to downtime and gain a competitive edge.
This shift enables organizations to leverage the strengths of multiple cloud platforms and utilize various managed services from each provider. All providers have distinctive advantages, and a multi-cloud strategy empowers you to cherry-pick the managed services appropriate to your business.
Likewise, hybrid cloud environments balance on-premises infrastructure and public cloud resources. As a result, hybrid is perfect for organizations that need to control sensitive data while utilizing the cloud's scalability, agility, and powerful computing.
The Growing Demand for Remote Work and Collaboration Solutions
The COVID-19 pandemic accelerated the demand for remote working and collaboration solutions, and this can be evidenced when you consider how many of us still work from home today. As a result, businesses now offer hybrid working as a unique selling point for job vacancies, resulting in enterprises looking for an effective way to communicate and collaborate among their teams seamlessly.
Remote work solutions, such as video conferencing, project management tools, and virtual collaboration platforms, have become essential for maintaining productivity and fostering teamwork in a distributed work environment. These tools facilitate real-time communication, file sharing, and employee engagement, ensuring everyone can collaborate effectively regardless of location.
The Growing Role of Artificial Intelligence and Automation
Artificial Intelligence (AI) and automation are transforming industries across the board. Organizations leverage AI and automation technologies to streamline processes, improve efficiency, and drive innovation.
AI-powered solutions can analyze vast amounts of data, provide valuable insights, and automate repetitive tasks, enabling businesses to make data-driven decisions and allocate resources more effectively. From chatbots and virtual assistants to machine learning algorithms and predictive analytics, AI and automation are revolutionizing how businesses operate, enhancing customer experiences, and optimizing workflows.
Managed service providers enable you to embrace these trends, empower organizations to stay ahead in a rapidly evolving working environment, and unlock new opportunities for growth and success.
Learn more in the detailed guide to managed services.
Better Cost Control
Arguably, financial benefits are the most crucial aspect of managed services. Of course, you still have to pay for your services; however, by outsourcing IT operations, organizations can eliminate the need for costly in-house IT infrastructure and personnel.
Purchasing servers and infrastructure is expensive; hardware costs are astronomical, and maintenance contracts typically cost thousands of dollars per server. Also, remember that IT salaries are some of the highest in the market, especially if you want the best hires.
MSPs negate these problems by offering flexible and affordable pricing models, allowing businesses to pay on-demand for only the services they need without any upfront investments or unexpected costs.
The financial benefits are clear; leveraging the MSP's professional expertise, utilizing the extensive computing resources, and gaining access to the latest cutting-edge technologies and skilled professionals is priceless.
MSPs can also optimize any existing IT systems, helping you streamline operations and identify additional areas where cost savings can be achieved. Add the ability to monitor and maintain the infrastructure proactively, reducing the risk of costly downtime and unexpected repairs; outsourcing is a compelling option.
Improved Risk Management
Managing risk is a vital concept within managed services. Cybersecurity is a hot topic in the industry. Managed services are crucial in implementing robust security measures to protect sensitive data, guard against cyber threats, and ensure regulatory compliance.
Detailed monitoring tools underpin risk management, and additional safeguards such as performing regular backups and developing disaster recovery plans will help minimize any potential impact.
High Availability, Efficiency & Productivity,
The day-to-day management of servers and infrastructure ensures that IT systems are consistently monitored, maintained, and optimized, minimizing the risk of downtime and service disruptions. With proactive monitoring, potential issues are identified and resolved before they may impact business operations.
MSPs offer round-the-clock support of server resources, reducing response times and ensuring quick resolution of IT-related problems. This leads to improved operational efficiency and empowers employees to work seamlessly without interruptions.
Choosing Managed Services Providers
Evaluating MSP Capabilities and Expertise
Before you pick an MSP, look at the technical expertise available. You want a provider that understands your industry's unique IT requirements and has the attributes to meet them. For example, if you are an e-commerce organization, it may prove beneficial to work with a PCI-Compliant provider; likewise, if you are a healthcare practice, you need someone who is HIPAA-Compliant.
The best Managed Service Providers will have a team of certified professionals who are well-versed in the latest technologies and best practices and can demonstrate their experience managing similar IT environments. Feel free to ask for case studies or references to gauge their competency.
Understanding the MSP's Service-Level Agreements (SLAs)
The SLA is crucial to any MSP contract. They define the baseline level of service you can expect and provide a clear framework for accountability. Be sure to understand what each SLA covers, the performance metrics the MSP will adhere to, and the resolution path should they fail to meet those standards. A reputable MSP will have transparent SLAs that align directly with your business needs.
Checking MSP's Security and Compliance Measures
As data breaches become increasingly common, ensuring your MSP has robust security measures is essential. Ask them about their data protection policies, security certifications, and how they handle potential security threats. Equally important is their compliance with industry-specific regulations.
Evaluating MSP's Communication and Support Structure
Finally, effective communication and a supportive structure are vital. A good MSP will be there for you 24/7, responding promptly to your queries and concerns. They should have a straightforward escalation process in place and be able to provide remote and on-site support on demand. Moreover, they should proactively inform you about any changes or updates your IT environment requires.
Discover Atlantic.Net Managed Services
In today's highly competitive and increasingly digital business landscape, you need a trusted partner who understands the ins and outs of cutting-edge technology and how to provide a secure, efficient, and scalable digital environment. That's where Atlantic.Net comes in.
With our Managed Private Cloud, your business gains efficiency, scalability, and an unmatched level of security. We provide the cutting-edge cloud computing solutions you need while allowing you to focus on what matters – growing your core business.
Best Practices for Implementing Managed Services
Implementing managed services is a strategic decision that can significantly benefit your business. Initiatives include cost savings, increased efficiency, and access to expert knowledge and cutting-edge technology. However, following best practices during the implementation process is essential to fully realize these benefits.
Here are some key considerations:
Clearly Defining Objectives and Scope of Services
The first step to a successful MSP partnership is clearly understanding your objectives. What challenges are you trying to address? For example, are you aiming to improve network security, enhance data management, or streamline IT operations? Identifying your specific needs will guide the scope of services, ensuring alignment between your organization's goals and the MSP's offerings.
After establishing the objectives, defining the scope of services is crucial. This refers to the specific tasks the MSP will handle. Be explicit about what's included and what isn't. For example, will the MSP provide round-the-clock monitoring? Are software updates part of their responsibilities? A detailed scope of services eliminates ambiguity, promoting a smooth partnership.
Establishing Clear Communication Channels
Effective communication is a cornerstone of any successful relationship, and your partnership with an MSP is no different. Establishing clear communication channels is essential for addressing concerns promptly and making necessary adjustments.
Regular updates on the MSP's activities give you an insight into their work, strengthening the trust between both parties. Consider setting up weekly or monthly meetings to discuss progress, challenges, and plans. Also, ensure there are established procedures for urgent communication needs, such as network outages or security breaches.
Developing a Comprehensive Service-Level Agreement
The Service-Level Agreement (SLA) is a crucial document in an MSP partnership. It outlines the expectations for the MSP, detailing the services they will provide, performance standards, and remedies or penalties for non-compliance.
The SLA should be comprehensive, covering all aspects of the partnership. It should specify the response time for service issues, data protection measures, and disaster recovery plans. By laying out these details, the SLA safeguards the interests of both parties, providing a clear roadmap for the partnership.
Regularly Reviewing and Updating the Scope of Services
In a dynamic IT landscape, static service offerings can quickly become outdated. Regular service reviews ensure your needs are continually met. This could involve adding new services as your business grows or removing services you may no longer require.
Updating the scope of services is more than adapting to your organization's changes. It's also about leveraging the evolving capabilities of the MSP. As they adopt new technologies and methodologies, they can offer more innovative solutions that benefit your business.
Monitoring and Measuring the Performance of the MSP
Lastly, monitoring the MSP's performance is vital to the partnership's success. This involves tracking key performance indicators (KPIs) that align with your objectives. For instance, if your goal is to improve network uptime, the MSP's uptime statistics would be a relevant KPI.
Regular performance assessments ensure the MSP is fulfilling its obligations and help identify areas for improvement. Remember, the goal isn't micromanaging the MSP but ensuring they deliver the promised value.
Examples of Managed Services
Atlantic.Net offers an impressive suite of managed services designed to provide technical prowess and a competitive advantage for your business.
Cloud Services Management
Managed Private Cloud
Managed Private Cloud is a specialized service with a dedicated cloud computing infrastructure maintained exclusively for clients. This means that all the resources and capabilities of the cloud, from servers to storage to network components, are solely dedicated to that organization. A managed private cloud offers a high level of control and customization. Unlike public clouds, which are shared among multiple users, private clouds can be tailored to meet the business's unique needs, including specific performance, security, and compliance requirements. This ensures that companies can fully utilize cloud technology's scalability and efficiency while meeting their needs.
Learn more in the detailed guides to:
SaaS architecture
HPC on Azure
Linux on Azure
SAP on Azure
Cloud hosting
Related product offering: Atlantic.Net Dedicated Server Hosting | High Performance Dedicated Servers
Related technology updates:
[Blog] 9 Essential Features of Dedicated Server Hosting
[Blog] - What Is the Difference Between a Dedicated Server and a Dedicated Cloud Host?
Cloud Database Services
Cloud Database Services has revolutionized how businesses handle data, offering a dynamic and flexible virtual data storage and management environment. With these services, companies can access their data anytime, anywhere, with an internet connection, a significant shift from traditional databases that required physical infrastructure and dedicated IT personnel.
In addition to flexibility and scalability, Cloud Database Services provide robust disaster recovery solutions, ensuring minimal disruption to operations in case of a system failure or data loss. Enhanced with advanced security measures such as data encryption, access controls, and routine security audits, these services offer businesses peace of mind about protecting their sensitive information.
Learn more in the detailed guides to
AWS database
AWS big data
Azure database
Azure big data
Google Cloud database
IT Consulting Services
IT consulting services provide expert advice and strategic direction to your business by helping you harness the technology needed to meet your unique business objectives. As companies grow, so does the complexity and load on the IT infrastructure.IT professionals assist in identifying system bottlenecks, projecting future tech needs, and optimizing IT operations to align with your business goals.
This strategic approach results in streamlined processes enhanced productivity, and minimized downtime. Consequently, it can lead to increased customer satisfaction and business growth.
Learn more in the detailed guide to IT consulting services
Related product offering: Atlantic.Net Dedicated Server Hosting | High Performance Dedicated Servers
Related technology update: [Ebook] How to Build a Security Framework if You’re a Resource Drained IT Security Team
Virtual Desktop Infrastructure (VDI).
With VDI-managed services, organizations can access their desktops and applications securely from anywhere, anytime, using any device. A scalable solution eliminates the need for costly on-premises infrastructure, enhances data security, and simplifies IT management. It empowers businesses to streamline operations, improve productivity, and adapt to dynamic work environments while ensuring a seamless user experience.
Learn more in the detailed guides to:
VDI
VDI on Azure
Supply Chain Management
Supply Chain Management is the backbone of efficient business operations, and partnering with a Managed Service provider can yield substantial benefits. Organizations can leverage their expertise to optimize logistics, inventory, and procurement processes, enhancing visibility and control across the supply chain. By harnessing advanced technologies and analytics, Managed Service providers empower businesses to streamline operations, mitigate risks, and achieve cost savings, ultimately driving growth and customer satisfaction.
CDN.
The Network Edge plays a vital part in protecting your infrastructure. A DDoS Protection service acts like a digital fortress around your network. It's designed to absorb Distributed Denial of Service (DDoS) attacks, ensuring your platform remains available and accessible. This service helps keep your network resilient against a flood of malicious traffic that DDoS attacks are known to unleash.
Learn more in the detailed guide to CDN
Imperva Secure CDN | Fast and Secure Content Delivery Network
Related technology updates:
[Blog] 9 Recommendations to Prevent Bad Bots on Your Website
[Blog] The New York Times vs. OpenAI: A Turning Point for Web Scraping?
Security Services Management
SSM is an oversight of security functions within an organization. It entails coordinating resources, processes, and technologies to protect and maintain the integrity of the organization's assets. This includes physical assets and proprietary information to digital resources and reputation. SSM's critical functions involve risk management, implementation of security protocols, incident response, and ensuring compliance with relevant regulations.
This system of managing and mitigating risks helps safeguard sensitive data. It fosters a security culture, improving business continuity, customer trust, and overall organizational health.
Managed Security and Compliance
Managed security and compliance services help organizations meet industry regulations while protecting sensitive data and systems from cyber threats. These services include continuous monitoring, threat detection, risk assessments, and automated compliance reporting to ensure that organizations remain compliant with relevant standards.
Compliance regulations vary by industry, but some key examples include:
HIPAA (Health Insurance Portability and Accountability Act): Required for healthcare organizations to protect patient data and ensure privacy.
PCI DSS (Payment Card Industry Data Security Standard): Mandates security measures for organizations handling credit card transactions.
GDPR (General Data Protection Regulation): Enforces data protection and privacy rules for organizations handling personal data of individuals in the EU.
SOC 2 (Service Organization Control 2): Ensures service providers securely manage customer data to protect privacy and interests.
ISO 27001 (International Organization for Standardization 27001): Provides a framework for managing information security risks.
NIST Cybersecurity Framework: A voluntary framework used to improve security and resilience against cyber threats.
Learn more in the detailed guide to PCI compliance
Related product offering: Tigera | Security and Observability for Containers and Kubernetes
Related technology update: [Whitepaper] SOC 2 Security Compliance for Containers and Kubernetes
Providing Payroll Services
Comprehensive Payroll Services are all about streamlining the payroll process. The MSP ensures tax regulations and labor laws, accurate employee data, and timely payment disbursements are followed. Expertise in payroll administration and advanced software enables businesses to focus on core operations while enjoying efficient, error-free payroll management.
Learn more in the detailed guide to global payroll
Incident Response Services
Our dedicated teams proactively monitor your systems, and our 24/7 NOC handle automated alerts or customer interactions. The team is tasked to promptly identify and resolve issues, minimizing downtime and maximizing system availability. In addition, all incidents are logged in our ticketing system.
Load Balanced Servers
With cutting-edge load-balancing technology, traffic is efficiently distributed across multiple servers minimizing downtime and scalability. In addition, our infrastructure and expert support ensures a seamless user experience.
Learn more in the detailed guide to load balanced servers.
Related technology updates:
[Blog] How Secure is the Cloud?
[Blog] How to Best Mitigate Cybersecurity Risks and Protect Your Data
Colocation Hosting
Colocation allows clients to lease space in one or multiple data centers while maintaining complete ownership and control of the hardware and software settings. The service provides enhanced Internet bandwidth, reliable power, and robust cooling systems.
The enhanced security offered is apt for industries requiring secure on-site data storage. Moreover, it facilitates high bandwidth, low latency, redundant power feeds, advanced climate control systems, and constant equipment monitoring.
Learn more in the detailed guide to colocation hosting
Dedicated Server Hosting
Dedicated server hosting is a robust hosting environment that provides exclusive access to an entire server's resources for a single user. Unlike shared or virtual hosting options, where resources are divided among multiple users, dedicated hosting allocates the entirety of a server's power— its processing, memory, storage, and bandwidth— to a single tenant—ensuring peak performance, as there are no other websites or applications to compete with for resources.
The primary advantage of dedicated server hosting lies in its remarkable power and control. Users have full root and admin access, allowing them to configure the server according to their specific needs and security requirements. This makes dedicated servers ideal for businesses with high-traffic websites or those requiring extensive customization and security, such as e-commerce platforms, large corporations, and tech companies.
Learn more in the detailed guide to dedicated server hosting.
Related product offering: USA Dedicated Hosting
VoIP Cloud Service
VoIP (Voice over Internet Protocol) cloud services offer a more flexible and cost-effective solution for businesses compared to traditional telephony systems. This service allows voice communications to be made over the internet, converting analog voice signals into digital data packets. VoIP services hosted in the cloud provide improved reliability, scalability, and security compared to traditional on-premise deployments.
Unlike traditional virtual phone systems that often involve hefty initial investments and ongoing maintenance costs, VoIP services generally require a lower upfront investment and can significantly reduce monthly phone bills. Cloud-based VoIP solutions are inherently scalable, allowing businesses to easily add or remove phone lines and features as their needs change.
Related product offering: VoIP Cloud Server Service
Related technology updates:
[Blog] How to Secure SSH Server on Arch Linux
[Blog] Lessons Learned in 2022 About Cybersecurity for 2023 and Beyond
Unlock your IT potential with Atlantic.Net Managed Services. Streamline IT operations and accelerate growth with a comprehensive range of security, infrastructure management, data protection, recovery, and transformative managed services. Contact us today for a personalized consultation. For faster application deployment, free IT architecture design, and assessment, call 888-618-DATA (3282) or email us at sales@atlantic.net.
Cloud Business VoIP Service
Related guides
Authored by Atlantic.Net
VoIP Cloud Servers
Cloud VoIP
Top 10 Cloud VoIP Providers
Related product offering:Atlantic.Net Cloud Platform | Scalable, Secure Cloud Solutions
Offered by Atlantic.Net
Cloud Hosting
Secure Block Storage (SBS)
Top 10 Cloud VoIP Providers
Related technology updates:
[Blog] How to Secure SSH Server on Arch Linux
[Blog] Lessons Learned in 2022 About Cybersecurity for 2023 and Beyond
IT Consulting Services
Authored by Atlantic.Net
Managed Consulting Services
Best Cloud Consultancy or MSP in 2024
Top 13 Difficult Questions Your HIPAA Consultant Should Be Asking You
Related product offering:Atlantic.Net Cloud Platform | Scalable, Secure Cloud Solutions
Offered by Atlantic.Net
Cloud Backups (Snapshots)
Atlantic.Net Teams (ANT) Collaboration Service
Related technology updates:
[Ebook] How to Build a Security Framework if You’re a Resource Drained IT Security Team
Load Balanced Servers
Related guides
Authored by Atlantic.Net
Load Balanced Servers
Maximizing Uptime: Understanding Server Load Balancing
How to Check Your Server Load in Linux
Related technology updates:
[Blog] How Secure is the Cloud?
[Blog] How to Best Mitigate Cybersecurity Risks and Protect Your Data
Multi-Factor Authentication Solution
Related guides
Authored by Atlantic.Net
Multi-Factor Authentication Service
Top 10 MFA Providers: How to Choose an MFA Provider
What Is MFA as a Service? | Multi-Factor Authentication Services
Related product offering:Atlantic.Net Cloud Platform | Scalable, Secure Cloud Solutions
Server Management
Related guides
Authored by Atlantic.Net
Server Management Services
How to Manage a Windows Server
Top 10 Server Management Software Solutions
USA Dedicated Hosting
Related guides
Authored by Atlantic.Net
USA Dedicated Server Hosting
Dedicated Hosts | Dedicated Cloud Host
What Is Cloud Hosting
Related guides
Authored by Atlantic.Net
What Is Cloud Hosting?
What Is a DNS? Complete Domain Name System Guide
What Is VMWare?
Related product offering:Atlantic.Net Cloud Platform | Scalable, Secure Cloud Solutions
Related technology updates:
[Blog] 9 Essential Features of Dedicated Server Hosting
[Blog] What Is the Difference Between a Dedicated Server and a Dedicated Cloud Host?
CDN
Related guides
Authored by Imperva
The Essential CDN Guide
How to Reduce Network Latency | CDN Guide
What is Anycast Routing | Anycast DNS | CDN Guide
Related product offering:Imperva Secure CDN | Fast and Secure Content Delivery Network
Related technology updates:
[Blog] 9 Recommendations to Prevent Bad Bots on Your Website
[Blog] The New York Times vs. OpenAI: A Turning Point for Web Scraping?
PCI Compliance
Related guides
Authored by Tigera
PCI Compliance: Merchant Levels, 12 Requirements & PCI in the Cloud
AWS PCI Compliance: 5 Ways to Make Your Cloud Compliant
Azure PCI Compliance: A Quick Guide for Cloud Users
Related product offering:Tigera | Security and Observability for Containers and Kubernetes
Offered by Tigera
Vulnerability Management
Security Policy Management
Multi-Cloud Security
Related technology updates:
[Whitepaper] SOC 2 Security Compliance for Containers and Kubernetes
MDR Security
Related guides
Authored by BlueVoyant
Understanding MDR Security: Benefits and Core Technologies
What is Managed Detection and Response (MDR)?
Managed Security Services: MSP, MSSP, MDR, and More
SaaS Architecture
Related guides
Authored by Frontegg
The Evolution of SaaS Architecture
SaaS Reporting Guide: Everything You Need to Know
Roles and Permissions Handling in SaaS Applications
AWS Big Data
Related guides
Authored by NetApp
AWS Big Data: 6 Options You Should Consider
AWS Data Lake: End-to-End Workflow in the Cloud
AWS Data Analytics: Choosing the Best Option for You
AWS Database
Related guides
Authored by NetApp
Types of Database Services Offered on AWS
Managed or Self-Managed?: Two options for Oracle databases on AWS
AWS Oracle RDS: Running Your First Oracle Database on Amazon
Azure Big Data
Related guides
Authored by NetApp
Azure Big Data: 3 Steps to Building Your Solution
Azure Data Lake: 4 Building Blocks and Best Practices
Azure Data Box: Solution Overview and Best Practices
Azure Database
Related guides
Authored by NetApp
Azure Database Services: OLAP, OLTP & NoSQL
Azure SQL Database: 18 Options for SQL Server on the Cloud
Azure Oracle: Your First Oracle Database on Azure
Google Cloud Database
Related guides
Authored by NetApp
Google Cloud Database: The Right Service for Your Workloads
Google Cloud SQL: MySQL, Postgres and MS SQL on Google Cloud
SQL Server on Google Cloud: Two Deployment Options
HPC on Azure
Related guides
Authored by NetApp
HPC on Azure: Best Practices for Successful Deployments
Cloud Architects: Supercharge Your HPC Workloads in Azure
What is Cloud Performance
Linux on Azure
Related guides
Authored by NetApp
Linux on Azure: Optimizing Cost, Performance, and Security
Migrate Your Linux Workloads to Azure
Three Reasons Why Your Linux Cloud-First Mandate Needs Azure
SAP on Azure
Related guides
Authored by NetApp
SAP on Azure: The Complete Guide
SAP Deployment: A 5-Step Process and 3 Cloud Deployment Options
SAP HANA Migration: Methods and Considerations
VDI on Azure
Related guides
Authored by NetApp
VDI on Azure (Azure Virtual Desktop): Complete Guide
Microsoft Windows Desktop Virtualization in Azure
Azure Remote Desktop Services & WVD: Which is Right for You?
Additional Managed Services Resources
Below are additional articles that can help you learn about Managed Services topics.
Integrating SalesForce with AWS
What Is AWS Aurora?
2FA vs MFA: 5 Key Differences and How to Choose
### How to Perform Clustering with K-means and Visualize Results on an Ubuntu GPU Server
Clustering is a fundamental unsupervised machine learning technique for grouping similar data points together. K-means clustering is one of the most popular clustering algorithms due to its simplicity and efficiency. However, with large datasets, the computational cost can be high. Leveraging GPU acceleration can greatly reduce the time taken for clustering and make it possible to work with large data.
In this article, we will review how to do K-means clustering on an Ubuntu GPU server.
Prerequisites
Before starting, ensure you have the following:
An Ubuntu 24.04 Cloud GPU Server.
CUDA Toolkit and cuDNN Installed.
A root or sudo privileges.
Step 1: Setting Up the Python Environment
First, you will need to set up the environment for Python.
1. Add the Python 3.10 repository.
add-apt-repository ppa:deadsnakes/ppa
2. Install Python3.10 and pip.
apt install python3 python3-venv python3-dev
3. Create a Python virtual environment.
python3.10 -m venv venv-kmeans
source venv-kmeans/bin/activate
4. Upgrade pip to the latest version.
pip install --upgrade pip
5. Install the necessary libraries.
pip install cuml-cu12 --extra-index-url=https://pypi.nvidia.com
pip3 install matplotlib numpy
The cuml-cu12 package is a GPU-accelerated machine learning library from NVIDIA, and matplotlib is used for data visualization.
6. Install Nvidia CUDA
apt install nvidia-cuda-toolkit -y
7. Instal cuDNN Drivers.
wget https://developer.download.nvidia.com/compute/cuda/repos/ubuntu2204/x86_64/cuda-keyring_1.1-1_all.deb
sudo dpkg -i cuda-keyring_1.1-1_all.deb
sudo apt-get update
sudo apt-get -y install cudnn
Step 2: Generating Synthetic Data
Synthetic data is often used to test and prototype machine learning algorithms. It allows you to control the data distribution and size, making it easier to validate the clustering algorithm.
1. Create a file named generate_data.py.
nano generate_data.py
Add the following code:
# generate_data.py
import numpy as np
# Generate synthetic data
np.random.seed(42)
data = np.random.rand(1000, 2) # 1000 points in 2D space
# Save the data to a file
np.save('data.npy', data)
print("Data generated and saved to 'data.npy'.")
2. Run the script to generate and save the data:
python3 generate_data.py
This script generates 1000 random points in 2D space and saves them to a file named data.npy.
Data generated and saved to 'data.npy'.
Step 3: Performing K-means Clustering
K-means clustering is used to partition the data into a predefined number of clusters. Using GPU acceleration significantly speeds up the computation, especially for large datasets.
1. Create a file named kmeans_clustering.py.
nano kmeans_clustering.py
Add the following code:
# kmeans_clustering.py
import numpy as np
from cuml import KMeans
import matplotlib.pyplot as plt
# Load the generated data
data = np.load('data.npy')
# Perform K-means clustering
kmeans = KMeans(n_clusters=3, random_state=42)
kmeans.fit(data)
# Get the cluster labels and centroids
labels = kmeans.labels_
centroids = kmeans.cluster_centers_
# Save the results
np.save('labels.npy', labels)
np.save('centroids.npy', centroids)
# Visualize the clusters
plt.scatter(data[:, 0], data[:, 1], c=labels, cmap='viridis', s=50)
plt.scatter(centroids[:, 0], centroids[:, 1], c='red', marker='X', s=200, alpha=0.75)
plt.title('K-means Clustering')
plt.savefig('clusters.png')
plt.show()
print("Clustering completed. Results saved to 'labels.npy', 'centroids.npy', and 'clusters.png'")
2. Run the script to perform clustering and visualize the results:
python3 kmeans_clustering.py
This script performs K-means clustering on the data, saves the cluster labels and centroids to files, and visualizes the clusters using matplotlib. The resulting plot is saved as clusters.png.
Clustering completed. Results saved to 'labels.npy', 'centroids.npy', and 'clusters.png'
Explanation of each file:
labels.npy: Contains the cluster assignment for each data point (0, 1, or 2).
centroids.npy: Contains the coordinates of the 3 cluster centers.
clusters.png: A scatter plot showing the data points colored by their cluster assignments and the centroids marked with red "X" symbols.
Here is clusters.png
Step 4: Checking GPU Utilization
Monitoring GPU utilization ensures that the GPU is being used effectively for computation. This is crucial for optimizing performance and diagnosing potential issues.
You can check the GPU status using the nvidia-smi command:
nvidia-smi
This command provides information about the GPU, including its utilization, memory usage, and running processes.
Sun Feb 23 05:07:52 2025
+-----------------------------------------------------------------------------------------+
| NVIDIA-SMI 550.90.07 Driver Version: 550.90.07 CUDA Version: 12.4 |
|-----------------------------------------+------------------------+----------------------+
| GPU Name Persistence-M | Bus-Id Disp.A | Volatile Uncorr. ECC |
| Fan Temp Perf Pwr:Usage/Cap | Memory-Usage | GPU-Util Compute M. |
| | | MIG M. |
|=========================================+========================+======================|
| 0 NVIDIA A40-8Q On | 00000000:06:00.0 Off | 0 |
| N/A N/A P8 N/A / N/A | 1MiB / 8192MiB | 0% Default |
| | | N/A |
+-----------------------------------------+------------------------+----------------------+
+-----------------------------------------------------------------------------------------+
| Processes: |
| GPU GI CI PID Type Process name GPU Memory |
| ID ID Usage |
|=========================================================================================|
| No running processes found |
+-----------------------------------------------------------------------------------------+
Conclusion
In this article, we walked through the process of setting up a Python environment on an Ubuntu GPU server, generating synthetic data, performing K-means clustering using GPU-accelerated libraries, and visualizing the results. If you follow these steps, you can use GPU acceleration for clustering.
### Using BERT for Question Answering in TensorFlow with Python on Ubuntu GPU Server
BERT (Bidirectional Encoder Representations from Transformers) is a state-of-the-art model for natural language processing (NLP) tasks, including question answering. Fine-tuning BERT on a custom dataset can significantly improve its performance for specific use cases.
In this guide, we’ll walk through the process of fine-tuning BERT for question answering using TensorFlow on an Ubuntu GPU server.
Prerequisites
Before proceeding, ensure you have the following:
An Atlantic.Net Cloud GPU server running Ubuntu 24.04, equipped with an NVIDIA A100 GPU with at least 10 GB of GPU RAM.
CUDA Toolkit and cuDNN Installed.
A root or sudo privileges.
Step 1: Set Up a Python Virtual Environment
1. Update the system and install essential packages.
apt update -y
apt install python3-pip python3-venv -y
2. Create and activate a virtual environment:
python3 -m venv qa-env
source qa-env/bin/activate
3. Install the required libraries:
pip install tensorflow transformers datasets tf-keras
Step 2: Load the Pre-trained BERT Model and Tokenizer
We’ll use the bert-large-uncased-whole-word-masking-finetuned-squad model, which is fine-tuned for question answering. The BertTokenizerFast is used for tokenization, as it supports the return_offsets_mapping feature required for question answering.
nano fine_tune_bert_qa.py
Add the below code:
# fine_tune_bert_qa.py
from transformers import BertTokenizerFast, TFBertForQuestionAnswering, create_optimizer
from datasets import load_dataset
import tensorflow as tf
from tensorflow.keras.mixed_precision import set_global_policy
# Enable mixed precision for better GPU performance
set_global_policy('mixed_float16')
# Load pre-trained BERT model and fast tokenizer
model_name = "bert-base-uncased"
tokenizer = BertTokenizerFast.from_pretrained(model_name)
model = TFBertForQuestionAnswering.from_pretrained(model_name)
This code loads the necessary libraries, sets up mixed precision for efficient GPU usage, and loads the pre-trained BERT model and tokenizer from Hugging Face's transformers library.
Step 3: Load and Preprocess the Dataset
We’ll use the SQuAD dataset, a popular dataset for question answering. The dataset contains questions, contexts, and answers with their start and end positions in the context.
Add this to fine_tune_bert_qa.py
# Load the SQuAD dataset
dataset = load_dataset("squad")
# Preprocess the dataset
def preprocess_function(examples):
questions = [q.strip() for q in examples["question"]]
inputs = tokenizer(
questions,
examples["context"],
max_length=128, # Reduce sequence length
truncation=True,
padding="max_length",
return_offsets_mapping=True
)
offset_mapping = inputs.pop("offset_mapping")
processed_inputs = {
"input_ids": [],
"attention_mask": [],
"start_positions": [],
"end_positions": []
}
for i, offsets in enumerate(offset_mapping):
answer = examples["answers"][i]
start_char = answer["answer_start"][0]
end_char = start_char + len(answer["text"][0])
start_index = next((idx for idx, offset in enumerate(offsets) if offset[0] <= start_char < offset[1]), None)
end_index = next((idx for idx, offset in enumerate(offsets) if offset[0] < end_char <= offset[1]), None)
if start_index is not None and end_index is not None:
processed_inputs["input_ids"].append(inputs["input_ids"][i])
processed_inputs["attention_mask"].append(inputs["attention_mask"][i])
processed_inputs["start_positions"].append(start_index)
processed_inputs["end_positions"].append(end_index)
else:
continue
return processed_inputs if processed_inputs["start_positions"] else None
# Apply preprocessing and filter out any None entries
tokenized_datasets = dataset.map(preprocess_function, batched=True, remove_columns=dataset["train"].column_names)
tokenized_datasets = tokenized_datasets.filter(lambda x: x is not None)
This script preprocesses the data by tokenizing the questions and contexts and mapping the answers' start and end positions to token indices. It filters out entries where no valid token position for the answer is found.
Step 4: Prepare TensorFlow Datasets
We’ll convert the tokenized dataset into TensorFlow datasets for training and validation.
Add this to fine_tune_bert_qa.py
# Function to convert processed data into TensorFlow dataset format
def create_tf_dataset(tokenized_data):
input_ids = tf.constant(tokenized_data["input_ids"])
attention_mask = tf.constant(tokenized_data["attention_mask"])
start_positions = tf.constant(tokenized_data["start_positions"])
end_positions = tf.constant(tokenized_data["end_positions"])
return tf.data.Dataset.from_tensor_slices((
{"input_ids": input_ids, "attention_mask": attention_mask},
{"start_positions": start_positions, "end_positions": end_positions}
)).shuffle(10000).batch(2) # Adjust batch size as needed
# Create TensorFlow datasets for training and validation
train_dataset = create_tf_dataset(tokenized_datasets["train"])
validation_dataset = create_tf_dataset(tokenized_datasets["validation"])
This code converts the preprocessed data into TensorFlow datasets, which are suitable for training by batching and shuffling the data.
Step 5: Compile the Model
The TFBertForQuestionAnswering model requires a loss function for both the start and end positions. We’ll use SparseCategoricalCrossentropy for this purpose.
Add this to fine_tune_bert_qa.py
# Create the optimizer using Hugging Face's utility
num_train_steps = len(train_dataset) * 1 # Assume 3 epochs of training
optimizer, _ = create_optimizer(
init_lr=5e-5,
num_train_steps=num_train_steps,
num_warmup_steps=0,
weight_decay_rate=0.01,
)
# Compile the model with the optimizer
model.compile(optimizer=optimizer)
This sets up the optimizer with training parameters and compiles the model, making it ready for training.
Step 6: Fine-Tune the Model
Now, we’ll fine-tune the model on the SQuAD dataset.
Add this to fine_tune_bert_qa.py
# Fine-tune the model
model.fit(train_dataset, validation_data=validation_dataset, epochs=1)
# Save the fine-tuned model
model.save_pretrained("fine_tuned_bert_qa_model")
tokenizer.save_pretrained("fine_tuned_bert_qa_model")
print("Fine-tuning complete! Model saved to 'fine_tuned_bert_qa_model'.")
This trains the model on the training dataset while evaluating on the validation set. After training, it saves the model and tokenizer for later use.
Step 7: Run the Script
Run the script using the following command to train and save the model.
python3 fine_tune_bert_qa.py
Step 8: Monitor GPU Usage
While the script is running, you can monitor GPU usage to ensure that the fine-tuning process is utilizing the GPU effectively. Use the following command in a separate terminal:
watch -n 1 nvidia-smi
This command will display GPU usage statistics every second.
Step 9: Use the Fine-Tuned Model for Inference
After fine-tuning, you can load the fine-tuned model and use it for inference.
nano run_model.py
Add the below code:
import tensorflow as tf # Import TensorFlow
from transformers import BertTokenizerFast, TFBertForQuestionAnswering
# Load the fine-tuned model and tokenizer
model = TFBertForQuestionAnswering.from_pretrained("fine_tuned_bert_qa_model")
tokenizer = BertTokenizerFast.from_pretrained("fine_tuned_bert_qa_model")
# Use the model for inference
question = "What is the capital of France?"
context = "France is a country in Europe. The capital of France is Paris."
# Tokenize the input
inputs = tokenizer(question, context, return_tensors="tf")
# Get model predictions
outputs = model(inputs)
# Find the start and end positions of the answer
start_index = tf.argmax(outputs.start_logits, axis=1).numpy()[0]
end_index = tf.argmax(outputs.end_logits, axis=1).numpy()[0]
# Extract the answer tokens
answer_tokens = inputs["input_ids"][0][start_index:end_index+1]
# Decode the answer tokens to text
answer = tokenizer.decode(answer_tokens, skip_special_tokens=True)
print(f"Answer: {answer}")
This script loads the model and tokenizer, processes an input question and context, and predicts the answer using the model.
Run the code:
python3 run_model.py
You will get the below output.
Answer: paris
This output confirms the model's ability to predict correct answers from the context provided.
Conclusion
In this guide, we’ve walked through the process of fine-tuning BERT for question answering using TensorFlow on an Ubuntu GPU server. You can now fine-tune BERT on your custom dataset and deploy it for production use.
### Stylish Logo Generation with Stable Diffusion on Ubuntu Cloud GPU
Creating a stylish logo is a critical step in establishing a brand’s identity. With the advent of AI-powered tools like Stable Diffusion, the process has become faster, more accessible, and highly customizable.
Stable Diffusion is a state-of-the-art AI model capable of generating high-quality images from textual prompts. It’s particularly useful for logo design because:
It allows for customization through detailed prompts.
It can generate multiple variations quickly.
It supports artistic styles, such as minimalism, futuristic designs, or hand-drawn aesthetics.
When combined with the computational power of a cloud GPU server, Stable Diffusion becomes a scalable and efficient solution for logo generation.
In this guide, we’ll walk you through setting up Stable Diffusion to generate a logo on an Ubuntu Cloud GPU server.
Prerequisites
Before proceeding, ensure you have the following:
An Atlantic.Net Cloud GPU server running Ubuntu 24.04.
CUDA Toolkit and cuDNN Installed.
A root or sudo privileges.
Step 1: Set Up the Environment
1. Update the system.
apt update -y
2. Install necessary packages.
apt install -y python3-pip python3-venv git ffmpeg
3. Create and activate a virtual environment:
python3 -m venv sd-env
source sd-env/bin/activate
4. Install PyTorch and other dependencies:
pip install torch torchvision torchaudio --index-url https://download.pytorch.org/whl/cu118
pip install diffusers transformers
Step 2: Install Stable Diffusion
1. Clone the official Stable Diffusion repository:
git clone https://github.com/CompVis/stable-diffusion.git
cd stable-diffusion
2. Download the pre-trained model checkpoint (sd-v1-4.ckpt) from Hugging Face and place it in the models directory:
mkdir -p models
wget https://huggingface.co/CompVis/stable-diffusion-v-1-4-original/resolve/main/sd-v1-4.ckpt -O models/sd-v1-4.ckpt
Step 3: Write a Python Script for Logo Generation
Create a Python script to generate logos using Stable Diffusion.
nano generate_logo.py
Add the below code:
import os
import torch
from PIL import Image
from torch import autocast
from diffusers import StableDiffusionPipeline
# Load the Stable Diffusion model
model_id = "CompVis/stable-diffusion-v1-4"
device = "cuda" if torch.cuda.is_available() else "cpu"
pipe = StableDiffusionPipeline.from_pretrained(model_id, torch_dtype=torch.float16)
pipe = pipe.to(device)
# Define the logo prompt
prompt = "A stylish logo for a tech startup, futuristic, geometric shapes, blue and white color scheme, minimalistic"
# Generate the logo
with autocast("cuda"):
image = pipe(prompt, height=512, width=512, num_inference_steps=50).images[0]
# Save the generated logo
output_dir = "outputs"
os.makedirs(output_dir, exist_ok=True)
output_path = os.path.join(output_dir, "generated_logo.png")
image.save(output_path)
print(f"Logo saved to {output_path}")
The script uses the Stable Diffusion model from the diffusers library to generate a logo based on a descriptive prompt, executing on a GPU if available. It generates and saves the logo to a specified directory, harnessing machine learning to streamline graphic design tasks.
Step 4: Run the Script and Generate the Logo
Execute the script to generate the logo:
python3 generate_logo.py
Output.
model.safetensors: 100%|████████████████████████████████████████████████████████████████████████████████████████████████████████████| 1.22G/1.22G [00:04<00:00, 258MB/s]
diffusion_pytorch_model.safetensors: 100%|██████████████████████████████████████████████████████████████████████████████████████████| 3.44G/3.44G [00:19<00:00, 172MB/s]
Fetching 16 files: 100%|████████████████████████████████████████████████████████████████████████████████████████████████████████████████| 16/16 [00:20<00:00, 1.28s/it]
Loading pipeline components...: 100%|█████████████████████████████████████████████████████████████████████████████████████████████████████| 7/7 [00:07<00:00, 1.01s/it]
100%|███████████████████████████████████████████████████████████████████████████████████████████████████████████████████████████████████| 50/50 [00:03<00:00, 15.15it/s]
Logo saved to outputs/generated_logo.png%|█████████████████████████████████████████████████████████████████████████████████████████▊| 3.43G/3.44G [00:19<00:00, 146MB/s]
The generated logo will be saved in the outputs directory as generated_logo.png.
Step 5: Download the Generated Logo
To verify the generated logo, you can use scp command to download the log from your server to your local machine.
scp root@your-server-ip:/root/stable-diffusion/outputs/generated_logo.png /home/user/Downloads/
Now, double-click on the downloaded file to open the generated logo:
Conclusion
In this article, we explained how to generate a logo with Stable Diffusion on an Atlantic.Net GPU server. This workflow not only saves time but also opens up endless possibilities for creativity. Whether you’re designing logos for clients or exploring new branding ideas, Stable Diffusion is a powerful tool to have in your arsenal.
### Step-by-Step Guide to Astra DB Serverless Vector Database
The ability to efficiently search and retrieve information based on semantic similarity is crucial. Vector databases have emerged as a powerful tool for this purpose, enabling applications like recommendation systems, natural language processing, and image recognition.
This guide will walk you through the process of creating and using a serverless vector database with DataStax Astra DB on your Atlantic.Net Ubuntu 22.04 cloud server.
We'll cover everything from setting up your Astra DB account and database to inserting data, generating vector embeddings, and performing vector searches. By the end of this guide, you'll have a functional vector database.
Prerequisites
An Atlantic.Net cloud server running Ubuntu 22.04: You'll need access to a terminal on your server to execute commands.
An Astra DB Account: You'll need to sign up for a free Astra DB account.
Basic Python Knowledge: Familiarity with Python scripting will be helpful.
Internet Connection: Your server needs an active internet connection to download packages and connect to Astra DB.
Step 1 - Create an Atlantic.Net Cloud Server with Ubuntu 22.04:
This step explains how to create a Cloud Server on Atlantic.Net. If you already have an Atlantic.Net server you can skip this step:
Sign Up/Log In to Atlantic.Net:
Go to the Atlantic.Net website and sign up for an account or log in if you already have one.
Create a Cloud Server:
In the Atlantic.Net portal, navigate to the cloud server section and click on the option to create a new server.
Choose Ubuntu 22.04:
Select "Ubuntu 22.04" as the operating system for your server.
Select Server Specifications:
Choose the server size and resources (CPU, RAM, storage) that meet your needs. For this quickstart, a basic configuration should be sufficient.
Configure Server Options:
Set a hostname, root password, and any other relevant server options.
Deploy the Server:
Review your server configuration and deploy the server. Wait for the server to be provisioned and become active.
Access Your Cloud Server:
Once the server is ready, you'll receive the server's IP address.
Use an SSH client (like PuTTY on Windows, or the built-in Terminal on macOS/Linux) to connect to your Server:
Step 2 - Create an Astra Account and Database:
Sign Up/Log In:
Go to the Astra DB website and sign up for a free account or log in if you already have one.
Accept the terms and conditions when prompted
Fill out the Welcome Page to continue
Create a Database:
In the Astra Portal, navigate to "Databases" and click "Create Database."
Select the following:
Deployment Type: "Serverless (Vector)"
Provider: "Amazon Web Services"
Region: "us-east-2" (This is crucial for the NVIDIA embedding model).
Click "Create Database."
Wait for the database to reach "Active" status (this might take a few minutes).
Once complete you will see this screen.
Retrieve Credentials:
Once active, go to the "Database Details." pane on the main page
Copy the "API Endpoint."
Click "Generate Token" and copy the token.
Important: Make a note of these values as you will need them later
Step 3 - Configure Your Atlantic.Net Cloud Server
Now let's switch over to the Atlantic.Net server to continue the configuration.
Set environmental variables on your Ubuntu 22.04Server:
Open your terminal on your Atlantic.Net Server.
Run the following commands, replacing API_ENDPOINT and TOKEN with the values you copied:
export ASTRA_DB_API_ENDPOINT=API_ENDPOINT
export ASTRA_DB_APPLICATION_TOKEN=TOKEN
To make these variables persistent, add these export lines to your ~/.bashrc or ~/.zshrc file and then run source ~/.bashrc or source ~/.zshrc.
Install Python and Astrapy:
On your Ubuntu Server, update your package lists and upgrade existing packages:
sudo apt update
sudo apt upgrade -y
Install Python 3.x.x+ and pip:
Ensure Python 3.x.x or higher is installed.
sudo apt install python3-pip -y
Verify the Python version.
python3 --version
Python 3.10.12
Upgrade pip:
python3 -m pip install --upgrade pip
Verify the pip version.
pip --version
pip 25.0.1 from /usr/local/lib/python3.10/dist-packages/pip (python 3.10)
Install Astrapy:
Install the astrapy library:
pip install astrapy
Step 4 - Connect to the Vector Database
Now you are ready to connect to the AstraDB.
Create a Python file:
First create a file named quickstart_connect.py
nano quickstart_connect.py
Paste the following code into the file:
import os
from astrapy import DataAPIClient, Database
def connect_to_database() -> Database:
"""
Connects to a DataStax Astra database.
This function retrieves the database endpoint and application token from the
environment variables `ASTRA_DB_API_ENDPOINT` and `ASTRA_DB_APPLICATION_TOKEN`.
Returns:
Database: An instance of the connected database.
Raises:
RuntimeError: If the environment variables `ASTRA_DB_API_ENDPOINT` or
`ASTRA_DB_APPLICATION_TOKEN` are not defined.
"""
endpoint = os.environ.get("ASTRA_DB_API_ENDPOINT")
token = os.environ.get("ASTRA_DB_APPLICATION_TOKEN")
if not token or not endpoint:
raise RuntimeError(
"Environment variables ASTRA_DB_API_ENDPOINT and ASTRA_DB_APPLICATION_TOKEN must be defined"
)
client = DataAPIClient(token)
database = client.get_database(endpoint)
print(f"Connected to database {database.info().name}")
return database
Note: quickstart_connect.py is a module that is imported by the other Python scripts and is not run directly.
Download the Dataset:
Download the quickstart_dataset.json file and save it to your project directory. This dataset contains demo information about 100 books.
Each object within the array represents a single book and has the following key-value pairs:
title: The title of the book (string).
author: The author of the book (string).
summary: A short summary or description of the book's plot (string).
genres: An array of genres associated with the book (array of strings).
numberOfPages: The number of pages in the book (integer).
rating: The rating of the book (floating-point number).
wget https://docs.datastax.com/en/astra-db-serverless/get-started/_attachments/quickstart_dataset.json
Create a Python file:
Create a file named quickstart_upload.py and paste the following code:
from quickstart_connect import connect_to_database
from astrapy import Database, Collection
from astrapy.constants import VectorMetric
from astrapy.info import CollectionVectorServiceOptions
import json
def create_collection(database: Database, collection_name: str) -> Collection:
collection = database.create_collection(
collection_name,
metric=VectorMetric.COSINE,
service=CollectionVectorServiceOptions(
provider="nvidia",
model_name="NV-Embed-QA",
),
)
print(f"Created collection {collection.full_name}")
return collection
def upload_json_data(collection: Collection, data_file_path: str, embedding_string_creator: callable) -> None:
with open(data_file_path, "r", encoding="utf8") as file:
json_data = json.load(file)
documents = [
{
**data,
"$vectorize": embedding_string_creator(data),
}
for data in json_data
]
inserted = collection.insert_many(documents)
print(f"Inserted {len(inserted.inserted_ids)} items.")
def main():
database = connect_to_database()
collection = create_collection(database, "quickstart_collection")
upload_json_data(
collection,
"quickstart_dataset.json", # Use the actual filename
lambda data: (
f"summary: {data['summary']} | "
f"genres: {', '.join(data['genres'])}"
),
)
if __name__ == "__main__":
main()
Run the script:
In your terminal, run: python3 quickstart_upload.py
This will run a nested module that will use the first connect to db script, and then the second script will upload the data. You should see the following information on completion.
python3 quickstart_upload.py
Connected to database atlanticdotnet
Created collection default_keyspace.quickstart_collection
Inserted 100 items.
Step 5 - Start to Query Data
Create a Python file:
Create a file named quickstart_find.py
nano quickstart_find.py
Then paste the following code:
from quickstart_connect import connect_to_database
def main():
database = connect_to_database()
collection = database.get_collection("quickstart_collection")
print("\nFinding books with rating greater than 4.7...")
rating_cursor = collection.find({"rating": {"$gt": 4.7}})
for document in rating_cursor:
print(f"{document['title']} is rated {document['rating']}")
print("\nUsing vector search to find a single scary novel...")
single_vector_match = collection.find_one({}, sort={"$vectorize": "A scary novel"})
print(f"{single_vector_match['title']} is a scary novel")
print("\nUsing filters and vector search to find 3 books with more than 400 pages that are set in the arctic, returning just the title and author...")
vector_cursor = collection.find(
{"numberOfPages": {"$gt": 400}},
sort={"$vectorize": "A book set in the arctic"},
limit=3,
projection={"title": True, "author": True}
)
for document in vector_cursor:
print(document)
if __name__ == "__main__":
main()
Run the script:
In your terminal, navigate to the directory where you saved quickstart_find.py.
Execute the script using Python 3:
python3 quickstart_find.py
You should see the output of the three search queries, demonstrating how to filter and perform vector searches in your Astra DB collection.
Change the searches:
Open quickstart_find.py in a text editor.
Look for these parts in the code:
collection.find({...}) : This is where you change the filters.
sort={"$vectorize": "..."} : This is where you change what you're searching for with vectors.
limit=...: This is where you change how many results you get.
projection={...}: This is where you change what information you get back.
Change the text or numbers inside these parts.
Save the file and run again python3 quickstart_find.py
Here is a modified example:
from quickstart_connect import connect_to_database
def main():
database = connect_to_database()
collection = database.get_collection("quickstart_collection")
# Example: Find books with fewer than 300 pages
print("\nFinding books with fewer than 300 pages...")
page_cursor = collection.find({"numberOfPages": {"$lt": 300}})
for document in page_cursor:
print(f"{document['title']} has {document['numberOfPages']} pages")
# Example: Vector search for "A thrilling adventure story"
print("\nVector search for 'A thrilling adventure story'...")
adventure_match = collection.find_one({}, sort={"$vectorize": "A thrilling adventure story"})
if adventure_match:
print(f"{adventure_match['title']} is a thrilling adventure story")
else:
print("No thrilling adventure story found.")
# Example: Find top 5 historical novels with rating > 4.0, show title and author
print("\nTop 5 historical novels with rating > 4.0, showing title and author...")
historical_cursor = collection.find(
{"rating": {"$gt": 4.0}},
sort={"$vectorize": "A historical novel"},
limit=5,
projection={"title": True, "author": True}
)
for document in historical_cursor:
print(document)
if __name__ == "__main__":
main()
Look how the results differ between the 2 examples. This shows you how easy it is for Vector Databases to give intelligent answers quickly.
Get started with a Vector Database on an Atlantic.Net server today using our GPU server hosting!
### How to Deploy a Scalable Semantic Search Application with Deepset.ai on Atlantic.Net GPU Server
Semantic search is a powerful technique that improves information retrieval by understanding the meaning behind queries and documents. With the help of Deepset.ai's Haystack framework, you can build and deploy a scalable semantic search application on an Ubuntu GPU server.
This article will guide you through the process to deploy a Scalable Semantic Search Application with Deepset.ai's Haystack framework on Ubuntu GPU server.
Prerequisites
Before proceeding, ensure you have the following:
An Atlantic.Net Cloud GPU server running Ubuntu 24.04.
CUDA Toolkit and cuDNN Installed.
A root or sudo privileges.
Step 1: Set Up the Environment
1. Install Python Dependencies:
apt install python3 python3-pip python3-venv
2. Create a virtual environment:
python3 -m venv haystack-env
source haystack-env/bin/activate
3. Install Haystack and other dependencies:
pip install farm-haystack[elasticsearch,gpu] sentence-transformers torch
4. Ensure PyTorch can detect the GPU:
python3
Write the following in Python shell:
>>> import torch
>>> print(torch.cuda.is_available())
Output.
True
Press CTRL+D to exit from the Python shell.
Step 2: Install Docker and NVIDIA Container Toolkit
Docker simplifies deployment, and the NVIDIA Container Toolkit allows Docker containers to use GPU resources.
1. Install Docker.
apt install docker.io
2. Start and enable the Docker service.
systemctl start docker
systemctl enable docker
3. Install NVIDIA Container Toolkit.
distribution=$(. /etc/os-release;echo $ID$VERSION_ID)
curl -s -L https://nvidia.github.io/nvidia-docker/gpgkey | apt-key add -
curl -s -L https://nvidia.github.io/nvidia-docker/$distribution/nvidia-docker.list | tee /etc/apt/sources.list.d/nvidia-docker.list
apt update && apt install -y nvidia-container-toolkit
systemctl restart docker
4. Haystack supports various document stores like Elasticsearch, FAISS, and Weaviate. For this tutorial, we’ll use Elasticsearch. Run Elasticsearch Docker container.
docker run -d -p 9200:9200 -e "discovery.type=single-node" elasticsearch:7.9.2
5. Verify the Elasticsearch.
curl -X GET "http://localhost:9200/"
Note: You may need to wait a short while for the container to start.
Output.
{
"name" : "e42a0e2ac752",
"cluster_name" : "docker-cluster",
"cluster_uuid" : "Q76hITRvRu65Gzxo_gnYdg",
"version" : {
"number" : "7.9.2",
"build_flavor" : "default",
"build_type" : "docker",
"build_hash" : "d34da0ea4a966c4e49417f2da2f244e3e97b4e6e",
"build_date" : "2020-09-23T00:45:33.626720Z",
"build_snapshot" : false,
"lucene_version" : "8.6.2",
"minimum_wire_compatibility_version" : "6.8.0",
"minimum_index_compatibility_version" : "6.0.0-beta1"
},
"tagline" : "You Know, for Search"
}
Step 3: Delete the Existing Index (if it exists)
Before creating a new index, delete any existing index to avoid conflicts.
nano semantic_app.py
Add the below code:
from elasticsearch import Elasticsearch
# Connect to Elasticsearch
es = Elasticsearch(hosts=["http://localhost:9200"])
index_name = "document" # Replace with your index name
# Delete the index if it exists
if es.indices.exists(index=index_name):
es.indices.delete(index=index_name)
print(f"Index '{index_name}' deleted successfully.")
else:
print(f"Index '{index_name}' does not exist.")
Step 4: Initialize the ElasticsearchDocumentStore
The ElasticsearchDocumentStore is a Haystack component that interacts with Elasticsearch to store and retrieve documents. Initialize it with the appropriate embedding dimension to match the output of your embedding model.
from haystack.document_stores import ElasticsearchDocumentStore
document_store = ElasticsearchDocumentStore(
host="localhost", # Replace with your Elasticsearch host
username="", # Replace with your Elasticsearch username (if applicable)
password="", # Replace with your Elasticsearch password (if applicable)
index="document", # Name of the index where documents will be stored
embedding_dim=384 # Set embedding_dim to match the model's output
)
Step 5: Prepare and Index Sample Documents
Add sample documents to the document store.
your_documents = [
{
"content": "The quick brown fox jumps over the lazy dog.",
"meta": {"title": "Example Document 1", "author": "John Doe"}
},
{
"content": "Artificial intelligence is transforming the world.",
"meta": {"title": "Example Document 2", "author": "Jane Smith"}
},
{
"content": "Semantic search improves information retrieval.",
"meta": {"title": "Example Document 3", "author": "Alice Johnson"}
}
]
# Write documents to the document store
document_store.write_documents(your_documents)
print("Documents have been successfully indexed!")
Step 6: Initialize the Retriever
The retriever is responsible for fetching relevant documents based on the query.
from haystack.nodes import EmbeddingRetriever
retriever = EmbeddingRetriever(
document_store=document_store, # Pass the document_store here
embedding_model="sentence-transformers/all-MiniLM-L6-v2"
)
Step 7: Generate Embeddings for Documents
Generate embeddings for the indexed documents.
document_store.update_embeddings(retriever)
print("Document embeddings have been generated!")
Step 8: Initialize the Reader
The reader extracts answers from the retrieved documents.
from haystack.nodes import FARMReader
reader = FARMReader(
model_name_or_path="deepset/roberta-base-squad2",
use_gpu=True # Enable GPU acceleration
)
Step 9: Create the Pipeline
Combine the retriever and reader into a pipeline.
from haystack.pipelines import ExtractiveQAPipeline
pipeline = ExtractiveQAPipeline(reader, retriever)
Step 10: Query the Pipeline
Test the pipeline by running a query.
query = "What is semantic search?"
results = pipeline.run(query=query)
# Print the results
print("Search Results:")
for doc in results["documents"]:
print(f"Content: {doc.content}")
print(f"Meta: {doc.meta}")
print("---")
Step 11: Test the Application
To ensure the application is working correctly, run multiple test queries and verify the results.
test_queries = [
"Who wrote about the quick brown fox?",
"How is AI transforming the world?",
"What improves information retrieval?"
]
for query in test_queries:
print(f"Query: {query}")
results = pipeline.run(query=query)
for doc in results["documents"]:
print(f"Content: {doc.content}")
print(f"Meta: {doc.meta}")
print("---")
Step 12: Run the Application
Run the Python script:
python3 semantic_app.py
Output:
Documents have been successfully indexed!
Batches: 100%|████████████████████████████████████████████████████████████████████████████████████████████████████████████████████████████| 1/1 [00:00<00:00, 3.45it/s]
Updating embeddings: 10000 Docs [00:00, 15556.09 Docs/s]
Document embeddings have been generated!
Batches: 100%|███████████████████████████████████████████████████████████████████████████████████████████████████████████████████████████| 1/1 [00:00<00:00, 148.67it/s]
Inferencing Samples: 100%|██████████████████████████████████████████████████████████████████████████████████████████████████████████| 1/1 [00:00<00:00, 7.95 Batches/s]
Search Results:
Content: Semantic search improves information retrieval.
Meta: {'author': 'Alice Johnson', 'title': 'Example Document 3'}
---
Content: Artificial intelligence is transforming the world.
Meta: {'author': 'Jane Smith', 'title': 'Example Document 2'}
---
Content: The quick brown fox jumps over the lazy dog.
Meta: {'author': 'John Doe', 'title': 'Example Document 1'}
---
Query: Who wrote about the quick brown fox?
Batches: 100%|███████████████████████████████████████████████████████████████████████████████████████████████████████████████████████████| 1/1 [00:00<00:00, 218.53it/s]
Inferencing Samples: 100%|██████████████████████████████████████████████████████████████████████████████████████████████████████████| 1/1 [00:00<00:00, 74.42 Batches/s]
Content: The quick brown fox jumps over the lazy dog.
Meta: {'author': 'John Doe', 'title': 'Example Document 1'}
---
Content: Semantic search improves information retrieval.
Meta: {'author': 'Alice Johnson', 'title': 'Example Document 3'}
---
Content: Artificial intelligence is transforming the world.
Meta: {'author': 'Jane Smith', 'title': 'Example Document 2'}
---
Query: How is AI transforming the world?
Batches: 100%|███████████████████████████████████████████████████████████████████████████████████████████████████████████████████████████| 1/1 [00:00<00:00, 256.44it/s]
Inferencing Samples: 100%|██████████████████████████████████████████████████████████████████████████████████████████████████████████| 1/1 [00:00<00:00, 78.72 Batches/s]
Content: Artificial intelligence is transforming the world.
Meta: {'author': 'Jane Smith', 'title': 'Example Document 2'}
---
Content: Semantic search improves information retrieval.
Meta: {'author': 'Alice Johnson', 'title': 'Example Document 3'}
---
Content: The quick brown fox jumps over the lazy dog.
Meta: {'author': 'John Doe', 'title': 'Example Document 1'}
---
Query: What improves information retrieval?
Batches: 100%|███████████████████████████████████████████████████████████████████████████████████████████████████████████████████████████| 1/1 [00:00<00:00, 263.43it/s]
Inferencing Samples: 100%|██████████████████████████████████████████████████████████████████████████████████████████████████████████| 1/1 [00:00<00:00, 70.20 Batches/s]
Content: Semantic search improves information retrieval.
Meta: {'author': 'Alice Johnson', 'title': 'Example Document 3'}
---
Content: Artificial intelligence is transforming the world.
Meta: {'author': 'Jane Smith', 'title': 'Example Document 2'}
---
Content: The quick brown fox jumps over the lazy dog.
Meta: {'author': 'John Doe', 'title': 'Example Document 1'}
Conclusion
By following these steps, you can deploy a scalable semantic search application using Deepset.ai's Haystack framework on an Ubuntu GPU server. This setup leverages the power of Elasticsearch, sentence-transformers, and GPU acceleration to deliver fast and accurate search results.
### Using SIEM for Compliance in 2025
What Is SIEM?
Security Information and Event Management (SIEM) is a cybersecurity solution that provides real-time analysis of security alerts, log management, and incident detection across an organization’s IT infrastructure.
SIEM cyber security processes work by collecting logs and event data from various sources, such as firewalls, servers, applications, and endpoint devices. It then creates a baseline and correlates this data to identify potential security threats, policy violations, and compliance risks. By using predefined rules, machine learning, and analytics, SIEM detects anomalies, generates alerts, and enables incident response.
Organizations deploy SIEM for several purposes, including threat detection, forensic investigations, compliance reporting, and security monitoring. Modern SIEM solutions integrate with threat intelligence feeds and automation tools to improve detection accuracy and reduce response time.
Why SIEM Is Essential for Regulatory Compliance
Many organizations face strict regulatory requirements, making it critical to ensure compliance with security standards. Security information and event management solutions help to monitor security events, detect threats, and maintain detailed logs necessary for audits.
SIEM provides real-time analysis of security alerts, consolidating logs and event data from various systems. This centralization supports compliance with regulations such as GDPR, HIPAA, PCI DSS, and SOX, which mandate strict security controls and detailed record-keeping. By automating data collection, normalizing logs, and generating compliance-ready reports, SIEM simplifies adherence to these regulations.
Key benefits of SIEM for compliance include:
Centralized data collection: SIEM aggregates logs from different hardware, software, and cloud platforms, ensuring visibility into security events across an organization’s entire IT environment.
Real-time monitoring and alerting: It detects security breaches and policy violations as they occur, enabling swift responses to prevent compliance violations.
Automated compliance reporting: SIEM generates detailed audit reports with minimal manual effort, ensuring accuracy and consistency in meeting regulatory requirements.
Long-term log retention: Many regulations require organizations to maintain security logs for extended periods. SIEM ensures secure storage and easy retrieval of logs for forensic investigations and compliance audits.
Without a SIEM system, compliance management becomes complex and error-prone, especially for large enterprises dealing with vast amounts of security data. By integrating SIEM, organizations can simplify compliance efforts while strengthening their cybersecurity defenses.
Core Components of SIEM for Compliance
A security information and event management (SIEM) system consists of several key components that ensure compliance with regulatory standards. These components help organizations collect, analyze, and report security data while maintaining a strong security posture.
Log collection and management: SIEM collects logs from various sources, including network devices, servers, applications, and databases. These logs capture user activities, system events, and security incidents across the IT environment. Centralizing logs in one place allows organizations to analyze historical data, ensuring visibility into security events for compliance audits and investigations.
Event correlation: SIEM uses algorithms and predefined rules to correlate seemingly unrelated logs, identifying patterns and anomalies that indicate security threats. By analyzing data across multiple systems, SIEM detects complex attacks, unauthorized access, and system misconfigurations that might otherwise go unnoticed with manual log reviews.
Real-time monitoring: Continuous monitoring enables organizations to detect security threats and compliance violations as they occur. By identifying abnormal behavior in real time, SIEM reduces the window of exposure and allows for swift remediation before an incident leads to regulatory non-compliance or data breaches.
Automated alerts: SIEM generates instant alerts for suspicious activities based on deviations from normal behavior or predefined security rules. These automated notifications help organizations address policy violations and unauthorized access quickly, minimizing the risk of prolonged security exposure. Additionally, alerts and response actions are logged for audit purposes.
Audit trails: SIEM maintains detailed records of user actions, system modifications, and security events. These audit trails are essential for proving regulatory compliance by demonstrating accountability and transparency in data handling. They also support forensic investigations by tracking access to sensitive data and documenting security incidents.
Compliance reporting: SIEM solutions include reporting features that generate compliance-ready reports for standards like PCI DSS, HIPAA, and GDPR. These reports provide an overview of security events, policy violations, and response actions. Automated reporting reduces manual effort while ensuring organizations can present compliance documentation during internal reviews and external audits.
Common Compliance Standards Addressed by SIEM
SIEM for PCI DSS Compliance
The Payment Card Industry Data Security Standard (PCI DSS) mandates security measures for companies handling credit card transactions. SIEM helps meet PCI DSS requirements by tracking and managing user identities, detecting suspicious activity, and ensuring secure log storage.
Key SIEM features for PCI DSS compliance:
Log management: Centralizes logs from all systems to meet Requirement 10, which mandates log tracking and monitoring.
User activity monitoring: Tracks login attempts, privilege escalations, and access to payment data.
Threat detection & alerts: Identifies unauthorized access or potential fraud in real-time.
Access control management: Ensures proper user authentication and detects anomalies in account usage.
With SIEM, organizations can automate compliance reporting, maintain audit trails, and detect potential data breaches before they escalate, reducing the risk of non-compliance penalties.
SIEM for HIPAA Compliance
The Health Insurance Portability and Accountability Act (HIPAA) protects the confidentiality of Protected Health Information (PHI) in healthcare organizations. SIEM improves HIPAA compliance by monitoring data access, detecting security breaches, and ensuring the integrity of electronic health records.
Key SIEM features for HIPAA compliance:
Threat detection & prevention: Identifies cyberattacks, including ransomware and insider threats, that could expose PHI.
Log management & audit trails: Ensures a record of system and user activity, crucial for compliance audits.
Access control monitoring: Detects unauthorized access and tracks changes to user permissions.
Data exfiltration prevention: Flags abnormal data movement to prevent breaches.
By automating security monitoring and reducing false-positive alerts, SIEM helps overburdened security teams focus on real threats, ensuring HIPAA-mandated data protection.
SIEM for GDPR Compliance
The General Data Protection Regulation (GDPR) requires strict protection of Personally Identifiable Information (PII). SIEM helps organizations comply by tracking data access, enforcing security controls, and maintaining transparency in data processing.
Key SIEM features for GDPR compliance:
Data protection by design: Audits security controls to prevent unauthorized access to personal data.
Log & access monitoring: Tracks who accessed, modified, or transferred personal data.
Incident response & reporting: Ensures organizations can detect and respond to data breaches within 72 hours, as required by GDPR.
Data flow visibility: Provides insights into data movement across networks, ensuring compliance with GDPR’s transparency mandates.
SIEM enables organizations to demonstrate compliance, reducing the risk of massive fines like those imposed on Meta (€1.2 billion in 2022) for unauthorized data transfers.
SIEM for SOX Compliance
The Sarbanes-Oxley Act (SOX) enforces controls on financial data security for publicly traded companies. SIEM helps meet SOX requirements by monitoring financial systems, detecting unauthorized access, and maintaining audit logs.
Key SIEM features for SOX compliance:
Access & privilege monitoring: Tracks login attempts and changes to sensitive financial records.
Audit trails & compliance reporting: Provides verifiable logs of financial data access and modifications.
Incident detection & alerts: Identifies suspicious activity, such as unauthorized data transfers.
User activity analysis: Monitors the actions of employees, third-party vendors, and former users.
SIEM for NIST Compliance
The National Institute of Standards and Technology (NIST) Cybersecurity Framework provides best practices for securing IT environments, widely adopted across industries. SIEM helps organizations align with NIST’s Identify, Protect, Detect, Respond, and Recover framework.
Key SIEM features for NIST compliance include:
Protect: Collects logs from access control systems to ensure proper security enforcement.
Detect: Monitors IT environments for anomalies and potential security threats.
Respond: Alerts security teams about incidents and provides forensic insights.
Recover: Generates reports to assist in incident recovery and remediation.
SIEM for ISO 27001 Compliance
ISO 27001 is an international standard for information security management systems (ISMS). SIEM helps organizations meet ISO 27001 requirements by centralizing security data, enforcing policies, and providing real-time monitoring.
Key SIEM features for ISO 27001 compliance:
Security data centralization: Collects and secures logs across cloud and on-premises environments.
Threat intelligence & detection: Identifies security incidents using predefined ISO 27001-aligned rules.
Incident response & reporting: Supports forensic investigations and compliance documentation.
Access control & user monitoring: Tracks login activities, privilege escalations, and unauthorized access attempts.
Challenges in Implementing SIEM for Compliance
While SIEM solutions offer capabilities for regulatory compliance, their implementation comes with significant challenges. Organizations must weigh these difficulties against the benefits to determine if SIEM is the right fit for their compliance needs:
High cost and complex deployment: SIEM solutions are expensive, both in terms of initial investment and ongoing operational costs. Deployment can take anywhere from 6 to 12 months, with more complex implementations requiring even longer. Many organizations struggle to achieve a solid return on investment (ROI) due to stalled or unsuccessful SIEM projects.
Continuous monitoring and maintenance: Once deployed, SIEM requires regular updates and tuning to keep pace with evolving IT infrastructures, emerging threats, and changing compliance requirements. Maintaining a SIEM system can cost several times more than its initial purchase price, making it unaffordable for smaller businesses.
Need for skilled SIEM professionals: Managing a SIEM effectively requires specialized expertise. Organizations must either train existing IT staff or hire experienced SIEM professionals, who are both difficult to find and expensive to retain. Without the right personnel, a SIEM may fail to deliver the expected compliance benefits.
Alert fatigue and false positives: SIEM solutions generate a large volume of alerts, many of which are false positives. Security teams often struggle to triage and investigate every alert, leading to alert fatigue. This can result in genuine threats being overlooked, undermining both security and compliance efforts, though this is possible to mitigate by fine-tuning correlation rules, implementing threat intelligence feeds, using risk-based alerting, and implementing SOAR for automated triage.
Best Practices for SIEM Implementation
Here are some of the ways that organizations can ensure effective SIEM implementation to improve compliance with cybersecurity regulations.
1. Map Compliance Requirements to SIEM Capabilities
Before deploying SIEM, organizations must clearly define their compliance requirements and ensure that SIEM functionalities align with these needs. Different regulations, such as PCI DSS, HIPAA, GDPR, SOX, NIST, and ISO 27001, have unique logging, monitoring, and reporting mandates.
To map compliance requirements effectively:
Identify key regulations: Determine which regulatory frameworks apply to the organization based on industry and geographical location.
Define log sources: Identify critical assets and systems (e.g., firewalls, databases, endpoint devices) that must be monitored to meet compliance requirements.
Ensure SIEM policy alignment: Configure SIEM to generate reports, alerts, and log retention policies that comply with legal mandates. For example, GDPR requires organizations to detect and report data breaches within 72 hours, which means SIEM should support real-time monitoring and rapid response mechanisms.
Enable audit trails and reporting: SIEM should generate automated compliance reports tailored to regulatory audits, reducing the need for manual effort.
2. Ensure Comprehensive and Secure Log Collection
SIEM is only as effective as the data it collects. Comprehensive log collection ensures that security teams have complete visibility into security events, enabling accurate threat detection and compliance verification.
To achieve secure and effective log collection:
Centralize logs from all relevant sources: SIEM should collect logs from firewalls, intrusion detection/prevention systems (IDS/IPS), cloud applications, endpoint devices, identity and access management (IAM) systems, and network traffic monitors.
Normalize and correlate logs: Different systems generate logs in varying formats. SIEM should normalize logs into a standardized structure for effective correlation and analysis.
Ensure secure log transmission and storage: Use encryption (e.g., TLS, AES) to protect log data in transit and at rest. Implement access controls to prevent unauthorized log modifications or deletions.
Validate log integrity: Apply cryptographic hashing or digital signatures to detect any tampering of collected logs.
Eliminate unnecessary data: Configure log filtering to remove non-essential or redundant logs to optimize SIEM performance without losing critical information.
3. Ensure Proper Data Retention Policies
Compliance regulations mandate different log retention periods, ranging from several months to years. SIEM must be configured to store logs in a way that meets these requirements while optimizing storage and retrieval efficiency.
Key considerations for effective data retention policies:
Understand compliance-specific retention requirements:
PCI DSS – Requires logs to be retained for at least one year, with at least three months of data readily available.
HIPAA – Security logs must be kept for six years in healthcare organizations.
SOX – Financial records and logs should be stored for seven years.
GDPR – Log retention should align with the organization’s privacy policies and data minimization principles.
Segment storage for performance optimization: Store recent logs in high-performance storage for rapid query access, while older logs can be archived in cost-effective cold storage solutions.
Use tiered retention strategies: Implement hot, warm, and cold storage tiers to balance cost and accessibility.
Automate log purging and archival: Configure SIEM to automatically delete or archive logs that exceed retention periods to comply with data protection laws and prevent excessive storage costs.
Ensure secure and immutable log storage: Use write-once, read-many (WORM) storage to prevent log tampering, which is critical for forensic investigations and compliance audits.
4. Conduct Periodic Compliance Audits and Assessments
A SIEM system should be continuously evaluated to ensure it remains compliant with evolving regulations and security standards. Regular audits help organizations detect compliance gaps before they lead to legal or financial penalties.
Best practices for compliance audits:
Schedule regular SIEM audits: Conduct audits quarterly or annually, depending on regulatory requirements. Compliance teams should review log completeness, alert configurations, and reporting accuracy.
Validate log collection and correlation rules: Ensure that SIEM is correctly ingesting logs from all critical assets and that correlation rules are detecting security threats as intended.
Assess incident response effectiveness: Test SIEM’s ability to detect and respond to compliance-related incidents, such as unauthorized access attempts or data exfiltration.
Conduct internal and third-party audits: While internal reviews help maintain daily compliance, hiring external auditors ensures unbiased validation of security controls and SIEM configurations.
Monitor policy changes and adjust SIEM settings accordingly: Compliance regulations frequently change. Organizations should stay updated on regulatory updates and adjust SIEM settings to reflect new security requirements.
5. Provide Training for Security Personnel
Even the most advanced SIEM system is ineffective if security teams lack the expertise to configure, monitor, and respond to threats effectively. Regular training ensures that security analysts can maximize SIEM capabilities for compliance and threat detection.
Key areas of SIEM training:
Log analysis and threat correlation: Teach security teams how to interpret logs, detect anomalies, and identify compliance violations using SIEM dashboards.
Incident response and alert triage: Train teams to differentiate between true security threats and false positives, ensuring quick remediation of real incidents.
Compliance-specific reporting: Educate personnel on how to generate regulatory compliance reports tailored for audits (e.g., PCI DSS, HIPAA, GDPR).
SIEM rule tuning and optimization: Show IT teams how to create and modify detection rules to reduce noise and improve accuracy.
Simulated attack and response drills: Conduct tabletop exercises and red-team simulations to test SIEM capabilities in real-world attack scenarios.
### How to Automate Data Preprocessing for Machine Learning with Apache Airflow
Data preprocessing is a critical step in the machine learning pipeline. Automating this process ensures consistency, efficiency, and scalability. Apache Airflow is a powerful orchestration tool that allows you to schedule and monitor data preprocessing tasks programmatically.
This guide walks through setting up Apache Airflow on an Ubuntu cloud GPU server and automating data preprocessing using Airflow DAGs.
Prerequisites
Before proceeding, ensure you have the following:
An Atlantic.Net Cloud GPU server running Ubuntu 24.04.
CUDA Toolkit and cuDNN Installed.
A root or sudo privileges.
Step 1: Install Python and Required Libraries
1. Ensure your system has Python and necessary dependencies installed.
apt install python3 python3-pip python3-venv
2. Create and activate a virtual environment:
python3 -m venv dag-env
source dag-env/bin/activate
3. Install required Python libraries:
pip install numpy pandas scikit-learn tensorflow torch graphviz
Step 2: Install Apache Airflow
Apache Airflow is a powerful platform to programmatically author, schedule, and monitor workflows.
1. Install Airflow.
pip install apache-airflow
2. Initialize the Airflow database.
airflow db init
3. Create a user for the Airflow web interface.
airflow users create --username admin --password admin --firstname Admin --lastname User --role Admin --email admin@example.com
4. Start the Airflow web server and scheduler.
airflow webserver --port 8080 &
airflow scheduler &
5. Access the Airflow UI at http://your-server-ip:8080.
6. Log in with the username and password you created.
Step 3: Create the DAG Directory
Apache Airflow looks for DAGs in a specific directory. By default, this directory is ~/airflow/dags. If it doesn’t exist, create it:
mkdir -p ~/airflow/dags
This is where you’ll place your Python scripts defining the workflows (DAGs).
Step 4: Create Sample Data Files
Before defining the DAG, let’s create a sample dataset (raw_data.csv) to use in the preprocessing pipeline.
Create a directory for your data:
mkdir -p ~/airflow/data
Create a Python script to generate sample data:
nano ~/airflow/data/generate_sample_data.py
Add the following code to generate a sample CSV file:
import pandas as pd
import numpy as np
# Create a sample dataset
data = {
'feature1': np.random.rand(100),
'feature2': np.random.rand(100),
'target': np.random.randint(0, 2, 100)
}
# Introduce some missing values and duplicates
data['feature1'][10:15] = np.nan
data['feature2'][20:25] = np.nan
df = pd.DataFrame(data)
df = pd.concat([df, df.iloc[:5]]) # Add duplicates
# Save to CSV
df.to_csv('~/airflow/data/raw_data.csv', index=False)
print("Sample data saved to ~/airflow/data/raw_data.csv")
Run the script to generate the sample data:
python3 ~/airflow/data/generate_sample_data.py
Step 5: Define Your Data Preprocessing Pipeline
Create a Python script (data_preprocessing_dag.py) in the ~/airflow/dags directory to define your data preprocessing workflow.
nano ~/airflow/dags/data_preprocessing_dag.py
Add the following code to define the data preprocessing pipeline:
from airflow import DAG
from airflow.operators.python_operator import PythonOperator
from datetime import datetime
import pandas as pd
from sklearn.preprocessing import StandardScaler
# Define file paths
RAW_DATA_PATH = '/root/airflow/data/raw_data.csv'
CLEANED_DATA_PATH = '/root/airflow/data/cleaned_data.pkl'
TRANSFORMED_DATA_PATH = '/root/airflow/data/transformed_data.pkl'
PROCESSED_DATA_PATH = '/root/airflow/data/processed_data.csv'
# Define Python functions for each preprocessing step
def load_data():
data = pd.read_csv(RAW_DATA_PATH)
print("Data loaded successfully!")
data.to_pickle(CLEANED_DATA_PATH) # Save as pickle for the next step
def clean_data():
data = pd.read_pickle(CLEANED_DATA_PATH)
data.dropna(inplace=True) # Remove missing values
data.drop_duplicates(inplace=True) # Remove duplicates
print("Data cleaned successfully!")
data.to_pickle(TRANSFORMED_DATA_PATH) # Save as pickle for the next step
def transform_data():
data = pd.read_pickle(TRANSFORMED_DATA_PATH)
scaler = StandardScaler()
data[["feature1", "feature2"]] = scaler.fit_transform(data[["feature1", "feature2"]])
print("Data transformed successfully!")
data.to_pickle(PROCESSED_DATA_PATH) # Save as pickle for the next step
def save_data():
data = pd.read_pickle(PROCESSED_DATA_PATH)
data.to_csv(PROCESSED_DATA_PATH, index=False)
print("Processed data saved successfully!")
# Define the DAG
default_args = {
'owner': 'admin',
'start_date': datetime(2023, 10, 1),
'retries': 1,
}
dag = DAG(
'data_preprocessing_pipeline',
default_args=default_args,
description='Automated Data Preprocessing Pipeline',
schedule_interval='@daily', # Run daily
)
# Define tasks
load_task = PythonOperator(
task_id='load_data',
python_callable=load_data,
dag=dag,
)
clean_task = PythonOperator(
task_id='clean_data',
python_callable=clean_data,
dag=dag,
)
transform_task = PythonOperator(
task_id='transform_data',
python_callable=transform_data,
dag=dag,
)
save_task = PythonOperator(
task_id='save_data',
python_callable=save_data,
dag=dag,
)
# Set task dependencies
load_task >> clean_task >> transform_task >> save_task
Step 6: Run the Pipeline
1. Trigger the DAG.
airflow dags trigger data_preprocessing_pipeline
2. Check the status of the DAG run.
airflow dags list-runs --dag-id data_preprocessing_pipeline
Output.
dag_id | run_id | state | execution_date | start_date | end_date
============================+======================================+=========+===========================+==================================+=========
data_preprocessing_pipeline | manual__2025-03-09T12:08:01+00:00 | running | 2025-03-09T12:08:01+00:00 | 2025-03-09T12:11:25.601992+00:00 |
data_preprocessing_pipeline | scheduled__2023-10-15T00:00:00+00:00 | running | 2023-10-15T00:00:00+00:00 | 2025-03-09T12:12:11.941213+00:00 |
3. Refresh the Airflow UI to see your new DAG (data_preprocessing_pipeline).
4. Double click on the data_preprocessing_pipeline.
Step 7: Verify the Output
After the DAG runs successfully, check the output files in the ~/airflow/data directory:
Cleaned Data: cleaned_data.pkl
Transformed Data: transformed_data.pkl
Processed Data: processed_data.csv
Conclusion
You have successfully set up an automated data preprocessing pipeline using Apache Airflow on an Ubuntu cloud GPU server. This pipeline loads, cleans, transforms, and saves data for further machine learning tasks, ensuring a streamlined and reproducible preprocessing workflow.
### How to Use RASA for Building Scalable Chatbots with Real-time Data on Atlantic.Net GPU Server
Building scalable chatbots that can handle real-time data is critical for many businesses today. RASA, an open-source conversational AI framework, is a powerful tool for creating such chatbots.
This guide will walk you through the process of setting up RASA on an Ubuntu 24.04 GPU server, integrating it with real-time data, and deploying it for scalable usage.
Prerequisites
Before diving into the setup, ensure you have the following:
An Atlantic.Net Cloud GPU server running Ubuntu 24.04.
CUDA Toolkit and cuDNN Installed.
A root or sudo privileges.
Step 1: Install Python and Additional Dependencies
The default Python version in Ubuntu 24.04 is Python 3.12, which is incompatible with some of the libraries required by RASA and HuggingFace. Therefore, we need to install Python 3.10.
1. Add the Python Repository
First, add the deadsnakes PPA to your system to access Python 3.10:
add-apt-repository ppa:deadsnakes/ppa
2. Update the Package Index
Update the package index to ensure you have the latest package listings:
apt update -y
3. Install Python 3.10 and Essential Libraries
Install Python 3.10 along with essential libraries.
apt install python3.10 python3.10-venv python3.10-dev -y
4. Create a Virtual Environment
Create a virtual environment to isolate your RASA installation.
python3.10 -m venv rasa-env
source rasa-env/bin/activate
Step 2: Install RASA and Additional Packages
With the virtual environment activated, install RASA and other necessary packages.
pip install rasa
pip install fastapi uvicorn websockets
Step 3: Initialize and Train the RASA Model
1. Initialize a new RASA project.
rasa init --no-prompt
This command creates a new RASA project with default configurations and sample data.
2. Train the RASA model using the sample data.
rasa train
This command trains the model and saves it in the models directory.
Step 4: Create a FastAPI Server for Real-time Communication
To enable real-time communication with the chatbot, we'll use FastAPI to create a WebSocket server.
Create a new file named rasa_server.py:
nano rasa_server.py
Add the following code to the file:
from fastapi import FastAPI, WebSocket
from rasa.core.agent import Agent
from rasa.utils.endpoints import EndpointConfig
import asyncio
# Load the Rasa agent
agent = Agent.load("models", action_endpoint=EndpointConfig(url="http://localhost:5055/webhook"))
app = FastAPI()
# Root endpoint
@app.get("/")
async def root():
return {"message": "Welcome to the Chatbot Server!"}
@app.websocket("/chat")
async def chat(websocket: WebSocket):
await websocket.accept()
while True:
data = await websocket.receive_text()
response = await agent.handle_text(data)
await websocket.send_text(response[0]['text'])
This script sets up a FastAPI server that loads the RASA model and handles WebSocket connections for real-time chat.
Step 5: Create Custom Actions
Custom actions allow your chatbot to perform specific tasks. Create a new file named actions.py:
nano actions.py
Add the following code to define a custom greeting action:
from rasa_sdk import Action, Tracker
from rasa_sdk.executor import CollectingDispatcher
class ActionGreet(Action):
def name(self) -> str:
return "action_greet"
def run(self, dispatcher: CollectingDispatcher, tracker: Tracker, domain: dict) -> list:
dispatcher.utter_message(text="Hello! How can I assist you today?")
return []
Step 6: Run the RASA Action Server and API
Run the RASA action server in the background:
rasa run actions &
Run the RASA API server:
rasa run --enable-api &
Step 7: Start the FastAPI Server
Start the FastAPI server using Uvicorn:
uvicorn rasa_server:app --host 0.0.0.0 --port 8000 --reload &
This command starts the server on 0.0.0.0:8000 with auto-reload enabled.
Step 8: Install WebSocat for WebSocket Testing
WebSocat is a command-line tool for testing WebSocket connections. Download and install it:
wget https://github.com/vi/websocat/releases/download/v1.14.0/websocat.x86_64-unknown-linux-musl
mv websocat.x86_64-unknown-linux-musl /usr/bin/websocat
chmod 755 /usr/bin/websocat
Step 9: Test the Chatbot Server
1. Test the Root Endpoint
Ensure the FastAPI server is running by testing the root endpoint:
curl http://localhost:8000
You should see the following response:
INFO: 127.0.0.1:52546 - "GET / HTTP/1.1" 200 OK
{"message":"Welcome to the Chatbot Server!"}
2. Test the WebSocket Connection
Use WebSocat to test the WebSocket connection:
websocat ws://localhost:8000/chat
3. Start a conversation with the chatbot:
> Hello
< Hey! How are you?
> I am fine. What are you doing?
< I am a bot, powered by Rasa.
Conclusion
You have successfully set up a scalable chatbot using RASA on an Ubuntu 24.04 GPU server. The integration with FastAPI enables real-time communication, making the chatbot suitable for various applications. With additional steps like containerization and orchestration, you can further enhance the scalability and reliability of your chatbot in a production environment.
### Windows Server 2025 Hosting: Now Available on the Atlantic.Net Cloud Platform
Windows Server 2025 is here, and it's packed with improvements to security, performance, and features. Even better, you can now get your hands on Windows Server 2025 hosting through the Atlantic.Net Cloud Platform!
In this article, we'll explore everything you need to know about Windows Server 2025, from its different editions to its powerful capabilities. Whether you're thinking of upgrading or starting fresh, let's dive in and discover more about this important business server operating system.
What Is Windows Server 2025?
So, what exactly is Windows Server 2025? It's the latest and greatest server operating system from Microsoft, designed to give businesses the tools they need to thrive. Think powerful features for virtualization, seamless cloud connectivity, enhanced security, and simplified management. Building on the success of its predecessors, Windows Server 2025 introduces a range of improvements and exciting new capabilities.
There are two new editions of Windows Server 2025:
Windows Server 2025 Datacenter: A full-featured edition for large-scale deployments, virtualization, and advanced features. Designed for large enterprises with demanding workloads and advanced requirements. It offers advanced features like Storage Spaces Direct, shielded virtual machines, and unlimited virtualization rights. The Datacenter edition is ideal for critical workloads and large-scale deployments.
Windows Server 2025 Standard: An edition designed for smaller businesses or those with less demanding needs. It includes essential server features and supports a limited number of virtual machines. Windows Server Standard is suitable for file servers, application servers, and other common server roles.
Its important to note that there is also different variations of each version, dependent on what you need. Both Datacenter and Standard come in versions with and without the "Desktop Experience".
This means:
With Desktop Experience: Includes a graphical user interface (GUI) similar to what you'd see on a Windows 11 desktop. This is useful for those who prefer a visual interface or need certain GUI-based applications.
Without Desktop Experience (Server Core): This is a command-line only installation, offering a much smaller footprint, reduced attack surface, and better performance for some tasks.
Most of our users opt for the Desktop Experience; however, it's nice to know that the server core version is available for the technically inclined and those who need a smaller footprint, better performance, and enhanced security.
Benefits of Windows Server 2025 Hosting
Choosing Windows Server 2025 hosting, especially through platforms like Atlantic.Net, provides plenty of new technology and numerous advantages to our customers.
Enhanced Security
Windows Server 2025 incorporates built-in security features, including advanced security capabilities like VBS key protection and Credential Guard, to protect your critical workloads and data. These advanced security features help mitigate threats and ensure the integrity of your server environments.
Optimized Performance
Experience improved performance with optimized resource utilization and new features designed for high performance. Whether running Windows Server deployments as file servers, application servers, virtual machines, or domain controllers, you'll benefit from improved performance and scalability.
Centralized Management
Simplify management with Windows Admin Center, providing a centralized platform for managing your Windows Server environments, including on-premises and Azure Arc connected servers. This centralized management simplifies tasks and improves efficiency.
Cloud Integration
Seamless integration with Azure services allows you to extend your on-premises infrastructure to the cloud, creating hybrid cloud solutions. Azure Arc enables you to manage your servers across different environments from a single pane of glass.
Cost Effective Solutions
Windows Server 2025 hosting, particularly when considering cloud options like those offered by Atlantic.Net, can be a cost effective solution, especially when leveraging virtualization and cloud resources. Choosing the right edition and licensing model can optimize your IT spending.
Scalability
Scale your Windows Server environments easily to meet growing business demands. Whether you need to deploy new VMs or expand your existing infrastructure, Windows Server 2025 provides the scalability you need.
Latest Enhancements and New Features
Windows Server 2025 includes the latest enhancements and new features, ensuring you have access to the most up-to-date technology. These new versions bring improved performance, security, and management capabilities.
Windows Server Licenses
Understanding Windows Server licenses is crucial for compliance and cost optimization, especially when considering long-term usage and upgrades. Atlantic.Net makes this process super simple. With our Windows Server hosting plan there are no contracts, and you can pay-as-you-go, meaning you only pay for the resources you use.
It doesn't matter if you use the server for 2 minutes, 2 months or 2 years; the licensing cost is included with the pay-as-you-go cost. This approach offers a level of flexibility similar to having active software assurance, allowing you to adapt your server usage without being locked into fixed licensing costs. There are no hidden extras!
Windows Server 2025 Key Features
Windows Admin Center
Windows Admin Center simplifies the management of your Windows Server environments with its web-based interface. From a single dashboard, you can manage servers across on-premises, Azure, and other cloud environments, performing essential tasks like configuring network settings, managing storage volumes and virtual disks, and monitoring server health and performance.
Windows Admin Center has matured into a powerful product. It's not just about simplifying routine tasks; it's about giving you deeper control and insights. Plus, with its extensible architecture, you can add even more functionality through a growing library of extensions, tailoring Windows Admin Center to your specific needs.
Security Features in Windows Server 2025
Security, as always, is another top priority in Windows Server 2025. The operating system includes a range of general availability built-in security features to protect your data and infrastructure:
Credential Guard: Credential Guard protects credentials from advanced threats by isolating them in a secure virtualized environment, similar to the concept of secure enclaves, and reinforces a zero-trust security model.
VBS Key Protection: VBS Key Protection safeguards your cryptographic keys by storing them in an isolated, virtualized environment, preventing access even if the operating system is compromised. This adds a crucial layer of defense against sophisticated attacks targeting your sensitive data.
Transport Layer Security (TLS) Connections: Windows Server 2025 supports the latest TLS versions, including TLS 1.3, ensuring that all communication between your servers and client devices is encrypted with the strongest protocols available. This protects your data from eavesdropping and tampering, maintaining confidentiality and integrity.
Network Security: Windows Server 2025 strengthens network security with features like Network ATC, which simplifies network configuration and helps prevent misconfigurations that could lead to vulnerabilities. This, combined with enhanced firewall capabilities and support for the latest security protocols, provides robust protection against unauthorized network access.
Enhanced Security: Windows Server 2025 includes numerous enhancements to improve the overall security posture of your server environments. Beyond the features mentioned above, Microsoft has implemented numerous enhancements throughout the operating system to harden its defenses and reduce its attack surface, including improvements to user access control, threat detection, and exploit mitigation, providing a more secure foundation for your critical workloads.
Windows Server 2025 Virtuailzation
Windows Server 2025 provides a powerful platform for both virtual machines (VMs) and containers, offering enhanced performance and flexibility for your workloads. Hyper-V, Microsoft's virtualization technology, is deeply integrated, allowing you to easily create and manage VMs. This latest version boasts significant performance enhancements, including faster VM startup times and reduced I/O overhead. A standout feature is GPU partitioning, enabling you to share a physical GPU across multiple VMs, ideal for demanding workloads like AI and machine learning.
Beyond VMs, Windows Server 2025 advances containerization with improved Windows Containers and enhanced Kubernetes support. This allows you to run containerized applications more efficiently and manage them at scale. Whether you're consolidating your server infrastructure with VMs or embracing modern containerized deployments, Windows Server 2025 delivers the virtualization capabilities you need.
Active Directory
Active Directory remains a fundamental reason why our customer choose Windows Server environments, and Windows Server 2025 continues the strong support for on-premise AD. Active Directory (AD) provides the essential services for managing users, computers, other devices and other resources within your network using centralized authentication and authorization. AD ensures that only authorized users and devices can access specific resources, enhancing security and simplifying access control.
Windows Server 2025 introduces several enhancements to Active Directory, including improved performance for domain controllers, stronger security for machine accounts, and better integration with Azure Active Directory or LDAP client. These improvements make AD much more stable on cloud deployments, especially for larger organizations and those with hybrid cloud environments.
Powering Your Applications with Windows Server 2025
Windows Server 2025 provides a robust foundation for your application servers, offering the high performance, scalability, and reliability needed to support your critical business applications. Whether you're running web applications, a database SQL Server enterprise resource planning (ERP) systems, or custom-built cloud applications, Windows Server 2025 delivers the features and capabilities you need.
Enhanced Application Performance
One of the things that makes Windows Server 2025 shine is its sheer speed. Microsoft has fine-tuned the performance, so you get lightning-fast network speeds, minimal delays, and super-efficient memory management. This means your applications will run smoother and respond quicker than ever, keeping your users happy and your business running smoothly.
Support for Diverse Applications
But speed isn't everything. Windows Server 2025 is also incredibly versatile. It can handle everything from traditional on-premises applications to the latest cloud-native ones. Whether your developers love.NET, Java, or open-source tools, they'll find the flexibility they need to build and deploy amazing applications.
Simplified Deployment and Management
And speaking of developers, Microsoft has made their lives easier too. Setting up and managing your application servers is a breeze with familiar tools like Server Manager and the super-handy Windows Admin Center. And if you're in the cloud with a provider like Atlantic.Net it's even simpler, thanks to their intuitive interfaces and automated tools.
Advanced Storage Capabilities
Worried about your data? Don't be. Windows Server 2025 has advanced storage features like Storage Spaces Direct, which lets you create super-reliable storage clusters. This means your critical application data is always safe and sound, even if a hard drive decides to take a break.
Enhanced Security for Applications
Of course, security is a top priority. Windows Server 2025 comes with a whole arsenal of security features to keep your applications and data locked down tight. Credential Guard, VBS enclaves, and confidential attributes are just some of the tools that help prevent unauthorized access and protect your sensitive information.
Network Optimization for Applications
Windows Server 2025 includes features that optimize network performance for your applications. Network ATC simplifies network configuration and management, while support for the latest TLS versions ensures secure communication between your application servers and clients.
Developer-Friendly Features
To help support developers, Microsoft introduced a new feature called Dev Drive. It's a special storage volume that's optimized for development work, making coding and testing faster and more efficient.
Windows Server 2025: The Ideal Platform for Your Applications
With its comprehensive set of features, enhanced performance, and robust security, Windows Server 2025 is the ideal platform for running your business-critical applications. Windows Server 2025 provides the foundation you need for migrating existing applications or building new ones.
Upgrading to Windows Server 2025
Upgrading to the latest version of Windows Server on Atlantic.Net involves a streamlined process that leverages our powerful cloud platform. Here's how it works:
Modify Service Plan: If you need to upgrade your hardware specs (CPU, RAM, storage) to meet the requirements of Windows Server 2025, you can easily modify your service plan through the Atlantic.Net Cloud Platform UI. This ensures your server has the necessary resources to run the new operating system efficiently.
Deploy New 2025 Instance: Once your service plan is updated, you can deploy a fresh instance of Windows Server 2025. Atlantic.Net offers a variety of pre-configured images, including the popular Standard edition, allowing you to quickly spin up a new server with the desired configuration. This gives you the advantage of starting with a pristine, optimized installation of the latest Windows Server version, free from any potential legacy issues.
Restore from Snapshot: To preserve your existing data and applications, you'll need to restore them from a snapshot. Atlantic.Net's snapshot feature allows you to capture the entire state of your existing Windows Server instance, including the applications, and data. You can then restore the relevant data from this snapshot to your new Windows Server 2025 instance, ensuring a seamless transition without data loss.
This approach eliminates the need for traditional in-place upgrades, simplifying the process and minimizing downtime. While Atlantic.Net handles the underlying infrastructure, it's still recommended to verify that your applications are compatible with Windows Server 2025 before initiating the upgrade.
Atlantic.Net is proud to offer Windows Server 2025 hosting on our award winning cloud platform. Whether you're looking to upgrade your existing infrastructure or deploy new Windows Server environments, Atlantic.Net provides the tools and resources you need to succeed. Our cloud platform offers scalability, security, and cost-effectiveness, making it the ideal choice for your Windows Server 2025 deployments.
Contact Atlantic.Net today to learn more about our Windows Server 2025 hosting solutions.
### GPUs in Cloud Computing: 4 Cloud Providers Compared
Almost all cloud providers offer GPUs, or graphics processing units, as an optional add-on for cloud-based computing resources. GPUs enhance cloud computing by performing complex calculations efficiently. Unlike CPUs, which handle a few threads quickly, GPUs can manage thousands simultaneously, making them ideal for tasks that require parallel processing. This capacity enables faster data analysis, simulation, and rendering, crucial for various cloud-based applications, from machine learning to graphics rendering and scientific computing.
In a cloud computing environment, GPUs are critical for managing large datasets and performing high-speed computations. They support industries relying on intensive computation, including financial modeling, gaming, and predictive analytics. By offloading demanding tasks from CPUs, GPUs improve overall system performance and energy efficiency in cloud environments, offering scalable solutions to meet growing computational demands.
This is part of a series of articles about GPU for AI.
How GPUs Impact Cloud Computing
The application of GPUs in cloud computing goes beyond speed, enabling new functionalities and services. Cloud service providers integrate GPUs to offer accelerated machine learning and deep learning frameworks. This integration allows companies to innovate faster by accessing high-performance computing resources without the overhead costs of maintaining physical hardware.
Acceleration of Compute-Intensive Workloads
GPUs accelerate compute-intensive workloads by harnessing their parallel processing architecture to handle massive amounts of data simultaneously. This ability is particularly beneficial for applications in scientific research and 3D rendering, where large volumes of data need processing quickly. By reducing computation time, GPUs enable researchers and businesses to achieve faster results.
The use of GPUs in cloud computing democratizes access to high-performance computing resources. Organizations that might not afford expensive infrastructure can leverage cloud-based GPU power for their complex computational needs. This accessibility facilitates innovation and experimentation across various domains, from academic research to commercial product development.
Improved Efficiency for Parallel Processing
GPUs significantly boost parallel processing efficiency, performing numerous calculations simultaneously. This advantage is essential for applications needing extensive image, video, or data processing. By optimizing these tasks, GPUs ensure faster completion times.
Parallel processing also plays a role in reducing computational resources needed for large-scale operations. By efficiently distributing workloads across thousands of GPU cores, cloud computing systems minimize bottlenecks and enhance system throughput. This capability ensures high operational efficiency for enterprises relying on intensive computing tasks and large datasets.
Enabling Real-Time Applications
GPUs enable real-time applications by providing the necessary computational power to process and analyze data on-the-fly. This capability is important in sectors such as eCommerce, financial services, and entertainment, where decision-making depends on immediate data insights.
In addition, real-time applications benefit from the scalability of GPU-accelerated cloud platforms. As the demand for rapid data processing grows, cloud services equipped with GPUs scale efficiently to accommodate increased workloads. This scalability enables businesses to maintain continuous service availability and performance.
Related content: Read our guide to GPU for deep learning
Key Use Cases for GPU in Cloud Computing
Artificial Intelligence and Machine Learning
GPUs are essential for training deep learning models, where large datasets and complex computations are involved. Neural networks, especially deep architectures like convolutional and transformer-based models, benefit from the parallelism that GPUs provide, reducing training times compared to CPUs. This enables faster experimentation cycles, critical for applications like computer vision, natural language processing, and autonomous systems.
GPUs are also used for inference tasks in production environments. For real-time AI applications—such as voice assistants, recommendation engines, and fraud detection—GPUs process input data rapidly, ensuring low-latency responses. This performance boost is key in
High-Performance Computing (HPC)
HPC applications in fields such as weather forecasting, molecular simulations, and seismic analysis require handling massive computational workloads. GPUs provide the power needed to execute highly parallel operations, making them suitable for tasks like finite element analysis, fluid dynamics, and large-scale simulations.
In addition, cloud-based GPU clusters offer on-demand scalability, allowing organizations to run large-scale simulations without the need for on-premise infrastructure. This flexibility supports projects requiring intermittent high performance, such as drug discovery or computational chemistry, where experiments can scale according to research needs.
Data Analytics
GPUs speed up data preprocessing, aggregation, and querying tasks. They are particularly beneficial in environments involving big data, where datasets are too large for traditional CPU processing. For example, GPUs accelerate SQL queries and data transformations using GPU-optimized frameworks, helping analysts derive insights quickly.
In machine learning-driven analytics, GPUs enable faster model training and iterative analysis on big datasets, such as real-time customer behavior tracking or predictive maintenance systems. This speed allows organizations to make timely, data-driven decisions.
Graphics Rendering and Visualization
GPUs are built for rendering complex visualizations and 3D graphics, making them useful for cloud-based applications in gaming, virtual reality, and digital content creation. In these cases, cloud providers offer GPU-powered virtual machines to render graphics-intensive scenes in real time, reducing latency and enabling smooth user experiences.
Visualization in scientific research, architecture, and engineering also relies on GPU acceleration. Fields like medical imaging or computer-aided design (CAD) benefit from GPUs to generate detailed models, perform simulations, and visualize high-resolution images. Applications include surgical planning, geological mapping, and product prototyping.
GPUs for Cloud Computing: Challenges and Solutions
Despite the benefits, using GPUs for cloud computing also presents challenges such as cost management and resource allocation. Addressing these issues involves implementing strategies for efficient deployment and operation, ensuring businesses capitalize on the capabilities of GPUs without incurring prohibitive expenses. Effective management methods are crucial for optimizing performance and reducing operational costs.
Cost Management
Managing costs associated with GPU-powered cloud computing can be challenging due to the high expenses of running compute-intensive applications. Effective cost management strategies include utilizing cloud provider tools for monitoring and scaling resources, ensuring usage aligns with demand. Pay-per-use and commitment discounts can be leveraged for cost savings and predictability.
In addition, companies can explore optimizing their workloads to reduce GPU time consumption, thereby lowering operational expenses. Employing machine learning pipelines efficiently and scheduling tasks during off-peak hours might further cut costs.
Resource Allocation and Scheduling for Optimal Performance
Resource allocation in cloud environments using GPUs involves distributing tasks efficiently across available resources to maximize performance. Effective scheduling ensures that compute resources are neither underutilized nor overburdened, achieving balanced workload distribution. Leveraging cloud provider tools and algorithms can help in dynamic resource scaling and optimal utilization of GPU nodes.
Maintaining optimal performance also requires monitoring and adjusting resource allocations based on real-time data and usage patterns. By integrating automated systems for load balancing and resource monitoring, companies can improve efficiency, minimize latency, and ensure smooth operation of applications.
Network Bandwidth and Data Transfer Limitations
Network bandwidth and data transfer pose potential constraints in GPU-accelerated cloud computing by limiting data throughput and increasing latency. Solutions include employing advanced data compression techniques and optimizing application architectures to reduce dependency on high bandwidth. Additionally, choosing cloud providers with robust network infrastructure can alleviate bandwidth issues.
Effective data management strategies, such as caching and edge computing, can further mitigate network constraints, ensuring timely data access and processing. Implementing efficient data transfer protocols and architectures that minimize bandwidth consumption without compromising performance is crucial for leveraging GPU capabilities in cloud environments.
Next-Gen Dedicated GPU Servers, Powered by NVIDIA and Atlantic.net
Experience unparalleled performance with dedicated cloud servers equipped with the revolutionary NVIDIA accelerated computing platform.
Choose from the NVIDIA L40S Tensor Core GPU and NVIDIA H100 NVL GPU to unleash the full potential of your generative artificial intelligence (AI) workloads, train large language models (LLMs), and harness natural language processing (NLP) in real time.
High-performance GPUs are superb at scientific research, 3D graphics and rendering, medical imaging, climate modeling, fraud detection, financial modeling, and advanced video processing.
Learn more about Atlantic.net GPU server hosting
### Atlantic.Net Scores Winning Partnership with San Jose Earthquakes
We are pleased to announce a multi-year partnership with the San Jose Earthquakes, establishing Atlantic.Net as the Official Cloud Server Hosting Platform and Official Accelerated Compute Provider.
The Earthquakes provide an excellent platform for Atlantic.Net to reach an affluent and growing soccer fanbase in the heart of Silicon Valley, and Atlantic.Net provides the latest accelerated computing which can greatly help equip the Earthquakes with the technological advancements to further achieve their goals on and off the field.
Forming its partnership just before the Quakes’ season opener game on Feb. 22, 2025, fans will first see Atlantic.Net’s presence as a promotional sponsor partner at the stadium. In the next phase of the partnership, Atlantic.Net will pivot the deployment of our cloud services for the Quakes, allowing the organization to save costs on infrastructure and take advantage of managed services to further decrease its information technology costs.
This marks the second time a professional sports team has partnered with Atlantic.Net, following The National Basketball Association’s Orlando Magic partnership established in 2009.
We are thrilled to partner with the San Jose Earthquakes, an organization that shares our passion for innovation and excellence. We are confident that our secure and high-performance cloud solutions provide a perfect fit to equip the Earthquakes with the technological advancements to further achieve their IT goals.
Go Earthquakes!
### AI in Drug Discovery: Technologies and Practical Applications
What Is Drug Discovery?
Drug discovery is the process of identifying and developing new medications to treat diseases and improve health. This involves understanding disease mechanisms, identifying biological targets, and designing molecules that can interact with those targets.
The process typically includes several stages, starting with basic research to identify potential therapeutic targets, followed by drug design and optimization, preclinical testing, and clinical trials.
Each phase ensures the drug's safety, efficacy, and suitability for human use. Drug discovery is a critical and complex aspect of pharmaceutical research, requiring multidisciplinary collaboration across biology, chemistry, medicine, and data science.
This is part of a series of articles about HIPAA compliance
The Evolution of Drug Discovery: From Traditional Methods to AI
Throughout history, drug discovery relied on labor-intensive laboratory testing and serendipitous findings. Traditional methods involved trial-and-error processes that were both time-consuming and costly, often taking years to develop a single drug.
Limitations of Traditional Drug Discovery Methods
Traditional drug discovery methods face several limitations, such as the significant time and financial investments required. It involves screening millions of compounds against target diseases, which can take years to yield a viable pharmaceutical product. The extensive trial and error further add to the resource constraints encountered in traditional approaches.
Another limitation is the low success rate, as many candidates fail to progress beyond clinical trials. The complexity of biological systems often leads to unexpected failures, with only a small percentage advancing past each phase.
Artificial Intelligence in Drug Discovery
AI significantly improves the efficiency and accuracy of finding new drugs. AI tools can process vast biological datasets quickly, uncovering patterns not immediately evident through manual efforts. This automated approach accelerates the identification of new drug targets and potential compounds.
Machine learning models can predict molecular interactions and potential drug side effects, reducing trial phases' burden. By simulating various scenarios computationally, AI avoids unnecessary experimentation, optimizing resource utilization.
Key AI Technologies Revolutionizing Drug Discovery
Artificial intelligence (AI) technologies have transformed drug discovery by automating complex processes and enhancing decision-making. Here are some notable AI innovations:
Machine learning for predictive modeling: Machine learning algorithms analyze large datasets to identify patterns and predict how potential drug candidates will behave. For example, by modeling molecular interactions, machine learning helps researchers select promising compounds while eliminating those likely to fail, reducing the costs and time spent on unsuccessful trials.
Generative AI for novel compound design: Generative AI models, such as variational autoencoders (VAEs) and generative adversarial networks (GANs), explore chemical spaces and design new compounds based on therapeutic goals. By learning from known chemical structures, these models can generate new molecules. For example, generative AI assisted in the discovery of halicin, a powerful antibiotic, by rapidly screening thousands of molecules and identifying candidates.
AlphaFold for Protein structure prediction: Accurate protein models help researchers understand how drugs interact with biological targets, improving the design of molecules that bind effectively. Google’s AlphaFold 3 has advanced this further by modeling protein interactions with other molecules, such as sugars and nucleic acids.
Multimodal AI for complex data integration: Multimodal AI systems integrate diverse datasets, including genomics, proteomics, and clinical data, to provide a comprehensive view of biological mechanisms. These models enable simultaneous analysis of text, imaging, and molecular data, identifying new therapeutic targets and guiding personalized treatment approaches.
Natural Language Processing (NLP) for literature mining: NLP tools analyze vast amounts of text-based data to uncover connections between known drugs, diseases, and biological pathways, enabling drug repurposing and target discovery.
Explainable AI (XAI) for regulatory compliance: XAI frameworks provide insights into the decision-making process, helping regulators and stakeholders understand the rationale behind drug candidates’ selection.
Tips from the expert:
In my experience, here are tips that can help you better leverage AI in drug discovery:
Implement federated learning for data privacy: Utilize federated learning to train AI models on sensitive biomedical data across multiple organizations without sharing raw data. This ensures privacy while enabling access to a broader dataset, improving model accuracy and generalizability.
Incorporate active learning to optimize data usage: Use active learning techniques to prioritize the most informative data points for model training. This minimizes the need for extensive labeled datasets and accelerates the iterative learning process in resource-constrained settings.
Combine physics-based models with AI-driven predictions: Hybrid approaches that integrate AI with physics-based simulations, such as molecular dynamics, improve the accuracy of drug design. These combinations account for physical properties that pure AI models may overlook.
Utilize generative AI for novel compound design: Deploy generative AI models like variational autoencoders (VAEs) or generative adversarial networks (GANs) to create novel molecular structures. These tools explore vast chemical spaces efficiently and can tailor compounds to therapeutic goals.
Focus on explainable AI (XAI) for regulatory acceptance: Ensure the AI models offer interpretable insights into their predictions. Explainable AI frameworks help regulators and stakeholders understand decision-making processes, facilitating trust and compliance with regulatory standards.
Applications of AI in Drug Discovery
Identifying New Drug Targets
AI algorithms accelerate the discovery of drug targets by analyzing large biological datasets, such as gene expression profiles and protein-protein interaction networks. Tools like AlphaFold predict protein structures with high accuracy, revealing potential binding sites for therapeutic intervention. Machine learning models can prioritize targets based on their relevance to diseases.
Additionally, AI-driven approaches help uncover previously unknown or overlooked targets by identifying hidden patterns within complex biological systems. For example, AI-based methods analyze data across multiple modalities, such as transcriptomics and proteomics, to highlight pathways and interactions that may serve as viable drug targets.
Virtual Screening and Drug Repurposing
Structure-based and ligand-based virtual screening methods powered by machine learning models assess the compatibility of compounds with target proteins, drastically reducing the need for physical laboratory screening. This computational strategy simplifies the selection of compounds that can be further optimized into viable drug candidates.
AI also aids in drug repurposing by analyzing existing clinical data to find new therapeutic uses for approved drugs. Machine learning models identify hidden correlations between drugs and diseases, uncovering new indications for previously developed drugs.
Predicting Drug Efficacy and Toxicity
AI helps predict drug efficacy by simulating molecular interactions and biological responses before clinical trials begin. By analyzing preclinical data, machine learning models can identify how drugs interact with target proteins and biological systems, allowing for early optimization of drug candidates.
In addition, AI-driven toxicology models assess potential adverse effects by detecting patterns associated with toxicity, such as hepatotoxicity or cardiotoxicity, in preclinical data. This early-stage screening minimizes the risk of failures in human trials, ensuring that only the safest and most effective compounds advance through the drug development pipeline.
AI in Clinical Trial Design and Optimization
AI optimizes clinical trial design by predicting patient responses and outcomes, enabling the selection of appropriate trial populations. Machine learning algorithms can stratify patients based on genetic, demographic, or clinical characteristics, ensuring that those most likely to benefit from the treatment are included.
AI also supports adaptive trial designs by continuously analyzing real-time data from ongoing trials. This allows researchers to adjust dosages, modify protocols, or refine inclusion criteria based on interim results, ultimately speeding up the process while maintaining safety.
Challenges and Limitations of AI in Drug Discovery
Data Quality and Availability Issues
AI-driven drug discovery depends heavily on the quality and availability of data. Incomplete or noisy datasets can lead to inaccurate predictions, affecting the reliability of AI models. Ensuring high-quality, comprehensive data is critical to leverage AI's true potential in drug discovery. Data availability is another hurdle, as valuable proprietary datasets are not always accessible, hindering AI's application across broader contexts.
Ethical Considerations and Regulatory Hurdles
Implementing AI in drug discovery presents ethical considerations and regulatory challenges that need addressing. AI models must be developed transparently, ensuring unbiased data handling and decision-making processes. Regulatory bodies require comprehensive evaluations of AI-driven approaches to mitigate potential technology-related risks.
Integration with Existing Drug Discovery Workflows
Integrating AI within existing drug discovery workflows poses operational challenges, requiring adaptation into established processes. Pharmaceutical organizations must align their infrastructure to support AI's integration while training personnel on new technologies. This organizational shift requires strategic planning to maximize AI's benefits.
5 Best Practices for Implementing AI in Drug Discovery
When using AI to enhance drug discovery, it’s important to consider the following best practices.
1. Collaborating Between AI Experts and Pharmaceutical Scientists
Effective AI implementation in drug discovery requires close collaboration between data scientists, pharmaceutical researchers, and compliance experts. AI models alone cannot capture the complexities of drug development without input from those who understand disease mechanisms, regulatory requirements, and clinical trial design.
By working together, AI and life science professionals can refine predictive models to ensure they align with real-world biological and clinical contexts. For example, multidisciplinary teams can improve AI-driven target identification by integrating domain expertise into data interpretation. AI may highlight potential drug targets based on statistical correlations, but pharmaceutical scientists validate these findings through experimental data and biological plausibility.
2. Ensuring Data Security and Privacy
Ensuring data security and privacy is crucial in AI-enabled drug discovery, particularly given the sensitive nature of biomedical data. Implementing strong data protection measures, such as encryption protocols and access controls, protects patient information and proprietary research data. These security frameworks build trust with partners and stakeholders, enabling open collaboration and data sharing.
AI systems should be designed with privacy by design principles, ensuring compliance with regulations like GDPR and HIPAA. Regular security audits and risk assessments are essential, identifying potential vulnerabilities before exploitation.
3. Ensuring Data Quality
The accuracy of AI models in drug discovery depends on the quality of input data. Poor-quality datasets can lead to incorrect predictions, such as selecting ineffective drug targets or underestimating potential safety risks. To prevent these issues, pharmaceutical companies must implement strict data governance policies, including verifying data provenance, standardizing formats, and removing inconsistencies before feeding data into AI models.
Continuous monitoring and quality checks are also essential. As new datasets become available, models should be updated and revalidated to maintain accuracy. AI-driven drug discovery benefits from curated and harmonized data sources, ensuring that insights are based on reliable, unbiased information rather than incomplete or outdated records.
4. Validation of AI Models with Experimental Data
AI-generated predictions must be validated using real data before being applied in drug discovery. Without experimental verification, AI models risk producing misleading or overly optimistic results that do not translate to real-world conditions. To ensure accuracy, AI-driven insights should be cross-checked with in vitro and in vivo studies, as well as historical clinical trial data.
For example, when AI identifies a potential drug candidate, laboratory experiments should confirm its binding affinity, biological activity, and toxicity profile before progressing further. This iterative process, combining computational modeling with hands-on experimentation, improves confidence in AI-driven predictions and minimizes risks in later drug development stages.
5. Maintaining Transparency of AI Outcomes
Many AI models operate as "black boxes," making it difficult for researchers and regulators to understand how predictions are made. To address this, AI developers should provide clear documentation on the strengths and limitations of their models, including data sources, key assumptions, and validation methods.
Regulatory bodies are more likely to approve AI-assisted drug discoveries when the decision-making process is explainable. AI platforms should incorporate explainability tools that highlight which factors influenced a prediction, such as molecular structure features, known biomarkers, or clinical trial data patterns.
Conclusion
AI is revolutionizing drug discovery by simplifying complex workflows, increasing accuracy, and reducing costs. By integrating advanced machine learning models, generative design tools, and multimodal data analysis, AI helps researchers to accelerate the identification and development of new therapeutics. However, successful implementation requires addressing challenges related to data quality, regulatory compliance, and interdisciplinary collaboration.
### GPU as a Service: Benefits, Use Cases, and How to Choose
What Is GPU as a Service?
GPU as a Service (GaaS) is a cloud-based model that provides scalable access to GPU resources. Unlike traditional setups where organizations purchase and maintain physical hardware, GaaS offers virtual GPUs through the cloud. This service allows organizations to leverage computing resources without the need to invest in expensive infrastructure.
Instead, users can rent GPU resources as needed, making it appropriate for handling workloads with varying demands. Through GaaS, users access GPUs over the internet, enabling them to perform compute-intensive tasks such as deep learning, graphics rendering, and simulation.
This model provides significant benefits in scalability, as resources can be scaled up or down based on varying needs, and in cost-effectiveness, since users pay only for what they use. Additionally, GaaS simplifies the process of integrating GPU capabilities into existing workflows, reducing the complexity associated with hardware maintenance.
This is part of a series of articles about GPU servers.
How GPU as a Service Works
GPU as a Service (GaaS) operates through advanced cloud infrastructure that virtualizes GPU resources, enabling users to access and utilize high-performance computing power on demand. The core components and functionalities that power GaaS include:
Cloud infrastructure: The provider’s cloud infrastructure is housed in advanced data centers. This infrastructure allows users to access GPU resources remotely via devices such as laptops and smartphones. The cloud environment ensures seamless connectivity, making GPU power available wherever an internet connection exists.
Virtualization: Service providers use virtualization technology to divide physical GPU hardware into virtual machines or containers. This enables multiple users to share GPU resources simultaneously without interference. Each virtualized instance operates independently, allowing users to execute their specific workloads securely and efficiently.
Elasticity: Users can increase or decrease the number of GPUs they use, accommodating both short-term intensive tasks and long-term projects. This flexibility eliminates the need for organizations to commit to fixed hardware resources, ensuring cost efficiency and adaptability.
APIs and development platforms: Providers often integrate APIs and development platforms that simplify GPU deployment and management. These tools allow users to automate tasks such as starting, stopping, and monitoring GPU instances, streamlining workflows, and enhancing operational efficiency.
Security and compliance: GaaS providers implement security measures to protect data in transit and at rest. Common security features include encryption, two-factor authentication, identity management, and firewalls. Providers also comply with industry regulations such as GDPR and HIPAA, ensuring data integrity and compliance for sensitive applications.
Benefits of GPU as a Service
GaaS offers several benefits for organizations and developers requiring high-performance computing power:
Cost efficiency: GaaS eliminates the need for upfront investments in expensive GPU hardware. Users pay only for the resources they consume, converting capital expenses into manageable operational costs.
Scalability: Resources can be scaled up or down to match workload demands, ensuring that organizations only use what they need.
Ease of maintenance: Service providers handle all hardware maintenance, including updates, repairs, and replacements. This reduces the operational burden on organizations and ensures uninterrupted access to GPUs.
Access to the latest hardware: GaaS offers access to the latest GPU technologies without requiring hardware upgrades. Providers regularly update their infrastructure, giving users cutting-edge performance capabilities.
Faster time to market: Rapid deployment of GPU resources allows organizations to accelerate project timelines. Developers can access GPUs instantly, avoiding delays associated with procuring and setting up hardware.
Global accessibility: Cloud-based GPUs are accessible from anywhere with an internet connection. This is particularly advantageous for remote teams and collaborative projects spanning multiple locations.
Tips from the expert:
Richard Bailey
Technical Editor
Richard Bailey brings over two decades of IT expertise, from traditional data centers to cutting-edge cloud solutions. As the founder of turbogeek.co.uk and a seasoned writer, he focuses on delivering authoritative content on our hosting services, HIPAA compliance, and related topics.
In my experience, here are tips that can help you make the most of GPU as a Service (GaaS) for your computing needs:
Choose the right GPU instance type for specific workloads: Different GaaS providers offer GPU instance types optimized for specific tasks, such as rendering (NVIDIA RTX series) or deep learning (NVIDIA A100). Always match the instance to the workload to avoid overpaying for underutilized resources or bottlenecks due to insufficient capacity.
Take advantage of spot or preemptible instances: For non-time-critical workloads like batch rendering or training large AI models, spot or preemptible instances can save up to 90% of costs. Implement checkpointing in workflows to prevent data loss when these instances are terminated.
Use auto-scaling to handle fluctuating workloads: Leverage auto-scaling to allocate additional GPU resources during peak usage and scale down when demand is low. This ensures optimal performance while minimizing costs, especially in machine learning training or analytics with unpredictable workloads.
Optimize data transfer to reduce latency and costs: Minimize data transfer between the cloud and local systems by pre-processing or compressing datasets before uploading them to the cloud. Use storage solutions located in the same cloud region as GPU instances to reduce latency and egress fees.
Use containerized environments for easy portability: Deploy GPU workloads in containers using tools like Docker and NVIDIA GPU Cloud (NGC). Containers ensure that dependencies are consistent across different providers or on-premise systems, making it easier to switch providers or replicate environments.
GPU as a Service vs. On-Premise GPUs: A Comparison
Deployment
GPU as a Service utilizes cloud-based environments, offering virtual GPUs maintained by providers. This alleviates the burden of hardware maintenance and allows for dynamic scaling of resources in response to demand fluctuations. Rapid deployment and access to resources are defining features of the GaaS model.
On-premise GPUs involve considerable initial investment in hardware and require ongoing maintenance, which can become resource-heavy for organizations with limited IT staff. The deployment of on-premise systems generally offers more control over hardware configurations, allowing for custom setups tailored to specific applications. However, this comes at the cost of flexibility and scalability.
Cost Considerations
GaaS typically offers lower upfront costs, as it eliminates the need for purchasing and installing physical hardware. Instead, organizations can pay incrementally based on usage, converting what would be capital expenses into manageable operational expenditures.
On-premise solutions require substantial initial investment in hardware and infrastructure, although they may become cost-effective over time for regular, extensive workloads. Organizations needing constant, uninterrupted GPU access might find on-premise solutions more predictable in terms of monthly expenses. However, these savings can be offset by maintenance, power, and infrastructure upgrades.
Security Implications
GaaS providers may offer differing security measures. Prefer a provider that supports compliance standards relevant for your organization, and offers security features like encryption protocols and identity management systems.
On-premise solutions offer more direct control over security configurations, allowing organizations to customize their defenses based on specific needs. This level of control can be appealing for organizations with stringent security requirements or regulations. However, it can be challenging to maintain a strong security posture, as internal teams are responsible for managing updates and responding to threats.
Maintenance and Updates
With GaaS, maintenance responsibilities fall on the service provider, ensuring that hardware updates, patches, and repairs are handled seamlessly. This allows organizations to focus on core activities without worrying about the operational aspects of GPU maintenance. Continuous hardware updates by providers also mean access to the latest technologies without additional cost.
On-premise solutions require organizations to manage their hardware upkeep, from installing updates to dealing with potential hardware failures. This internal management can be demanding, requiring dedicated IT teams and resources to ensure optimal performance. While on-premise setups allow for customizations and configurations, they involve an ongoing commitment to maintaining system health and performance.
Use Cases for GPU as a Service
Machine Learning and AI Training
In machine learning and AI training, GPU as a Service offers support by providing accessible, high-performance computing power. This capability is crucial for training large models and processing massive data sets efficiently. With GaaS, data scientists can allocate additional GPUs as needed, significantly accelerating training times, enabling complex experimentation.
Additionally, GaaS enables rapid prototyping and continuous integration in AI development environments. Researchers can leverage GPU resources without delay, fostering environments where iterative testing and agile methodologies thrive. This immediacy in accessing computing power improves productivity but also enables faster proof-of-concept demonstrations.
High-Performance Computing
High-performance computing (HPC) applications benefit from GPU as a Service due to the immense parallel processing power available through cloud-based GPUs. Industries like aerospace and scientific research, which require intensive calculations and simulations, can leverage GaaS for real-time data analysis and processing.
The scalability of GaaS allows organizations to execute complex tasks that would be otherwise infeasible with an on-premise setup. The ability to access cutting-edge GPU architectures also aids in optimizing workloads that demand significant computational resources. By eliminating the need for infrastructure investment, organizations can redirect resources to innovation.
Graphics Rendering and Visualization
Graphics rendering and visualization are areas where GPU as a Service makes a significant impact, particularly in industries such as media, entertainment, and architecture. By offering high-performance, scalable GPU resources, GaaS enables the rendering of complex graphics and visualizations at superior speeds and high resolutions.
This capability is essential for creating sophisticated visual effects, detailed simulations, and interactive visual content. The flexibility provided by GaaS for artists and designers to access rendering tools on-demand fosters collaboration and innovation. Team members can work on projects without the hardware limitations that typically slow down creative processes.
Data Analytics
GPU as a Service improves data analytics capabilities by offering the processing power necessary to handle big data challenges. This is vital for sectors such as finance, healthcare, and retail, where timely insights from data analysis drive strategic decision-making. The parallel processing abilities of GPUs accelerate data processing tasks, enabling real-time analytics.
GaaS also allows organizations to manage varying data loads without investing in dedicated hardware, aligning with seasonal or project-specific analytics needs. The ability to perform complex computations with cloud-based GPUs ensures that organizations can innovate and respond promptly to market dynamics.
Related content: Read our guide to GPU server for deep learning.
Choosing a GPU-as-a-Service Provider
Here are some of the things to consider when evaluating GaaS providers.
Evaluating Performance and Hardware Options
Providers differ in the GPU models they offer and the technical specifications available. Key considerations include the processing power, memory capacity, and architectural features of the GPUs. Comparing these aspects helps determine which provider best aligns with the specific computational needs of the applications.
Performance metrics, such as latency and throughput, are also important. Understanding how these factors impact workflows is critical, especially for applications requiring high concurrency or real-time processing. Conducting performance tests and analyzing benchmarks from potential providers can offer insights into how their GPUs will perform under workload pressure.
Pricing Models and Cost Efficiency
Providers often offer various pricing structures, such as pay-as-you-go, reserved instances, or spot pricing, each with different cost implications. Understanding these models helps organizations predict expenses more accurately and select the model that best fits their budget and usage patterns.
For short-term projects, pay-as-you-go may be more cost-effective, whereas long-term commitments might benefit from reserved instances. Additionally, assessing the total cost of ownership (TCO) includes examining additional fees that might not be immediately apparent, such as data transfer costs, storage fees, or premium support charges.
Integration with Existing Workflows
Integration with existing workflows is a vital factor when selecting a GPU-as-a-Service provider. Compatibility with current software and systems ensures a smooth transition and maximizes productivity. Evaluate how well the provider's services align with the technical environment and processes, focusing on APIs, SDKs, and support for prevailing development tools.
Providers that offer comprehensive integration support can help simplify workflow adjustments and minimize disruptions. Features such as seamless cloud-based deployment, consistency in user interfaces, and support for automation can improve integration efforts.
Data Security and Compliance
Providers must offer strong security protocols, including encryption, identity management, and regular security audits to protect sensitive information. It is crucial to verify that the provider's security standards align with industry norms and regulatory requirements such as GDPR, HIPAA, or other relevant standards.
Providers should support a transparent compliance framework, offering insights into how they handle data security and privacy concerns. An established incident response plan and continuous monitoring capabilities can add another layer of assurance. Evaluating these factors helps ensure that the GPU deployment is secure and compliant.
Support and Service Level Agreements (SLAs)
Support and Service Level Agreements (SLAs) are key considerations when selecting a GPU-as-a-Service provider. Comprehensive support structures can include technical assistance, user training, and dedicated account management to ensure smooth operation and prompt problem resolution.
Understanding the level of support provided can help organizations plan for potential challenges and ensure continuity in their computational processes. SLAs are indicative of the provider's commitment to uptime and service quality. Key elements to review include the guaranteed uptime percentage, response times for support requests, and any compensation clauses for unfulfilled service commitments.
Next-Gen Dedicated GPU Servers from Atlantic.Net, Accelerated by NVIDIA
Experience unparalleled performance with dedicated cloud servers equipped with the revolutionary NVIDIA accelerated computing platform, and benefiting from Altantic.net’s industry-leading compliance with standards like HIPAA and PCI DSS.
Choose from the NVIDIA L40S GPU and NVIDIA H100 NVL to unleash the full potential of your generative artificial intelligence (AI) workloads, train large language models (LLMs), and harness natural language processing (NLP) in real time.
High-performance GPUs are superb at scientific research, 3D graphics and rendering, medical imaging, climate modeling, fraud detection, financial modeling, and advanced video processing.
Learn more about Atlantic.net GPU server hosting.
### GPU Servers for Deep Learning: A Practical Guide
What Is a GPU Server?
A GPU server is a high-performance computing system to handle tasks requiring intensive parallel processing. Unlike traditional CPU-based servers, GPU servers integrate one or more Graphics Processing Units (GPUs) to accelerate complex computations, particularly those involving large datasets and intricate mathematical operations.
These servers are commonly used in fields such as artificial intelligence (AI), scientific research, and video rendering, where processing speed and efficiency are critical.
The architecture of a GPU server allows it to perform thousands of operations simultaneously, making it ideal for tasks like deep learning, data analytics, and high-performance simulations. By offloading computationally demanding tasks to GPUs, these servers free up CPUs to manage other system processes, resulting in improved performance and resource utilization.
Why Are GPUs Essential for Deep Learning?
The role of GPU servers in deep learning lies in their ability to manage numerous operations simultaneously, drastically reducing the time needed for training deep learning models. Here are the key reasons why GPU servers are becoming popular in deep learning applications:
Parallel processing capabilities: GPUs can handle thousands of threads simultaneously. Deep learning algorithms often require the execution of multiple operations at once, and GPU architecture allows for dividing large computational jobs into smaller, more manageable tasks that can be processed concurrently.
Efficient matrix and tensor computations: Deep learning models rely heavily on operations involving matrices and tensors. GPUs execute these mathematical computations more efficiently than CPUs. Their architecture supports the rapid execution of linear algebra operations, required for neural network training.
Speed improvements for training large models: Training large models demands significant computational resources and time. GPUs markedly reduce training durations through their high processing power and specialized capabilities. The hardware acceleration provided by GPUs allows for faster data throughput and quick execution of complex algorithms.
Key Specifications of a GPU Server for Deep Learning
For deep learning applications, it is crucial to select GPU servers with the right specifications. Here are the key specifications of GPU servers that you must keep in mind.
1. GPU Type and Quantity
Choosing the right GPU type and quantity is the cornerstone of an effective deep learning server. High-performance GPUs, such as NVIDIA's A100 or the newer A200, are specifically designed for AI and machine learning tasks, offering features like Tensor Cores that accelerate deep learning computations. The number of GPUs in a server also directly impacts its processing capability; more GPUs mean higher parallelism and faster model training.
For most deep learning applications, a minimum of four to eight GPUs is recommended, though this can vary depending on the scale and complexity of the projects. It's essential to balance the GPU count with other hardware components to avoid bottlenecks and ensure efficient resource utilization. It’s also important to ensure the system uses a fast inter-GPU networking technology, such as NVIDIA NVLink.
2. Memory Capacity
Memory capacity on the GPU, often referred to as VRAM, is crucial for handling large datasets and complex models. Insufficient GPU memory can lead to issues like memory overflow, which forces models to be broken into smaller, less efficient batches. Modern GPUs offer significant VRAM, often ranging from 16GB to 80GB, which is necessary for training large-scale neural networks.
In addition to GPU memory, system RAM is also important. Deep learning tasks typically require substantial system memory to store datasets and manage operations. A configuration with at least 128GB of system RAM is advisable for most deep learning workloads, ensuring smooth data processing and transition between CPU and GPU.
3. CPU Type and Core Count
While GPUs handle the bulk of the computational load in a deep learning server, CPUs play a crucial role in managing and orchestrating tasks. A multicore CPU with high clock speeds is essential for preprocessing data, managing I/O operations, and coordinating communication between GPUs. CPUs with a higher core count and features like hyper-threading can significantly enhance server performance by efficiently managing simultaneous operations.
It's important to match the CPU capability with the number of GPUs to prevent bottlenecks. For instance, a server with multiple GPUs should be paired with a high-performance CPU, such as those from the AMD EPYC or Intel Xeon series, which offer the scalability and reliability needed for heavy computational workloads.
4. Storage Type and Capacity
Storage in a deep learning server must be both high-capacity and high-speed to accommodate large datasets and ensure quick data access. Solid-state drives (SSDs) are preferred over traditional hard drives due to their superior read/write speeds, which drastically reduce data loading times. NVMe SSDs, in particular, provide the bandwidth and low latency required for intensive data-driven applications.
For most deep learning projects, a minimum of 2TB of storage is recommended, with scalability options to expand as data requirements grow. Additionally, implementing a hybrid storage solution that combines SSDs for active datasets and HDDs for long-term storage can provide an efficient and cost-effective approach.
5. Networking
High-performance networking is essential for GPU servers, especially when dealing with distributed deep learning systems that require communication between multiple servers. Fast network interfaces, such as 10GbE or 25GbE ports, enable quick data transfer, minimizing latency and maximizing throughput in multi-server configurations.
Technologies like InfiniBand are also beneficial for deep learning environments that require low-latency communication. These networking solutions help in maintaining efficient data flow, which is crucial for real-time processing and collaboration in large-scale AI projects.
Tips from the expert:
Richard Bailey
Technical Editor
Richard Bailey brings over two decades of IT expertise, from traditional data centers to cutting-edge cloud solutions. As the founder of turbogeek.co.uk and a seasoned writer, he focuses on delivering authoritative content on our hosting services, HIPAA compliance, and related topics.
In my experience, here are tips that can help you better leverage GPU servers for deep learning:
Leverage mixed precision training: Modern GPUs like the NVIDIA A100 are optimized for mixed precision (FP16 and FP32), allowing faster computations with less memory usage. Incorporate this technique in your deep learning workflows to maximize throughput without sacrificing model accuracy.
Evaluate interconnect bandwidth for multi-GPU scaling: When scaling across multiple GPUs, the bandwidth of interconnects (like NVLink or PCIe) is as crucial as the GPUs themselves. Insufficient bandwidth can create communication bottlenecks, reducing scalability. Run profiling tools (e.g., NVIDIA’s Nsight Systems) to evaluate interconnect performance and adjust configurations.
Utilize asynchronous data loading pipelines: Feeding data into GPUs efficiently is critical. Implement asynchronous data loading with frameworks like PyTorch’s DataLoader and use tools such as DALI (NVIDIA Data Loading Library) to preprocess datasets on the fly, ensuring GPUs are not idle during training.
Fine-tune GPU utilization with dynamic batch sizing: Optimize batch sizes dynamically based on the available GPU memory. Start with the largest batch size that fits in memory, and scale it down only if out-of-memory errors occur. Some frameworks like PyTorch Lightning can automate this process for you.
Profile and optimize training workflows with TensorRT: Post-training optimizations, such as quantization and model pruning using NVIDIA TensorRT, can accelerate inference significantly. It’s particularly useful for deploying models on production GPU servers where latency and power efficiency are critical.
Use Cases for GPU Servers in Deep Learning
GPU servers have critical use cases in deep learning. Here are the top deep learning use cases for these servers.
1. Real-Time Inference and Deployment
Real-time inference involves making predictions on new data almost instantaneously, which is crucial for applications like autonomous driving, fraud detection, and personalized recommendations. GPU servers excel in handling these workloads due to their ability to process large volumes of data with low latency. Their architecture supports rapid execution of inference tasks, ensuring swift and accurate decision-making.
In deployment scenarios, GPU servers provide the scalability and reliability needed to support continuous operations. They provide the performance and stability needed for real-time applications that require consistent responsiveness.
2. Fine-Tuning Pre-Trained Models
Fine-tuning involves adjusting pre-trained models to improve performance on specific tasks or datasets. This process is significantly enhanced by GPU servers, which expedite the retraining process. Fine-tuning requires fewer computational resources than training from scratch but still benefits from the parallel processing and efficiency offered by GPUs.
By leveraging GPU servers, organizations can quickly adapt existing models to new challenges, saving time and computational costs. This capability is particularly useful in domains where data evolves rapidly, such as healthcare diagnostics or financial forecasting.
3. Research and Experimentation
Experimentation in deep learning often involves testing various architectures, hyperparameters, and datasets to discover optimal solutions. GPU servers provide the computational power necessary for conducting extensive experiments efficiently. Their ability to process multiple models and iterations simultaneously accelerates the research cycle, enabling faster innovation and discovery.
For academic and industrial research, GPU servers offer the flexibility and scalability needed to explore complex deep learning challenges. They empower researchers to work with large datasets and intricate models, pushing the boundaries of what is possible in fields like natural language processing and computer vision.
Best Practices for Setting Up GPU Servers for Deep Learning
When setting up a GPU server for deep learning, it's essential to consider both hardware and software configurations to optimize performance. Here are some best practices:
1. Optimize Hardware Configuration
Tailoring the hardware configuration to the deep learning use case is critical for achieving optimal performance. Begin by determining the computational demands of the models—tasks like natural language processing or computer vision may require different GPU types and counts.
Pair GPUs with CPUs that match the workload’s I/O and orchestration needs to avoid bottlenecks. Use fast, high-bandwidth storage solutions like NVMe SSDs for quicker data access and loading. Additionally, implement NVLink or similar technologies for efficient multi-GPU communication.
2. Ensure Efficient Cooling
Efficient cooling is essential for maintaining optimal GPU server performance and preventing hardware damage due to overheating. GPUs generate significant heat during deep learning tasks, so invest in effective cooling solutions like liquid cooling or high-efficiency air conditioning. Regularly monitor temperature using built-in GPU sensors to ensure systems remain within safe operational limits.
3. Optimize Software Stack
Selecting and configuring the right software stack is critical for maximizing the performance of a GPU server. Use operating systems and drivers optimized for GPU computing, such as Ubuntu combined with NVIDIA’s CUDA toolkit. Deep learning frameworks like TensorFlow, PyTorch, and cuDNN should be installed and configured to leverage GPU capabilities fully.
Containerization tools like Docker can help manage and deploy applications efficiently, providing isolated environments that ensure consistency across development and production systems.
4. Implement Robust Security Measures
Security is crucial when setting up GPU servers, especially for applications involving sensitive data. Implement firewalls and intrusion detection systems to protect against unauthorized access. Regularly update software to patch vulnerabilities and use encryption to secure data in transit and at rest.
Additionally, configure user access controls to limit administrative privileges and monitor server activity for any suspicious behavior. These measures help safeguard against cyber threats, ensuring the integrity and confidentiality of deep learning projects.
5. Consider GPU Hosting
For organizations without the infrastructure to support on-premises GPU servers, hosting solutions offer a viable alternative. Cloud providers and hosting providers offer scalable GPU resources on demand, allowing businesses to adjust computational power based on their needs. This flexibility reduces upfront costs and provides access to the latest GPU technology.
Hosted GPU solutions also simplify maintenance and management, handling updates, security, and scalability. This allows teams to focus on development and research rather than infrastructure, making it an attractive option for startups and organizations with fluctuating workloads.
Next-Gen Dedicated GPU Servers from Atlantic.Net, Accelerated by NVIDIA
Experience unparalleled performance with dedicated cloud servers equipped with the revolutionary NVIDIA accelerated computing platform.
Choose from the NVIDIA L40S GPU and NVIDIA H100 NVL to unleash the full potential of your generative artificial intelligence (AI) workloads, train large language models (LLMs), and harness natural language processing (NLP) in real time.
High-performance GPUs are superb at scientific research, 3D graphics and rendering, medical imaging, climate modeling, fraud detection, financial modeling, and advanced video processing.
Learn more about Atlantic.net GPU server hosting.
### Hopper GPU Architecture: Key Innovations and Technical Features
What Is the NVIDIA Hopper GPU Architecture?
The NVIDIA Hopper GPU architecture is a graphics processing unit design. Named after computing pioneer Grace Hopper, this architecture focuses on accelerating artificial intelligence (AI) and high-performance computing (HPC) tasks. It handles complex calculations with improved speed, making it appropriate for data centers and AI researchers.
In the NVIDIA Hopper architecture, several key innovations improve performance. It improves tensor cores for better matrix operations, which are crucial for training deep neural networks. This architecture handles the demands of contemporary AI workloads, offering a framework to meet the increasing computational challenges found in cutting-edge applications.
NVIDIA H100 Tensor Core and the newer H200 GPUs are based on the Hopper architecture. This helps them achieve significantly faster performance for AI inference and training compared to the previous generation.
Key Innovations in the Hopper Architecture
This design introduces several new capabilities that go beyond NVIDIA’s previous architecture, Ampere:
Transformer Engine and FP8 Precision
The transformer engine within the Hopper architecture introduces floating point 8-bit (FP8) precision, a feature for accelerating deep learning processes. FP8 precision allows computations to be executed faster without significant loss of accuracy, optimizing the throughput for AI training tasks.
This adjustability in precision helps adapt workloads to the needed precision dynamically, improving speed and resource efficiency. The transformer engine's design improves deep learning workloads by providing specialized capabilities that match the processing demands of modern AI models. It supports operations crucial for AI training, such as transformer-based model execution.
New DPX Instructions for Dynamic Programming
Hopper's new DPX instructions optimize dynamic programming workloads, commonly found in algorithms like sequence alignment or operations in bioinformatics. These instructions enable more efficient execution of complex computations by increasing parallelism and reducing processing time.
With these improvements, developers can tackle larger datasets and more complex algorithms without proportionally increasing computational resources. This makes the Hopper architecture particularly beneficial for industries that rely on data-intensive computations, ensuring faster processing times and increased throughput across varied applications.
Enhanced Streaming Multiprocessor Design
The improved streaming multiprocessor (SM) design in the NVIDIA Hopper architecture delivers higher throughput and energy efficiency. This design optimizes the execution of parallel workloads by increasing the number of concurrently processed threads. Additionally, improvements in the scheduling algorithms enable more efficient resource utilization in the GPU.
These advancements support a broader array of applications and workloads, ensuring that the Hopper architecture can handle various computation tasks. This design also provides better power efficiency, reducing the energy consumption per computation.
Hopper Architecture: Memory Hierarchy Enhancements
There are a few ways the Hopper architecture improves memory management to boost GPU performance:
High-Bandwidth HBM3 Memory
The Hopper architecture integrates high-bandwidth memory 3 (HBM3), offering substantial memory bandwidth improvements. This enhancement significantly accelerates data throughput, ensuring faster access to large datasets, which is vital for AI and HPC applications. HBM3 allows the GPU to process data more quickly, reducing latency and improving performance.
These improvements are crucial for applications that require large-scale data processing and complex computations. By minimizing memory bottlenecks and providing a larger bandwidth for data transfer, the Hopper architecture can tackle more demanding workloads, making it suitable for AI research and development tasks.
L1 and L2 Cache Improvements
Cache performance is improved in the Hopper architecture with L1 and L2 cache improvements, increasing the speed of data retrieval from memory. This boost in cache efficiency helps in reducing latency and improving the performance of compute-intensive tasks. The upgraded cache hierarchy ensures that frequently accessed data is more readily available, reducing the need for repeated data fetches from distant memory sources.
These cache improvements help optimize the performance of AI and HPC workloads where rapid data access and high-speed processing are essential. With a more efficient cache design, Hopper can deliver quicker execution of complex algorithms, improving the throughput and performance of GPU-dependent tasks.
Distributed Shared Memory
NVIDIA Hopper introduces advancements in distributed shared memory, enabling more efficient resource sharing among GPU nodes. This feature allows for improved scalability when deploying multiple GPUs, essential for handling large datasets across distributed systems. By improving memory coherence and synchronization, it supports seamless data exchange and processing across clustered GPUs.
This shared memory model is crucial for applications requiring multi-GPU support, such as large-scale simulations and AI model training. By ensuring efficient data distribution and access among GPUs, the Hopper architecture improves reduces the overhead associated with inter-GPU communication in distributed environments.
Tips from the expert:
Richard Bailey
Technical Editor
Richard Bailey brings over two decades of IT expertise, from traditional data centers to cutting-edge cloud solutions. As the founder of turbogeek.co.uk and a seasoned writer, he focuses on delivering authoritative content on our hosting services, HIPAA compliance, and related topics.
In my experience, here are tips that can help you better utilize the NVIDIA Hopper GPU architecture for maximum performance and efficiency:
Develop custom precision strategies beyond FP8 and FP16: While FP8 and FP16 precision are key features of Hopper, consider hybrid precision strategies where FP8 is used for less sensitive computations and higher precision (e.g., FP32 or FP64) is reserved for critical parts of the workload. This approach can maximize accuracy without compromising performance.
Use mixed memory models to reduce overhead: Take advantage of Hopper's HBM3 memory for bandwidth-intensive workloads while offloading lower-priority data to local caches or system memory. Combining these memory layers effectively can reduce contention and boost overall performance in mixed workload environments.
Implement tensor core-specific optimizations: Hopper's improved tensor cores thrive on matrix-heavy operations. Restructure AI workloads to use matrix multiplications (GEMMs) where possible, even if it means redesigning parts of the algorithm, to maximize tensor core utilization. This is particularly relevant for transformer models.
Profile workloads for cache efficiency: Use tools like NVIDIA Nsight Systems and Nsight Compute to identify how workloads interact with the enhanced L1 and L2 caches. Fine-tune algorithms to reuse data in cache as much as possible, reducing expensive memory fetches from HBM3.
Leverage asynchronous execution with DPX instructions: Use Hopper’s DPX instructions in conjunction with asynchronous compute streams. This allows dynamic programming tasks to overlap computation and data transfer, further reducing execution time for bioinformatics, genomics, or sequence alignment workloads.
Hopper Architecture: Advanced Interconnect Technologies
Here are a few ways the Hopper architecture innovates on data transfer within and between GPUs:
Fourth-Generation NVLink
The fourth-generation NVLink within the Hopper architecture provides improved connectivity between GPUs, offering significantly higher bandwidth and transfer speeds. It ensures faster data sharing between GPUs, crucial for applications requiring high-speed communication like AI training and HPC simulations. NVLink also reduces bottlenecks in multi-GPU setups.
NVLink Switch System
The NVLink switch system further extends NVIDIA's interconnect capabilities, allowing for more flexible and scalable GPU topologies. This innovation connects multiple GPUs within a system, enabling greater data throughput. By allowing dynamic GPU configurations, this technology supports a broader range of computation environments and workloads.
PCIe Gen 5 Support
Hopper architecture incorporates PCIe Gen 5 support, boosting peripheral connectivity speeds. PCIe Gen 5 offers double the data rate of its predecessor, allowing for faster data transfer between the GPU and other system components. This is particularly crucial for applications requiring rapid data movement between storage, memory, and computational elements.
Hopper vs. Ampere Architecture
The NVIDIA Hopper architecture builds upon the strengths of the previous Ampere architecture, introducing several key improvements to meet the growing demands of AI and HPC workloads. Below is a summary of the key differences and improvements that set Hopper apart:
Performance Improvements
Hopper outperforms Ampere with a new focus on optimized AI and HPC tasks. The inclusion of the transformer engine and FP8 precision enables Hopper GPUs to execute deep learning tasks faster and with greater efficiency. By contrast, Ampere primarily relied on FP16 precision, which, while powerful, lacked the dynamic adaptability that FP8 precision offers in Hopper.
In addition, the improved tensor cores in Hopper deliver better performance for matrix operations, making it more suitable for modern AI models. This improvement significantly improves throughput for training and inference workloads, especially for large-scale transformer models.
Memory Architecture Enhancements
Hopper introduces HBM3 memory, which provides substantially higher bandwidth than the HBM2 memory used in Ampere. This enhancement allows Hopper GPUs to handle larger datasets and more complex computations with reduced latency. Hopper's L1 and L2 cache improvements further reduce memory access times, ensuring faster data retrieval than Ampere.
The distributed shared memory advancements in Hopper also set it apart. This feature improves scalability and multi-GPU resource sharing, which was more limited in Ampere's architecture.
Interconnect Technologies
Hopper’s fourth-generation NVLink and NVLink switch system represent a significant upgrade over Ampere’s NVLink. These advancements provide higher data transfer speeds and improved flexibility in multi-GPU setups, making Hopper more adept at scaling for large AI workloads.
Additionally, Hopper’s support for PCIe Gen 5 ensures faster peripheral data transfer, whereas Ampere supports PCIe Gen 4, which offers comparatively lower throughput.
Dynamic Programming and Specialized Workloads
The introduction of DPX instructions in Hopper allows it to efficiently handle dynamic programming problems, a capability that Ampere lacks. This feature makes Hopper more suitable for specialized workloads, such as bioinformatics and complex algorithmic computations.
Energy Efficiency
Hopper’s improved streaming multiprocessor design increases performance and reduces energy consumption per computation. This efficiency improvement ensures better sustainability and lower operational costs, particularly in large-scale data centers, compared to Ampere.
Best Practices for Utilizing Hopper GPUs
Here are some of the ways to ensure the most effective use of Hopper infrastructure.
1. Optimizing for FP8 Precision
To fully leverage the capabilities of Hopper GPUs, developers should optimize their workflows for FP8 precision, which accelerates performance without compromising accuracy significantly. By adjusting models and algorithms to utilize FP8 operations, developers can achieve faster execution times, maximizing the computational benefits integral to Hopper's design.
This optimization requires careful consideration of precision requirements for each task, ensuring that the benefits of reduced data size do not impact model performance detrimentally. Developers should explore training regimes that exploit FP8 precision for efficient model training and inference, utilizing Hopper's full potential for improved speed and reduced processing load.
2. Leveraging DPX Instructions
Utilizing Hopper's DPX instructions effectively requires an understanding of their application in dynamic programming problems. Developers should integrate these instructions into algorithms that benefit from increased parallelism and computational efficiency. This integration improves performance in areas such as bioinformatics and other scientific computations relying heavily on dynamic programming.
By tailoring workloads to utilize these instructions, developers can significantly reduce processing times and improve resource utilization. This practice ensures optimal GPU performance in complex computational scenarios, allowing for broader applicability and efficiency in applications demanding high-speed data processing and analysis.
3. Maximizing Memory Bandwidth Utilization
To capitalize on the high-bandwidth offerings of Hopper GPUs, developers should focus on optimizing memory access patterns within their applications. Efficient use of the available bandwidth ensures quicker data transfer and minimizes performance bottlenecks. By parallelizing data processing and ensuring coalesced memory accesses, developers can exploit the full potential of the GPU's memory architecture.
Implementing caching strategies and minimizing memory latency are vital for maximizing throughput. Developers should design algorithms that complement the GPU's memory hierarchy to achieve high performance in data-intensive operations, ensuring that the Hopper architecture is used to its utmost potential in handling large-scale datasets efficiently.
4. Efficient Multi-GPU Scaling with NVLink
For effective multi-GPU scaling, developers should leverage NVLink technology to interconnect GPUs, enabling distributed computational tasks to run more smoothly. By utilizing NVLink for data sharing, developers can achieve high-speed inter-GPU communication, minimizing the overhead that often plagues multi-GPU setups.
This strategy includes designing applications that benefit from parallel execution across multiple GPUs, distributing workloads to maximize resource efficiency. By ensuring that applications are well-suited for distributed environments with Hopper's NVLink capabilities, developers can scale their solutions, supporting larger datasets and more complex computations.
5. Updating Software for New Hopper Features
Developers must update their software solutions to integrate the new features provided by the Hopper architecture. This includes adopting the latest CUDA enhancements and optimizing algorithms for new precision and processing capabilities. Keeping software in line with these advancements ensures optimal performance and full use of the GPU's capabilities.
Regular updates and testing are necessary to maintain compatibility and leverage performance improvements. By maintaining an agile development approach, developers can swiftly incorporate new techniques and strategies to stay ahead of evolving computational demands, maximizing the benefits of NVIDIA's latest innovations in AI and HPC applications.
Next-Gen Dedicated GPU Servers from Atlantic.Net, Accelerated by NVIDIA
Experience unparalleled performance with dedicated cloud servers equipped with the revolutionary NVIDIA accelerated computing platform.
Choose from the NVIDIA L40S GPU and NVIDIA H100 NVL to unleash the full potential of your generative artificial intelligence (AI) workloads, train large language models (LLMs), and harness natural language processing (NLP) in real time.
High-performance GPUs are superb at scientific research, 3D graphics and rendering, medical imaging, climate modeling, fraud detection, financial modeling, and advanced video processing.
Learn more about Atlantic.net GPU server hosting
### AI Accelerator vs GPU: 5 Key Differences and How to Choose
What Is an AI Accelerator?
An AI accelerator is a specialized hardware component that speeds up artificial intelligence workloads, particularly machine learning tasks such as training and inference. These accelerators handle the massive parallel processing demands of AI algorithms, which involve high-dimensional data and complex computations. By optimizing for these specific requirements, AI accelerators boost performance, reduce latency, and enhance efficiency over general-purpose processors.
AI accelerators come in various forms, including application-specific integrated circuits (ASICs), field-programmable gate arrays (FPGAs), and dedicated AI chips. Each type offers distinct advantages in terms of speed, power consumption, and cost. They are increasingly integrated into data centers, autonomous vehicles, and edge computing devices to meet the growing demand for AI capabilities across different industry sectors.
What Is a GPU?
A graphics processing unit (GPU) is a specialized processor originally designed to accelerate graphics rendering. GPUs handle the massive parallelism required for processing images and videos due to their ability to perform multiple calculations simultaneously. This attribute also makes them well-suited for scientific computation tasks, including AI and machine learning workloads.
GPUs have evolved beyond their initial role in graphics to become a pivotal component for high-performance computing environments. They are extensively used in data-intensive applications, providing significant speed-ups in AI model training and inferencing tasks. With architectures optimized for high throughput, GPUs handle algorithms that require repeated matrix operations, making them an ideal choice for deep learning frameworks.
This is part of a series of articles about GPU for AI.
How AI Accelerators Work
AI accelerators work by optimizing the execution of specific mathematical operations fundamental to AI workloads, such as matrix multiplications and convolutions. Unlike general-purpose processors, which handle a broad range of tasks, AI accelerators focus on efficiently executing the repetitive and compute-intensive tasks found in machine learning algorithms.
At the core, AI accelerators rely on architectures tailored for parallel processing. They often include a large number of processing cores, each capable of performing operations independently. This setup enables simultaneous computation across multiple data streams, which is critical for tasks like training deep neural networks where millions of parameters are updated iteratively.
Memory bandwidth is another key feature. AI accelerators are designed with high-speed memory or specialized caches to quickly transfer large datasets needed for computation. By minimizing data movement bottlenecks, these accelerators achieve lower latency and higher throughput.
Most AI accelerators incorporate hardware-level optimizations for reduced precision arithmetic, such as 16-bit or 8-bit floating-point calculations, which speed up computations without compromising the accuracy of AI models. These efficiency gains make accelerators indispensable for both training large models and performing real-time inference.
How GPUs Work
GPUs work by leveraging thousands of small, efficient cores optimized for executing multiple operations in parallel. Unlike central processing units (CPUs), which are designed for serial task execution, GPUs excel at parallelism, making them ideal for handling large datasets and performing the same operation repeatedly across data elements.
The architecture of a GPU is built around a grid of streaming multiprocessors (SMs), each containing numerous cores. When a task is executed, the GPU breaks it down into smaller sub-tasks called threads. These threads are processed concurrently, allowing the GPU to handle millions of computations at once, which is critical for rendering complex images or training neural networks.
Memory access in GPUs is designed to support high-speed data transfer between processing cores and global memory. Features like shared memory and memory coalescing help reduce the latency associated with accessing data, further optimizing performance. In this context, they type of RAM used with the GPU can matter too; SRAM (Static Random Access Memory) can be used as a cache to store frequently accessed data, while HBM (High Bandwidth Memory) is composed of 3D-stacked high bandwidth DRAM (Dynamic Random Access Memory) for processing large amounts of data quickly.
GPUs also include specific hardware units like tensor cores (in some models) to accelerate operations common in AI workloads, such as matrix multiplications. These enhancements have made GPUs a versatile tool for both graphics processing and advanced computational tasks, such as simulating scientific phenomena and developing AI models.
Tips from the expert:
Richard Bailey
Technical Editor
Richard Bailey brings over two decades of IT expertise, from traditional data centers to cutting-edge cloud solutions. As the founder of turbogeek.co.uk and a seasoned writer, he focuses on delivering authoritative content on our hosting services, HIPAA compliance, and related topics.
In my experience, here are tips that can help you better navigate the decision between AI accelerators and GPUs:
Consider hybrid deployments for maximum flexibility: For applications requiring a mix of specialized AI tasks and general-purpose computing, consider deploying both AI accelerators and GPUs. For example, use GPUs during prototyping and AI accelerators for production environments with repetitive inference tasks.
Optimize software to leverage hardware fully: Ensure your AI workloads are optimized to take full advantage of the specific hardware. For AI accelerators, this might mean rewriting algorithms to align with their unique architectural features. On GPUs, leverage frameworks like CUDA or ROCm for tailored performance boosts.
Benchmark using real-world workloads: Before making a decision, benchmark both AI accelerators and GPUs using datasets and AI models that closely resemble your actual production environment. Synthetic benchmarks often fail to capture real-world performance nuances.
Account for hardware lifespan and upgrade cycles: AI accelerators may have a shorter shelf life due to their task-specific designs becoming obsolete as AI models evolve. GPUs, being more general-purpose, may remain useful for a wider range of tasks over a longer period, reducing hardware churn.
Plan for AI model evolution: AI models evolve rapidly, often requiring new types of operations. While GPUs are more adaptable to such changes, AI accelerators may require hardware or firmware upgrades to support new features. Plan for this eventuality in your infrastructure strategy.
AI Accelerators vs. GPUs: Key Differences
1. Architecture and Design
The architecture of AI accelerators is built for processing deep learning models, enabling efficient matrix operations and data movement. They frequently use customized hardware paths for specific AI tasks, reducing data handling latency. The design prioritizes throughput and computational density, which are critical for AI workloads.
In contrast, GPU design leverages general-purpose cores optimized for parallel processing, applicable across various domains. Their architecture includes large numbers of smaller cores compared to CPUs, providing a balanced mix of flexibility and performance. By supporting diverse operations, GPUs facilitate different computational tasks within the same hardware platform, maintaining greater adaptability than AI-specific designs.
2. Optimization Goals
AI accelerators focus on reducing power consumption and latency while maximizing the throughput of AI operations. Such optimization targets ensure the execution of machine learning models with minimal resource expenditure. The dedicated hardware paths and specialized processing units allow AI accelerators to achieve these goals effectively.
Conversely, GPUs aim to deliver broad performance improvements across multiple tasks with a strong emphasis on enhancing data parallelism. The optimization strategies employed in GPUs prioritize overall computational throughput and flexibility, maintaining efficiency across a wider range of applications rather than focusing exclusively on AI tasks.
3. Performance Characteristics
AI accelerators exhibit high performance in handling specific AI workloads, characterized by their ability to operate efficiently with low power consumption. This performance stems from their specialized architecture, designed to execute AI tasks swiftly. The accelerators achieve significant gains in speed and efficiency when processing machine learning inference or training data.
GPUs, while also offering strong performance, differ by their broad application versatility. They provide excellent throughput for AI tasks but may underperform compared to specialized AI accelerators when it comes to power efficiency. However, the flexibility of GPUs ensures they remain an appealing choice for projects requiring a mix of AI and other computational tasks.
4. Flexibility
AI accelerators are often less flexible than GPUs, as they are engineered towards specific tasks relevant to AI workloads. Their fixed-function hardware allows for superior efficiency but limits adaptability to new algorithms or non-AI tasks. This characteristic confines their use to environments where tasks are well-known and changes infrequent.
GPUs, conversely, offer high flexibility due to their programmability, which enables adaptation to a wide variety of tasks beyond AI. Their architecture is suitable for diverse applications, accommodating changes in workloads or computational requirements. This makes GPUs an ideal choice for research and development settings or where computational needs are evolving.
5. Cost and Availability
AI accelerators often represent higher upfront costs, given their specialized nature, but can offer savings over time through efficiency and reduced energy usage. They are particularly cost-effective in environments with high volumes of repetitive AI tasks, where their performance and efficiency are maximized.
GPUs are widely available and tend to have lower initial costs given their broad consumer market presence. This availability makes them accessible to various sectors ranging from individual developers to large enterprises. While they may not match the efficiency of dedicated AI accelerators, the flexibility and lower barrier to entry make GPUs a popular choice across industries.
Considerations for Choosing Between AI Accelerators and GPUs
When selecting between AI accelerators and GPUs, it is important to evaluate various factors to ensure the chosen hardware aligns with your specific requirements. Below are key considerations to guide this decision:
Assess computational requirements: Determine the complexity and scale of your AI workloads. AI accelerators are ideal for tasks requiring high efficiency in executing specific operations like matrix multiplications, while GPUs provide versatility for broader computational needs. If your use case involves general-purpose processing in addition to AI tasks, GPUs may be a better choice.
Evaluate energy efficiency: Consider the energy consumption of the hardware. AI accelerators are typically optimized for lower power usage during AI-specific tasks, making them suitable for energy-sensitive environments like edge devices. GPUs, while more flexible, may consume more power due to their general-purpose architecture.
Consider scalability needs: Examine how well the hardware scales with growing workload demands. AI accelerators often excel in large-scale deployments where they can process high volumes of repetitive tasks efficiently. GPUs, with their programmability, may offer better scalability for diverse or evolving workloads.
Analyze total cost of ownership: Factor in both the initial investment and long-term operational costs. AI accelerators might have higher upfront costs but can deliver savings through energy efficiency and faster processing for specific AI applications. GPUs may have a lower initial cost but could incur higher operational expenses due to greater power consumption.
Examine software and ecosystem support: Evaluate the availability of software frameworks and tools compatible with the hardware. AI accelerators may have limited but highly optimized software ecosystems tailored for specific tasks, while GPUs benefit from extensive support for widely used AI frameworks like TensorFlow and PyTorch, making them easier to integrate into diverse workflows.
Next-Gen Dedicated GPU Servers, Powered by NVIDIA and Atlantic.net
Experience unparalleled performance with dedicated cloud servers equipped with the revolutionary NVIDIA accelerated computing platform.
Choose from the NVIDIA L40S Tensor Core GPU and NVIDIA H100 NVL GPU to unleash the full potential of your generative artificial intelligence (AI) workloads, train large language models (LLMs), and harness natural language processing (NLP) in real time.
High-performance GPUs are superb at scientific research, 3D graphics and rendering, medical imaging, climate modeling, fraud detection, financial modeling, and advanced video processing.
Learn more about Atlantic.net GPU server hosting
### GPU for 3D Modeling: A Practical Guide
What Is a GPU for 3D Modeling?
Graphics processing units (GPUs) are crucial in 3D modeling applications due to their ability to handle complex mathematical calculations required to render images, animations, and simulations. Unlike CPUs, which manage general-purpose tasks, GPUs excel at parallel processing, making them ideal for rendering tasks in 3D workflows.
Modern 3D software leverages GPU capabilities to provide faster rendering times, real-time previews, and smoother interaction with detailed models. In addition to their rendering capabilities, GPUs support various acceleration techniques for 3D modeling. Technologies like shader processing, real-time ray tracing, and AI-based enhancements allow designers to achieve higher levels of realism and efficiency. These features enable more detailed textures, realistic lighting, and dynamic simulations.
This is part of a series of articles about GPU applications.
The Role of GPUs in 3D Workflows
GPU vs. CPU Rendering
GPU rendering uses parallel architecture, enabling it to handle thousands of operations simultaneously. This capability dramatically accelerates rendering times compared to CPU rendering. For instance, tasks like real-time visualization and animation playback benefit from GPU rendering, providing smoother and more responsive performance.
In contrast, CPU rendering, though slower, offers precise control and is often used for final renders in certain workflows. While GPUs excel in speed, CPUs are crucial for tasks involving complex logic and sequencing. The choice between GPU and CPU rendering often depends on the specific requirements of the project. Many 3D modeling applications now support hybrid rendering, combining the strengths of both processors.
Benefits of GPU Acceleration
GPU acceleration enhances the rendering process by offloading intensive tasks from the CPU to the GPU, significantly reducing rendering times. This efficiency allows designers to iterate quickly, making real-time modifications and visualizations possible. GPU acceleration also improves the quality of renders, enabling advanced graphics features such as detailed textures, complex lighting effects, and dynamic simulations.
In addition to rendering, GPU acceleration supports other computationally intensive tasks in 3D modeling, such as physics simulations and AI-based enhancements. By leveraging GPUs, these processes run faster and more efficiently.
Key Factors in Choosing a GPU for 3D Modeling
Performance Metrics for 3D Applications
When selecting a GPU for 3D modeling, evaluating performance metrics specific to 3D applications is crucial. Key factors include:
Benchmark scores: Look for GPUs with high scores in 3D rendering benchmarks like SPECviewperf or OctaneBench, which reflect real-world performance in applications such as Maya, Blender, and 3ds Max.
Ray tracing capability: Modern GPUs with dedicated ray tracing cores (e.g., NVIDIA RTX series) provide significant benefits for rendering realistic lighting and shadows in real-time.
Shader processing power: A higher number of shader units and higher clock speeds enable more efficient processing of complex visual effects and simulations.
Video Memory Requirements
Video memory (VRAM) is a critical factor in 3D modeling, as it determines the GPU’s ability to handle large models, textures, and scenes:
Memory capacity: At least 8GB of VRAM is recommended for most 3D modeling tasks, with 16GB or more ideal for high-resolution rendering, complex simulations, and working with detailed assets.
Memory bandwidth: Higher memory bandwidth allows the GPU to access and process data more quickly, which is essential for performance in memory-intensive applications.
GPU Architecture and Core Count
The architecture and core count of a GPU significantly impact its performance in 3D modeling:
Architecture: Modern architectures, such as NVIDIA’s Hopper or Blackwell, or AMD’s RDNA 3, offer improved energy efficiency and support for advanced features like hardware-accelerated ray tracing.
Core count: A higher number of CUDA cores (NVIDIA) or stream processors (AMD) enhances parallel processing capabilities, crucial for rendering and computational tasks in 3D workflows.
Budget Considerations
Balancing performance and cost is essential when choosing a GPU for 3D modeling:
Mid-range options: GPUs like the NVIDIA RTX 4080 or AMD Radeon RX 6700 XT offer good performance for most 3D modeling tasks at a reasonable price.
High-end options: For professionals requiring maximum performance, GPUs such as the NVIDIA GeForce RTX 4090 or AMD Radeon RX 7800 XT provide top-tier capabilities but come with a higher cost.
Value for money: Consider previous-generation GPUs or refurbished models as cost-effective alternatives, such as Radeon RX 6400 or NVIDIA RTX 3060, especially if cutting-edge features are not a priority.
Tips from the expert:
Richard Bailey
Technical Editor
Richard Bailey brings over two decades of IT expertise, from traditional data centers to cutting-edge cloud solutions. As the founder of turbogeek.co.uk and a seasoned writer, he focuses on delivering authoritative content on our hosting services, HIPAA compliance, and related topics.
In my experience, here are tips that can help you better utilize GPUs for 3D modeling:
Leverage GPU partitioning for resource-intensive workflows: Use GPU virtualization or partitioning (e.g., NVIDIA vGPU or AMD MxGPU) to divide GPU resources across multiple workflows or users. This is especially useful in collaborative environments or when running multiple 3D modeling applications simultaneously.
Fine-tune VRAM allocation for texture-heavy scenes: Customize texture compression and level-of-detail (LOD) settings to maximize VRAM usage efficiency. By optimizing texture streaming or limiting high-resolution textures to active camera views, you prevent unnecessary memory consumption while maintaining visual quality.
Use AI-powered noise reduction for faster iterations: Integrate AI denoisers, such as those available in NVIDIA OptiX, into your rendering workflow. These tools can significantly reduce noise in previews, allowing for quick feedback without requiring full-quality renders during the design phase.
Implement GPU overclocking with caution: For advanced users, safe overclocking can provide noticeable performance gains, especially for real-time previews or complex renders. Use GPU overclocking utilities (e.g., MSI Afterburner) and stress-test thoroughly to ensure system stability. Always monitor thermals to avoid hardware degradation.
Explore GPU-driven procedural modeling tools: Some 3D tools now use GPU acceleration for procedural generation (e.g., terrain, fluids, or crowds). By offloading procedural algorithms to the GPU, you can create complex simulations or assets faster without slowing down the main workflow.
GPU Technologies Impacting 3D Modeling
The following GPU innovations are valuable for 3D modeling, and you should consider GPUs that offer them:
Real-Time Ray Tracing
Real-time ray tracing enables the simulation of realistic lighting conditions by tracing the path of light as pixels in an image plane, significantly improving visual realism. This technology allows 3D artists to render reflections, refractions, and shadows dynamically, enhancing the depiction of lifelike environments. With GPUs like NVIDIA’s RTX series, real-time ray tracing becomes accessible, allowing designers to visualize and adjust scenes in real-time.
AI-Accelerated Features
AI-accelerated features leverage machine learning to optimize and enhance 3D modeling processes. GPUs equipped with AI capabilities, such as NVIDIA’s Tensor Cores, enable functions like denoising and upscaling, which improve render quality while reducing computational demands. These advancements allow for smarter workflows, such as automated texture generation or predictive modeling.
Virtual Reality Support
GPUs that support virtual reality (VR) provide the computational power necessary to create immersive 3D environments. VR in 3D modeling allows designers to interact with models in a lifelike spatial context. High refresh rates and low latency are critical for VR applications, which modern GPUs deliver, ensuring smooth and realistic virtual interactions crucial for industries ranging from architecture to games development.
5 Best Practices for Optimizing 3D Modeling Performance with GPUs
1. Keep Drivers Updated
Keeping GPU drivers updated is essential for optimal performance and stability in 3D modeling applications. Manufacturers release driver updates to enhance compatibility with software, fix bugs, and improve hardware performance. Regularly updating drivers ensures the GPU can leverage the latest technological advancements and features.
However, it’s important to ensure updates are compatible with all software used in the workflow, as some updates may introduce issues with older applications.
2. Optimize Software Settings
Optimizing software settings can significantly impact GPU performance in 3D modeling tasks. Adjusting rendering preferences, such as enabling GPU acceleration and adjusting anti-aliasing or shadow quality, can improve efficiency and maintain desired output quality. Most 3D applications offer configuration options to balance performance with visual fidelity.
Profile management allows users to save preferred settings for different tasks or projects, simplifying future adjustments.
3. Manage Power Consumption and Heat
Managing power consumption and heat is crucial for maintaining GPU performance and longevity. High-performance GPUs can generate significant heat, impacting stability and lifespan. Implementing effective cooling solutions, such as high-quality fans or liquid cooling systems, helps maintain optimal temperatures during extended use.
Software tools for monitoring GPU temperature and adjusting power settings can assist in managing energy use, particularly in mobile workstations.
4. Utilize Multiple GPUs Effectively
Using multiple GPUs can significantly enhance rendering speed and computational capacity, but it requires careful configuration to achieve optimal results. Ensure software supports multi-GPU setups, as not all applications can effectively leverage additional GPUs. Technologies like NVIDIA NVLink enable better communication between GPUs, improving resource sharing and performance.
Balancing workloads across GPUs and configuring drivers and settings appropriately helps maximize the benefits of a multi-GPU system.
5. Consider GPU Hosting
GPU hosting services provide remote access to high-performance GPUs, offering a cost-effective solution for handling demanding 3D modeling tasks without investing in expensive hardware. These services enable scalability, allowing users to access additional resources as needed and pay only for what they use.
By offloading processing to cloud GPUs, hosting services also reduce the need for in-house maintenance and energy consumption.
Next-Gen Dedicated GPU Servers from Atlantic.Net, Accelerated by NVIDIA
Experience unparalleled performance with dedicated cloud servers equipped with the revolutionary NVIDIA accelerated computing platform.
Choose from the NVIDIA L40S GPU and NVIDIA H100 NVL to unleash the full potential of your generative artificial intelligence (AI) workloads, train large language models (LLMs), and harness natural language processing (NLP) in real time.
High-performance GPUs are superb at scientific research, 3D graphics and rendering, medical imaging, climate modeling, fraud detection, financial modeling, and advanced video processing.
Learn more about Atlantic.net GPU server hosting.
### The Best GPUs for Scientific Research
The Best GPUs for Scientific Research
Graphics processing units (GPUs) are used extensively in scientific computing. They provide the power to perform complex calculations and processor-intensive tasks like training machine learning models.
Adding virtually any GPU will deliver enhanced computing capabilities to support scientific research. However, the characteristics of a specific graphics processing unit may make it more suitable for handling the large datasets and complex calculations required to run scientific applications effectively.
Why Graphics Processing Units Are Used in Scientific Computing
The scientific community utilizes GPUs to provide additional computing power that is unavailable from standard central processing units (CPUs). CPUs are excellent at processing the sequential instructions traditionally used in general computer programming, but GPUs are capable of efficiently processing multiple instructions simultaneously to streamline many scientific computing tasks
Several factors make GPUs the correct type of processor for scientific computing. GPUs are typically used along with a CPU. The following are the most important reasons for deploying the computing power of GPUs to augment or replace a CPU.
Parallel processing capabilities
GPUs are constructed with up to thousands of small processing cores. Unlike CPU cores, which process instructions sequentially, GPU cores can operate on multiple tasks simultaneously. The parallelism provided by GPUs is essential for performing simulations efficiently, optimizing matrix operations, and training deep learning applications.
High throughput and enhanced performance
Manufacturers design GPUs with fast memory bandwidth and large memory capacity to limit slow I/O operations. This native memory, combined with a GPU's parallel processing power, provides high throughput and enhanced performance. Large-scale calculations necessary for complex simulations can often be parallelized and run more efficiently with GPUs.
Scalability
Scientific research addresses complex and large-scale problems that traditional CPUs cannot solve. The scalability available with GPUs enables scientific computing to utilize systems powered by multiple processors for better speed and performance. Cloud providers offer customers dynamically scalable GPU environments to handle intensive computations and large volumes of data.
Energy efficiency and cost-effectiveness
A GPU can execute more operations than a CPU while consuming the same amount of power. This feature makes GPUs a logical and economically sound choice for the processing demands of scientific computing. A single GPU can typically outperform a CPU cluster, providing a cost-effective method of accelerating scientific processing.
Software support
Developers can create code optimized for GPU hardware due to the availability of CUDA libraries and other software development platforms like OpenCL. Software for specialized scientific fields such as physics or molecular dynamics is often tailored to take advantage of GPU acceleration.
Scientific Applications Leveraging the Computing Power of GPUs
The scientific community relies on the processing power and high-performance computing provided by graphical processing units for a wide variety of tasks and applications across numerous fields. The following are examples from some of the scientific disciplines utilizing GPU acceleration to support and streamline research.
Machine learning and deep learning
Researchers train machine learning and deep learning models using very large datasets. GPUs can process this large volume of data more efficiently than CPUs and are an integral part of the growth of artificial intelligence applications. Development frameworks like TensorFlow are optimized for GPUs and can significantly reduce the time required to train deep neural networks.
Reinforcement learning algorithms used for training deep learning models run faster on GPUs. GPU acceleration is vital for training complex applications leveraging natural language processing (NLP) for speech and image recognition. The parallelism provided by GPUs is essential for the continued development of machine and deep learning applications.
Simulations across multiple fields
GPUs' speed, parallelism, and processing power are essential for running complex simulations in various scientific fields.
Simulations are used to model complex systems and promote research in physics and engineering. Research disciplines leveraging GPU-accelerated simulations include molecular dynamics and computational fluid dynamics.
Astrophysical simulations allow scientists to study complex phenomena like black hole behavior and star formation.
Quantum mechanics uses Monte Carlo simulations to study molecular systems to improve material and drug design.
Biomedical research utilizes simulations for protein structure prediction to study diseases and develop new drugs.
Healthcare and medical imaging
The healthcare field in general and medical imaging specifically process large volumes of data to perform research and diagnostics. Medical research benefits from the speed of GPU-accelerated applications, which allow timely and accurate data analysis.
GPUs support deep learning models that perform computer-aided diagnosis and automatically detect abnormal conditions such as tumors and fractures. The models minimize diagnostic time and improve patient care. Healthcare providers also use deep learning models running on GPUs for predictive analytics regarding disease progression and patient outcomes.
Genomics requires the processing of massive datasets to identify and study DNA sequences. GPUs dramatically speed up this processing, allowing for more efficient and relevant research.
Meteorology and climate modeling
Meteorology and climate modeling study highly complex systems that can be significantly affected by slight variations in conditions. GPUs accelerate the simulations used to forecast weather and storm patterns. Large datasets are used for climate models so researchers can evaluate the long-term effects of climate change.
Data science and analytics
Data scientists use GPUs to facilitate big data analytics by processing large volumes of information. Analytics platforms like Hadoop have GPU-accelerated versions that take advantage of advanced hardware to simultaneously process data from multiple sources. Big data is the foundation of scientific visualizations across a wide range of fields.
Characteristics of the Best GPUs for Scientific Computing
GPUs are complex entities designed to deliver the power required by high-performance computing. Leading manufacturers like NVIDIA, AMD, and Intel differentiate their products with proprietary engineering and distinct architectures. Different GPU models address the needs of distinct user groups, such as gamers, business people, and scientists.
The following are some characteristics of a graphics processing unit that make it a good choice to handle scientific computing requirements.
Parallel processing capabilities
Parallel processing is essential for many scientific computing applications. Parallelism enables the processing of large data sets or running molecular simulations to be performed more efficiently than with a CPU. In some cases, parallel processing offers the only method of obtaining timely results from scientific calculations.
GPUs with many cores are better equipped to manage simultaneous operations and improve processing speed. Generally, more cores equate to enhanced parallelism. However, GPU manufacturers' architectures may make it difficult to directly compare models based on their number of cores. Users engaged in scientific computing should look to maximize the number of cores when choosing a GPU.
GPU memory
High GPU memory bandwidth and memory capacity are essential for processing scientific workloads. Fast memory is critical to support the intensive computations required by simulations such as molecular dynamics or climate modeling. Scientific applications often rely on quickly and efficiently processing massive datasets. Data transfer speed can be dramatically affected by failing to address a GPU's memory requirements.
Memory bandwidth
Memory bandwidth is measured in gigabytes per second (GB/s). Higher bandwidth minimizes bottlenecks and enables data to be efficiently moved in and out of memory. GPUs for scientific workloads should offer high-bandwidth memory such as GDDR6, HBM2, or HBM3. These technologies provide bandwidths ranging from several hundred to thousands of GB/s.
Memory capacity
Memory capacity is instrumental in supporting the data parallelism many scientific workloads require. Higher GPU memory capacity allows large datasets to be processed more efficiently and reduces time-consuming I/O operations. GPUs should have a minimum of 24 GB of internal memory for deep learning, medical research, or other scientific endeavors.
GPU acceleration
GPU acceleration benefits many types of scientific computing applications. Tensor cores are specialized hardware units designed to accelerate matrix operations. NVIDIA developed and introduced tensor cores and features them in their high-end GPUs. These cores are responsible for the speed demonstrated by GPU-accelerated applications.
GPUs equipped with tensor cores are excellent at scientific computing applications relying on matrix-heavy calculations, such as machine learning workflows, training neural networks, and supporting complex simulations. Scientific groups working in these disciplines should consider taking advantage of the GPU acceleration that is possible with tensor cores.
Double precision support
Many types of scientific applications require the accuracy of double-precision floating-point arithmetic (FP64). Fields like medical research, scientific visualization, and climate modeling benefit from the enhanced accuracy provided by FP64. All GPUs offer single-precision accuracy (FP32), but GPUs designed for the consumer market may offer weak FP64 support.
FP32 calculations are typically faster than FP64 but may not provide the accuracy necessary for a specific workload. GPUs optimized for FP64 performance should be utilized for scientific computing tasks that perform intensive computations like differential equations. NVIDIA and AMD have developed GPU models that optimize FP64 performance.
Power efficiency
Scientific computing requires power efficiency and effective thermal management. Workloads like producing complex simulations or computationally intensive calculations can run for long periods of time. A power-efficient GPU improves system stability and minimizes heat generation.
Excessive heat can damage hardware and negatively impact system performance. Groups with high performance computing tasks should opt for a modern GPU with native power management features. Additional air or liquid cooling solutions may be necessary for multi-GPU configurations.
Scalability
Taking advantage of multi-GPU configurations can improve the performance of scientific computing applications. Complex simulations or tasks involving massive datasets may need more power or memory than a single GPU can provide. Deploying multiple GPUs can substantially reduce the training time of deep learning models.
A multi-GPU environment allows more than one GPU to communicate at high speeds for improved system performance. NVIDIA NVLink and the AMD Infinity Fabric support communication between GPU nodes. Scientific computing users should look for scalable GPU models that support distributed environments.
Compatible software environment
Scientific computing groups should look for GPUs that integrate with an existing software environment or framework. Familiarity with the framework eliminates a learning curve and streamlines productivity. Teams should ensure the GPUs they select are compatible with their current environment.
CUDA from NVIDIA is the leading framework for scientific and high-performance computing. ADM's ROCm framework is similar to NVIDIA's CUDA libraries and is gaining popularity for artificial intelligence and scientific applications. Development frameworks like OpenMP and TensorFlow have built-in GPU support.
The Best GPU Models for Scientific Computing
GPUs for scientific computing should demonstrate many or all previously discussed characteristics. GPU manufacturers are continuously refining and introducing cutting-edge technology to their products. The best GPU for a specific scientific application today may be surpassed by tomorrow's innovations.
Considering those issues, the following are some of the best GPUs for scientific computing. They are generally the most powerful and advanced devices available from the major GPU manufacturers.
NVIDIA GPUs for scientific computing
NVIDIA produces multiple GPUs with the characteristics that make them an excellent choice for scientific computing.
NVIDIA H100 Tensor Core GPU
The H100 Tensor Core GPU is designed for data center use and is built using the Hopper architecture. The device has up to 120 GB of high-speed HBM3 memory and 14,592 CUDA cores to support cutting-edge parallel processing. The H100 supports advanced AI workloads and scientific simulations with 30 TFLOPS performance for FP64 precision calculations.
NVIDIA RTX 6000 Ada Generation
This GPU is designed to power AI workflows from desktop workstations. It is built on the NVIDIA Ada Lovelace architecture and combines 142 third-generation RT Cores, 568 fourth-generation Tensor Cores, and 18,176 CUDA cores with 48GB of graphics memory. The GPU delivers excellent graphics, AI, and compute performance to address a wide range of scientific applications.
NVIDIA L40
The NVIDIA L40 features 48 GB of high-speed GDDR6 memory and has 18,176 CUDA cores and 58 Tensor cores to handle scientific applications requiring parallel processing. The L40 is a versatile GPU capable of powering AI and machine learning workflows for business and scientific users.
AMD GPUs for scientific computing
AMD's GPUs utilize a different architecture than NVIDIA. The devices provide parallelism with stream processors rather than CUDA cores. The following models address scientific computing requirements.
AMD Instinct MI250X
The Instinct MI250X accelerator is designed to supercharge high-performance computing, AI, and scientific workloads. It provides advanced parallelism with 14,080 stream processors (cores) and 128 GB of HBM2 memory. The GPU excels at double-precision math with 220 compute units.
AMD Instinct MI300
The Instinct MI300 series accelerators can handle the most demanding scientific workloads. With 304 compute units and up to 256 GB of HBM3 memory, they are equally well-suited for AI and HPC workloads. Memory bandwidth of up to 6 TB/s provides lightning-fast performance for data-intensive applications.
Atlantic.Net's Hosted NVIDIA GPU Solutions
Atlantic.Net's hosted NVIDIA GPU solutions offer customers versatile systems suitable for scientific computing. Customers can choose from a system built around the NVIDIA H100 NVL GPU or the NVIDIA L40S GPU to power AI and scientific workloads without building an on-premises infrastructure.
Contact us today to start supercharging your scientific computing applications.
### How to Deploy a Machine Learning Model Using Flask on Atlantic.Net GPU
Deploying a machine learning model is a crucial step to making it accessible to end-users. Flask, a lightweight web framework for Python, is popular for deploying machine learning models due to its simplicity and flexibility. When deploying on an Ubuntu GPU server, you can leverage the power of GPUs to accelerate inference, especially for deep learning models.
In this guide, we’ll walk through the steps to deploy a machine learning model using Flask on an Ubuntu GPU server.
Prerequisites
Before starting, ensure you have the following:
An Ubuntu 22.04 Cloud GPU Server.
Latest CUDA Toolkit and cuDNN Installed.
Root or sudo privileges.
Step 1: Update and Install System Dependencies
Before starting, it’s essential to update our Ubuntu server to ensure we’re working with the latest security patches and package versions.
apt update -y
apt upgrade -y
Next, install Python and other dependencies.
apt install python3 python3-pip python3-virtualenv -y
Step 2: Set Up a Virtual Environment
Using a virtual environment helps isolate your project’s dependencies, preventing potential version conflicts with other projects or system Python packages.
First, create a Python virtual environment named ml-env:
python3 -m venv ml-env
Next, activate the virtual environment.
source ml-env/bin/activate
Next, upgrade pip to the latest version.
pip install --upgrade pip
Then install Flask and other Python libraries.
pip install flask gunicorn torch torchvision tensorflow numpy pandas
Step 3: Write and Train a Machine Learning Model
Now, let’s create a script called train_model.py that sets up a simple neural network using PyTorch, trains it on dummy data, and saves the model weights.
nano train_model.py
Add the following code:
import torch
import torch.nn as nn
import torch.optim as optim
class SimpleModel(nn.Module):
def __init__(self):
super(SimpleModel, self).__init__()
self.fc1 = nn.Linear(4, 64)
self.fc2 = nn.Linear(64, 64)
self.fc3 = nn.Linear(64, 1)
def forward(self, x):
x = torch.relu(self.fc1(x))
x = torch.relu(self.fc2(x))
# Using sigmoid for a binary classification output
x = torch.sigmoid(self.fc3(x))
return x
# Create the model
model = SimpleModel()
# Define a binary cross-entropy loss and Adam optimizer
criterion = nn.BCELoss()
optimizer = optim.Adam(model.parameters(), lr=0.001)
# Dummy training data:
data = torch.rand(100, 4)
labels = torch.randint(0, 2, (100, 1), dtype=torch.float32)
# Train for 10 epochs
for epoch in range(10):
optimizer.zero_grad()
outputs = model(data)
loss = criterion(outputs, labels)
loss.backward()
optimizer.step()
if (epoch+1) % 2 == 0:
print(f"Epoch [{epoch+1}/10], Loss: {loss.item():.4f}")
# Switch model to evaluation mode (optional but good practice)
model.eval()
# Save the model's state dict only (recommended approach)
torch.save(model.state_dict(), "model_weights.pth")
print("Model weights saved to 'model_weights.pth'")
This code defines a simple feed-forward neural network using PyTorch, trains it on randomly generated data for 10 epochs using binary cross-entropy loss and the Adam optimizer, and then switches the model to evaluation mode. Finally, it saves the trained model parameters (state dict) to the file model_weights.pth.
Run the above script.
python3 train_model.py
Output:
Epoch [2/10], Loss: 0.6822
Epoch [4/10], Loss: 0.6763
Epoch [6/10], Loss: 0.6745
Epoch [8/10], Loss: 0.6731
Epoch [10/10], Loss: 0.6718
Model weights saved to 'model_weights.pth'
Step 4: Create a Flask API for Model Inference
Now, create a app.py to loads the same PyTorch model architecture defined earlier, loads the trained model’s weights and creates an endpoint for inference.
nano app.py
Add the following code:
import torch
import torch.nn as nn
import numpy as np
from flask import Flask, request, jsonify
app = Flask(__name__)
###############################################
# 1. Define the EXACT SAME PyTorch architecture
###############################################
class SimpleModel(nn.Module):
def __init__(self):
super(SimpleModel, self).__init__()
# Must match your training script's layers:
self.fc1 = nn.Linear(4, 64)
self.fc2 = nn.Linear(64, 64)
self.fc3 = nn.Linear(64, 1) # Single output (e.g. for binary classification)
def forward(self, x):
x = torch.relu(self.fc1(x))
x = torch.relu(self.fc2(x))
x = torch.sigmoid(self.fc3(x))
return x
###########################################################
# 2. Load the PyTorch model state dict (must match architecture)
###########################################################
pytorch_model = SimpleModel()
pytorch_model.load_state_dict(torch.load("model_weights.pth"))
pytorch_model.eval()
###########################################################
# 3. Flask endpoint for PyTorch inference
###########################################################
@app.route("/predict", methods=["POST"])
def predict():
data = request.get_json()
# Convert input to a numpy array of shape [1, 4] since the model expects 4 features
input_data = np.array(data["input"]).reshape(1, 4)
# PyTorch inference
tensor_input = torch.tensor(input_data, dtype=torch.float32)
pytorch_output = pytorch_model(tensor_input).detach().numpy().tolist()
return jsonify({
"pytorch": pytorch_output
})
if __name__ == "__main__":
app.run(host="0.0.0.0", port=5000, debug=True)
This code uses PyTorch, NumPy, and Flask to define a simple neural network model, load pre-trained weights, and serve predictions through a /predict endpoint. The endpoint accepts JSON input, converts it to a PyTorch tensor, runs inference, and returns the model’s output as JSON.
Step 5: Run the Flask App
Now, run your Flask app with the following command:
python3 app.py
You will see the following output:
* Serving Flask app 'app'
* Debug mode: on
WARNING: This is a development server. Do not use it in a production deployment. Use a production WSGI server instead.
* Running on all addresses (0.0.0.0)
* Running on http://127.0.0.1:5000
* Running on http://your-server-ip:5000
Press CTRL+C to quit
* Restarting with stat
* Debugger is active!
* Debugger PIN: 125-332-575
Step 6: Test the Flask Application
Your Flask app is started and running on port 5000. Now, open another terminal and test the API using the curl command:
curl -X POST -H "Content-Type: application/json" -d '{"input":[0.1, 0.2, 0.3, 0.4]}' http://localhost:5000/predict
You should receive a JSON response similar to:
{
"pytorch": [
[
0.49628227949142456
]
]
}
This value represents the model’s prediction for a binary classification probability (between 0.0 and 1.0).
Conclusion
You have successfully set up a GPU-enabled Ubuntu server, trained a simple PyTorch model on dummy data, and created a Flask API to serve predictions. This foundational framework can be adapted to more complex architectures or real-world datasets by integrating additional data pipelines and container orchestration tools.
### How to Build a Question Answering System on Atlantic.Net Cloud GPU Server
Question Answering (QA) systems transform how users interact with data, allowing them to query information in natural language and get concise, direct answers. Building a QA system has become more straightforward with the wide availability of advanced NLP models and the growing popularity of frameworks like Hugging Face Transformers and OpenAI GPT.
This guide will show you how to set up and build a QA system on an Ubuntu GPU server.
Prerequisites
Before starting, ensure you have the following:
An Ubuntu 24.04 Cloud GPU Server.
CUDA Toolkit and cuDNN Installed.
Root or sudo privileges.
Step 1: Install Required Packages
Before starting, it is essential to update all system packages to the latest version.
apt update
apt upgrade
Next, install Python with all required libraries.
apt install python3-full python3-virtualenv -y
Step 2: Create a Python Virtual Environment
A virtual environment isolates your project's dependencies, ensuring that installed packages don't interfere with other projects or system-wide packages.
Let's create a new virtual environment for your project.
python3 -m venv venv
Activate your virtual environment.
source venv/bin/activate
Step 3: Install PyTorch with CUDA Support
PyTorch is a deep learning framework for model operations. Installing it with CUDA support allows the GPU to be utilized, significantly accelerating computations.
pip install torch torchvision torchaudio --index-url https://download.pytorch.org/whl/cu118
Next, install additional libraries for building and deploying the QA system.
pip install transformers datasets fastapi uvicorn
transformers: Provides access to pre-trained models and tools from Hugging Face.
datasets: Offers a collection of datasets and tools for model evaluation.
fastapi: A modern web framework for building APIs with Python.
uvicorn: A lightning-fast ASGI server for serving FastAPI applications.
Connect to the Python shell and verify that PyTorch is correctly installed.
python3
>>> import torch
>>> print(torch.__version__)
Output:
2.6.0+cu118
Confirm that CUDA is available for GPU acceleration.
>>> print(torch.cuda.is_available())
Output:
True
Press CTRL+D to exit from the Python shell
Step 4: Create a Basic QA Pipeline
In this step, we'll set up a basic question-answering pipeline using a pre-trained model to understand the foundational workings before any customization.
Create a Python script that utilizes a pre-trained model to answer questions based on a provided context.
nano qa_pipeline.py
Add the following code:
from transformers import pipeline
def main():
# Initialize QA pipeline with a DistilBERT model fine-tuned on SQuAD
qa_pipeline = pipeline("question-answering", model="distilbert-base-uncased-distilled-squad")
context = (
"Ubuntu is a Linux distribution based on Debian and composed mostly of free and open-source software. "
"Ubuntu is officially released in three editions: Desktop, Server, and Core for IoT devices and robots."
)
question = "What is Ubuntu based on?"
result = qa_pipeline({"context": context, "question": question})
print("Answer:", result["answer"])
print("Score:", result["score"])
if __name__ == "__main__":
main()
This script uses the Hugging Face pipeline to load a pre-trained QA model and processes a sample context and question.
Now, run the above script.
python3 qa_pipeline.py
This will display the model's answer and its confidence score.
Answer: Debian
Score: 0.9923
Explanation:
Answer: The model identifies "Debian" as the answer to the question.
Score: A confidence score (ranging from 0 to 1) indicating the model's certainty. A score of 0.9923 signifies high confidence.
Step 5: Fine-Tune the Model
Fine-tuning tailors the pre-trained model to better suit our specific dataset, enhancing its performance on domain-specific questions.
Create a script to fine-tune the model using the SQuAD dataset, a widely used benchmark for QA tasks.
nano fine_tuning.py
Add the following code.
# fine_tuning.py
from datasets import load_dataset
from transformers import AutoTokenizer, AutoModelForQuestionAnswering, TrainingArguments, Trainer
def prepare_train_features(examples):
# 1. Tokenize question + context
tokenized_examples = tokenizer(
examples["question"],
examples["context"],
truncation=True,
max_length=384,
padding="max_length",
return_offsets_mapping=True
)
# We'll create start_positions and end_positions for each example
start_positions = []
end_positions = []
# Loop over each example in the batch
for i, offsets in enumerate(tokenized_examples["offset_mapping"]):
# Each 'examples["answers"]' is a list of dict for batched data
answer = examples["answers"][i]
# We take the first answer (SQuAD usually has one per example)
answer_start_char = answer["answer_start"][0]
answer_text = answer["text"][0]
answer_end_char = answer_start_char + len(answer_text)
# Initialize
start_token_idx = None
end_token_idx = None
# Find start/end token indices
for idx, (start, end) in enumerate(offsets):
if start <= answer_start_char < end:
start_token_idx = idx
if start < answer_end_char <= end:
end_token_idx = idx
break
# Fallback in case we don't find a matching token
if start_token_idx is None:
start_token_idx = 0
if end_token_idx is None:
end_token_idx = len(offsets) - 1
start_positions.append(start_token_idx)
end_positions.append(end_token_idx)
tokenized_examples["start_positions"] = start_positions
tokenized_examples["end_positions"] = end_positions
# Remove offset mapping to save memory
tokenized_examples.pop("offset_mapping")
return tokenized_examples
def main():
# 1. Load SQuAD
squad = load_dataset("squad")
# 2. Set up model/tokenizer
model_name = "distilbert-base-uncased"
global tokenizer
tokenizer = AutoTokenizer.from_pretrained(model_name)
model = AutoModelForQuestionAnswering.from_pretrained(model_name)
# 3. Preprocess train/validation
squad_encoded = squad.map(prepare_train_features, batched=True)
# 4. Define training arguments
training_args = TrainingArguments(
output_dir="./qa_model",
per_device_train_batch_size=8,
per_device_eval_batch_size=8,
num_train_epochs=2, # adjust as needed
eval_strategy="epoch", # replaced `evaluation_strategy` with `eval_strategy`
save_steps=1000,
save_total_limit=1,
)
# 5. Initialize Trainer
trainer = Trainer(
model=model,
args=training_args,
train_dataset=squad_encoded["train"],
eval_dataset=squad_encoded["validation"],
)
# 6. Train
trainer.train()
# 7. Save final model
trainer.save_model("./qa_model")
print("Fine-tuning complete. Model saved to ./qa_model")
if __name__ == "__main__":
main()
This script loads the SQuAD dataset, preprocesses the data, and fine-tunes the model.
Now, run the script to commence the fine-tuning process.
python3 fine_tuning.py
During training, you'll observe outputs indicating the model's progress, such as:
You should probably TRAIN this model on a down-stream task to be able to use it for predictions and inference.
Map: 100%|███████████████████████████████████████████████████████████████████████████████████████████████████████████████| 87599/87599 [00:24<00:00, 3514.81 examples/s]
Map: 100%|███████████████████████████████████████████████████████████████████████████████████████████████████████████████| 10570/10570 [00:03<00:00, 3419.28 examples/s]
{'loss': 3.2628, 'grad_norm': 23.89510726928711, 'learning_rate': 4.8858447488584476e-05, 'epoch': 0.05}
{'loss': 2.3261, 'grad_norm': 13.938529968261719, 'learning_rate': 4.7716894977168955e-05, 'epoch': 0.09}
{'loss': 2.0285, 'grad_norm': 20.18623161315918, 'learning_rate': 4.657534246575342e-05, 'epoch': 0.14}
{'loss': 1.8877, 'grad_norm': 17.599531173706055, 'learning_rate': 4.54337899543379e-05, 'epoch': 0.18}
{'loss': 1.8392, 'grad_norm': 20.058273315429688, 'learning_rate': 4.4292237442922375e-05, 'epoch': 0.23}
{'loss': 1.7229, 'grad_norm': 20.78485870361328, 'learning_rate': 4.3150684931506855e-05, 'epoch': 0.27}
{'loss': 1.6989, 'grad_norm': 29.019317626953125, 'learning_rate': 4.200913242009132e-05, 'epoch': 0.32}
{'loss': 1.6686, 'grad_norm': 20.27025604248047, 'learning_rate': 4.08675799086758e-05, 'epoch': 0.37}
{'loss': 1.6013, 'grad_norm': 17.87761878967285, 'learning_rate': 3.9726027397260274e-05, 'epoch': 0.41}
{'loss': 1.6066, 'grad_norm': 25.986677169799805, 'learning_rate': 3.8584474885844754e-05, 'epoch': 0.46}
{'loss': 1.5666, 'grad_norm': 21.410463333129883, 'learning_rate': 3.744292237442922e-05, 'epoch': 0.5}
{'loss': 1.6172, 'grad_norm': 22.285802841186523, 'learning_rate': 3.63013698630137e-05, 'epoch': 0.55}
{'loss': 1.5496, 'grad_norm': 22.68842315673828, 'learning_rate': 3.5159817351598174e-05, 'epoch': 0.59}
Fine-tuning customizes a pre-trained model to perform better on a specific task by training it on a relevant dataset. In this case, fine-tuning the DistilBERT model on the SQuAD dataset enhances its ability to answer questions accurately within given contexts.
Step 6: Update the qa_pipeline.py Script to Use the Fine-Tuned Model
Open the existing qa_pipeline.py script:
nano qa_pipeline.py
Update the script with the following code:
from transformers import pipeline, AutoModelForQuestionAnswering, AutoTokenizer
model_path = "./qa_model"
tokenizer = AutoTokenizer.from_pretrained(model_path)
model = AutoModelForQuestionAnswering.from_pretrained(model_path)
qa_pipeline = pipeline("question-answering", model=model, tokenizer=tokenizer)
context = "Hugging Face is based in New York and Paris."
question = "Where is Hugging Face based?"
result = qa_pipeline({"context": context, "question": question})
print(result)
# e.g., {'score': 0.95, 'start': 17, 'end': 25, 'answer': 'New York'}
Save and close the file.
Step 7: Deploy the Fine-Tuned Model with FastAPI
After fine-tuning our model, the next step is to deploy it so that it can serve real-time predictions. FastAPI is an excellent choice for this purpose due to its high performance and ease of use.
Create a Python script named app.py to set up our FastAPI application.
nano app.py
Add the following code.
# app.py
from fastapi import FastAPI
from pydantic import BaseModel
from transformers import pipeline
app = FastAPI()
# Load a QA model (pretrained or your fine-tuned one)
qa_pipeline = pipeline("question-answering", model="distilbert-base-uncased-distilled-squad")
class QAPayload(BaseModel):
context: str
question: str
@app.post("/qa")
def get_answer(payload: QAPayload):
result = qa_pipeline({"context": payload.context, "question": payload.question})
return {"answer": result["answer"], "score": result["score"]}
This script initializes the FastAPI app and sets up an endpoint for our QA model.
Start the FastAPI server using Uvicorn.
uvicorn app:app --host 0.0.0.0 --port 8000
Output:
Device set to use cuda:0
INFO: Started server process [14449]
INFO: Waiting for application startup.
INFO: Application startup complete.
INFO: Uvicorn running on http://0.0.0.0:8000 (Press CTRL+C to quit)
The above command starts the FastAPI application, making it accessible at http://0.0.0.0:8000.
Step 9: Test the FastAPI Application
Testing is crucial to ensure that our API functions as expected. We'll use the curl utility for manual testing.
Open another terminal and send a POST request to our /qa endpoint using curl.
curl -X POST "http://localhost:8000/qa" -H "Content-Type: application/json" -d '{ "context": "Ubuntu is a Linux distribution based on Debian", "question": "What is Ubuntu based on?" }'
Output:
{
"answer": "Debian",
"score": 0.9965217709541321
}
The model identifies "Debian" as the answer to the question. The confidence score (e.g., 0.9965) indicates the model's certainty regarding its answer. A score close to 1.0 signifies high confidence.
Conclusion
In this guide, we've walked through building a question-answering (QA) system on an Atlantic.Net Cloud GPU server, utilizing FastAPI, Hugging Face Transformers, and PyTorch. We began by setting up the necessary environment, installing essential packages, and verifying the installation to ensure our system was ready for development.
### AI Generated Images with OpenJourney on Atlantic.Net Cloud GPU
Artificial Intelligence (AI) has significantly transformed the creative landscape, enabling the generation of high-quality, lifelike images through models like OpenJourney. Users can efficiently produce AI-generated artwork by leveraging the computational power of cloud-based GPU servers, such as those offered by Atlantic.Net.
In this guide, we will set up an environment on an Atlantic.Net Cloud GPU server to generate images using the OpenJourney model.
Prerequisites
Before proceeding, ensure you have the following:
An Atlantic.Net Cloud GPU server running Ubuntu 24.04, equipped with an NVIDIA A100 GPU with at least 20 GB of GPU RAM.
Root or sudo privileges.
Step 1: Install NVIDIA CUDA Toolkit
The CUDA Toolkit is essential for GPU acceleration, providing the necessary libraries and tools for running computations on NVIDIA GPUs.
Download and set up the CUDA repository pin.
wget https://developer.download.nvidia.com/compute/cuda/repos/ubuntu2404/x86_64/cuda-ubuntu2404.pin
mv cuda-ubuntu2404.pin /etc/apt/preferences.d/cuda-repository-pin-600
Download and install the CUDA repository package.
wget https://developer.download.nvidia.com/compute/cuda/12.8.0/local_installers/cuda-repo-ubuntu2404-12-8-local_12.8.0-570.86.10-1_amd64.deb
dpkg -i cuda-repo-ubuntu2404-12-8-local_12.8.0-570.86.10-1_amd64.deb
cp /var/cuda-repo-ubuntu2404-12-8-local/cuda-*-keyring.gpg /usr/share/keyrings/
Update the package lists and install the CUDA Toolkit.
apt-get update
apt-get -y install cuda-toolkit-12-8
Configure environment variables to locate the CUDA executables and libraries.
echo "export PATH=/usr/local/cuda-12.8/bin${PATH:+:${PATH}}" >> ~/.bashrc
Include the CUDA library directory in the LD_LIBRARY_PATH.
echo "export LD_LIBRARY_PATH=/usr/local/cuda-12.8/lib64${LD_LIBRARY_PATH:+:${LD_LIBRARY_PATH}}" >> ~/.bashrc
Activate the updated environment variables.
source ~/.bashrc
Verify that the GPU is recognized and that the CUDA compiler is installed correctly.
nvidia-smi
Output:
Thu Jan 30 11:30:08 2025
+-----------------------------------------------------------------------------------------+
| NVIDIA-SMI 550.90.07 Driver Version: 550.90.07 CUDA Version: 12.4 |
|-----------------------------------------+------------------------+----------------------+
| GPU Name Persistence-M | Bus-Id Disp.A | Volatile Uncorr. ECC |
| Fan Temp Perf Pwr:Usage/Cap | Memory-Usage | GPU-Util Compute M. |
| | | MIG M. |
|=========================================+========================+======================|
| 0 GRID A100D-20C On | 00000000:06:00.0 Off | 0 |
| N/A N/A P0 N/A / N/A | 1MiB / 20480MiB | 0% Default |
| | | Disabled |
+-----------------------------------------+------------------------+----------------------+
+-----------------------------------------------------------------------------------------+
| Processes: |
| GPU GI CI PID Type Process name GPU Memory |
| ID ID Usage |
|=========================================================================================|
| No running processes found |
+-----------------------------------------------------------------------------------------+
Step 2: Install NVIDIA cuDNN Library
The cuDNN library is a GPU-accelerated library for deep neural networks, enhancing the performance of deep learning frameworks.
Download and install the cuDNN repository package.
wget https://developer.download.nvidia.com/compute/cudnn/9.7.0/local_installers/cudnn-local-repo-ubuntu2404-9.7.0_1.0-1_amd64.deb
dpkg -i cudnn-local-repo-ubuntu2404-9.7.0_1.0-1_amd64.deb
cp /var/cudnn-local-repo-ubuntu2404-9.7.0/cudnn-*-keyring.gpg /usr/share/keyrings/
Update the package lists and install cuDNN.
apt-get update
apt-get -y install cudnn
Check the installed version of cuDNN to ensure it's correctly set up.
cat /usr/include/cudnn_version.h | grep CUDNN_MAJOR -A 2
Output:
#define CUDNN_MAJOR 9
#define CUDNN_MINOR 7
#define CUDNN_PATCHLEVEL 0
--
#define CUDNN_VERSION (CUDNN_MAJOR * 10000 + CUDNN_MINOR * 100 + CUDNN_PATCHLEVEL)
/* cannot use constexpr here since this is a C-only file */
Step 3: Set Up Python Environment
A dedicated Python environment ensures that dependencies for your project are managed efficiently without conflicts.
Install Python 3 and create a virtual environment.
apt install python3-full python3-virtualenv
python3 -m venv venv
source venv/bin/activate
Upgrade pip and install Jupyter Notebook.
pip install --upgrade pip
pip install notebook
Launch the Jupyter Notebook.
jupyter notebook --no-browser --port=8888 --ip=your-server-ip --allow-root
Output:
To access the server, open this file in a browser:
file:///root/.local/share/jupyter/runtime/jpserver-7131-open.html
Or copy and paste one of these URLs:
http://your-server-ip:8888/tree?token=46d4d0af7fd47802a59aa8dce159eafba688b17261592841
http://127.0.0.1:8888/tree?token=46d4d0af7fd47802a59aa8dce159eafba688b17261592841
[I 2025-01-30 11:13:06.976 ServerApp] Skipped non-installed server(s): bash-language-server, dockerfile-language-server-nodejs, javascript-typescript-langserver, jedi-language-server, julia-language-server, pyright, python-language-server, python-lsp-server, r-languageserver, sql-language-server, texlab, typescript-language-server, unified-language-server, vscode-css-languageserver-bin, vscode-html-languageserver-bin, vscode-json-languageserver-bin, yaml-language-server
Open your web browser and access the Jupyter Notebook using the URL http://your-server-ip:8888/tree?token=8e99e04461348b61490e1a51559a8be313840260787e7e17.
Click on File > New > Notebook. You will be asked to select the Kernel.
Select the "Python (GPU)" kernel and click Select to create a new notebook.
Step 4: Install Required Python Packages
To generate images using the OpenJourney model, you'll need to install several Python libraries that facilitate model loading, data processing, and result visualization. It's important to run these installation commands within your Jupyter Notebook to ensure the packages are available in that environment.
1. Install PyTorch and torchvision.
PyTorch is a deep learning framework, and torchvision provides access to popular datasets and model architectures.
!pip install torch torchvision --index-url https://download.pytorch.org/whl/cu118
2. Install the Hugging Face Transformers Library.
The transformers library provides general-purpose architectures for natural language understanding and generation. In this context, it supports the integration with the OpenJourney model.
!pip install transformers
3. Install the Diffusers Library:
The diffusers library is essential for working with diffusion models like OpenJourney, enabling efficient image generation.
!pip install diffusers
4. Install the Accelerate Library:
The accelerate library optimizes the performance of your models, particularly when utilizing GPU resources, ensuring faster computations.
!pip install accelerate
5. Install Matplotlib:
Matplotlib is a plotting library used for visualizing data. Here, it will help display the generated images within the Jupyter Notebook.
!pip install matplotlib
6. Install ipywidgets:
ipywidgets enhances the interactivity of Jupyter Notebooks, allowing for dynamic controls and interactive visualizations.
!pip install ipywidgets
Step 5: Generate Images Using OpenJourney
With the environment set up and the necessary packages installed, you can now generate images using the OpenJourney model. This process involves importing essential libraries, initializing the model, and creating images based on textual prompts.
1. Import the Required Libraries:
Begin by importing the necessary libraries into your Jupyter Notebook.
from diffusers import StableDiffusionPipeline
import torch
import matplotlib.pyplot as plt
2. Initialize the OpenJourney Model:
Set up the model to prepare it for image generation.
model_id = "prompthero/openjourney"
pipe = StableDiffusionPipeline.from_pretrained(model_id, torch_dtype=torch.float16)
pipe = pipe.to("cuda")
3. Generate an Image from a Text Prompt:
Create an image by providing a descriptive text prompt.
prompt = "green vulture with clouds in the background, mdjrny-v4 style"
images = pipe(prompt).images
4. Display the Generated Image:
Visualize the output within the Jupyter Notebook.
plt.imshow(images[0])
Removes the axis ticks and labels for a cleaner presentation.
plt.imshow(images[0])
plt.axis('off')
plt.show()
5. Save Generated Images
Specify the directory where the images will be stored.
save_directory = "/opt"
6. Iterate through the list of images and save each one.
for i, image in enumerate(images):
image.save(f"{save_directory}/image_{i}.png")
7. Generate Multiple Images:
Define the number of images and generate them with new prompts.
num_images = 5
prompt = ["blue vulture with clouds in the background, mdjrny-v4 style"] * num_images
image_list = pipe(prompt).images
for image in image_list:
plt.imshow(image)
plt.show()
This loop iterates over each image in image_list and displays it using Matplotlib:
Conclusion
Congratulations! You've successfully set up an Atlantic.Net Cloud GPU server environment to generate AI-driven images using the OpenJourney model. This process involved installing essential tools like the NVIDIA CUDA Toolkit and cuDNN library, configuring a Python environment with Jupyter Notebook, and utilizing the OpenJourney model to create and save images based on textual prompts.
### How to Use Vector Embeddings on Atlantic.Net Cloud GPU
In today's data-driven world, vector embeddings have become fundamental in machine learning applications, especially in natural language processing (NLP). Vector embeddings are used in various applications such as semantic search, sentiment analysis, and machine translation. They help capture the semantic meanings of sentences, thus enabling machines to perform tasks that require a deep understanding of human language. Atlantic.Net Cloud GPU provides a robust environment for deploying machine learning models that require high computational power.
This article will guide you on how to generate and use vector embeddings using an Atlantic.Net Cloud GPU.
Prerequisites
Before proceeding, ensure you have the following:
An Atlantic.Net Cloud GPU server running Ubuntu 22.04, equipped with an NVIDIA A100 GPU with at least 10 GB of GPU RAM.
CUDA Toolkit and cuDNN Installed.
Root or sudo privileges.
Step 1: Setting Up Your Environment
First, connect to your Atlantic.Net Cloud GPU instance using SSH. Once logged in, you should set up a Python environment. Here’s how you can install the necessary packages:
apt install python3 python3-pip
Install PyTorch.
pip3 install torch --index-url https://download.pytorch.org/whl/cu118
Install the sentence-transformer Python framework.
pip3 install sentence_transformers
Step 2: Creating the Embedding Generation Script
Create a Python script named create-embeddings.py that will encode sentences into vector embeddings using the SentenceTransformer model.
nano create-embeddings.py
Add the following code:
from sentence_transformers import SentenceTransformer
model = SentenceTransformer('all-MiniLM-L6-v2')
sentences = [
'This is sentence 1',
'This is sentence 2',
'This is sentence 3'
]
embeddings = model.encode(sentences)
for sentence, embedding in zip(sentences, embeddings):
print("Sentence:", sentence)
print("Embedding:", embedding)
print("")
In this script, we initialize a pre-trained model (all-MiniLM-L6-v2), which is suitable for generating embeddings. The script processes a list of sentences and outputs their corresponding embeddings.
Now, run the above script.
python3 create-embeddings.py
The output will display the embeddings for each sentence, represented as vectors. These embeddings can be used for further analysis or model training.
-1.81968231e-02 1.34411370e-02 3.34244817e-02 2.00667456e-02
-1.49116814e-02 2.83299759e-02 3.46540324e-02 5.40056638e-02
3.22964322e-03 -3.13563198e-02 -2.74929032e-02 -2.80718114e-02
4.45681438e-03 -2.83749006e-03 3.57951708e-02 4.00369102e-03
3.07004545e-02 3.27301696e-02 9.36542265e-03 3.44577916e-02
1.49957128e-02 8.31826255e-02 3.61972526e-02 9.59376097e-02
-2.22833566e-02 5.62446602e-02 -5.56956753e-02 -7.11603910e-02
7.02162553e-03 -6.63649812e-02 4.74848412e-02 -5.78645468e-02
6.50438573e-03 4.54177819e-02 -4.24348488e-02 6.53610080e-02
-1.88463349e-02 -3.33171338e-02 2.32637711e-02 -3.17560397e-02
-4.93795201e-02 -3.29444744e-02 -5.85382022e-02 -3.99537198e-02
7.91056156e-02 7.39838034e-02 5.14839850e-02 -2.18956899e-02
-4.34886962e-02 1.52404765e-02 -4.13710400e-02 -1.73745619e-03
3.03356256e-02 -1.15166663e-03 2.02252921e-02 -9.41368788e-02]
Step 3: Calculating Cosine Similarity
You can calculate the cosine similarity between their embeddings to understand how similar two sentences are. Create a script named cosine-similarity.py to accomplish this:
nano cosine-similarity.py
Add the following code.
from sentence_transformers import SentenceTransformer, util
model = SentenceTransformer('all-MiniLM-L6-v2')
emb1 = model.encode("This is sentence 1")
emb2 = model.encode("This is sentence 2")
cos_sim = util.cos_sim(emb1, emb2)
print("Cosine-Similarity:", cos_sim)
Run the script to see the cosine similarity score, which quantifies the similarity between two sentences.
python3 cosine-similarity.py
Output:
Cosine-Similarity: tensor([[0.9145]])
Step 4: Finding Top Similar Sentence Pairs
Finding the most similar pairs of sentences in a dataset can be crucial for applications like clustering or recommendation systems. Use the following script to find and display the top similar sentence pairs:
nano top-similar-pairs.py
Add the following code:
from sentence_transformers import SentenceTransformer, util
model = SentenceTransformer('all-MiniLM-L6-v2')
sentences = [
'A man is eating food.',
'A man is eating a piece of bread.',
'The girl is carrying a baby.',
'A man is riding a horse.',
'A woman is playing violin.',
'Two men pushed carts through the woods.',
'A man is riding a white horse on an enclosed ground.',
'A monkey is playing drums.',
'Someone in a gorilla costume is playing a set of drums.'
]
embeddings = model.encode(sentences)
cos_sim = util.cos_sim(embeddings, embeddings)
all_sentence_combinations = []
for i in range(len(cos_sim)-1):
for j in range(i+1, len(cos_sim)):
all_sentence_combinations.append([cos_sim[i][j], i, j])
all_sentence_combinations = sorted(all_sentence_combinations, key=lambda x: x[0], reverse=True)
print("Top-5 most similar pairs:")
for score, i, j in all_sentence_combinations[0:5]:
print("{} \t {} \t {:.4f}".format(sentences[i], sentences[j], cos_sim[i][j]))
This script identifies and lists the top five similar sentence pairs from a predefined list, demonstrating a practical application of vector embeddings in determining text similarity.
Now, run the above script.
python3 top-similar-pairs.py
Output:
Top-5 most similar pairs:
A man is eating food. A man is eating a piece of bread. 0.7553
A man is riding a horse. A man is riding a white horse on an enclosed ground. 0.7369
A monkey is playing drums. Someone in a gorilla costume is playing a set of drums. 0.6433
A woman is playing violin. Someone in a gorilla costume is playing a set of drums. 0.2564
A man is eating food. A man is riding a horse. 0.2474
The above outputs illustrate how vector embeddings and cosine similarity can be used to analyze and quantify the similarity between different texts, which can be crucial for many applications such as search engines, recommendation systems, and more sophisticated NLP tasks.
Conclusion
Using an Atlantic.Net Cloud GPU server to handle vector embeddings allows powerful computational resources to be leveraged to perform intensive machine learning tasks efficiently. The examples here showcase basic operations you can perform with embeddings, from generation to similarity comparison, which is foundational for advanced NLP tasks.
### A Comprehensive Guide to Text-to-Video Generation on Atlantic.Net GPU Servers
In the ever-evolving digital media landscape, transforming text into captivating video content is a highly sought-after skill. With the advent of powerful GPU servers, such as those offered by Atlantic.Net, this task has become more accessible.
This guide will walk you through setting up and utilizing an Atlantic.Net GPU server to create videos based on text inputs. By leveraging the NVIDIA A100 GPU's robust capabilities, users can create high-quality videos quickly and efficiently.
Prerequisites
Before proceeding, ensure you have the following:
An Atlantic.Net Cloud GPU server running Ubuntu 24.04, equipped with an NVIDIA A100 GPU with at least 20 GB of GPU RAM.
CUDA Toolkit and cuDNN Installed.
Root or sudo privileges.
Step 1: Install Necessary Packages
Begin by updating your system's package list and installing Python, FFmpeg, and Git.
apt update -y
apt install python3-full python3-virtualenv ffmpeg git -y
Step 2: Set Up Python Environment
Create and activate a virtual environment that isolates your Python setup and prevents conflicts between project dependencies.
Let's create a virtual environment for your project.
python3 -m venv text2video-env
Next, activate the virtual environment.
source text2video-env/bin/activate
Step 3: Install Python Libraries
Install the required Python libraries, including PyTorch, for neural networks.
pip install torch torchvision torchaudio --index-url https://download.pytorch.org/whl/cu118
Install additional libraries for AI-driven image generation and video processing.
pip install diffusers transformers accelerate scipy tqdm opencv-python einops moviepy
Step 4: Create the Python Script
Write a Python script named text2video_stablediffusion.py. This script will use AI models to generate video frames from text. Start by importing necessary libraries and initializing key variables:
nano text2video_stablediffusion.py
Import the necessary modules.
import os
import subprocess
import torch
from diffusers import StableDiffusionPipeline
Step 5: Initialize the AI Pipeline
Set up the StableDiffusionPipeline, which is essential for transforming text into images. This pipeline is loaded with a pre-trained model optimized for video frame generation:
def main():
# Initialize pipeline
pipe = StableDiffusionPipeline.from_pretrained(
"CompVis/stable-diffusion-v1-4",
torch_dtype=torch.float16
)
pipe.to("cuda")
Step 6: Define the Video Prompt and Parameters
Configure your video by setting the prompt, the number of frames, and the frames per second (FPS):
# Define your prompt
prompt = "A surreal painting of a dancing robot in a futuristic city."
print(f"Generating frames for prompt: {prompt}")
# Directory to store the generated frames
frames_folder = "generated_frames"
os.makedirs(frames_folder, exist_ok=True)
# Number of frames and fps
num_frames = 30 # e.g., for 30 frames at 1 second of video
fps = 30
Step 7: Generate and Save Frames
Use the AI model to generate each frame based on the text prompt, modifying the seed for each frame to ensure variation yet maintaining thematic consistency.
# Generate frames
for i in range(num_frames):
seed = 42 + i
generator = torch.Generator("cuda").manual_seed(seed)
# Generate one image
image = pipe(prompt, guidance_scale=7.5, generator=generator).images[0]
# Save frame
frame_path = os.path.join(frames_folder, f"frame_{i:03d}.png")
image.save(frame_path)
# Stitch frames into a video using ffmpeg
video_filename = "output_video.mp4"
print(f"Combining frames into {video_filename} at {fps} FPS...")
Step 8: Compile the Video
After generating the frames, compile them into a single video file using FFmpeg. This step stitches the images into a flowing video sequence.
subprocess.run([
"ffmpeg",
"-framerate", str(fps),
"-i", os.path.join(frames_folder, "frame_%03d.png"),
"-c:v", "libx264",
"-pix_fmt", "yuv420p",
video_filename
])
print("Video generation complete.")
if __name__ == "__main__":
main()
Save and close the file.
Step 9: Execute the Script
Run the script to generate the video.
python3 text2video_stablediffusion.py
This script will generate a video from the text prompt and save it to the file output_video.mp4.
[libx264 @ 0x55cf716f6a40] using cpu capabilities: MMX2 SSE2Fast SSSE3 SSE4.2 AVX FMA3 BMI2 AVX2
[libx264 @ 0x55cf716f6a40] profile High, level 3.0, 4:2:0, 8-bit
[libx264 @ 0x55cf716f6a40] 264 - core 164 r3108 31e19f9 - H.264/MPEG-4 AVC codec - Copyleft 2003-2023 - http://www.videolan.org/x264.html - options: cabac=1 ref=3 deblock=1:0:0 analyse=0x3:0x113 me=hex subme=7 psy=1 psy_rd=1.00:0.00 mixed_ref=1 me_range=16 chroma_me=1 trellis=1 8x8dct=1 cqm=0 deadzone=21,11 fast_pskip=1 chroma_qp_offset=-2 threads=4 lookahead_threads=1 sliced_threads=0 nr=0 decimate=1 interlaced=0 bluray_compat=0 constrained_intra=0 bframes=3 b_pyramid=2 b_adapt=1 b_bias=0 direct=1 weightb=1 open_gop=0 weightp=2 keyint=250 keyint_min=25 scenecut=40 intra_refresh=0 rc_lookahead=40 rc=crf mbtree=1 crf=23.0 qcomp=0.60 qpmin=0 qpmax=69 qpstep=4 ip_ratio=1.40 aq=1:1.00
Output #0, mp4, to 'output_video.mp4':
Metadata:
encoder : Lavf60.16.100
Stream #0:0: Video: h264 (avc1 / 0x31637661), yuv420p(tv, progressive), 512x512, q=2-31, 30 fps, 15360 tbn
Metadata:
encoder : Lavc60.31.102 libx264
Side data:
cpb: bitrate max/min/avg: 0/0/0 buffer size: 0 vbv_delay: N/A
[out#0/mp4 @ 0x55cf716f5cc0] video:607kB audio:0kB subtitle:0kB other streams:0kB global headers:0kB muxing overhead: 0.158672%
frame= 30 fps=0.0 q=-1.0 Lsize= 608kB time=00:00:00.90 bitrate=5538.0kbits/s speed=1.84x
[libx264 @ 0x55cf716f6a40] frame I:2 Avg QP:29.58 size: 20441
[libx264 @ 0x55cf716f6a40] frame P:28 Avg QP:30.96 size: 20731
[libx264 @ 0x55cf716f6a40] mb I I16..4: 6.6% 51.2% 42.2%
[libx264 @ 0x55cf716f6a40] mb P I16..4: 7.1% 51.5% 41.2% P16..4: 0.1% 0.1% 0.0% 0.0% 0.0% skip: 0.0%
[libx264 @ 0x55cf716f6a40] 8x8 transform intra:51.6% inter:79.0%
[libx264 @ 0x55cf716f6a40] coded y,uvDC,uvAC intra: 78.5% 95.0% 77.2% inter: 81.0% 100.0% 59.7%
[libx264 @ 0x55cf716f6a40] i16 v,h,dc,p: 32% 28% 3% 37%
[libx264 @ 0x55cf716f6a40] i8 v,h,dc,ddl,ddr,vr,hd,vl,hu: 28% 22% 10% 6% 5% 6% 7% 7% 9%
[libx264 @ 0x55cf716f6a40] i4 v,h,dc,ddl,ddr,vr,hd,vl,hu: 39% 21% 8% 5% 6% 6% 6% 5% 4%
[libx264 @ 0x55cf716f6a40] i8c dc,h,v,p: 33% 23% 32% 12%
[libx264 @ 0x55cf716f6a40] Weighted P-Frames: Y:3.6% UV:3.6%
[libx264 @ 0x55cf716f6a40] ref P L0: 26.6% 19.4% 22.6% 29.8% 1.6%
[libx264 @ 0x55cf716f6a40] kb/s:4970.80
Video generation complete.
Download the output_video.mp4 file to your local desktop machine and double-click on it to play the video.
Conclusion
Using Atlantic.Net's GPU servers for text-to-video generation harnesses cutting-edge AI technology to transform simple text descriptions into dynamic visual stories. This process enhances the creative possibilities and streamlines content creation across various digital media platforms. Whether for business or personal projects, integrating text-to-video technology offers a powerful tool for innovative and engaging digital content creation.
### How to Generate Videos with HuggingFace ModelScope Text2Video Diffusion Model on Atlantic.Net Cloud GPU
In the rapidly evolving world of AI and machine learning, generating videos from textual descriptions is no longer confined to the realms of science fiction. Thanks to advancements in generative models, it is now possible to create detailed, dynamic videos based solely on a few lines of text. One of the most exciting developments in this area comes from HuggingFace's ModelScope, featuring the Text2Video Diffusion Model. This model leverages the power of diffusion techniques to transform written narratives into captivating visual stories.
In this guide, we'll show you how to use the Text2Video Diffusion Model to generate videos from text.
Prerequisites
Before proceeding, ensure you have the following:
An Atlantic.Net Cloud GPU server running Ubuntu 24.04, equipped with an NVIDIA A100 GPU with at least 20 GB of GPU RAM.
CUDA Toolkit and cuDNN Installed.
Root or sudo privileges.
Step 1: Install Python and Additional Dependencies
The default Python version in Ubuntu 24.04 (Python 3.12) is incompatible with HuggingFace requirements. You'll need to install Python 3.10:
Add the Python repository.
add-apt-repository ppa:deadsnakes/ppa
Update the package index.
apt update -y
Install Python 3.10 and essential libraries.
apt install python3.10 python3.10-venv python3.10-dev
apt install build-essential libssl-dev libffi-dev zlib1g-dev libbz2-dev libreadline-dev libsqlite3-dev wget curl llvm libncurses5-dev libncursesw5-dev xz-utils tk-dev libxml2-dev libxmlsec1-dev liblzma-dev
Step 2: Install WebUI and ModelScope
Install Git LFS for managing large files.
apt install git-lfs -y
Initialize Git LFS to use the WebUI and ModelScope repositories.
git lfs install
Clone the WebUI repository.
git clone https://github.com/AUTOMATIC1111/stable-diffusion-webui.git
Navigate to the new WebUI directory.
cd stable-diffusion-webui
Set the WebUI version to 1.7.0, which is compatible with ModelScope.
git reset --hard cf2772f
Create a directory structure to set up ModelScope files.
mkdir -p models/ModelScope/t2v
Switch to the t2v directory.
cd models/ModelScope/t2v
Download the latest ModelScope text-to-video model.
git clone https://huggingface.co/ali-vilab/modelscope-damo-text-to-video-synthesis .
Step 3: Configure Nginx as a Reverse Proxy to Access WebUI
By default, the WebUI is accessible on the localhost port 7860. To access the WebUI from an external network, you must configure Nginx as a reverse proxy.
First, install the Nginx web server package.
apt install nginx
Next, create an Nginx virtual host configuration file.
nano /etc/nginx/conf.d/webui.conf
Add the following configuration.
upstream webui {
server 127.0.0.1:7860;
}
server {
listen 80;
listen [::]:80;
server_name webui.example.com;
proxy_set_header Host $host;
proxy_http_version 1.1;
proxy_set_header X-Real-IP $remote_addr;
proxy_set_header X-Forwarded-For $proxy_add_x_forwarded_for;
proxy_set_header X-Forwarded-Proto $scheme;
proxy_set_header Sec-WebSocket-Extensions $http_sec_websocket_extensions;
proxy_set_header Sec-WebSocket-Key $http_sec_websocket_key;
proxy_set_header Sec-WebSocket-Version $http_sec_websocket_version;
proxy_set_header Upgrade $http_upgrade;
proxy_set_header Connection "Upgrade";
location / {
proxy_pass http://webui;
}
}
Save and close the file. Then, verify the Nginx configuration.
nginx -t
Output:
nginx: the configuration file /etc/nginx/nginx.conf syntax is ok
nginx: configuration file /etc/nginx/nginx.conf test is successful
Finally, restart the Nginx to apply the changes.
systemctl restart nginx
Step 4: Configure Stable Diffusion WebUI
First, navigate to the stable-diffusion-webui directory.
cd ~/stable-diffusion-webui
Then, create a Python virtual environment and activate it.
python3.10 -m venv venv
source venv/bin/activate
Update pip to the latest version.
pip install --upgrade pip
Update the tqdm module required by the WebUI interface to run models.
pip3 install --upgrade tqdm
Install Fast API and other libraries.
pip3 install fastapi
pip install clip
Step 5: Run the Stable Diffusion WebUI
At this point, your Stable Diffusion WebUI is configured. You can now launch WebUI, which will serve as the interface for video generation.
python3.10 launch.py
Wait for the application to fully initialize, which might take several minutes, depending on your system's performance. You will see the following output after the successful execution.
100%|███████████████████████████████████████████████████████████████████████████████████████████████████████████████████████████████| 3.97G/3.97G [00:19<00:00, 216MB/s]
Calculating sha256 for /root/stable-diffusion-webui/models/Stable-diffusion/v1-5-pruned-emaonly.safetensors: Running on local URL: http://127.0.0.1:7860
Step 6: Access WebUI and Generate Videos using ModelScope
Open your web browser and access WebUI using the URL http://webui.example.com.
In the main WebUI navigation menu, click on Extensions and navigate to the Available tab and click Load from: to load all available models in the WebUI repository.
In the search field, type the keyword modelscope and press the Space button to search an extension.
Click Install in the text2video result action tab to install the ModelScope extension.
Again search the keyword "video in extras tab" in the search field. Click Install next to the Video in the Extras tab to install the new extension.
Once the extension is installed, click Reload UI at the bottom of the web page to reload WebUI.
Navigate to the txt2video tab within the WebUI interface.
Select the ModelScope as the Model type and enter your desired text prompt in the Prompt field. For example "children are studying in the classroom". Then, click Generate and wait for at least 3 minutes for the ModelScope generation process to complete. You should see your generated video on the following screen.
You can also change your input text prompt to generate a new video using ModelScope per your requirements.
Conclusion
Congratulations! You have successfully installed and configured the HuggingFace ModelScope Text2Video Diffusion Model on an Atlantic Cloud GPU. The process involves setting up a compatible Python environment, managing large files with Git LFS, configuring Nginx for external access, and deploying a complex AI model within a user-friendly web interface. You can now experiment with different prompts, explore various settings within the ModelScope, and continue to refine your approach to produce unique and impactful video content.
### GPU for Deep Learning: Critical Specs and Top 7 GPUs in 2025
What Are GPUs?
GPUs, or graphics processing units, were originally created to render images and video. Their primary function was to offload compute-intensive tasks from the CPU, managing the complex calculations necessary for rendering graphics quickly. Over time, their capabilities have expanded, positioning them as parallel processors capable of handling a variety of demanding computational tasks. This shift has enabled GPUs to play a pivotal role in fields beyond graphics, such as scientific computing, artificial intelligence, and machine learning.
Modern GPUs are highly parallel, allowing them to process many tasks simultaneously, making them ideal for applications requiring significant computational resources over numerous processes. Unlike CPUs, which are optimized for sequential task processing, GPUs can manage thousands of threads at once. This architecture has proven useful for tasks that benefit from parallelism, such as matrix operations key to deep learning algorithms.
For students embarking on their deep learning journey, a well-structured writing guide can help simplify the process of understanding these advanced concepts, and platforms like EssayHub can provide additional insights into how GPUs impact various AI models.
This is part of a series of articles about GPU for AI.
Critical GPU Specs for Successful Deep Learning
Tensor Cores
Tensor Cores are specialized hardware components within some modern GPUs that accelerate deep learning workloads. They are optimized for performing mixed-precision matrix operations, such as matrix multiplications and accumulation. Tensor Cores can handle operations in FP16 (16-bit floating point) and FP32 (32-bit floating point) simultaneously.
Clock Speed
Clock speed, measured in MHz or GHz, determines how quickly the GPU cores can execute instructions. A higher clock speed usually means faster processing and more computations per second. For deep learning, while parallelism (number of cores) is more critical, clock speed aids in determining how fast individual computations within those parallel processes are performed.
VRAM
VRAM (Video Random Access Memory) is the dedicated memory available on the GPU to store data needed for computations. It stores the deep learning model parameters, input data, and intermediate computations during training and inference. Larger VRAM allows for bigger batch sizes and more complex models to be processed without memory overflow.
Memory Bandwidth
Memory bandwidth refers to the speed at which data can be read from or written to the GPU's memory. For deep learning, higher memory bandwidth is crucial since large datasets and model parameters need to be moved quickly between GPU memory and its processing cores. A GPU with higher memory bandwidth allows for faster data transfer, which is critical for training large neural networks where delays in memory access can become a bottleneck.
L2 Cache and L1 Cache
L2 and L1 caches are small, fast memory units closer to the GPU cores, which are used to temporarily store data that is frequently accessed. Caching helps reduce the need to fetch data repeatedly from the slower main memory (VRAM). The size and efficiency of these caches can impact the performance of deep learning models, reducing latency and improving throughput.
CUDA Cores/Stream Processors
CUDA Cores (on NVIDIA GPUs) or Stream Processors (on AMD GPUs) are the primary processing units that execute compute operations on the GPU. The number of CUDA Cores or Stream Processors influences the GPU's ability to handle parallel computations. For deep learning, a higher count typically means more concurrent operations can be executed.
FP16/FP32/INT8 Performance
The performance of a GPU in various data precision formats determines its efficiency in different stages of deep learning. FP32 (single-precision) is the standard for training due to its accuracy, but FP16 (half-precision) has gained popularity for training and inference to improve speed and reduce memory usage. INT8 (8-bit integer) is often used for inference optimization as it requires even less memory and can accelerate model deployment, albeit with some precision trade-offs.
Compute Capability (FLOPS)
FLOPS (Floating Point Operations Per Second) is a metric that indicates the raw computational power of a GPU. The higher the FLOPS, the more capable the GPU is at performing floating-point calculations. Both single-precision (FP32) and half-precision (FP16) FLOPS are important to consider to balance performance and accuracy.
Multi-GPU Scalability
Multi-GPU scalability refers to the GPU's ability to work effectively in parallel with other GPUs to accelerate computation. In deep learning, scaling up to multiple GPUs is often necessary to train large models quickly or handle large datasets. Efficient multi-GPU communication, enabled by interconnects like NVLink or PCIe, allows for faster data exchange between GPUs, reducing training times and enabling the distribution of workloads across several GPUs.
Related content: Read our guide to GPU cloud computing
Top GPUs for Deep Learning in 2025
1. NVIDIA A100
Specs:
CUDA cores: 6,912
Tensor cores: 432
GPU memory: 40 GB or 80 GB HBM2
Memory bandwidth: 1,555 GB/s
Power consumption: 250 to 400 Watts (depending on configuration)
Clock speed: 1.41 GHz
Thermal Design Power (TDP): 400 Watts
The NVIDIA A100, built on the Ampere architecture, the A100 brings significant performance improvements and excels in tasks involving deep learning model training and inference. It features Tensor Cores, specifically built for AI tasks, which accelerate matrix computations that are essential for deep learning. The A100 supports mixed-precision training, combining FP16 and FP32 formats to balance performance and accuracy.
A key advantage of the A100 is its high memory capacity, with up to 80 GB of HBM2 memory. This large memory pool allows for the handling of extremely large datasets and complex models, which are often required in advanced AI tasks.
Additionally, the A100 incorporates multi-instance GPU (MIG) technology, enabling the division of a single GPU into multiple instances for different tasks. This makes it ideal for data centers and large-scale AI deployments, as multiple workloads can run concurrently on a single A100, maximizing resource efficiency.
2. NVIDIA RTX A6000
Specs:
CUDA cores: 10,752
Tensor cores: 336
GPU memory: 48 GB GDDR6
Memory bandwidth: 768 GB/s
Power consumption: 300 Watts
The NVIDIA RTX A6000 is a high-performance GPU built for professional applications, including deep learning. Like the A100, it is also based on the Ampere architecture, offering substantial improvements over previous generations in terms of both speed and efficiency. The RTX A6000 comes with 48 GB of GDDR6 memory, which is sufficient for training deep learning models that require a significant amount of memory.
One of the key features of the RTX A6000 is its Tensor Cores, which are optimized for AI tasks and provide accelerated performance for deep learning computations. These Tensor Cores allow for efficient matrix operations, speeding up model training and inference. The RTX A6000 also supports mixed-precision training, which allows for a combination of FP16 and FP32 precisions to enhance both computational speed and memory usage efficiency.
3. NVIDIA RTX 4090
Specs:
CUDA cores: 16,384
Tensor cores: 512
GPU memory: 24 GB GDDR6X
Memory bandwidth: 1 TB/s
Power consumption: 450 Watts
Memory: 24 GB GDDR6X
The NVIDIA GeForce RTX 4090, though primarily marketed as a consumer-grade GPU that targets high-end gamers, however, it can also be used for deep learning tasks. It is based on the Ada Lovelace architecture and features a high number of CUDA cores—16,384—making it an option for researchers and developers working on smaller to medium-sized deep learning models. With 24 GB of GDDR6X memory, the RTX 4090 is capable of handling moderate dataset sizes.
One of the major advantages of the RTX 4090 is its affordability compared to more specialized GPUs like the A100 or A6000. It also benefits from full support for NVIDIA’s CUDA and cuDNN libraries, which are essential for deep learning development. While it lacks enterprise features like multi-instance GPU (MIG) or NVLink support, the RTX 4090's high memory bandwidth of 1 TB/s allows for fast data transfers, reducing the time required for training and inference.
4. NVIDIA V100
Specs:
CUDA cores: 5,120
Tensor cores: 640
GPU memory: 16 GB
Memory bandwidth: 900 GB/s
Power consumption: 250 Watts
Clock speed: 1.246 GHz
The NVIDIA V100 is a widely-used GPU for deep learning, created specifically for high-performance computing and AI workloads. Built on the Volta architecture, it includes Tensor Cores that are optimized for deep learning tasks, such as matrix multiplications, which are fundamental to training neural networks. The V100 excels in mixed-precision training, allowing for the combination of FP16 and FP32 calculations to optimize both performance and memory usage.
The V100 comes with 32 GB of HBM2 memory, which provides ample capacity for large-scale deep learning models and datasets. Additionally, the V100 supports NVLink, a high-speed interconnect technology that allows multiple GPUs to be linked together, enabling parallel processing across multiple GPUs.
5. NVIDIA A40
Specs:
CUDA cores: 10,752
Tensor cores: 336
GPU memory: 48 GB GDDR6
Memory bandwidth: 696 GB/s
Power consumption: 300 Watts
NVLink support
Enhanced for deep learning with Tensor Cores
The NVIDIA A40 is another Ampere-based GPU that offers substantial performance for deep learning tasks. While it is primarily created for professional and data center applications, it can also be utilized effectively for AI workloads. The A40 features 48 GB of GDDR6 memory, providing ample capacity for handling large datasets and complex models that are often required in deep learning.
Similar to other GPUs in the Ampere lineup, the A40 is equipped with Tensor Cores that accelerate AI computations. The A40 also benefits from NVIDIA’s deep learning software ecosystem, including libraries like CUDA, cuDNN, and TensorRT, which optimize the use of GPU resources for AI tasks. While the A40 may not reach the same performance levels as the A100, it is a cost-effective alternative for teams or organizations that need a balance between price and power.
6. NVIDIA L40S GPU
Specs:
CUDA cores: 18,176
Tensor cores: 568
GPU memory: 48GB GDDR6 with ECC
Memory bandwidth: 864GB/s
Power consumption: Watts
Interconnect interface: PCIe Gen4 x16, 64GB/s bidirectional
The NVIDIA NVL40S Tensor Core GPU offers substantial computational power optimized for deep learning tasks, including neural network training and inference. It is based on the Ada Lovelace architecture and includes fourth-generation Tensor Cores and a large number of CUDA cores. L40S supports mixed-precision training and inference, utilizing FP8, FP16, and BF16 precisions.
Its 48 GB of GDDR6 memory allows for the handling of large and complex models common in deep learning workflows. Additionally, the L40S supports NVLink technology, enabling high-speed connectivity between GPUs for multi-GPU training and efficient data transfers.
7. NVIDIA H100 NVL
Specs:
CUDA cores: 14592
Tensor cores: 456
GPU memory: 94GB HBM2e memory
Memory bandwidth: 3.9TB/s
Power consumption: 700 Watts (350 Watts per GPU)
The NVIDIA H100 NVL GPU is part of the Hopper architecture lineup, suitable for handling large-scale deep learning and high-performance computing (HPC) workloads. The H100 NVL is equipped with dual GPUs, delivering a massive combined 188 GB of HBM3 memory.
H100 NVL can scale across multiple GPUs, supporting advanced interconnect technologies like NVLink and NVSwitch. This multi-GPU scalability makes it suitable for large AI clusters and distributed training, as the GPUs can communicate at high speeds, reducing latency and improving overall throughput.
Key Metrics for Evaluating Your Deep Learning GPU Performance
Even after you choose the right GPU for your project, it’s important to measure how effective your GPU is performing. This will allow you to optimize and get the most out of your hardware.
GPU Utilization
GPU utilization refers to the proportion of GPU resources being used during a task. It is a crucial performance indicator, reflecting how effectively a GPU is employed in processing tasks. High utilization indicates that the GPU is being well-used, which is desirable for maximum efficiency and throughput in deep learning contexts. Conversely, low utilization suggests that the GPU's capabilities aren't being fully tapped, possibly due to software inefficiencies or system bottlenecks.
Monitoring GPU utilization is essential in optimizing deep learning performance, as it provides insights into potential areas for improvement in resource allocation. Ensuring high GPU utilization might involve tuning software settings, optimizing model configurations, or balancing workloads to prevent underutilization.
GPU Memory Access and Usage
GPU memory access and usage denote how efficiently a GPU can read and write data to its memory. These metrics significantly affect deep learning performance, where rapid data exchange and efficient memory management enhance modeling processes. Proper memory handling ensures that the GPU has timely access to data, which is crucial for maintaining a high computational throughput during the training and inference of AI models.
Effective GPU memory access and usage are essential for utilizing available resources optimally. Deep learning models often require significant memory bandwidth for data handling, so efficient memory use can prevent bottlenecks, ensuring smoother data flow.
Power Usage and Temperatures
Monitoring power usage and temperatures is vital in maintaining GPU performance and longevity. High power consumption might suggest excessive resource demand, potentially indicating inefficiency, while elevated temperatures can lead to throttling or hardware damage. In deep learning tasks, balancing powerful processing with efficient thermal management ensures a GPU operates safely at optimal performance levels.
Efficient management of power and temperatures involves employing adequate cooling systems and optimizing workload distribution. These factors are important in preventing performance degradation caused by overheating. By understanding power and thermal characteristics, users can employ strategies to maintain GPUs at their peak performance.
Time to Solution
Time to solution is a critical metric for assessing GPU performance, especially in deep learning applications. This metric defines the total time required to complete computational tasks, from training models to deploying them. A shorter time to solution implies high efficiency in terms of cost and productivity, as it reflects how swiftly a GPU can complete the necessary calculations to achieve desired outcomes in AI projects.
Evaluating time to solution involves analyzing performance across many factors, including GPU throughput, memory access, and overall resource management. By focusing on reducing time to solution, researchers and developers can maximize their productivity and streamline processes, enabling rapid iterations and refinements of AI models.
Next-Gen Dedicated GPU Servers from Atlantic.Net, Accelerated by NVIDIA
Experience unparalleled performance with dedicated cloud servers equipped with the revolutionary NVIDIA accelerated computing platform.
Choose from the NVIDIA L40S GPU and NVIDIA H100 NVL to unleash the full potential of your generative artificial intelligence (AI) workloads, train large language models (LLMs), and harness natural language processing (NLP) in real time.
High-performance GPUs are superb at scientific research, 3D graphics and rendering, medical imaging, climate modeling, fraud detection, financial modeling, and advanced video processing.
Learn more about Atlantic.net GPU server hosting.
### GPU Dedicated Server Hosting: A Buyer’s Guide
What Is GPU Dedicated Server Hosting?
GPU dedicated server hosting involves servers equipped with graphics processing units (GPUs) to handle demanding computational tasks. Unlike traditional servers that rely heavily on central processing units (CPUs), GPU servers manage parallel processing workloads efficiently. These servers are beneficial for applications requiring high computational power like rendering, machine learning, and scientific simulations.
The integration of GPUs in dedicated servers offers significant advantages in processing complex tasks rapidly. By leveraging the parallel computing ability of GPUs, these servers enhance performance and manage intensive applications. This type of hosting is becoming increasingly popular in industries that require extensive data processing capabilities.
Benefits of GPU Dedicated Servers
Opting for GPU dedicated servers offers a range of benefits for handling resource-intensive applications and high-volume data processing. Key advantages include:
Enhanced processing speed: GPU servers perform complex calculations much faster than CPU-based servers by leveraging parallel processing. This speed is crucial for applications in AI, scientific research, and media production, where tasks involve vast data sets and require rapid computation.
Scalability for high-demand applications: GPU servers can scale efficiently to meet the demands of computationally heavy workloads. This scalability supports applications that grow in complexity, such as large machine learning models or real-time analytics, enabling them to handle more extensive and demanding datasets over time.
Efficient resource utilization: By offloading specific tasks to the GPU, applications can use server resources more efficiently, freeing up the CPU for other processing tasks. This efficiency optimizes performance across applications, enhancing overall server responsiveness.
Reduced processing time for data-intensive workloads: GPU servers accelerate tasks that traditionally require long processing times, such as rendering, simulation, and model training. This reduction in time helps organizations deliver results faster, boosting productivity in workflows dependent on high-speed computation.
Support for modern software frameworks: GPU servers are compatible with leading software frameworks like CUDA, TensorFlow, and PyTorch, which are optimized for GPU acceleration. This support enables developers and researchers to leverage cutting-edge libraries for advanced analytics and AI model development.
Improved data processing in real time: GPU servers handle real-time data processing effectively, making them ideal for applications that require instant results, such as video processing, virtual reality, and streaming. Real-time capabilities allow businesses to deliver enhanced user experiences in dynamic environments.
How GPU Dedicated Servers Work
GPU Architecture and Functionality
GPUs are designed with a large number of cores that execute multiple operations concurrently, making them well-suited for parallel processing. This architecture contrasts with CPUs, which typically have fewer, more powerful cores optimized for sequential processing. In a GPU, thousands of small cores work together to perform many calculations simultaneously, enabling efficient handling of complex computations and large datasets.
GPUs are equipped with specialized cores optimized for different tasks, which enhance their performance across various applications. For instance, CUDA cores are the standard for general parallel computations, ideal for applications such as machine learning and simulations. Tensor cores, available in NVIDIA GPUs, are specifically designed for accelerating deep learning tasks like matrix operations. These are critical in training and inference for AI models. RT cores, or ray-tracing cores, handle real-time rendering of realistic lighting and shadows, making them essential in gaming and visualization. Some GPUs also support sparsity-aware operations, where sparsity cores optimize processing by skipping redundant data points.
In addition to core types, memory plays a significant role in GPU performance. DDR (Double Data Rate) memory, such as GDDR6, is commonly used for high-speed data access, making it suitable for most computational workloads. Advanced memory types like HBM (High Bandwidth Memory) provide greater bandwidth and energy efficiency, making them ideal for memory-intensive tasks like large-scale simulations or AI training.
Integration into Server Environments
Integrating GPUs into server environments involves configuring hardware and software to maximize the GPU’s processing capabilities. GPU servers are equipped with one or more GPU cards connected to the server's motherboard, typically through PCIe slots, which offer high-speed data transfer rates. These cards are often housed in specialized enclosures or mounted in dedicated servers, designed with adequate cooling systems to handle the heat generated by intensive GPU processing.
On the software side, GPU integration requires compatible drivers, libraries, and APIs like CUDA or OpenCL, which allow applications to access the GPU's processing power. This setup enables the efficient use of resources across various applications, from data processing in scientific research to high-definition rendering in media production. Additionally, server environments often include resource allocation tools, such as Kubernetes or Docker, to manage workloads and scale resources dynamically.
Use Cases for GPU Dedicated Servers
Machine Learning and AI Applications
GPU dedicated servers are crucial in machine learning and AI, where large datasets and complex models are common. The servers’ parallel processing capabilities accelerate training by processing multiple data points simultaneously, reducing the time required for model development. This efficiency enables researchers and businesses to iterate rapidly, refining AI models and improving accuracy in a shorter timeframe.
In AI applications, GPUs are essential for deploying deep learning models in real time. Tasks like image recognition, natural language processing, and autonomous driving algorithms benefit from the computational power GPUs offer. By handling these intense computations, GPU servers deliver the performance needed for AI applications to function effectively at scale.
Scientific Simulations and Research
Scientific simulations often involve complex calculations and large datasets, making GPU dedicated servers ideal for research purposes. Tasks such as fluid dynamics, molecular modeling, and astronomical simulations require significant computational power, which GPU servers provide. By leveraging parallel processing, researchers can conduct more detailed simulations in less time.
Using GPUs in scientific research also allows for more sophisticated modeling and analysis. The ability to process vast amounts of data quickly enables researchers to explore intricate scenarios and obtain results that were previously unattainable with traditional computing power. This capability opens up new possibilities in fields such as medicine, physics, and environmental studies.
Video Rendering and Transcoding
GPU dedicated servers significantly enhance video rendering and transcoding processes. These tasks require substantial computational resources to manage the conversion and compression of video files quickly and efficiently. With their parallel processing capabilities, GPUs speed up rendering times, enabling content creators to produce high-quality videos with reduced turnaround.
In transcoding, GPU servers offer superior performance by handling multiple video streams concurrently. This capability is vital for streaming services and media companies that need to process and deliver content across various platforms and formats. By reducing processing times and improving output quality, GPU servers optimize the video production pipeline.
Virtual Desktop Infrastructure (VDI)
In VDI environments, GPU dedicated servers provide the necessary computational power to support a large number of virtual desktops and applications. By utilizing GPUs to manage graphics-intensive tasks, organizations can deliver a seamless user experience across multiple devices. This capability is particularly beneficial for industries requiring high-performance computing, such as design, engineering, and media production.
GPU servers enhance VDI by ensuring applications and desktops run smoothly, even when handling complex graphics and data visualization tasks. They enable organizations to deploy virtual environments that are as responsive and reliable as physical workstations. The power of GPU servers in VDI ensures end-users have access to the computational resources they need, regardless of their location or device.
Gaming and Virtual Reality
GPU dedicated servers play a crucial role in gaming and virtual reality (VR) applications, which demand high computational throughput for realistic graphics rendering and immersive experiences. By offloading processing tasks from local machines to powerful GPU servers, users benefit from enhanced graphics quality and reduced latency, resulting in smoother gameplay and more engaging VR experiences.
In gaming, GPU servers support cloud gaming platforms, allowing players to access high-quality games without needing high-end hardware. Similarly, in VR, GPU servers manage complex calculations required for immersive environments, ensuring seamless graphics rendering and interactivity. Leveraging GPU server capabilities in these domains empowers developers to create visually stunning, responsive experiences.
Comparing GPU Dedicated Servers to Other Server Types
GPU Servers vs. CPU Servers
GPU servers offer distinct advantages over traditional CPU servers, particularly where parallel processing is required. While CPUs excel in single-threaded tasks and general-purpose computing, GPUs are optimized for handling multiple operations simultaneously. This makes them ideal for applications such as AI, scientific simulations, and rendering, where vast computational resources are needed to process data efficiently.
CPU servers are better suited for tasks requiring high-frequency, sequential processing. Furthermore, deploying GPU servers can significantly reduce the time needed for completing parallel tasks. Despite being more expensive initially, the performance gains of GPU servers often justify the investment, especially in fields where speed and efficiency are critical.
GPU Servers vs. Cloud GPU Instances
GPU servers and cloud GPU instances present different benefits and trade-offs. Dedicated GPU servers offer consistent performance and control, which is essential for enterprise applications with specific compliance or security requirements. They provide guaranteed availability of computing resources, ensuring performance remains steady despite fluctuating demand.
On the other hand, cloud GPU instances offer flexibility and scalability, allowing businesses to scale resources up or down based on workload requirements. Although cloud solutions reduce upfront costs, expenses can add up over time with sustained use. Ultimately, the choice between GPU servers and cloud instances depends on factors such as cost considerations, control needs, and the nature of workloads being processed.
Best Practices for GPU Dedicated Server Hosting
Resource Allocation and Load Balancing
Effective resource allocation and load balancing are critical to maximizing GPU utilization and maintaining steady performance. By segmenting workloads across multiple GPUs or servers, businesses can avoid bottlenecks and ensure even distribution of tasks, reducing the risk of overloading any single GPU. Implementing load-balancing software or frameworks helps dynamically allocate resources based on demand, optimizing processing efficiency and preventing downtime during peak usage.
It’s also essential to regularly evaluate workload distribution and adjust configurations as necessary. As workloads evolve, fine-tuning resource allocation helps maintain optimal performance, ensuring GPU resources are neither underutilized nor overstressed.
Data Backup and Disaster Recovery Planning
Establishing a comprehensive data backup and disaster recovery plan is essential for GPU dedicated server environments, where data integrity and availability are critical. Regularly backing up data to secure locations protects against data loss from hardware failures or cyber incidents. Using automated backup solutions ensures that data is consistently saved without requiring manual intervention.
A disaster recovery plan should include predefined protocols for data restoration and continuity of services. This plan enables quick recovery of operations in the event of an outage, minimizing downtime and maintaining service reliability. Regular testing of backup and recovery processes ensures readiness and effectiveness in real-world scenarios.
Regular Updates and Patching
Keeping GPU dedicated servers up to date with the latest software and security patches is critical for smooth operation and defense against vulnerabilities. Regularly updating operating systems, drivers, and server applications enhances system performance and reliability. It also addresses known security issues, helping to protect against potential exploits and threats.
Timely patching requires efficient management practices, including setting up automation where possible to streamline the update process. Scheduling updates during maintenance windows minimizes disruption to operations. By ensuring servers are continuously updated, businesses can maintain optimal performance and secure their infrastructure against evolving cyber threats.
Performance Monitoring and Optimization
Continual performance monitoring and optimization are necessary to maintain and improve GPU dedicated servers' efficiency. By utilizing monitoring tools, businesses can track key performance metrics such as GPU utilization, memory usage, and network throughput, identifying areas for improvement. This data-driven approach enables timely adjustments to configurations and settings for enhanced performance.
Optimization involves tweaking server resources to better match workload demands. Adjusting parameters such as GPU clock speeds, memory allocation, and power settings can balance performance and energy consumption. Regularly reviewing resource usage statistics and reconfiguring settings helps ensure that the server operates at peak efficiency.
Planning for Future Scalability
Future scalability planning is essential for organizations utilizing GPU dedicated servers, as technological and workload demands evolve. By designing server infrastructure with scalability in mind, businesses can accommodate growth without significant overhauls. This involves selecting hardware with upgrade paths, such as expandable GPU slots and additional memory capacity, to support increased processing power as needed.
Scalable software frameworks and storage solutions also play a role in managing growth effectively. Choosing flexible solutions that can handle growing data volumes and processing requirements helps ensure smooth scaling. Planning for future scalability allows organizations to adapt easily to changing needs.
Selecting a GPU Dedicated Server Provider
Evaluating Hardware Options
The choice of hardware is fundamental when selecting a GPU server, as the right configuration will determine whether the server can meet your workload requirements. Begin by assessing the types of GPUs offered by the provider.
Check that the GPUs available align with your specific workload needs. Additionally, examine the CPU paired with the GPU, as it should have enough cores and processing power to support the GPU’s high throughput. Look for adequate RAM capacity (at least 32GB for most high-performance tasks) and SSD/NVMe storage to ensure fast data access speeds.
Consider asking the provider about expandability: some providers offer customizable setups, allowing you to add more GPUs, RAM, or storage as your workload grows, ensuring future scalability without requiring a complete migration.
Assessing Support and Services
Robust support services are essential, particularly if your workloads run continuously or if downtime can impact your business operations. Here’s what to look for:
24/7 technical support: This is crucial for addressing potential issues as soon as they arise. Ensure that the support team is available at all hours and that their response times align with your operational needs.
Expertise: The support team should have experience with GPU-intensive applications. Inquire about their familiarity with frameworks like CUDA, TensorFlow, or PyTorch if you plan to run machine learning or AI workloads.
Service Level Agreement (SLA): Review the SLA for uptime guarantees. Look for providers offering at least a 99.9% uptime guarantee and clearly defined compensation or recourse in case of service disruptions.
Providers that back their services with a high uptime SLA and skilled support can help ensure that your server environment is both reliable and resilient to unexpected issues.
Considering Cost and Value
While GPU dedicated servers offer significant computational power, they come with higher costs, especially for premium GPU models. To ensure value for your investment:
Analyze Pricing Structures: Look beyond base prices to understand the total cost, including additional fees for bandwidth, setup, or maintenance. Some providers bundle services like monitoring or security features, which may justify higher prices.
Pay-as-you-go vs. subscription models: If your workloads are seasonal or vary in intensity, a pay-as-you-go model might be more cost-effective. For constant, high-intensity workloads, a subscription model often provides better long-term value.
Cost of expansion: If you anticipate needing more resources, confirm the provider’s costs for adding GPUs, RAM, or storage. Some providers offer flexibility at a lower incremental cost, allowing you to scale without incurring a significant upfront expense.
Balance your need for high-performance capabilities with your budget, ensuring that the hardware and support features match the value you’re seeking.
Related content: Read our guide to low cost dedicated server hosting (coming soon)
Checking Provider Data Center Locations
The physical location of data centers affects latency, which can be crucial for applications needing real-time processing or minimal delay. When evaluating a provider’s data center locations:
Proximity to users: If you serve users primarily in a specific region, choose a provider with data centers close to that area to reduce latency. For example, providers with facilities in North America, Europe, and Asia-Pacific offer better options for global reach.
Redundancy and reliability: Data centers with multiple power sources, backup generators, and redundant network connections offer higher reliability. Confirm that the provider has failover systems in place to maintain uptime in the event of a local issue.
Compliance and security: For sensitive data, ensure that the provider’s data centers meet security and compliance standards such as ISO 27001, SOC 2, or GDPR. This is especially important for industries with strict regulatory requirements, like finance or healthcare.
Prioritizing data center locations that align with your user base and compliance needs can significantly impact performance and data security.
Examining Network Infrastructure and Uptime Guarantees
A provider’s network infrastructure plays a pivotal role in determining the reliability and performance of your GPU server. Here’s what to look for:
Bandwidth and throughput: For high-performance applications, ensure the provider offers high bandwidth options to support large data transfers and high network throughput. Many GPU applications involve significant data exchange, so robust networking is essential.
Redundancy and resilience: The best providers build redundancy into their networks to protect against downtime. Look for providers that maintain multiple data connections and employ traffic balancing across routes to prevent single points of failure.
Uptime guarantees and compensation: Review the provider’s uptime guarantee, usually stated in the SLA. A 99.9% uptime guarantee should be a minimum standard, but some providers offer 99.99% for added reliability. Confirm what compensation is available if they fail to meet this standard, as this can help offset losses from downtime.
High-quality network infrastructure and clear uptime commitments ensure that your server remains accessible and responsive, even during high-demand periods.
Next-Gen Dedicated GPU Servers from Atlantic.Net, Accelerated by NVIDIA
Experience unparalleled performance with dedicated cloud servers equipped with the revolutionary NVIDIA accelerated computing platform.
Choose from the NVIDIA L40S GPU and NVIDIA H100 NVL to unleash the full potential of your generative artificial intelligence (AI) workloads, train large language models (LLMs), and harness natural language processing (NLP) in real time.
High-performance GPUs are superb at scientific research, 3D graphics and rendering, medical imaging, climate modeling, fraud detection, financial modeling, and advanced video processing.
Learn more about Atlantic.net GPU server hosting.
### GPU for AI: Platforms, Top GPUs, and Key Features to Consider
What Are GPUs?
Graphics processing units (GPUs) are specialized electronic circuits that accelerate image rendering and processing. Initially developed for graphics-intensive tasks, GPUs have evolved significantly. They consist of thousands of smaller cores optimized for parallel processing, allowing them to perform many calculations simultaneously. This architecture is well-suited for operations involving large datasets and complex computational tasks.
In addition to their graphics capabilities, GPUs have become crucial for machine learning and artificial intelligence (AI). Their design allows them to handle tasks that require massive data throughput and high-speed computation efficiently. Compared to central processing units (CPUs), GPUs can offer substantial performance improvements for specific workloads, making them versatile components in both consumer and enterprise technology solutions.
This is part of an extensive series of guides about machine learning.
Why GPUs Are Great for AI
Handling Large Matrix Operations
GPUs handle large matrix operations, which are fundamental to AI and machine learning tasks. These operations often involve performing a vast number of calculations simultaneously, a task that GPUs execute efficiently. Traditional CPUs, even very powerful ones, lack the parallel processing infrastructure found in GPUs, resulting in slower performance for these tasks. The ability to process large volumes of data in parallel makes GPUs indispensable in AI applications.
Accelerating Deep Learning Tasks
GPUs accelerate deep learning tasks by providing the computational power to handle deep neural networks, which require intensive computation. These tasks often involve handling complex layers of computations that CPUs would process sequentially over longer periods. The parallel architecture of GPUs allows them to process multiple operations at once, significantly reducing the time required for model training and inference.
Some GPUs have features specific to deep learning, such as tensor cores, which enhance their performance for AI applications. These enhancements focus on increasing throughput for operations vital to deep learning, like matrix multiplications and convolutions. As a result, GPUs have been behind some of the biggest breakthroughs in fields like computer vision and natural language processing.
Performance Improvements in AI Model Training
AI model training benefits markedly from the performance improvements offered by GPUs, especially when dealing with large, complex datasets. The parallel processing capabilities of GPUs allow for faster computation of gradients and parameter updates, which are critical tasks in training neural networks. As a consequence, training times can be reduced significantly, enabling researchers and developers to iterate and refine models more quickly.
Enhanced performance with GPUs also leads to practical benefits such as reduced energy consumption and lower operational costs over time. Faster training phases and more efficient resource utilization mean that fewer computational resources are needed, reducing the workload on hardware and saving time and energy.
Popular GPU Platforms for AI
In order to use GPUs effectively in AI projects, you will need an entire ecosystem, which includes not only the hardware itself but also drivers, supporting software, and networking equipment. NVIDIA, AMD and Intel each provide a platform that offers this ecosystem. In addition, many organizations rely on third party providers hosting pre-configured GPU systems.
NVIDIA
NVIDIA is a leading player in the GPU market and one of the world’s fastest growing companies. Its GPUs are integral to AI applications, notably for their CUDA architecture which allows developers to program in a parallel-computing environment efficiently. This architecture has become a standard in academia and industry, facilitating widespread adoption of NVIDIA GPUs for AI research and development. Their ecosystem includes software, libraries, and development tools that enhance productivity and performance in AI workflows.
NVIDIA's GPUs are equipped with features specifically for machine learning and deep learning tasks. The introduction of tensor cores in their architectures resulted in significant performance improvements for AI computations, allowing deep learning tasks to execute faster and more efficiently. The company offers products ranging from data center-grade GPUs and massive-scale GPU servers, to lower-cost consumer-grade offerings.
AMD
AMD offers a competitive alternative in the GPU market, focusing on high-performance computing and graphics. Known for their open-source approach, AMD GPUs support various programming models and libraries through their ROCm (Radeon Open Compute) platform. This platform provides an ecosystem that allows AI developers to build, optimize, and deploy machine learning solutions effectively. AMD's commitment to openness has led to a supportive community and wide-ranging collaborations in AI research and development.
AMD GPUs are increasingly recognized for their performance in AI workloads. They have been optimized to deliver high throughput and efficiency, especially in applications requiring significant parallel processing capabilities. With recent advancements, AMD has closed the gap with competitors regarding performance and power efficiency, making their GPUs a viable option for AI applications seeking alternatives to dominant market players.
Intel
Intel, primarily known for its CPU technology, has also made strategic inroads into the GPU market with its dedicated graphics offerings. Intel's approach integrates GPUs with their x86 architecture, offering potential advantages in terms of compatibility and performance synergy with their existing CPU technologies. This integration allows for seamless transitions and optimizations in workloads that require both CPU and GPU resources.
Intel’s GPUs leverage the company's historical strengths in processing power and innovation in chip technology to deliver GPUs capable of handling AI workloads efficiently. Intel's focus on integrated solutions and its increasing investment into GPU development suggest an expanding role in the AI ecosystem. However, at the time of this writing, Intel is considered a niche player, with its solutions mainly catering to hybrid workloads including both AI and traditional applications.
Cloud-Hosted GPUs
Cloud hosting services offer GPUs as a way to scale AI applications without the need for substantial upfront hardware investments. Specialized hosting providers like Atlantic.net, and general-purpose cloud platforms like Amazon Web Services (AWS), provide cloud-based GPU options that can be tailored to the requirements of specific AI projects. These services allow developers to access powerful GPU technology on a pay-per-use basis, making them an attractive option for businesses looking to manage costs while leveraging high-performance AI capabilities.
Cloud-hosted GPUs provide flexibility and scalability for AI workloads, accommodating fluctuating demand with ease. The ability to spin up virtual machines with GPU acceleration makes it possible to handle peak processing requirements efficiently. Cloud providers also offer support and optimization tools, facilitating the deployment and management of AI models.
Related content: Read our guide to GPU cloud computing
Best GPUs for AI in 2024
NVIDIA A100
Specs:
CUDA Cores: 6,912
Tensor Cores: 432
Memory: 80 GB HBM2
Mixed-Precision Training: FP16, FP32
Multi-Instance GPU (MIG) Support
The NVIDIA A100 is a GPU for deep learning and high-performance computing tasks. Built on NVIDIA's Ampere architecture, it delivers substantial performance improvements, particularly for AI workloads. Equipped with tensor cores, the A100 accelerates both training and inference, significantly reducing the time required for deep learning computations. It supports mixed-precision training, which optimizes performance without sacrificing accuracy.
Its Multi-Instance GPU (MIG) capability allows the A100 to be partitioned into smaller instances. This enables more efficient use of the GPU, allowing multiple tasks to run concurrently, which is particularly beneficial in data center environments. With a memory capacity of up to 80 GB, it can handle massive datasets, making it useful for training complex models.
NVIDIA RTX A6000
Specs:
CUDA Cores: 10,752
Tensor Cores: 336
Memory: 48 GB GDDR6
Memory Bandwidth: 768 GB/s
Deep Learning Support: Mixed-Precision
The NVIDIA RTX A6000 is another GPU built on the Ampere architecture, designed for AI and visualization tasks. Its tensor cores enable accelerated deep learning operations, including fast matrix multiplications crucial for AI model training. The RTX A6000 is equipped with 48 GB of GDDR6 memory, providing ample space for handling large datasets and complex models.
Its high number of CUDA cores and AI-specific optimizations allow the RTX A6000 to deliver fast training and inference times. Though it's a professional-grade GPU, its AI-specific features and memory capacity make it an appropriate option for training neural networks and other AI workloads.
NVIDIA RTX 4090
Features:
CUDA Cores: 16,384
Tensor Cores: N/A
Memory: 24 GB GDDR6X
Memory Bandwidth: 1 TB/s
The NVIDIA RTX 4090, while primarily designed for gaming, is also capable of performing deep learning tasks. It boasts a high number of CUDA cores (16,384) and a memory bandwidth of 1 TB/s, enabling it to handle data-intensive AI operations efficiently. With 24 GB of GDDR6X memory, the RTX 4090 can manage small to medium-sized deep learning models, making it a feasible option for individual developers or smaller-scale AI applications.
However, it lacks the AI-specific features found in professional GPUs like the A100 and RTX A6000, such as tensor cores optimized for deep learning. While it can be used for AI tasks, it's less suited for large-scale or highly specialized deep learning workloads compared to NVIDIA's enterprise GPUs.
NVIDIA L40S GPU
Specs:
CUDA Cores: Accelerated FP32 throughput for graphics and compute tasks
Tensor Performance: 1,466 TFLOPS (FP8)
Single-Precision Performance: 91.6 TFLOPS
Memory: 48 GB GDDR6
Max Power Consumption: 350W
The NVIDIA L40S GPU is suitable for AI and data center applications, delivering performance improvements for AI computations and graphics-intensive tasks. Based on the Ada Lovelace architecture, it includes fourth-generation Tensor Cores and a Transformer Engine, which provide enhanced capabilities for deep learning tasks like large language model (LLM) training and inference.
With support for FP8 precision and TF32 computations, the L40S ensures fast processing speeds for AI workloads. The L40S also suits multi-workload environments, handling tasks ranging from generative AI to 3D rendering and video processing. Its 48 GB of memory and NVLink technology enable smooth scaling across multiple GPUs.
NVIDIA H100 NVL
Specs:
Memory: 94 GB HBM3
Tensor Cores: Fourth generation, supporting FP8 precision
NVLink Bandwidth: 600 GB/s
PCIe Gen5 support
The NVIDIA H100 NVL, part of the Hopper architecture, is purpose-built for large-scale AI training and inference tasks. It delivers 12x higher performance on GPT-3 175B models compared to previous generations. The GPU includes dual GPUs connected via NVLink, offering 188 GB of HBM3 memory, which is essential for massive datasets and training trillion-parameter models.
The Transformer Engine leverages FP8 precision, reducing memory consumption. Additionally, the H100 NVL is optimized for large AI clusters, supporting NVLink and PCIe Gen5, which ensure high-speed communication between GPUs. This scalability is useful for distributed AI workloads, making the H100 NVL suitable for enterprises working on large-scale AI systems.
GPU Features to Consider for AI Workloads
Total Core Count
When selecting a GPU for AI workloads, total core count is a critical factor. A higher number of cores allows for improved parallel processing capabilities, which is essential for efficiently handling the data-intensive calculations involved in AI and machine learning. This translates into faster processing times and the ability to manage larger datasets, enabling more complex models to be developed and refined quickly. A GPU's core count directly impacts its potential to perform compute-heavy tasks concurrently.
The core count also influences how well a GPU can manage diverse AI applications simultaneously. More cores provide the computational headroom needed for multitasking and executing multiple AI models in parallel. For researchers and developers running extensive AI experiments or production-level AI applications, selecting a GPU with a sufficient core count can significantly improve throughput and reduce time to insight.
Total Memory
Total memory on a GPU determines how much data can be stored and processed simultaneously, directly affecting the ability to handle large datasets and complex models in AI workloads. High memory capacity allows for the storage of entire models and their parameters, facilitating more efficient computation and reducing the need for data swapping between the GPU and system memory. This is especially important in deep learning, where model sizes and data volumes can be substantial.
A GPU with ample memory supports larger batch sizes during training, enhancing the efficiency of the training process. It also enables the execution of resource-intensive tasks without encountering memory bottlenecks, thus speeding up computations and improving model convergence rates.
Memory Clock Speed
Memory clock speed on a GPU determines the rate at which data is transferred from the GPU's memory to its cores for processing. Higher clock speeds enable faster data retrieval and processing, crucial for tasks that require quick access to large datasets, such as in AI and machine learning applications. A faster memory clock can significantly increase the throughput of data, optimizing the performance of AI workloads by minimizing delays and enhancing computational efficiency.
In scenarios where the GPU frequently alternates between data fetching and processing, having higher memory clock speed can reduce latency and improve overall system responsiveness. This speed is particularly beneficial in real-time AI applications, such as autonomous vehicles and online data analytics, where prompt decision-making is vital.
AI-Specific Hardware Optimizations
AI-specific hardware optimizations in GPUs, such as tensor cores and AI-accelerating algorithms, significantly enhance the performance of machine learning tasks. These optimizations are tailored to the intricate needs of AI workloads, offering capabilities for quicker matrix multiplications and reduced precision computations, which are central to deep learning processes. These dedicated hardware features ensure GPUs efficiently handle the unique complexities involved in training and deploying AI models.
Leveraging AI-specific hardware optimizations allows GPUs to achieve higher performance while maintaining improved power efficiency. This balance is crucial in deploying AI models in power-constrained environments like mobile devices or embedded systems. By utilizing these optimizations, developers can focus on model refinement and application innovation, rather than infrastructure limitations.
GPU Clock Speed
GPU clock speed, measured in MHz, dictates how many cycles per second a GPU can execute, affecting its ability to perform calculations. A higher GPU clock speed generally translates to faster processing of individual tasks, resulting in improved performance for AI applications that rely on quick sequential computations. While AI workloads are typically parallelized, having a high clock speed increases performance for tasks that require intensive processing on a single thread. This means the other factors mentioned above are typically more important for AI workload performance than raw GPU clock speed.
Optimizing GPU clock speed is essential for maximizing performance in AI training and inference. Faster clock speeds lead to quicker execution of operations, thereby reducing overall processing time for computationally heavy models. This speed enhancement is particularly beneficial in scenarios where time-bound solutions are necessary, such as real-time data processing and interactive AI systems.
Next-Gen Dedicated GPU Servers from Atlantic.Net, Accelerated by NVIDIA
Experience unparalleled performance with dedicated cloud servers equipped with the revolutionary NVIDIA accelerated computing platform.
Choose from the NVIDIA L40S GPU and NVIDIA H100 NVL to unleash the full potential of your generative artificial intelligence (AI) workloads, train large language models (LLMs), and harness natural language processing (NLP) in real time.
High-performance GPUs are superb at scientific research, 3D graphics and rendering, medical imaging, climate modeling, fraud detection, financial modeling, and advanced video processing.
Learn more about Atlantic.net GPU server hosting.
See Additional Guides on Key Machine Learning Topics
Together with our content partners, we have authored in-depth guides on several other topics that can also be useful as you explore the world of machine learning.
Vector Database
Authored by Instaclustr
[Guide] Top 10 Open Source Vector Databases
[Guide] How a Vector Index Works and 5 Critical Best Practices
[Blog] Apache Cassandra® Compaction Strategies
[Product] NetApp Instaclustr Data Platform
Auto Image Crop
Authored by Cloudinary
AI-Based Image Auto-Crop Algorithm Sticks to the Subject
Auto-Crop Images for Responsive Designs and Higher Quality
Cropping Images in Python With Pillow and OpenCV
AI Infrastructure
Authored by Cloudian
AI Infrastructure: Key Components & 6 Factors Driving Success
AI Storage: Optimized Storage for the AI Revolution
[Product] HyperStore Object Storage
### 17-Step PCI Compliance Checklist, Common Pitfalls and Solutions
What Is PCI Compliance?
PCI compliance is the practice of adhering to the payment card industry data security standards (PCI DSS), which are guidelines established to ensure businesses process, store, or transmit credit card information securely. It mandates a standard methodology for network security, encryption, and related practices to safeguard sensitive payment data.
PCI compliance involves fostering a secure transactional environment. Businesses that adhere to PCI DSS standards reduce the risk of security incidents. Non-compliance not only poses security risks but can also result in substantial fines and loss of reputation. Thus, PCI compliance is integral for organizations in the payment card industry.
This is part of a series of articles about PCI compliant hosting.
Preparing for a PCI DSS Audit
Preparedness for a PCI DSS audit involves meticulous planning and thorough understanding of compliance requirements. Establishing a compliance program and ensuring all relevant documentation is ready are crucial steps for a successful audit outcome.
Self-Assessment Questionnaires (SAQs)
Self-assessment questionnaires allow organizations to evaluate their compliance status in a structured manner. Depending on the company's level and type of transactions, specific SAQs are utilized to validate adherence to PCI DSS requirements, providing a snapshot of current security measures.
Completing SAQs accurately requires deep knowledge of internal security practices and systems. Organizations need to be honest and precise in their responses to ensure true reflection of compliance levels. This not only supports successful auditing but also guides in identifying areas needing improvement.
Working with a Qualified Security Assessor (QSA)
Organizations that process over 6 million transactions per annum are required to engage with a qualified security assessor (QSA). This is an organization that provides expert guidance in navigation of PCI DSS compliance. QSAs help identify gaps, recommend solutions, and ensure adherence to all aspects of PCI requirements, facilitating a smooth auditing process for businesses, especially those with complex environments.
Choosing a reputable QSA involves researching their credentials and experience with industry-specific compliance challenges. Collaborating closely with a QSA helps build a compliance plan, ensuring thorough preparation for audits and sustained PCI compliance post-evaluation.
The Complete PCI Compliance Checklist
1. Install and Maintain a Firewall Configuration to Protect Cardholder Data
A firewall acts as a barrier between trusted internal networks and untrusted external networks, making it a critical component for protecting cardholder data. Firewalls must be configured to block unauthorized access and only permit traffic that is necessary for the organization’s operations.
Best practices:
Define clear access control rules: Establish explicit firewall rules that dictate which IP addresses and services are allowed to access your network. This limits access to only necessary systems.
Regularly update firewall configurations: Ensure firewall rules are reviewed and updated regularly, especially when new applications, devices, or users are added to the network.
Log and monitor traffic: Enable logging on the firewall to monitor both inbound and outbound traffic, and regularly review these logs for suspicious activity.
Segment the cardholder data environment (CDE): Isolate systems that store or process cardholder data from other network components to minimize potential attack vectors.
2. Avoid Using Vendor-Supplied Defaults for System Passwords and Other Security Parameters
Vendor-supplied default passwords and settings are well-known across the industry and are often the first point of attack for cybercriminals. Upon installation of any system or software, it is essential to change these defaults immediately. Strong password policies should be enforced, including the use of complex passwords that combine letters, numbers, and special characters.
Best practices:
Change default settings immediately: After installing hardware or software, update all default usernames and passwords to stronger, unique credentials.
Implement complex password policies: Require passwords that include a mix of upper and lower-case letters, numbers, and special characters, with a minimum length of 12 characters.
Disable unused accounts: Remove or disable any default accounts that are not necessary for the operation of your system.
Enforce regular password changes: Ensure all administrative passwords are changed periodically and following a set schedule, particularly for critical systems.
3. Protect Stored Cardholder Data (Encrypt, Truncate, Mask, or Hash)
Organizations must ensure that all stored cardholder data is protected using strong encryption methods, such as advanced encryption standard (AES) with a 256-bit key. In addition to encryption, data masking, truncation, or hashing should be employed to minimize exposure.
Best practices:
Use strong encryption: Apply AES-256 encryption for all stored cardholder data, ensuring data is unreadable without proper authorization.
Limit data retention: Only store cardholder data when absolutely necessary, and remove any unnecessary data as soon as possible.
Use tokenization: Implement tokenization to replace sensitive cardholder data with a non-sensitive equivalent (token), which cannot be used outside of your system.
Mask data where applicable: Display only the last four digits of a card number for employees or customers who do not require full access to sensitive data.
4. Encrypt Transmission of Cardholder Data Across Open, Public Networks
Any cardholder data transmitted over open or public networks, such as the Internet, must be encrypted using strong cryptographic protocols. transport layer security (TLS) 1.3 or higher is recommended to safeguard data from interception or tampering.
Best practices:
Use TLS 1.3 or higher: Ensure that all transmitted cardholder data is encrypted using TLS 1.3 or higher for secure communications across public networks.
Disable weak protocols and ciphers: Deactivate outdated encryption protocols such as SSL and weaker ciphers to reduce vulnerabilities in data transmission.
Monitor for certificate expiry: Regularly check and renew SSL/TLS certificates before they expire to avoid insecure communications.
Mask Primary Account Numbers (PANs): Ensure PANs are masked when displayed on device screens or physical receipts.
5. Protect All Systems Against Malware and Regularly Update Anti-Virus Software
To defend against malware attacks, organizations must install and maintain anti-virus software across all systems that interact with cardholder data. This includes point-of-sale (POS) devices, servers, and workstations.
Best practices:
Use next-generation anti-virus (NGAV) Software: Implement advanced anti-virus software that includes real-time threat detection and prevention.
Enable automatic updates: Configure all anti-virus programs to automatically download and install updates to protect against the latest malware variants.
Run regular scans: Schedule routine system scans to detect any potential malware or viruses on all systems, including servers and endpoints.
6. Develop and Maintain Secure Systems and Applications
Secure development practices are critical to ensuring that applications and systems are resistant to cyberattacks. This includes conducting regular vulnerability assessments and applying security patches as soon as they become available.
Best practices:
Apply security patches promptly: As soon as new patches are available for software or systems, apply them immediately to close known vulnerabilities.
Conduct regular code reviews: Perform thorough security code reviews for all internally developed applications to identify and fix potential vulnerabilities.
Use multi-factor authentication (MFA): Require MFA for administrative access to systems and applications to add an extra layer of security.
Implement web application firewalls (WAFs): Deploy WAFs to protect web applications from common attacks such as SQL injection and cross-site scripting (XSS).
7. Restrict Access to Cardholder Data by Business Need-to-Know
Access to cardholder data must be strictly limited to employees and systems that require it to perform their job functions. role-based access control (RBAC) should be used to enforce the principle of least privilege, ensuring that only authorized individuals can access sensitive data.
Best practices:
Implement role-based access control (RBAC): Assign access rights based on roles and job functions, ensuring that employees can only access cardholder data necessary for their work.
Regularly review access permissions: Conduct periodic audits of user permissions to ensure access levels remain appropriate and revoke access for users who no longer need it.
Use the principle of least privilege: Grant the minimum level of access required for users to perform their tasks, minimizing the risk of accidental or malicious data exposure.
8. Assign a Unique ID to Each Person with Computer Access
To ensure accountability and traceability, each individual who accesses systems that handle cardholder data must have a unique identifier. This allows organizations to monitor and log all activities performed by each user. Unique IDs also help identify unauthorized or suspicious behavior in the event of a security incident.
Best practices:
Create unique user accounts: Ensure that each employee or contractor has their own unique username and password for system access, rather than sharing accounts.
Monitor for unauthorized access attempts: Set up automated alerts for suspicious login activities, such as repeated failed access attempts or logins from unusual locations.
Enforce account lockouts: Implement account lockout mechanisms after a certain number of failed login attempts to protect against brute-force attacks.
9. Restrict Physical Access to Cardholder Data
Physical security is just as important as digital security when it comes to protecting cardholder data. Data centers, servers, and other devices that store or process cardholder data should be located in secure facilities with restricted access.
Best practices:
Secure physical locations: Use access control mechanisms such as key cards, biometrics, or PINs to restrict entry to areas where cardholder data is stored or processed.
Deploy surveillance systems: Install security cameras to monitor entry points and sensitive areas, maintaining records of physical access to data centers and server rooms.
Monitor physical access: Maintain logs of all personnel who access secure areas and regularly review these logs for any unauthorized access.
Use tamper-evident seals: Place tamper-evident seals on physical media, such as backup tapes, to detect and deter unauthorized access or alteration.
10. Track and Monitor All Access to Network Resources and Cardholder Data
To detect and respond to security incidents, it is critical to track and monitor all access to network resources and cardholder data. Comprehensive logging should be enabled across all systems, capturing key details such as user activity, system changes, and data access.
Best practices:
Implement centralized logging: Use a centralized logging system to collect logs from all network resources, making it easier to analyze access patterns and detect anomalies.
Enable real-time monitoring: Set up tools for real-time monitoring of access to cardholder data and critical systems, triggering alerts for any suspicious activity.
Retain logs for compliance: Ensure logs are retained for at least one year, with a minimum of three months immediately available for analysis in case of an incident.
11. Regularly Test Security Systems and Processes
Organizations must regularly test their security systems and processes to ensure that they are functioning as intended and capable of protecting cardholder data. Regular testing helps identify weaknesses that could be exploited by attackers, allowing organizations to address them before they become security incidents.
Best practices:
Conduct quarterly vulnerability scans: Perform vulnerability scans at least once per quarter, both internally and externally, to identify security weaknesses in your network and systems.
Perform annual penetration tests: Engage a qualified security expert to conduct penetration testing at least once a year to simulate real-world attacks and identify exploitable vulnerabilities.
Test security controls after significant changes: Whenever there are changes to the network infrastructure, such as new software installations or configuration updates, perform security testing to ensure no new vulnerabilities are introduced.
12. Maintain a Policy That Addresses Information Security for All Personnel
Every organization handling cardholder data should establish an information security policy that outlines the roles, responsibilities, and expectations for all personnel. This policy should cover key areas such as data protection, access control, and incident response.
Best practices:
Define clear security roles and responsibilities: Ensure the information security policy clearly outlines the responsibilities of all personnel in maintaining data security.
Conduct security awareness training: Provide ongoing training for employees to educate them on security risks, phishing attacks, password hygiene, and other key security principles.
Enforce disciplinary measures for non-compliance: Establish clear disciplinary actions for employees who fail to adhere to security policies, ensuring accountability.
13. Ensure That Service Providers Handle Cardholder Data Securely
When working with third-party service providers that process or store cardholder data, organizations must conduct thorough due diligence to ensure that these providers comply with PCI DSS.
Best practices:
Conduct due diligence before onboarding: Perform thorough evaluations of third-party service providers before signing contracts, ensuring they meet PCI DSS requirements.
Include security clauses in contracts: Ensure contracts with service providers specify that they must maintain PCI DSS compliance and are responsible for protecting cardholder data.
Request regular compliance attestations: Require service providers to provide proof of PCI DSS compliance, such as reports on compliance (ROCs) or attestation of compliance (AOCs), on an annual basis.
14. Ensure That Cloud Providers Comply with PCI DSS Requirements
If an organization uses cloud services to store or process cardholder data, it must ensure that the cloud provider complies with PCI DSS. This includes understanding the shared responsibility model, where both the organization and the cloud provider share responsibilities for securing the data.
Best practices:
Understand the shared responsibility model: Clearly define which aspects of PCI DSS compliance are the responsibility of the cloud provider and which are the responsibility of your organization.
Review the cloud provider’s compliance certifications: Request documentation such as AOCs or ROCs to confirm that the cloud provider has been audited and complies with PCI DSS.
Audit the cloud provider’s security practices: Regularly assess the cloud provider’s security practices, ensuring they maintain strong security controls, including access management and encryption.
Learn more in our detailed guide to cloud PCI compliance.
15. Encrypt Sensitive Data Stored and Transmitted in Cloud Environments
To protect cardholder data stored and transmitted in cloud environments, encryption must be applied both at rest and in transit. Strong encryption algorithms, such as AES-256, should be used, and encryption keys must be managed securely, with access restricted to authorized personnel only.
Best practices:
Apply AES-256 encryption for data at rest: Ensure all sensitive data stored in cloud environments is encrypted using AES-256 to protect it from unauthorized access.
Use TLS 1.2 or higher for data in transit: Encrypt all data transmitted between your organization and the cloud provider using TLS 1.2 or higher, to prevent interception during transmission.
Implement secure key management practices: Use a dedicated key management service (KMS) to securely generate, store, and rotate encryption keys, limiting access to authorized personnel only.
16. Develop an Incident Response Plan for Handling a Data Breach
An incident response plan is crucial for minimizing the damage caused by a data breach. The plan should outline the steps to be taken when a security incident occurs, including roles and responsibilities, communication protocols, and procedures for containing, investigating, and recovering from the breach.
Best practices:
Define clear incident response procedures: Document specific steps to follow in case of a breach, including containment, investigation, and remediation processes.
Assign roles and responsibilities: Identify key personnel who will be responsible for managing various aspects of the breach, such as communication, investigation, and legal responses.
Create communication protocols: Develop communication plans for notifying affected customers, regulatory bodies, and other stakeholders in the event of a breach.
17. Ensure Regular Testing of the Incident Response Plan
The incident response plan should not only be well-documented but also regularly tested through simulations and tabletop exercises. These tests help identify weaknesses in the plan and allow organizations to refine their response strategies.
Best practices:
Conduct annual tabletop exercises: Simulate a security breach scenario and involve key personnel to walk through the response steps, identifying potential gaps in the process.
Test for various incident types: Ensure the incident response plan is tested for different breach scenarios, such as malware attacks, insider threats, or data leaks.
Involve third-party security experts: Engage third-party consultants to review and test your incident response plan, ensuring an objective assessment of your preparedness.
Review and update incident response plans: Periodically review the plan to adapt to evolving threats and incorporate lessons from previous security incidents.
Common Challenges in Achieving PCI Compliance
Here are common challenges your organization might face when building a PCI compliance program.
Scope Creep and Identifying Cardholder Data Environment
Scope creep occurs when unmonitored changes lead to expanded data environments, complicating compliance efforts. Identifying and maintaining a well-defined cardholder data environment is crucial for compliance. This requires mapping data flows and isolating environments to ensure only relevant systems fall within the compliance scope.
Addressing the challenge:
Implementing consistent monitoring practices, documentation, and boundary definitions helps manage scope creep effectively. Accurate scoping not only supports compliance but also enables organizations to apply focused security measures, safeguarding sensitive information.
Keeping Up With Changing Compliance Requirements
Compliance requirements frequently evolve to address new security threats, presenting challenges for organizations in maintaining up-to-date protocols. This demands continuous vigilance and adaptability, ensuring policies and procedures align with current standards. Adequate resource allocation towards research and compliance updates is crucial in smooth transitions.
Addressing the challenge:
Organizations should cultivate a proactive compliance culture, engaging in regular training and awareness initiatives for employees. Staying abreast of industry changes and collaborating with experts aids in anticipating requirements, facilitating prompt adaptation to revised compliance mandates.
Managing Third-Party Service Providers
Third-party service providers can introduce vulnerabilities into the cardholder data environment if not properly managed. Ensuring third-party compliance involves due diligence in vendor selection, ongoing assessments, and clear agreements aligning security practices with PCI DSS standards. Collaborative approaches are key in reducing associated risks.
Addressing the challenge:
Routine audits and contractual obligations help enforce compliance across third-party interactions, maintaining oversight on data handled externally. Transparency and effective communication between organizations and their providers ensure alignment on security objectives.
PCI Hosting Services and Solutions by Atlantic.Net
PCI Hosting by Atlantic.Net™ is SOC 2 and SOC 3 certified, designed to secure and protect critical health data, audited by a qualified and an independent third-party CPA firm. If your company requires PCI-DSS compliance (Payment Card Industry Data Security Standard), Atlantic.Net's managed security and compliance hosting services coupled with our Cloud Platform and Dedicated Hosting will provide you the easy button to help achieve and exceed your credit card industry PCI compliance requirements!
With our expanded network capacity and hardened data centers, your business will be able to achieve the uptime and cyber-security requirements for PCI compliance. You can meet your customers' needs and accept online payments while maintaining PCI compliance and reducing your overall cost. Gain the competitive advantage you need with ease with our PCI-Compliant Hosting, backed by a 100% SLA.
Learn more about Atlantic.net PCI-compliant web hosting.
### Building a Streamlit App on a GPU Server with NumPy, Pandas, and PyTorch
Streamlit is a popular tool for creating interactive and user-friendly web applications for data science and machine learning projects. It simplifies building dashboards and visualizations with Python. When integrated with powerful libraries like NumPy, Pandas, and PyTorch, Streamlit enables developers to create feature-rich, GPU-accelerated applications.
In this guide, we will build a Streamlit app on a GPU server. The app will use NumPy for numerical computations, Pandas for data manipulation, and PyTorch for deep learning tasks.
Prerequisites
Before starting, ensure you have the following:
An Ubuntu 22.04 Cloud GPU Server.
CUDA Toolkit and cuDNN Installed.
A root or sudo privileges.
Step 1: Install Required Packages
The first step is to update the server's package index and install the necessary libraries for your application.
1. Update the package index.
apt update -y
2. Install PyTorch and its related libraries using the following command:
pip install torch torchvision torchaudio --index-url https://download.pytorch.org/whl/cu124
3. Install Streamlit, along with NumPy, Pandas, and Matplotlib, for building and visualizing your app:
pip install streamlit numpy pandas matplotlib
Step 2: Set Up the Project
1. Create a directory for the project.
mkdir streamlit_gpu_app
2. Navigate it to your project directory.
cd streamlit_gpu_app
3. Create a Python script that defines your Streamlit application:
nano gpu_calculator.py
Add the following code:
import streamlit as st
import numpy as np
import pandas as pd
import torch
# Title
st.title("Streamlit App with GPU Computations")
# Sidebar for user input
st.sidebar.header("Choose an Operation")
operation = st.sidebar.selectbox("Select a computation:", [
"Matrix Multiplication (NumPy)",
"DataFrame Operations (Pandas)",
"Tensor Computations (PyTorch)",
"Train and Test a Deep Learning Model"
])
# Main app functionality
if operation == "Matrix Multiplication (NumPy)":
st.header("Matrix Multiplication with NumPy")
# User inputs for matrix dimensions
rows = st.number_input("Number of rows:", min_value=1, max_value=1000, value=3)
cols = st.number_input("Number of columns:", min_value=1, max_value=1000, value=3)
if st.button("Generate and Multiply Matrices"):
# Generate random matrices
matrix_a = np.random.rand(rows, cols)
matrix_b = np.random.rand(cols, rows)
# Perform matrix multiplication
result = np.dot(matrix_a, matrix_b)
st.write("Matrix A:")
st.write(matrix_a)
st.write("Matrix B:")
st.write(matrix_b)
st.write("Resultant Matrix:")
st.write(result)
elif operation == "DataFrame Operations (Pandas)":
st.header("DataFrame Operations with Pandas")
# Generate a random DataFrame
rows = st.number_input("Number of rows:", min_value=1, max_value=1000, value=10)
if st.button("Generate DataFrame"):
df = pd.DataFrame(
np.random.rand(rows, 5),
columns=["A", "B", "C", "D", "E"]
)
st.write("Randomly Generated DataFrame:")
st.write(df)
st.write("Column Summaries:")
st.write(df.describe())
elif operation == "Tensor Computations (PyTorch)":
st.header("Tensor Computations with PyTorch")
# Tensor size input
tensor_size = st.number_input("Tensor Size:", min_value=1, max_value=10000, value=3)
if st.button("Generate Tensor and Compute"):
# Generate random tensor on GPU
tensor_a = torch.rand(tensor_size, tensor_size, device="cuda")
tensor_b = torch.rand(tensor_size, tensor_size, device="cuda")
# Perform matrix multiplication on GPU
result = torch.matmul(tensor_a, tensor_b)
st.write("Tensor A:")
st.write(tensor_a.cpu().numpy())
st.write("Tensor B:")
st.write(tensor_b.cpu().numpy())
st.write("Resultant Tensor:")
st.write(result.cpu().numpy())
elif operation == "Train and Test a Deep Learning Model":
st.header("Train and Test a Deep Learning Model")
# User input for dataset size
num_samples = st.number_input("Number of Samples:", min_value=100, max_value=10000, value=1000)
num_features = st.number_input("Number of Features:", min_value=1, max_value=100, value=10)
if st.button("Train Model"):
# Generate random data
X = torch.rand(num_samples, num_features, device="cuda")
y = torch.sum(X, dim=1) + torch.randn(num_samples, device="cuda") * 0.1 # Add noise
# Define a simple model
model = torch.nn.Sequential(
torch.nn.Linear(num_features, 50),
torch.nn.ReLU(),
torch.nn.Linear(50, 1)
).to("cuda")
# Loss and optimizer
criterion = torch.nn.MSELoss()
optimizer = torch.optim.Adam(model.parameters(), lr=0.01)
# Train the model
epochs = 50
for epoch in range(epochs):
optimizer.zero_grad()
predictions = model(X)
loss = criterion(predictions.squeeze(), y)
loss.backward()
optimizer.step()
st.success(f"Training complete! Final Loss: {loss.item():.4f}")
# Test the model
test_data = torch.rand(10, num_features, device="cuda")
test_predictions = model(test_data)
st.write("Test Data:")
st.write(test_data.cpu().numpy())
st.write("Predictions:")
st.write(test_predictions.cpu().detach().numpy())
Here is the explanation:
The code creates a Streamlit web app with a sidebar for choosing different operations.
Based on the selection, it can do matrix multiplication with NumPy, DataFrame tasks with Pandas, or tensor computations on GPU with PyTorch.
It also trains and tests a simple deep learning model using PyTorch.
User inputs for data size and model parameters are taken from the Streamlit interface.
Results, such as matrices, data summaries, or model predictions, are displayed directly in the browser.
Step 3: Run the Streamlit App
You can now run the app using the server’s IP address. Replace with your server's IP address.
streamlit run gpu_calculator.py --server.address your-server-ip --server.port 8501
You will see the below output.
You can now view your Streamlit app in your browser.
URL: http://your-server-ip:8501
Note: Replace the your-server-ip with the actual IP address of the GPU server.
Step 4: Accessing the App in a Web Browser
Open your web browser and access your app using the URL http://your-server-ip:8501. The app loads with a sidebar containing operation options. Users can navigate to desired features like NumPy, Pandas, or PyTorch computations.
1. Matrix Multiplication with NumP
Input dimensions in the sidebar and click "Generate and Multiply Matrices." The result displays Matrix A, Matrix B, and the resultant matrix.
2. DataFrame Operations with Pandas
Input the number of rows in the sidebar and click "Generate DataFrame." A DataFrame is displayed along with column summaries.
3. Tensor Computations with PyTorch
Input tensor size in the sidebar and click "Generate Tensor and Compute." Tensors and results are shown with GPU acceleration.
4. Train and Test a Deep Learning Model
Input dataset parameters in the sidebar and click "Train Model." The model trains for 50 epochs, and test predictions are displayed.
Conclusion
This guide has walked you through the entire process—from setting up your environment and writing modular code to deploying and interacting with the app in a web browser. Each functionality, from NumPy matrix operations to training a deep learning model with PyTorch, demonstrates the flexibility and efficiency of this setup. Try it today on GPU hosting from Atlantic.Net!
### Building a GPU-Powered Web Interface with Gradio and CuPy on Atlantic.Net GPU Server
GPUs (Graphics Processing Units) are indispensable for high-performance computations. They excel at parallel processing, making them ideal for tasks such as machine learning, data analysis, and scientific computations. When paired with intuitive tools like Gradio and CuPy, GPUs become even more accessible, enabling developers to build interactive and efficient applications for real-world use cases.
This guide demonstrates how to set up a GPU-powered web interface for performing arithmetic computations using Atlantic.Net GPU servers.
Prerequisites
Before starting, ensure you have the following:
An Ubuntu 22.04 Cloud GPU Server.
CUDA Toolkit and cuDNN Installed.
A root or sudo privileges.
Step 1: Installing Required Libraries
To perform GPU-accelerated computations, you need the CuPy library, which provides an interface similar to NumPy but runs operations on the GPU. Additionally, Gradio simplifies the creation of a web interface.
Run the following command to install these libraries:
pip install cupy-cuda12x gradio
To verify the installation, execute:
python3 -c "import cupy as cp; print(cp.arange(10).sum())"
Expected output:
45
This output confirms that CuPy is installed correctly and leveraging the GPU for computations.
Step 2: Writing the Application
We will now create a Python application (app.py) that performs GPU-based arithmetic operations and hosts a web interface.
Use a text editor such as nano to create the application file:
nano app.py
Add the following code:
import gradio as gr
import cupy as cp
def gpu_arithmetic(num_elements, operation):
a = cp.arange(num_elements, dtype=cp.float32)
b = cp.arange(num_elements, dtype=cp.float32)
if operation == "Add":
result = a + b
elif operation == "Multiply":
result = a * b
elif operation == "Dot Product":
result = cp.dot(a, b)
return f"Result: {result}"
return f"First 10 elements: {result[:10].get()}"
iface = gr.Interface(
fn=gpu_arithmetic,
inputs=[
gr.Number(label="Number of Elements"),
gr.Dropdown(choices=["Add", "Multiply", "Dot Product"], label="Operation")
],
outputs="text",
description="Perform GPU arithmetic on two arrays of the given length."
)
iface.launch(server_name="0.0.0.0", server_port=8888, share=False)
This script does the following:
Defines the gpu_arithmetic Function: Performs operations (Add, Multiply, Dot Product) on two arrays using CuPy.
Sets Up the Gradio Interface: Creates an interactive web interface with:
Inputs: Number of elements and operation type.
Output: Result of the computation.
Launches the Interface: Hosts the application on port 8888.
Step 3: Running the Application
You can now run the application using the following command.
python3 app.py
The output should display something like:
Running on local URL: http://0.0.0.0:8888
Step 4: Access the Gradio Web UI
1. Open a web browser and navigate to http://your-server-IP:8888. Replace your-server-IP with your Atlantic.Net server’s public IP address.
2. Specify the array's number in the given field, select the "Add" operation, and click Submit. This will add the corresponding elements of two arrays and display the result.
3. Specify the number of the array in the given field, select the "Multiply" operation, and click Submit. This will multiply the corresponding elements of two arrays and display the result.
4. Specify the array's number in the given field, select the "Dot Product" operation, and click Submit. This will compute the dot product of two arrays and display the result.
Conclusion
Setting up a GPU-powered web interface using Gradio and CuPy on an Atlantic.Net GPU server is a powerful way to handle heavy computations. With CuPy, you can perform fast, GPU-accelerated operations, and Gradio makes it easy to create an interactive web interface for users to access these capabilities.
### How to Deploy MLFlow on a Kubernetes Cluster
MLFlow is a powerful, open-source platform designed to manage the entire lifecycle of machine learning (ML) development. It provides tools for tracking experiments, packaging code, and deploying models. By deploying MLFlow on a Kubernetes cluster, you can leverage scalability, reliability, and GPU support for ML workloads.
This guide provides a detailed, step-by-step walkthrough for setting up MLFlow on a Kubernetes cluster.
Prerequisites
Before starting, ensure you have the following:
An Ubuntu 22.04 Cloud GPU Server.
CUDA Toolkit, cuDNN and Helm Installed.
A root or sudo privileges.
Step 1: Install and Configure K3s
K3s is a lightweight Kubernetes distribution that is ideal for quick setups. Install it using the following command:
curl -sfL https://get.k3s.io | sh -
After installation, copy the K3s configuration file to your kubeconfig directory for kubectl to interact with the cluster:
cp /etc/rancher/k3s/k3s.yaml ~/.kube/config
Confirm the Kubernetes cluster is up and running by checking the node status:
kubectl get nodes
Expected output:
NAME STATUS ROLES AGE VERSION
ubuntu Ready control-plane,master 9s v1.31.3+k3s1
Step 2: Install NVIDIA Container Toolkit
To enable GPU support in your Kubernetes cluster, install the NVIDIA container toolkit:
1. Add the NVIDIA repository and import its GPG key:
curl -fsSL https://nvidia.github.io/libnvidia-container/gpgkey | gpg --dearmor -o /usr/share/keyrings/nvidia-container-toolkit-keyring.gpg && curl -s -L https://nvidia.github.io/libnvidia-container/stable/deb/nvidia-container-toolkit.list | sed 's#deb https://#deb [signed-by=/usr/share/keyrings/nvidia-container-toolkit-keyring.gpg] https://#g' | tee /etc/apt/sources.list.d/nvidia-container-toolkit.list
2. Update and install the toolkit:
apt-get update
apt-get install -y nvidia-container-toolkit
3. Verify the installation:
nvidia-container-cli --version
Output.
cli-version: 1.17.3
lib-version: 1.17.3
build date: 2024-12-04T09:47+00:00
4. Deploy the NVIDIA plugin to manage GPUs in your Kubernetes cluster:
kubectl apply -f https://raw.githubusercontent.com/NVIDIA/k8s-device-plugin/v0.13.0/nvidia-device-plugin.yml
Step 3: Configure Persistent Storage for MLFlow
MLFlow requires persistent storage to save experiment data and models. Create and configure a Persistent Volume (PV) and Persistent Volume Claim (PVC):
1. Create a YAML file for the PV and PVC configuration:
nano mlflow-pv-pvc.yaml
Add the following content:
apiVersion: v1
kind: PersistentVolume
metadata:
name: mlflow-pv
labels:
type: local
spec:
storageClassName: manual
capacity:
storage: 10Gi
accessModes:
- ReadWriteOnce
hostPath:
path: "/mnt/data"
---
apiVersion: v1
kind: PersistentVolumeClaim
metadata:
name: mlflow-pvc
spec:
storageClassName: manual
accessModes:
- ReadWriteOnce
resources:
requests:
storage: 10Gi
2. Apply the configuration:
kubectl apply -f mlflow-pv-pvc.yaml
3. Verify the PV and PVC:
kubectl get pv
Output.
NAME CAPACITY ACCESS MODES RECLAIM POLICY STATUS CLAIM STORAGECLASS VOLUMEATTRIBUTESCLASS REASON AGE
mlflow-pv 10Gi RWO Retain Available manual 6s
kubectl get pvc
Output.
NAME STATUS VOLUME CAPACITY ACCESS MODES STORAGECLASS VOLUMEATTRIBUTESCLASS AGE
mlflow-pvc Bound mlflow-pv 10Gi RWO manual 15
Step 4: Deploy MLFlow Using Helm
1. Add the Helm chart repository for MLFlow:
helm repo add community-charts https://community-charts.github.io/helm-charts
2. Update the Helm repository.
helm repo update
3. Install MLFlow using Helm:
helm install atlantic community-charts/mlflow
Output.
NAME: atlantic
LAST DEPLOYED: Wed Dec 18 09:43:10 2024
NAMESPACE: default
STATUS: deployed
REVISION: 1
TEST SUITE: None
NOTES:
Get the application URL by running these commands:
export POD_NAME=$(kubectl get pods --namespace default -l "app.kubernetes.io/name=mlflow,app.kubernetes.io/instance=atlantic" -o jsonpath="{.items[0].metadata.name}")
export CONTAINER_PORT=$(kubectl get pod --namespace default $POD_NAME -o jsonpath="{.spec.containers[0].ports[0].containerPort}")
echo "Visit http://127.0.0.1:8080 to use your application"
kubectl --namespace default port-forward $POD_NAME 8080:$CONTAINER_PORT
4. Verify that MLFlow has been successfully deployed:
kubectl get deployments
Output.
NAME READY UP-TO-DATE AVAILABLE AGE
atlantic-mlflow 1/1 1 1 70s
Step 5: Expose MLFlow Service
1. To make MLFlow accessible, create a service:
nano mlflow-service.yaml
Add the following configuration:
apiVersion: v1
kind: Service
metadata:
name: mlflow-service
spec:
selector:
app: mlflow
ports:
- protocol: TCP
port: 80
targetPort: 5000
nodePort: 30001 # Optional, or let Kubernetes assign a random NodePort
type: NodePort
2. Deploy the service.
kubectl apply -f mlflow-service.yaml
3. Check the services running in your cluster.
kubectl get services
Output.
NAME TYPE CLUSTER-IP EXTERNAL-IP PORT(S) AGE
atlantic-mlflow ClusterIP 10.43.183.234 5000/TCP 28m
kubernetes ClusterIP 10.43.0.1 443/TCP 35m
mlflow-service NodePort 10.43.158.142 80:30001/TCP 10m
Note: Note down the IP 10.43.158.142 shown in the CLUSTER-IP column.
Step 6: Run the MLFlow Experiment
1. Create a directory for your models.
mkdir Models
cd Models
2. Install the required Python packages.
pip install mlflow scikit-learn shap matplotlib
3. Set environment variables.
export MLFLOW_EXPERIMENT_NAME='my-sample-experiment'
export MLFLOW_TRACKING_URI='http://10.43.158.142'
Note: Replaced 10.43.158.142 with your CLUSTER-IP shown in the previous step.
4. Create a Python script (main.py) and add your ML experiment code.
nano main.py
Add the following code:
# Import Libraries
import os
import numpy as np
import shap
from sklearn.datasets import load_diabetes
from sklearn.linear_model import LinearRegression
import mlflow
from mlflow.artifacts import download_artifacts
from mlflow.tracking import MlflowClient
# Prepare the Training Data
X, y = load_diabetes(return_X_y=True, as_frame=True)
X = X.iloc[:50, :4]
y = y.iloc[:50]
# Train a model
model = LinearRegression()
model.fit(X, y)
# Log an explanation
with mlflow.start_run() as run:
mlflow.shap.log_explanation(model.predict, X)
# List Artifacts
client = MlflowClient()
artifact_path = "model_explanations_shap"
artifacts = [x.path for x in client.list_artifacts(run.info.run_id, artifact_path)]
print("# artifacts:")
print(artifacts)
# Load the logged explanation
dst_path = download_artifacts(run_id=run.info.run_id, artifact_path=artifact_path)
base_values = np.load(os.path.join(dst_path, "base_values.npy"))
shap_values = np.load(os.path.join(dst_path, "shap_values.npy"))
# Show a Force Plot
shap.force_plot(float(base_values), shap_values[0, :], X.iloc[0, :], matplotlib=True)
5. Run the script.
python3 main.py
Output.
100%|██████████████████████████████████████████████████████████████████████████████████████████████████████████████████████████████████| 50/50 [00:00<00:00, 249.00it/s]
🏃 View run persistent-frog-660 at: http://10.43.158.142/#/experiments/1/runs/e19dbaac59fe452bab13217fcc9aac49
🧪 View experiment at: http://10.43.158.142/#/experiments/1
# artifacts:
['model_explanations_shap/base_values.npy', 'model_explanations_shap/shap_values.npy', 'model_explanations_shap/summary_bar_plot.png']
Step 7: Copy Kubeconfig to the Local Machine
To manage your Kubernetes cluster remotely, copy the kubeconfig file from the server to your local machine.
1. Create a .kube directory in your local machine.
mkdir .kube
2. Copy the kubeconfig file from your server.
scp root@server-ip:/root/.kube/config .kube/
3. Edit the kubeconfig file.
nano .kube/config
Find the following line:
server: https://127.0.0.1:6443
And replace it with the following:
server: https://your-server-ip:6443
4. Verify connectivity.
kubectl get services
Output.
NAME TYPE CLUSTER-IP EXTERNAL-IP PORT(S) AGE
atlantic-mlflow ClusterIP 10.43.183.234 5000/TCP 28m
kubernetes ClusterIP 10.43.0.1 443/TCP 35m
mlflow-service NodePort 10.43.158.142 80:30001/TCP 10m
Step 8: Access MLFlow UI
To access the MLFlow UI from your local machine, you will need to forward the MLFlow service on that machine.
kubectl port-forward svc/mlflow-service 8880:80
Output.
Forwarding from 127.0.0.1:8880 -> 5000
Forwarding from [::1]:8880 -> 5000
Now, open your web browser and access the MLFlow UI at http://127.0.0.1:8880/#/experiments/1
Conclusion
You’ve successfully deployed MLFlow on a Kubernetes cluster, configured it for GPU support, and run a sample experiment. This setup can be extended to manage and track ML experiments for production-scale applications. Try it today on GPU hosting from Altantic.Net!
### AI Face Restoration using GFPGAN on Atlantic.Net Cloud GPU
GFPGAN (Generative Facial Prior GAN) is a powerful tool developed by the TencentARC team for restoring old, damaged, or low-quality facial images. By leveraging generative models, GFPGAN can enhance facial details, improve resolution, and deliver more realistic restorations compared to traditional image enhancement methods. Using a GPU-accelerated environment is highly recommended for faster inference times when working on multiple images or high-resolution inputs.
This guide will walk you through the process of setting up GFPGAN for AI-powered face restoration on an Atlantic.Net Cloud GPU server.
Prerequisites
Before starting, ensure you have the following:
An Ubuntu 22.04 Cloud GPU Server.
CUDA Toolkit and cuDNN Installed.
A root or sudo privileges.
Update and Upgrade Packages
Before starting, it’s always good practice to ensure your system is up to date:
apt update
apt upgrade
Install Python 3 and Pip
Ubuntu 22.04 should have Python 3 and pip installed by default. If not, run:
apt install -y python3 python3-pip
Install Torch with CUDA Support
GFPGAN requires PyTorch for model inference. Install the appropriate PyTorch version for CUDA support.
pip install torch==2.1.2+cu118 torchvision==0.16.2+cu118 --index-url https://download.pytorch.org/whl/cu118
The --index-url option points pip to PyTorch’s CUDA 11.8 wheel index.
Download the GFPGAN Repository
Next, we’ll download the GFPGAN source code from GitHub:
git clone https://github.com/TencentARC/GFPGAN.git
Once the download is completed, change the directory to the GFPGAN.
cd GFPGAN
Install Dependent Packages
1. Install basicsr and facexlib for face detection and image restoration operations.
pip install basicsr facexlib
2. Install all the Python dependencies listed in GFPGAN’s requirements.txt. These may include image-processing libraries, PyTorch-related tools, and other necessary packages.
pip install -r requirements.txt
3. Install GFPGAN in a “development” mode. It allows you to run GFPGAN as a module and integrate its code changes immediately.
python3 setup.py develop
4. Install Real-ESRGAN to enhance images further.
pip install realesrgan
Download the Pre-trained GFPGAN Model Weights
GFPGAN relies on pre-trained models to perform face restoration. We will download version 1.3 of the model weights:
wget https://github.com/TencentARC/GFPGAN/releases/download/v1.3.0/GFPGANv1.3.pth -P experiments/pretrained_models
This command downloads the GFPGANv1.3.pth model file directly into the experiments/pretrained_models folder, where GFPGAN expects the weights.
Setting Up the Web Interface
To make the restoration process user-friendly, we’ll set up a simple Flask-based web interface. With this interface, you can upload an image through a browser and get the restored version.
1. Create a folder for holding HTML templates used by the Flask application.
mkdir templates
2. Next, create a simple HTML page index.html for uploading images.
nano templates/index.html
Add the code below.
GFPGAN Web Interface
Upload an Image for Restoration
After uploading, the restored images will be processed and downloaded automatically.
This HTML form allows the user to select an image file and upload it to the Flask application. Once submitted, the image is sent to the upload endpoint for processing.
3. Create a Flask application.
nano app.py
Add the following code:
from flask import Flask, request, render_template, send_file
import os
import subprocess
import shutil
import zipfile
from datetime import datetime
app = Flask(__name__)
UPLOAD_FOLDER = 'inputs/whole_imgs'
RESULT_FOLDER = 'results'
app.config['UPLOAD_FOLDER'] = UPLOAD_FOLDER
os.makedirs(UPLOAD_FOLDER, exist_ok=True)
os.makedirs(RESULT_FOLDER, exist_ok=True)
@app.route('/')
def index():
return render_template('index.html')
@app.route('/upload', methods=['POST'])
def upload_file():
if 'file' not in request.files:
return "No file uploaded", 400
file = request.files['file']
if file.filename == '':
return "No file selected", 400
filepath = os.path.join(app.config['UPLOAD_FOLDER'], file.filename)
file.save(filepath)
# Clean up old files in the results folder
shutil.rmtree(RESULT_FOLDER)
os.makedirs(RESULT_FOLDER, exist_ok=True)
# Run GFPGAN inference
command = f"python3 inference_gfpgan.py -i {UPLOAD_FOLDER} -o {RESULT_FOLDER} -v 1.3 -s 2"
subprocess.run(command, shell=True)
# Create a dynamically named ZIP archive of the results folder
zip_name = f"results_{datetime.now().strftime('%Y%m%d_%H%M%S')}.zip"
with zipfile.ZipFile(zip_name, 'w') as zipf:
for root, dirs, files in os.walk(RESULT_FOLDER):
for file in files:
file_path = os.path.join(root, file)
arcname = os.path.relpath(file_path, start=RESULT_FOLDER)
zipf.write(file_path, arcname)
# Send the ZIP file for download
return send_file(zip_name, as_attachment=True)
if __name__ == '__main__':
app.run(host='0.0.0.0', port=5000)
This code will do the following:
Imports necessary libraries for file handling, subprocess execution, and ZIP archiving.
Sets UPLOAD_FOLDER and RESULT_FOLDER for storing input and output images.
Defines a Flask route / to display the upload form.
Defines a Flask route /upload to handle file uploads, run GFPGAN, and return a ZIP file of results.
4. Finally, run the Flask application.
python3 app.py
You will get the following output.
* Serving Flask app 'app'
* Debug mode: off
WARNING: This is a development server. Do not use it in a production deployment. Use a production WSGI server instead.
* Running on all addresses (0.0.0.0)
* Running on http://127.0.0.1:5000
* Running on http://your-server-ip:5000
Press CTRL+C to quit
Access the Flask Web UI
1. Open a browser and navigate to http://your-server-ip:5000. You will see an upload form.
2. Download the following image and save it on your local computer.
3. Click on Browse, choose the downloaded image from your local system, and click “Upload and Restore.”
4. The server will run GFPGAN inference on the uploaded image and produce a restored version. Once complete, your browser should prompt you to download a ZIP file containing the restored image(s).
5. The restored image will also be found in the restored_imgs folder inside your downloaded zip archive.
Conclusion
By following this guide, you have successfully set up an AI-powered face restoration application using GFPGAN on an Ubuntu 22.04 cloud GPU server. This implementation leverages the power of GPU acceleration provided by PyTorch and CUDA, enabling high-performance image restoration. With GFPGAN, you not only harness state-of-the-art technology but also demonstrate the practical benefits of AI in real-world applications - test it out today on a GPU server from Atlantic.Net!
### Object Detection with Tensorflow on a Atlantic.Net Cloud Server
Object detection is a key technology in computer vision, enabling machines to recognize and localize objects within images or video frames. It has diverse applications, from enhancing security with intelligent surveillance systems to powering autonomous vehicles, retail inventory management, and augmented reality experiences. TensorFlow offers a comprehensive Object Detection API that simplifies the process of creating, training, and deploying object detection models.
In this guide, we will walk you through setting up TensorFlow’s Object Detection API on an Atlantic.Net Cloud GPU Server running Ubuntu 22.04.
Prerequisites
Before starting, ensure you have the following:
An Ubuntu 22.04 Cloud GPU Server.
CUDA Toolkit and cuDNN Installed.
A root or sudo privileges.
Install Required Dependencies
1. First, update all system packages to the updated version.
apt update -y
2. Next, install essential tools and libraries required for TensorFlow and object detection.
apt install python3-pip python3.10-venv protobuf-compiler
3. Install the Python virtual environment package.
pip install virtualenv
Create a Project Virtual Environment
A virtual environment keeps your project's dependencies isolated, ensuring compatibility and reducing conflicts.
1. Create a project directory.
mkdir project
2. Navigate into the project directory
cd project
3. Create the Python virtual environment.
python3 -m venv env
4. Activate the virtual environment.
source env/bin/activate
Install TensorFlow Object Detection API
1. First, install TensorFlow and Cython.
pip install tensorflow cython
2. Clone the TensorFlow Object Detection API repository.
git clone https://github.com/tensorflow/models
3. Change the directory to the research directory.
cd models/research
4. Configure the model and training parameters using the protoc command.
protoc object_detection/protos/*.proto --python_out=.
Install COCO API
1. Change back to the project directory.
cd ../..
2. Clone the cocoapi repository.
git clone https://github.com/cocodataset/cocoapi.git
3. Change the directory to PythonAPI.
cd cocoapi/PythonAPI
4. Run the make command to build the library.
make
5. Copy the pycocotools subfolder into the research folder from the cloned TensorFlow Object Detection API repository.
cp -r pycocotools ../../models/research/
6. Install the Object Detection API.
cd ../../models/research
cp object_detection/packages/tf2/setup.py . && python -m pip install .
Create an Object Detection Application
In this section, we'll build a Python application to use a pre-trained object detection model.
1. First, create a main.py file within your main project directory.
cd ../../
nano main.py
Add the following code to main.py.
import os
import tensorflow as tf
import numpy as np
from PIL import Image
from object_detection.utils import label_map_util
from object_detection.utils import visualization_utils as viz_utils
def download_model(model_name, model_date):
"""
Downloads and extracts the TensorFlow Object Detection model.
"""
base_url = 'http://download.tensorflow.org/models/object_detection/tf2/'
model_file = model_name + '.tar.gz'
model_dir = tf.keras.utils.get_file(fname=model_name,
origin=base_url + model_date + '/' + model_file,
untar=True)
print(f"Model downloaded to: {model_dir}")
return str(model_dir)
def verify_model_path(model_dir, model_name):
"""
Verifies if the saved_model exists in the downloaded directory.
Adjusts the path if there is an additional subfolder.
"""
saved_model_path = os.path.join(model_dir, model_name, "saved_model")
if os.path.exists(saved_model_path):
print(f"Found SavedModel at: {saved_model_path}")
return saved_model_path
else:
raise FileNotFoundError(f"SavedModel not found in {saved_model_path}. Please check the download.")
# Download model
model_name = "ssd_resnet152_v1_fpn_1024x1024_coco17_tpu-8"
model_date = "20200711"
PATH_TO_MODEL_DIR = download_model(model_name, model_date)
# Verify saved_model path with subfolder adjustment
PATH_TO_SAVED_MODEL = verify_model_path(PATH_TO_MODEL_DIR, model_name)
# Load model
print("Loading model...")
model_fn = tf.saved_model.load(PATH_TO_SAVED_MODEL)
print("Model loaded successfully!")
# Load labels
PATH_TO_LABELS = 'models/research/object_detection/data/mscoco_label_map.pbtxt'
category_index = label_map_util.create_category_index_from_labelmap(PATH_TO_LABELS, use_display_name=True)
# Images to run detection
images = ["balloon.png", "cow.png"]
# Run inference
for image in images:
print(f"Running inference for image: {image}")
# Load image into a numpy array
image_np = np.array(Image.open(image).convert("RGB"))
# Convert image to tensor
input_tensor = tf.convert_to_tensor(image_np)
# Add an axis to make it a batch
input_tensor = input_tensor[tf.newaxis, ...]
# Run inference
detections = model_fn(input_tensor)
# Process detection outputs
num_detections = int(detections.pop('num_detections'))
detections = {key: value[0, :num_detections].numpy()
for key, value in detections.items()}
detections['num_detections'] = num_detections
detections['detection_classes'] = detections['detection_classes'].astype(np.int64)
# Visualize detections
image_np_with_detections = image_np.copy()
viz_utils.visualize_boxes_and_labels_on_image_array(
image_np_with_detections,
detections['detection_boxes'],
detections['detection_classes'],
detections['detection_scores'],
category_index,
use_normalized_coordinates=True,
max_boxes_to_draw=200,
min_score_thresh=.30,
agnostic_mode=False,
line_thickness=8)
# Save image with detections
img = Image.fromarray(image_np_with_detections)
img_filename = image.replace(".png", "_detect.png")
img.save(img_filename)
print(f"Saved image with detections to: {img_filename}")
Explanation:
The code downloads and verifies a TensorFlow object detection model from the TensorFlow model zoo.
It loads the saved model and label map to map class IDs to readable labels.
Images are preprocessed into tensors with a batch dimension for inference compatibility.
The model runs inference to detect objects and processes outputs like bounding boxes, classes, and scores.
Detected objects are visualized on images with annotations and saved as new files.
2. Download the sample images below, name them balloon.png and cow.png, and place them in the project directory.
The project directory should look like this:
project
├── env/
└── models/
└── cocoapi/
└── main.py
└── cow.png
└── balloon.png
3. Run the main.py script within your project directory.
python3 main.py
Monitor the output for successful inference and file creation:
I0000 00:00:1734412066.740691 32930 gpu_device.cc:2022] Created device /job:localhost/replica:0/task:0/device:GPU:0 with 5567 MB memory: -> device: 0, name: NVIDIA A40-8Q, pci bus id: 0000:06:00.0, compute capability: 8.6
Model loaded successfully!
Running inference for image: balloon.png
I0000 00:00:1734412088.887535 32952 cuda_dnn.cc:529] Loaded cuDNN version 90600
Saved image with detections to: balloon_detect.png
Running inference for image: cow.png
Saved image with detections to: cow_detect.png
The above code downloads the model, processes the images, and saves object-detected images within your project directory.
4. Download the newly generated images (balloon_detect.png and cow_detect.png) to your local machine for inspection.
5. Open the detected images and verify that the objects are correctly labeled.
Conclusion
You have successfully set up TensorFlow Object Detection API on an Atlantic.Net Cloud Server and used it to detect objects in images. The process involved:
Installing TensorFlow and dependencies.
Setting up COCO and TensorFlow Object Detection APIs.
Running a pre-trained model for object detection.
This setup can be extended to train custom models for domain-specific applications. Give it a try today on GPU hosting from Atlantic.Net!
### AI Image Manipulation with Instruct Pix2Pix on Atlantic.Net Cloud GPU
Image manipulation has always been a cornerstone of creativity, enabling designers, artists, and hobbyists to bring their ideas to life. With the advent of AI, tools like Instruct Pix2Pix are revolutionizing this field by allowing users to edit images through simple text instructions. Instruct Pix2Pix leverages state-of-the-art deep learning models to perform detailed and accurate modifications to images based on prompts.
This guide provides a step-by-step walkthrough to set up and use Instruct Pix2Pix on an Ubuntu GPU server.
Prerequisites
Before we dive into the setup, ensure that your server meets the following requirements:
An Ubuntu 22.04 Cloud GPU Server with at least 20 GB VRAM.
CUDA Toolkit and cuDNN Installed.
A root or sudo privileges.
To confirm CUDA support, run:
nvidia-smi
Ensure the output lists your GPU and available VRAM.
Step 1: Installing Python Dependencies
We’ll start by installing the required Python packages. Ensure Python 3 and pip are installed on your system.
apt install python3 python3-pip
Next, install torch with Cuda support using the pip.
pip3 install torch --index-url https://download.pytorch.org/whl/cu124
Step 2: Setting Up Jupyter Notebook
Jupyter Notebook provides an interactive environment to work with Instruct Pix2Pix.
You can install it using the following command.
pip3 install notebook
Next, run the Jupyter notebook.
jupyter notebook --ip=your-server-ip --allow-root
You will see the following output.
[I 2024-12-17 03:32:14.456 ServerApp] Jupyter Server 2.14.2 is running at:
[I 2024-12-17 03:32:14.456 ServerApp] http://your-server-ip:8888/tree?token=6b926e2169755fafadf0282b219f775b978c9f5e009bbe16
[I 2024-12-17 03:32:14.456 ServerApp] http://127.0.0.1:8888/tree?token=6b926e2169755fafadf0282b219f775b978c9f5e009bbe16
[I 2024-12-17 03:32:14.456 ServerApp] Use Control-C to stop this server and shut down all kernels (twice to skip confirmation).
[W 2024-12-17 03:32:14.459 ServerApp] No web browser found: Error('could not locate runnable browser').
[C 2024-12-17 03:32:14.459 ServerApp]
To access the server, open this file in a browser:
file:///root/.local/share/jupyter/runtime/jpserver-2789-open.html
Or copy and paste one of these URLs:
http://your-server-ip:8888/tree?token=6b926e2169755fafadf0282b219f775b978c9f5e009bbe16
http://127.0.0.1:8888/tree?token=6b926e2169755fafadf0282b219f775b978c9f5e009bbe16
Note down the Jupyter notebook URL in the above output.
Step 3: Access Jupyter Notebook
In this section, we will access the Notebook and run the Model via web-based interface.
1. Access Jupyter Notebook
Open the URL provided in the output (e.g., http://your-server-ip:8888/tree?token=6b926e2169755fafadf0282b219f775b978c9f5e009bbe16) in a web browser to access the Jupyter Notebook interface.
Click on File => New => Notebook to create a new Notebook. You will be asked to select a kernel.
Select a Python kernel and click on Select. You will see the new Notebook page.
2. Install Required Dependencies
In the new Notebook window, install the required model libraries.
!pip3 install diffusers accelerate safetensors transformers pillow
Click on run or press Control + Enter to install the above libraries.
Upgrade Jupyter Notebook and the ipywidgets package.
!pip3 install --upgrade jupyter ipywidgets
3. Import Necessary Libraries
In the Notebook window, add the below code to import the necessary library.
from PIL import Image, ImageOps
import requests
import torch
from diffusers import StableDiffusionInstructPix2PixPipeline, EulerAncestralDiscreteScheduler
4. Download an Image
Add this function to download and prepare an image:
def download_image(url):
image = Image.open(requests.get(url, stream=True).raw)
image = ImageOps.exif_transpose(image)
image = image.convert("RGB")
return image
# Example
url = "https://i.postimg.cc/gkGpRjsp/image1.png"
image = download_image(url)
Note: replace https://i.postimg.cc/gkGpRjsp/image1.png with your image URL.
5. Load the Instruct Pix2Pix Model
Define and configure the model pipeline:
model_id = "timbrooks/instruct-pix2pix"
pipe = StableDiffusionInstructPix2PixPipeline.from_pretrained(model_id, torch_dtype=torch.float16, safety_checker=None)
pipe.to("cuda")
pipe.scheduler = EulerAncestralDiscreteScheduler.from_config(pipe.scheduler.config)
6. Running the Pipeline
Once the model is loaded, you can use it to edit images based on text prompts:
prompt = "Make it red and blue"
images = pipe(prompt, image=image, num_inference_steps=10, image_guidance_scale=1).images
# Save or display the result
images[0].save("output.png")
images[0].show()
Note: Replace the prompt with your desired modification description. For example, “Turn it into a sketch” or “Add a sunset background.”
After adding all the code to the Notebook window, Click on run or press Control + Enter to run the Notebook. You will see the generated image in the Notebook window.
7. Verifying GPU Utilization
Ensure the GPU is utilized efficiently by running the following command in Notebook window:
!nvidia-smi
The output should show the GPU memory being used by Python processes.
Conclusion
Instruct Pix2Pix enables flexible and precise image editing using simple text prompts. With an Ubuntu GPU server, you can leverage this powerful AI tool for creative projects or experimentation. Follow this guide to set up your environment and start exploring the possibilities of AI-driven image manipulation.
### How to Build Your First Machine Learning Model with Scikit-learn
Machine learning (ML) has become a tool for solving many problems, from predicting house prices to recommending movies. Among the many libraries for ML in Python, Scikit-learn is one of the most popular. Scikit-learn is a robust and easy to use framework for implementing and testing machine learning algorithms. It includes tools for data preprocessing, dataset splitting, model training and evaluation.
In this tutorial, you'll learn how to build your first machine learning model using Scikit-learn on Atlantic.Net Cloud GPU.
Prerequisites
An Ubuntu 22.04 Cloud GPU Server.
CUDA Toolkit and cuDNN Installed.
A root or sudo privileges.
Step 1: Setting Up the Environment
Before we begin coding, you need to install the required Python libraries. Open a terminal and execute the following commands:
pip install scikit-learn pandas seaborn
Next, install the Jupyter Notebook.
pip install notebook
Next, launch a Jupyter Notebook using the below command.
jupyter notebook --no-browser --port=8888 --ip=your-server-ip --allow-root
After running the jupyter notebook command, you will see a URL in your terminal.
Open your web browser and use this URL to access the Jupyter Notebook.
Note: If you cannot access the Notebook, check to see if your Firewall is blocking traffic.
Click on File > New > Notebook. You will be asked to select the Kernel.
Select the "Python (GPU)" kernel and click Select to create a new notebook.
Jupyter Notebook allows you to write and execute Python code in a browser-based interface interactively. We will perform remaining steps in Jupyter Notebook.
Step 2: Import Libraries and Prepare the Dataset
Once the environment is set up, start by importing the necessary libraries and creating a small dataset.
import numpy as np
import pandas as pd
from sklearn.model_selection import train_test_split
from sklearn.linear_model import LinearRegression
from sklearn.metrics import mean_squared_error, r2_score
import seaborn as sns
import matplotlib.pyplot as plt
# Example dataset
data = pd.DataFrame({
'Feature1': [1, 2, 3, 4, 5],
'Feature2': [2, 4, 6, 8, 10],
'PRICE': [3, 6, 9, 12, 15]
})
# Check for missing values
print("Missing values in the dataset:")
print(data.isnull().sum())
In this code:
We imported essential libraries for machine learning (sklearn), data handling (pandas), and visualization (seaborn, matplotlib).
The data DataFrame is a simple dataset with two features (Feature1, Feature2) and a target variable (PRICE) to illustrate regression.
Missing values can create issues during model training, so we check them using isnull().sum().
Step 3: Visualize Data Relationships
Visualization provides insights into how features are related to each other and the target variable.
# Get basic statistics of the dataset
print("\nBasic statistics of the dataset:")
print(data.describe())
# Visualize the correlation matrix
plt.figure(figsize=(10, 8))
sns.heatmap(data.corr(), annot=True, cmap="coolwarm")
plt.title("Correlation Matrix")
plt.show()
Here:
The describe() function provides an overview of the dataset, such as mean, min, and max values, which helps us understand its range and variability.
The correlation matrix reveals the strength of relationships between variables.
Values close to 1 or -1 indicate strong positive or negative correlations, while values close to 0 show weak or no correlation.
Step 4: Define Features and Split Data
Machine learning models require separating features (independent variables) from the target (dependent variable). Then, we split the data into training and testing sets.
# Define features (X) and target variable (y)
X = data.drop('PRICE', axis=1)
y = data['PRICE']
# Split the data with sufficient test size
test_size = 0.4 if data.shape[0] > 5 else 0.2 # Adjust test_size based on dataset size
X_train, X_test, y_train, y_test = train_test_split(X, y, test_size=test_size, random_state=42)
print(f"\nTraining set size: {X_train.shape[0]} rows")
print(f"Test set size: {X_test.shape[0]} rows")
Here:
The feature set (X) is created by dropping the PRICE column, and y stores the target variable.
Using train_test_split, we divide the data into training (to build the model) and testing (to evaluate it). Adjusting test_size ensures a sufficient split based on dataset size.
Step 5: Train the Model
Fit a linear regression model to the training data. We also use the trained model to predict the target variable for the test set.
# Train the model
model = LinearRegression()
model.fit(X_train, y_train)
print("\nModel Coefficients:", model.coef_)
print("Intercept:", model.intercept_)
# Predict housing prices
y_pred = model.predict(X_test)
# Compare actual vs predicted prices
results = pd.DataFrame({"Actual": y_test.values, "Predicted": y_pred})
print("\nComparison of actual vs predicted prices:")
print(results.head())
Here:
The LinearRegression model learns a linear relationship between X_train and y_train.
The coef_ and intercept_ values represent the slope and intercept of the regression line, which the model uses for predictions.
The predict method generates predictions for X_test using the trained model.
A DataFrame (results) compares actual and predicted values to help visualize the model’s accuracy.
Step 6: Evaluate the Model
Evaluate the model’s performance using metrics such as Mean Squared Error (MSE) and R-squared. Then, create a scatter plot to visualize how closely the predicted values align with the actual values.
# Calculate Mean Squared Error
mse = mean_squared_error(y_test, y_pred)
print(f"\nMean Squared Error: {mse:.2f}")
# Calculate R-squared only if there are at least two test samples
if X_test.shape[0] > 1:
r2 = r2_score(y_test, y_pred)
print(f"R-squared: {r2:.2f}")
else:
print("\nR-squared cannot be calculated due to insufficient test samples.")
# Visualize actual vs predicted prices
plt.scatter(y_test, y_pred, alpha=0.7)
plt.xlabel("Actual Prices")
plt.ylabel("Predicted Prices")
plt.title("Actual vs Predicted Prices")
plt.show()
Here:
MSE quantifies the average squared error between actual and predicted values, where lower values indicate better performance.
R-squared explains how well the features predict the target variable, with values closer to 1 indicating a better fit.
Conclusion
Congratulations! You’ve completed your first machine learning model with Scikit-learn in Jupyter Notebook. This hands on approach is perfect for learning the basics of ML and Jupyter’s interactivity makes it easy to test and visualize. Now go experiment with larger datasets, more features and different algorithms.
### How to Visualize Machine Learning Models with SHAP and LIME
In machine learning, having a good model is only half the battle. Understanding how the model makes predictions is just as important especially when working with complex datasets or making decisions that impact business, healthcare or finance. This is where model interpretability comes in. Techniques like SHAP (SHapley Additive exPlanations) and LIME (Local Interpretable Model-agnostic Explanations) are great tools to explain the inner workings of machine learning models.
This article will walk you through the visualization of machine learning models using SHAP and LIME, with a hands-on example. We will use the Iris dataset and a Random Forest classifier to demonstrate and run the model in Jupyter Notebook.
Prerequisites
An Ubuntu 22.04 Cloud GPU Server.
CUDA Toolkit, cuDNN Installed.
Jupyter Notebook is installed and running.
A root or sudo privileges.
Step 1: Installing Necessary Libraries
Before diving into the implementation, ensure you have the required libraries installed in your environment. Use the following command to install them:
pip install pandas ipywidgets numpy matplotlib scikit-learn shap lime
Step 2: Load the Dataset
We’ll use the Iris dataset, a classic dataset in machine learning, to train a Random Forest classifier. The dataset contains information about different flower species and their features such as sepal length, sepal width, petal length, and petal width.
import pandas as pd
import shap
from sklearn.datasets import load_iris
from sklearn.ensemble import RandomForestClassifier
from sklearn.model_selection import train_test_split
from lime.lime_tabular import LimeTabularExplainer
data = load_iris()
X = pd.DataFrame(data.data, columns=data.feature_names)
y = data.target
Here:
X contains the feature values.
y contains the target class labels for each flower species.
Step 3: Train-Test Split
We split the dataset into training and testing sets to evaluate the model's performance. This ensures that the model is trained on one part of the data and tested on another.
X_train, X_test, y_train, y_test = train_test_split(
X, y, test_size=0.2, random_state=42
)
Here:
test_size=0.2: Reserves 20% of the data for testing.
random_state=42: Ensures reproducibility of the split.
Step 4: Train a Random Forest Model
A random forest is a robust ensemble learning method that operates by constructing multiple decision trees and outputting the class, which is the mode of the classes of the individual trees. We’ll train this model using the training set.
model = RandomForestClassifier(random_state=42)
model.fit(X_train, y_train)
The trained model can now be used for predictions and analysis.
Step 5: Explain Predictions with SHAP
SHAP provides a unified measure of feature importance by attributing a prediction’s outcome to individual features. It uses Shapley values from cooperative game theory to explain predictions.
explainer = shap.Explainer(model, X_train)
shap_values = explainer(X_test, check_additivity=False)
print("shap_values.values.shape:", shap_values.values.shape)
# Typically (n_samples, n_classes, n_features) = (30, 3, 4) for Iris
print("X_test.shape:", X_test.shape)
Here:
check_additivity=False: Disables additivity checks, which is often necessary for ensemble models like Random Forests.
shap_values: Contains SHAP values for all features in the test set.
Step 6: Analyze SHAP Values
The shap_values object helps us understand how each feature contributes to the model’s predictions. We can visualize these contributions globally and locally.
num_classes = shap_values.values.shape[1]
for class_idx in range(num_classes):
# Extract Explanation object for this class only
shap_values_class = shap_values[..., class_idx]
print(f"\n--- Beeswarm for class {class_idx} ---")
shap.plots.beeswarm(shap_values_class)
This visualization highlights the most influential features for each class, providing insights into the model’s decision-making process.
Step 7: Explain Predictions with LIME
LIME focuses on explaining individual predictions by approximating the model locally with an interpretable surrogate model. This makes it particularly useful for understanding specific predictions.
lime_explainer = LimeTabularExplainer(
training_data=X_train.values,
feature_names=X_train.columns,
class_names=data.target_names,
mode="classification"
)
Here:
feature_names: Names of the features in the dataset.
class_names: Target class labels (e.g., species of flowers)
Step 8: Analyze a Specific Instance
We’ll analyze the model’s prediction for a specific test instance.
instance = X_test.iloc[0].values
lime_exp = lime_explainer.explain_instance(
instance,
model.predict_proba,
num_features=4
)
lime_exp.show_in_notebook()
lime_exp.as_pyplot_figure()
The visualization provides a breakdown of the features that contribute the most to the prediction for the selected instance.
Step 9: Running the Code in a Jupyter Notebook
Create a new notebook from the Jupyter Notebook dashboard, combine all code snippets and paste them into the notebook cell, and run the notebook to observe the outputs.
In the above result, the beeswarm plot illustrates the global importance of features, while the LIME explanation highlights the local contribution of features to an individual prediction.
Conclusion
Model interpretability is key to responsible AI. Tools like SHAP and LIME make it easier to explain predictions and trust machine learning models. In this tutorial we used the Iris dataset and a Random Forest classifier to show you how to use these tools. Start using these today on GPU hosting from Atlantic.Net to get more insights and make better decisions.
### How to Perform Hyperparameter Tuning with GridSearchCV on Atlantic.Net Cloud GPU
Hyperparameter tuning is an important step in improving the performance of machine learning models. By tuning the hyperparameters, we can boost the predictive power of the models. One way of hyperparameter tuning is GridSearchCV, which exhaustively searches through a grid of hyperparameter combinations.
Due to computational constraints, running GridSearchCV on a local machine is impractical when working with large datasets or complex models. Using a cloud GPU can speed up this process.
In this tutorial, we will go through the steps to perform hyperparameter tuning with GridSearchCV on a cloud GPU.
Prerequisites
An Ubuntu 22.04 Cloud GPU Server.
CUDA Toolkit, cuDNN Installed.
Jupyter Notebook is installed and running.
A root or sudo privileges.
Step 1: Install Required Software
Before starting, you will need to install the necessary dependencies, including drivers for GPU acceleration and libraries for machine learning tasks.
pip install numpy pandas scikit-learn matplotlib
Step 2: Create an In-Memory Dataset
We will first create a small in-memory dataset using Python's pandas library. This dataset will serve as input for the model.
import pandas as pd
from sklearn.pipeline import Pipeline
from sklearn.preprocessing import StandardScaler
from sklearn.ensemble import RandomForestClassifier
from sklearn.model_selection import GridSearchCV
# Create an in-memory dataset
data_dict = {
'feature1': [1, 4, 7, 2, 9],
'feature2': [2, 5, 8, 5, 3],
'feature3': [3, 6, 9, 3, 5],
'target': [0, 1, 0, 1, 0]
}
# Convert dictionary to DataFrame
data = pd.DataFrame(data_dict)
# 2. Split into features (X) and labels (y)
X = data.drop("target", axis=1)
y = data["target"]
Here, the dataset contains three features and a target variable. The X variable holds the features, and y holds the target.
Step 3: Define a Machine Learning Pipeline
A pipeline helps streamline preprocessing and model training steps. Here, we scale the features and train a random forest classifier:
pipeline = Pipeline([
('scaler', StandardScaler()),
('classifier', RandomForestClassifier(random_state=42))
])
The pipeline first applies feature scaling using StandardScaler, which normalizes the data. Then, it trains a RandomForestClassifier on the scaled features.
Step 4: Define Hyperparameter Grid
Hyperparameters are configurations external to the model, and tuning them can significantly affect performance. Define a grid of values to search:
param_grid = {
'classifier__n_estimators': [100, 200, 300],
'classifier__max_depth': [10, 20, 30],
'classifier__min_samples_split': [2, 5, 10]
}
Here, we tune three parameters of the RandomForestClassifier: the number of estimators, maximum depth, and minimum samples required to split a node.
Step 5: Initialize GridSearchCV
GridSearchCV performs an exhaustive search over the parameter grid to find the best combination:
grid_search = GridSearchCV(
estimator=pipeline,
param_grid=param_grid,
scoring='accuracy',
cv=2, # <-- Reduced from 5 to 2
n_jobs=-1
)
This setup optimizes the accuracy score, uses 2-fold cross-validation, and parallelizes computations for efficiency.
Step 6: Fit the Model
Train the model using the defined parameter grid:
grid_search.fit(X, y)
print("Best Parameters:", grid_search.best_params_)
print("Best Score:", grid_search.best_score_)
The fit method evaluates all parameter combinations, and best_params_ shows the optimal hyperparameters. best_score_ displays the highest cross-validated accuracy.
Step 7: Running the Code in a Jupyter Notebook
Create a new notebook from the Jupyter Notebook dashboard, combine all code and paste them into the notebook cell, then run the notebook to observe the outputs.
The above image displays the best hyperparameter values ({'classifier__max_depth': 10, 'classifier__min_samples_split': 2, 'classifier__n_estimators': 100}) and the corresponding accuracy score (0.583333...).
Step 8: Monitor GPU Usage
To ensure the GPU is utilized efficiently, monitor its usage with:
!nvidia-smi
This command shows GPU utilization, memory usage, and active processes.
Step 9: Save and Download Results
Save the best-performing model to a file for future use.
import joblib
joblib.dump(grid_search.best_estimator_, "best_model.pkl")
This creates a portable file containing the trained model, which can be loaded later for inference. You can download this model using SCP or FTP method.
Conclusion
Performing hyperparameter tuning with GridSearchCV on a cloud GPU is much faster for large datasets or complex models. Follow this guide to set up and execute hyperparameter optimization in the cloud. Each step, from preparing the dataset to saving the results, is designed to be efficient and accurate. With the right setup, you will get the best out of your machine learning model.
### How to Use Pretrained Models for Transfer Learning in PyTorch on Atlantic.Net Cloud GPU
Deep learning has changed how we approach image classification tasks, but training a deep neural network from scratch requires a huge amount of labeled data and computational resources. This is where transfer learning comes in. Transfer learning uses pre-trained models such as ResNet-5,0, which have already learned general features from large datasets like ImageNet. These models can be fine-tuned for a specific task, reducing training time and the need for large datasets.
In this tutorial, we will show you how to implement transfer learning using PyTorch to classify flowers from the Flowers Dataset.
Prerequisites
An Ubuntu 22.04 Cloud GPU Server.
CUDA Toolkit, cuDNN Installed.
Jupyter Notebook is installed and running.
A root or sudo privileges.
Step 1: Install Required Libraries
Before starting, you will need to install PyTorch with GPU support on your server. You can install them with the following command.
pip install torch torchvision torchaudio --index-url https://download.pytorch.org/whl/cu124
Step 2: Download and Extract the Dataset
To begin, we’ll use the Flowers dataset provided by TensorFlow. It contains labeled images of five flower classes: daisy, dandelion, roses, sunflowers, and tulips.
# Import necessary libraries
import os
import random
import torch
import torch.nn as nn
import torch.optim as optim
import matplotlib.pyplot as plt
from torchvision import datasets, transforms, models
from PIL import Image
# Check for GPU availability
device = torch.device('cuda' if torch.cuda.is_available() else 'cpu')
#Download and Extract Dataset
# Download and extract the dataset
if not os.path.exists('dataset/flower_photos'):
os.system('wget http://download.tensorflow.org/example_images/flower_photos.tgz')
os.system('mkdir -p dataset')
os.system('tar -xzf flower_photos.tgz -C dataset')
Explanation:
The code checks if the dataset exists locally.
If not, it downloads the dataset (flower_photos.tgz) and extracts it into the dataset/flower_photos directory.
Step 3: Dataset Preparation
We prepare the dataset for training and validation. Images are resized to 224x224 pixels and converted to PyTorch tensors. The dataset is split into 80% training and 20% validation.
# Define transformations for preprocessing
transform = transforms.Compose([
transforms.Resize((224, 224)), # Resize images to 224x224 pixels
transforms.ToTensor(), # Convert images to PyTorch tensors
])
# Load the dataset and split into training and validation sets
dataset_path = 'dataset/flower_photos'
train_dataset = datasets.ImageFolder(dataset_path, transform=transform)
val_split = int(len(train_dataset) * 0.2) # Use 20% for validation
train_split = len(train_dataset) - val_split
train_dataset, val_dataset = torch.utils.data.random_split(
train_dataset, [train_split, val_split]
)
# Create DataLoaders
train_loader = torch.utils.data.DataLoader(train_dataset, batch_size=32, shuffle=True)
val_loader = torch.utils.data.DataLoader(val_dataset, batch_size=32, shuffle=False)
# Print dataset statistics
print(f"Classes: {train_dataset.dataset.classes}") # ['daisy', 'dandelion', 'roses', 'sunflowers', 'tulips']
print(f"Number of training samples: {len(train_dataset)}")
print(f"Number of validation samples: {len(val_dataset)}")
Explanation:
Transformations: Resize images to 224x224 to match the input size for ResNet and convert them into tensors.
Data Splitting: The dataset is split into training (80%) and validation (20%) subsets for model training and evaluation.
Data Loaders: These enable efficient batch processing during training and validation.
Step 4: Load and Modify the Pretrained Model
PyTorch provides a variety of pre-trained models via torch-vision models. Here, we use ResNet-50 and modify its final layer to classify five flower types.
# Load pretrained ResNet-50 model
model = models.resnet50(pretrained=True)
# Freeze pretrained layers
for param in model.parameters():
param.requires_grad = False
# Replace the final classification layer to match the number of classes
num_classes = len(train_dataset.dataset.classes)
model.fc = nn.Linear(model.fc.in_features, num_classes)
model = model.to(device)
Explanation:
Freezing Layers: Prevents updates to the pretrained layers, preserving their learned features.
Final Layer Replacement: The original 1000-class output layer is replaced with a new layer for five flower classes.
Step 5: Define Training Setup
We define the loss function and optimizer required for training.
# Loss function and optimizer
criterion = nn.CrossEntropyLoss()
optimizer = optim.Adam(model.fc.parameters(), lr=0.001)
Explanation:
Loss Function: CrossEntropyLoss is suitable for multi-class classification problems.
Optimizer: Adam optimizer updates only the parameters of the newly added final layer.
Step 6: Train the Model
Train the model over multiple epochs, calculating the loss for each batch and updating weights accordingly.
epochs = 5
for epoch in range(epochs):
model.train()
running_loss = 0.0
for inputs, labels in train_loader:
inputs, labels = inputs.to(device), labels.to(device)
optimizer.zero_grad()
outputs = model(inputs)
loss = criterion(outputs, labels)
loss.backward()
optimizer.step()
running_loss += loss.item()
print(f"Epoch {epoch+1}/{epochs}, Loss: {running_loss/len(train_loader)}")
Explanation:
Training Mode: The model is set to training mode using model.train().
Batch Processing: Each batch of inputs and labels is passed through the model to calculate and backpropagate the loss.
Loss Monitoring: Average loss per epoch is printed to track training progress.
Step 7: Validate the Model
Evaluate the model’s accuracy on the validation set.
model.eval()
correct = 0
total = 0
with torch.no_grad():
for inputs, labels in val_loader:
inputs, labels = inputs.to(device), labels.to(device)
outputs = model(inputs)
_, predicted = torch.max(outputs, 1)
total += labels.size(0)
correct += (predicted == labels).sum().item()
print(f'Validation Accuracy: {100 * correct / total:.2f}%')
Explanation:
Evaluation Mode: Disables dropout and batch normalization using model.eval().
Prediction: Compares predicted labels with actual labels to calculate accuracy.
Step 8: Verify the Model with a Sample Image
Select a random image from the dataset and visualize the model’s prediction.
# Get a random image path from one of the class directories
sample_dir = os.path.join(dataset_path, random.choice(train_dataset.dataset.classes))
sample_image_path = os.path.join(sample_dir, random.choice(os.listdir(sample_dir)))
print(f"Using sample image: {sample_image_path}")
# Load and preprocess the sample image
image = Image.open(sample_image_path)
input_tensor = transform(image).unsqueeze(0).to(device)
# Get prediction
model.eval()
with torch.no_grad():
output = model(input_tensor)
_, predicted = torch.max(output, 1)
# Map prediction to class name
predicted_class = train_dataset.dataset.classes[predicted.item()]
print(f"Predicted Class: {predicted_class}")
# Visualize the image with its predicted label
plt.imshow(image)
plt.title(f'Predicted: {predicted_class}')
plt.axis('off')
plt.show()
Explanation:
Random Image Selection: Picks a random image from the dataset for testing.
Prediction: Passes the image through the model and retrieves the predicted class.
Visualization: Displays the image with the predicted class label.
Step 9: Run the Code in Jupyter Notebook
Create a new notebook from Jupyter Notebook, add all the code to the notebook cell, and then run the notebook.
The above image demonstrates the notebook's final output. Here, the model has been trained over five epochs, achieving a validation accuracy of 90.60%. A sample image of a flower from the validation set was randomly selected, and the model predicted its class as roses. The displayed image visually confirms the prediction, highlighting the model's accuracy.
Conclusion
In this tutorial, we went through transfer learning with PyTorch to build robust classifiers for image classification tasks. We used the pre-trained ResNet-50 model and avoided training a model from scratch, and got high accuracy on the Flowers dataset. We went through data preparation, model fine-tuning, training, and validation, and finally, we visualized the results. You can use Atlantic.Net GPU server hosting as a platform for AI image classification and other applications!
### How to Analyze and Visualize Data Using Pandas and Matplotlib on Atlantic.Net Cloud GPU
Data analysis and visualization are at the core of data-driven decision-making. As data gets increasingly complex, having a powerful machine can speed up these processes, especially when you have machine learning or deep learning tasks that rely heavily on GPU. An Ubuntu GPU server is a great balance of performance, flexibility, and open-source tooling—perfect for data analysts, data scientists, and anyone who wants to experiment with large datasets quickly.
Pandas provide powerful data structures (DataFrames) and data manipulation and analysis tools. Matplotlib is a popular plotting library for creating static, animated, and interactive visualizations.
In this article, we will discuss setting up an environment for data analysis using Pandas and Matplotlib, inspecting and manipulating data, and visualizing the results.
Prerequisites
An Ubuntu 22.04 Cloud GPU Server.
CUDA Toolkit, cuDNN Installed.
Jupyter Notebook is installed and running.
A root or sudo privileges.
Setting Up the Environment
First, install the required Python packages and other libraries. Run the following command:
pip install pandas matplotlib jupyter numpy scipy seaborn scikit-learn
Using IPython’s display() Function for DataFrames
In a Jupyter Notebook, you can display Pandas DataFrames neatly by using the display() function from IPython instead of the standard print() function.
from IPython.display import display
import pandas as pd
df_sample = pd.DataFrame({
'X': [10, 20, 30],
'Y': [100, 200, 300]
})
# Show first rows
display(df_sample.head())
# Show summary stats
display(df_sample.describe())
In this code:
display() renders the output in a more readable, table-like format inside Jupyter notebooks.
df_sample.head() shows the first five rows of the DataFrame.
df_sample.describe() provides summary statistics such as mean, standard deviation, etc.
Mixing print() and display()
Sometimes, you may want to include text messages before displaying DataFrames:
print("This is the head of the DataFrame:")
display(df_sample.head(2))
print("Descriptive statistics:")
display(df_sample.describe())
Explanation:
print() is good for showing plain text or messages.
display() handles DataFrames gracefully, giving a well-formatted table output.
Multiple Plots in One Jupyter Cell
While analyzing data, you might need multiple charts to compare different aspects of your dataset. With Jupyter, you can display multiple plots one after another in the same cell:
import matplotlib.pyplot as plt
%matplotlib inline
# Plot 1
plt.figure(figsize=(5, 3))
plt.plot(df_sample['X'], label='Column X')
plt.legend()
plt.title("Plot for X")
plt.show()
# Plot 2
plt.figure(figsize=(5, 3))
plt.plot(df_sample['Y'], color='red', label='Column Y')
plt.legend()
plt.title("Plot for Y")
plt.show()
Here:
%matplotlib inline tells Jupyter to display the plots inline within the notebook.
plt.figure(figsize=(5, 3)) defines the size of each figure.
plt.show() is used to display the figure.
Creating and Exploring a Custom Dataset with Pandas
Here’s an example of creating a small dataset demonstrating basic Pandas functionality.
import pandas as pd
import matplotlib.pyplot as plt
%matplotlib inline
# Create a small dataset
df = pd.DataFrame({
'Country': ['USA', 'Canada', 'UK', 'Germany', 'France'],
'Population':[331, 38, 67, 83, 65 ],
'GDP': [21.43, 1.64, 2.83, 3.86, 2.71 ] # In trillions USD
})
df
In this code:
We are creating a DataFrame with columns Country, Population, and GDP.
Population is in millions, while GDP is in trillions (USD).
Quick Data Inspection
After creating your DataFrame, you can inspect it using some useful Pandas methods:
df.head()
df.info()
df.describe()
df.columns
df.shape
Explanation:
df.head() and df.info() give you a quick overview of the data structure.
df.describe() helps you identify the central tendency and dispersion of numeric columns.
Data Manipulation
Adding new columns or transforming existing ones is straightforward in Pandas. For example, calculating GDP per capita:
df['GDP_Per_Capita'] = (df['GDP'] * 1000) / df['Population']
df
This formula multiplies GDP by 1000 (to convert from trillions to billions), then divides by the population in millions to get GDP per capita in thousands of USD.
Filtering and Selecting Data
If you want to filter countries based on specific criteria (e.g., large population), you can do:
large_countries = df[df['Population'] > 60]
large_countries
In this code, df['Population'] > 60 produces a boolean mask for rows with a population greater than 60 million, and slicing the DataFrame with this mask returns only those rows.
Data Visualization with Matplotlib
Visualizing your data can reveal patterns, trends, and insights not immediately apparent from raw data.
Bar Chart (Vertical)
plt.figure(figsize=(8, 5))
plt.bar(df['Country'], df['Population'], color='skyblue')
plt.title('Population by Country (Millions)')
plt.xlabel('Country')
plt.ylabel('Population (in Millions)')
plt.show()
Explanation:
plt.bar(x, height, ...) creates a bar plot where each country is on the x-axis and the height is its population.
plt.title() adds a title to your chart, while plt.xlabel() and plt.ylabel() define axis labels.
Bar Chart (Horizontal)
plt.figure(figsize=(8, 4))
plt.barh(df['Country'], df['GDP'], color='green')
plt.title('GDP by Country (Trillions of USD)')
plt.xlabel('GDP (in Trillions USD)')
plt.ylabel('Country')
plt.show()
Explanation:
plt.barh() is the horizontal variant of the bar plot.
We set color='green' for a different aesthetic.
Scatter Plot
plt.figure(figsize=(6, 4))
plt.scatter(df['Population'], df['GDP'], color='purple')
plt.title('GDP vs. Population')
plt.xlabel('Population (Millions)')
plt.ylabel('GDP (Trillions USD)')
plt.show()
A scatter plot is perfect for showing the relationship between two continuous variables—here, Population and GDP.
Plotting a Computed Column
Finally, you may want to plot the computed GDP_Per_Capita column:
plt.figure(figsize=(8, 4))
plt.plot(df['Country'], df['GDP_Per_Capita'], marker='o', linestyle='--', color='r')
plt.title('GDP Per Capita (Thousands of USD)')
plt.xlabel('Country')
plt.ylabel('GDP Per Capita (in Thousands USD)')
plt.show()
In this code, we use plt.plot() with markers and a dashed line to create a simple line plot.
Conclusion
In this tutorial, we went through the steps to analyze and visualize data using Pandas and Matplotlib on an Ubuntu GPU server. We set up the environment and installed the required libraries, used Jupyter Notebook’s display() function to show DataFrames nicely, inspected data, manipulated data,a and finally visualized the results.
### An Overview of Popular NVIDIA GPUs
Graphics processing units (GPUs) are important components of high-performance computers used in many advanced applications. Graphics cards' parallel processing capabilities make them suitable for many advanced computing uses, including video rendering, supporting deep learning systems, and training machine learning algorithms. The ability to process multiple commands simultaneously supports accelerated computing in diverse applications like artificial intelligence, gaming, and robotics.
NVIDIA is the industry leader in GPU production, commanding over 80% of the graphics card market. Their processors regularly get high marks in reviews from reliable industry sources such as Tom's Hardware. We are going to look at the technology that distinguishes NVIDIA GPUs and the architectures utilized in GPU production. We'll also identify some of the company's most popular GPU models for gaming, video processing, and business uses, such as training machine learning models.
Advantages of NVIDIA Graphics Processor Technology
The technology employed in manufacturing NVIDIA GPUs provides some advantages over the products of other GPU suppliers like AMD and Intel. These benefits may be important when selecting a GPU to address specific business, manufacturing, or data science usage scenarios.
CUDA Cores
Compute Unified Device Architecture (CUDA) is a proprietary parallel computing platform and application programming interface (API) model created by NVIDIA. CUDA cores are smaller and more efficient than CPU cores. They are designed to process multiple tasks simultaneously, providing support for applications leveraging parallel processing. The cores are integral components of NVIDIA graphics cards that increase the speed of applications by exploiting the capabilities of the GPU.
NVIDIA GPUs utilize thousands of CUDA cores to construct a massively parallel architecture capable of efficiently handling multiple tasks simultaneously. These specialized cores offer enhanced speed when processing large datasets and performing complex mathematical calculations. CUDA cores are instrumental in accelerating application performance in fields like big data analytics, machine learning, and other areas of artificial intelligence.
Tensor Cores
Tensor Cores are specialized processing units introduced by NVIDIA in 2017. The cores are designed to accelerate AI workloads by improving matrix math performance. Tensor cores can significantly enhance the parallel processing required by deep learning tasks. NVIDIA has advanced its Tensor Core technology with each generation of its GPUs.
The advantages of a GPU equipped with Tensor Cores include:
Exceptional performance that maintains accuracy while reducing AI training time;
Breakthrough inference performance with low latency, high throughput, and maximum GPU utilization;
High-performance computing (HPC) support for superior accuracy and speed to accelerate next-generation scientific research.
Real-Time Ray Tracing
NVIDIA's GPUs provide real-time ray tracing that simulates light's physical behavior. Ray tracing enables the creation of exceptionally realistic visuals for use in gaming, business, and scientific applications. This technology allows a developer to produce a more lifelike visualization than alternate video rendering solutions.
NVIDIA developers utilize deep learning supersampling (DLSS) to leverage the power of AI, providing improved image quality for better gaming performance. DLSS upscales lower-resolution images to higher resolutions for enhanced performance with no loss of visual quality. NVIDIA ray tracing provides enhanced rasterization performance for the 3D and 2D modeling critical to the entertainment and scientific communities.
Accelerated Computing
NVIDIA GPUs support accelerated computing with their massively parallel architecture. Multiple features of the GPUs support the demands of high-performance computing.
Energy efficiency is prioritized in GPU design to control energy costs in large data centers and HPC environments.
NVIDIA's NVLink and Scalable Link Interface support scalability by enabling multiple GPUs to work together for enhanced computational power to support tasks like machine learning training and scientific simulations.
NVIDIA GPU Architectures
NVIDIA GPUs are manufactured utilizing several different architectures. An overview of these architectures illustrates their differences and the applications they are designed to address. New NVIDIA GPUS are constructed using the following architectures. Some NVIDIA GPUs using older architectures are still being sold and offer excellent performance.
Hopper Architecture (March 2022)
The Hopper architecture provides an accelerated computing platform to support demanding, next-generation workloads. The architecture securely scales diverse workloads in any size data center utilizing the following technological innovations.
The transformer engine optimizes floating-point operations to accelerate AI calculations for transformers and training models.
The NVLink, NVSwitch, and NVLink Switch System support GPU clusters and scalability to meet the requirements of HPC tasks and trillion-parameter AI models
NVIDIA Confidential Computing protects data and applications while in use to close gaps in traditional encryption methods.
The second-generation Multi-Instance GPU (MIG) feature enables a GPU to be partitioned into multiple smaller, fully isolated instances with dedicated memory, cache, and compute cores.
DPX instructions accelerate dynamic programming, an algorithmic technique for solving complex recursive problems by breaking them down into simpler subproblems.
Ada Lovelace Architecture (September 2022)
The Ada Lovelace architecture focuses on providing energy-efficient and enhanced GPU performance to power AI, graphics, video, and other demanding computing tasks. Following are some of the features powering this GPU architecture.
Third-generation RT Cores double ray tracing performance for photorealistic graphic rendering.
Fourth-generation Tensor Cores accelerate throughput to support transformative AI technologies like natural language processing (NLP), generative AI, and computer vision.
CUDA Cores double the processing speed of single-precision floating point (FP32) operations over previous GPU versions.
Advanced video and AI vision acceleration are supported by NVIDIA's optimized AV1 stack to enhance performance in areas like video conferencing, augmented reality (AR), and virtual reality (VR).
Ada Lovelace GPUs are optimized for enterprise data center operations. They are tested and supported for maximum performance, durability, and security.
Blackwell Architecture (March 2024)
Blackwell is NVIDIA's newest architecture and introduces groundbreaking advancements to support generative AI and accelerated computing. The following are some of the distinctive features of this advanced GPU architecture.
Blackwell-architecture GPUs are manufactured with 208 billion transistors utilizing a custom-built TSMC 4NP process. They offer exceptional speed for the most demanding AI applications.
The second-generation Transformer Engine accelerates large language model (LLM) and mixture-of-experts (MoE) model inference and training.
Secure AI is provided with NVIDIA Confidential Computing to protect sensitive and valuable data with strong hardware-based security.
NVLink and NVLink Switch support seamless communication between all GPUs in a server cluster.
The Decompression Engine provides a high-speed link to accelerate database queries for superior performance in data analytics and data science applications.
A dedicated Reliability, Availability, and Serviceability (RAS) Engine proactively identifies potential faults to minimize downtime and enhance resiliency.
Popular NVIDIA GPU Reviews
While not all-inclusive, the following list identifies some of the popular NVIDIA GPUs on the market. We'll look at the chips' features and settings where they are typically deployed.
NVIDIA GeForce GTX 16 Series
The GeForce GTX 16 series is designed to supercharge the gaming experience with powerful graphics performance. GeForce GTX 16 series GPUs are available as graphics cards for a PC or integrated into powerful laptops. The GPUs are an excellent choice for gamers.
Turing shaders provide improved performance and power efficiency for a faster, cooler, and quiet gaming experience.
Faster graphics deliver higher frame rates for smoother gameplay.
The inclusion of game-ready drivers ensures excellent speed and smooth performance with graphics-intensive games.
Advanced graphics and video rendering bring new levels of realism to virtual reality (VR) projects.
GeForce GTX 16 series GPUs are equipped with 512 to 1536 CUDA cores and either 4GB or 6GB of memory. They are built with NVIDIA's legacy Turing architecture.
NVIDIA GeForce RTX 20 Series
GeForce RTX 20 series graphics cards and laptops provide powerful performance and cutting-edge features with dedicated ray tracing and AI cores. Gamers can maximize settings and video resolution for an enhanced visual experience.
The GeForce RTX 20 offers users low latency and excellent responsiveness for a competitive edge when playing their favorite games. The GPU delivers advanced streaming capabilities with the NVIDIA Encoder.
Creative endeavors are supported by the NVIDIA Studio platform, which features dedicated drivers and tools meant to unlock a user's imagination. The NVIDIA Broadcast app lets you use an RTX 20 to transform any room into a home studio with powerful AI features like noise removal and virtual backgrounds.
GeForce RTX 20 series GPUs feature from 1920 to 4352 CUDA cores for superior parallel processing. Graphics cards have between 6GB and 12GB of memory. The chips are built utilizing the Turing architecture and come equipped with 1st generation ray tracing cores and 2nd generation Tensor cores for enhanced performance.
NVIDIA GeForce RTX 30 Series
The GPUs utilized in the GeForce RTX 30 series are designed to provide high performance to creators and gamers. The GPUs feature 2nd generation ray tracing cores and 3rd generation Tensor Cores for enhanced graphics performance and support for AI technologies.
The processors employ deep learning supersampling (DLSS) to boost speeds for a more immersive gaming experience. NVIDIA Reflex technology provides unparalleled responsiveness and exceptionally low latency. Competitive gamers can get an advantage from the technology built into the RTX series.
GeForce game-ready drivers have been finely tuned in collaboration with developers and tested extensively to provide users with maximum performance and reliability. Game settings can be optimized with a single click for a more enjoyable gaming session.
RTX 30 series GPUs are available with 2304 to 10752 CUDA cores. The processors are built with the Ampere architecture and offer memory from 6GB to 24GB to ensure fast performance for the most demanding graphics applications.
NVIDIA GeForce RTX 40 Series
The GeForce RTX 40 series are the most powerful NVIDIA GPUs designed for consumer use. They are manufactured utilizing the advanced Ada Lovelace architecture for supercharged performance. New streaming multiprocessors deliver up to double the performance of the RTX 30 series and offer improved power efficiency.
Revolutionary AI graphics are delivered with a combination of DLSS, third-gen ray tracing cores, and fourth-gen Tensor Cores. NVIDIA Reflex technology minimizes latency and provides higher frame rates. The RTX 40 series supports creativity with a suite of exclusive tools for video editing and graphic design.
Additional features of the GPU series include RTX Video Super Resolution which automatically enhances video played in your web browser. NVIDIA G-Sync offers high refresh rates for smooth gameplay. The graphics capabilities of the RTX provide the high performance required by virtual reality applications.
RTX 40 series GPUs are available with from 3072 to 18394 CUDA cores. Dedicated Shader Cores enhance graphics performance to deliver photorealistic presentation. On-board memory ranges from 8GB to 24GB to address the needs of complex calculations and applications.
NVIDIA L40S
The NVIDIA L40S offers unparalleled AI and graphics performance for enterprise data centers. The processor is designed to power next-generation data center workloads, including graphics rendering, LLM training and inference, and generative AI applications. The L40S supports the most demanding data center workloads by utilizing the Ada Lovelace architecture, fourth-gen Tensor Cores, and third-gen ray tracing cores.
The L40S is designed for efficiency and security. It is optimized for data center operations and extensively tested to ensure maximum performance, durability, and uptime. The GPU delivers breakthrough performance for generative AI and LLM inference applications. NVIDIA Confidential Computing ensures data security.
The L40S provides 48GB of GPU memory with a bandwidth of 864GB/s. It features 18,176 CUDA cores, 142 third-generation ray tracing cores, and 568 fourth-generation Tensor Cores. Its maximum power consumption is 350W, offering the performance and energy efficiency required for enterprise data center use.
NVIDIA H100 NVL
NVIDIA's H100 Tensor Core GPU delivers exceptional performance, scalability, and security for every workload. The GPU leverages the technology of NVIDIA's Hopper architecture to speed up the performance of LLMs by 30X. A dedicated Transformer Engine allows the GPU to solve trillion-parameter language models
The power available in the H100 increases performance while maintaining accuracy when working with LLMs. Utilizing NVLink and NVSwitch enables large GPU clusters to be deployed for accelerated data analytics and exascale high-performance computing. NVIDIA Confidential Computing ensures the security of data processed by the H100.
Atlantic Net's NVIDIA GPU Solutions
Atlantic Net offers customers dedicated high-performance servers in two powerful configurations designed to meet your advanced computing needs.
Our NVIDIA L40S GPU server option is an excellent solution for general AI tasks, machine learning, and deep learning applications.
Our NVIDIA H100 NVL server is more powerful than the L40S, offering higher memory bandwidth for enhanced AI and deep learning requirements.
Contact us to learn more about how our hosted NVIDIA GPU server solutions can help your business thrive.
### Popular Intel GPUs for Consumer and Enterprise Use
Intel has long been an industry leader in manufacturing central processing units (CPUs) for laptops, desktop computers, and servers. Intel manufactured its first graphics card in the 1980's. The company's goal has been to improve its GPU technology and produce cutting-edge microprocessors.
While Intel's share of the GPU market does not match that of NVIDIA or AMD, they offer some interesting products designed for consumer and enterprise data center use. Intel GPUs offer good performance for a wide and diversified user base and sometimes provide solutions at a better price point than the competition.
Read on to learn more about the variety of Intel GPUs available for personal and business use.
Intel's Proprietary XE HPG Microarchitecture
Intel GPUs are built on the advanced technology of the company's proprietary XE HPG microarchitecture. The XE HPG microarchitecture is a high-performance architecture developed for discrete GPUs. It offers a rich feature set and components designed for enhanced performance and efficiency to support state-of-the-art computer graphics.
The following highlights illustrate some of the strengths of the XE HPG microarchitecture.
Improved performance
The XE HPG microarchitecture supports up to 32 cores and 512 vector engines to provide increased compute capability. The XE-HPG builds on previous Intel GPU LE-XP technology to improve latency, increase latency tolerance, and streamline the caching hierarchy.
Deep learning inference support
Deep learning applications rely on high-throughput multiply-accumulate operations. The XE HPG microarchitecture enables up to 275 teraOPS (TOPs) of compute performance to support deep learning frameworks and toolkits.
Intel XE Super Sampling (XeSS)
XE Super Sampling is a technique to create more compelling content by upscaling images with an increase in resolution while maintaining image quality. XeSS leverages game engines to upscale resolution up to 4x for an enhanced gaming experience.
Real-time ray tracing
Ray tracing is essential for creating realistic 3D graphics effects like shadows, reflection, and ambient occlusion. Gaming requires real-time performance and typically utilizes faster and reduced-quality rasterization instead of ray tracing to achieve the desired results. The XE HPG microarchitecture enables ray-tracing effects to be layered with traditional rasterization for enhanced graphics performance and presentation.
Mesh and variable rate shading
Mesh shading and variable rate shading (VRS) are crucial techniques for displaying high-quality graphics. Mesh shading enhances the generation of 3D primitives, while VRS provides developers with better pixel control to support high-density displays. XE HPG microarchitecture supports VRS Tier 2 to enable fine-grained shading control.
Unified lossless compression
Unified lossless compression reduces the read/write memory bandwidth and power consumption. The technique can be applied to all GPU resources and can dramatically increase performance for memory-constrained workloads.
High-bandwidth device memory
Artificial intelligence and deep learning applications require high bandwidths for optimized performance. The architecture supports from 4GB to 16GB of local memory. A maximum of eight channels delivers up to 560 GB/s of low-latency bandwidth for the most demanding high-performance computing requirements.
Supports current leading media formats
Intel's focus on the consumer laptop and desktop market for GPUs makes it essential that their processors support the current leading media formats. The company's audience includes users interested in smooth graphics processing for streaming videos and game playing. Intel Arc GPUs address customer expectations by supporting all media formats they may encounter.
The Intel Arc GPU Family
The Intel Arc line of GPUs delivers good performance for diverse usage scenarios. Intel GPUs support processor-intensive activities such as high-performance gaming, professional graphics creation, and generative artificial intelligence applications.
Intel Arc GPUs offer advanced features and superior performance that address the needs of gamers, creators, and businesses. The following are some of the highlights and advantages users can expect with Intel Arc GPUs.
Improved gaming experience: Intel Arc GPU's features and capabilities enhance users' experience and support industry gaming benchmarks. Smoother gameplay is provided with Intel XeSS upscaling technology and frame generation. Intel Xe Low Latency reduces lag and input delays. The Endurance Gaming feature enables power savings for longer gameplay sessions.
Enhanced graphics capabilities: Gamers and creators benefit from the enhanced graphics capabilities of Arc GPUs. Powerful AI engines support upscaled gaming and creative activities. AI algorithms provide higher image quality and faster gaming performance.
Compelling content creation: Intel Arc GPUs augment content creation and improve productivity. Users can access the power of 3D models with these powerful and affordable graphics cards. Cross-codec support streamlines the creative process. Dual encode and decode capabilities provide faster and more efficient video exporting.
A versatile graphics card series
Multiple models of Intel Arc GPUs are available to address various usage scenarios. In some cases, a model is designed with specific hardware constraints, such as a laptop, in mind. Others are built to handle the requirements of distinct usage scenarios like edge computing or business workloads.
Desktop GPUs
Modern desktop computer users generally require enhanced computing power to support a wide range of processor-intensive software applications.
Desktop machines are typically used for high-performance gaming and other activities that demand exceptional graphics capabilities. The addition of a graphics card to a desktop computer's motherboard gives the machine enhanced capabilities for playing games and other creative endeavors.
Intel Arc GPUs utilize technology like ray-tracing and upscaling to address the visual requirements of modern immersive gaming. They support fast and smooth responsiveness with speeds of up to 60+ FPS in 1440p resolution. Advanced AI algorithms help deliver faster gameplay and high image quality. Parallel cores speed up content creation and video editing.
Intel Arc GPUs designed for use in desktops include the following models.
Intel Arc B570: The model B570 meets the demands of high-performance gaming and offers a flexible platform for creating and editing graphics. GPU specifications include:
10 GB memory;
18 cores and ray tracing units;
144 Vector Engines;
380 GB/s memory bandwidth
203 peak TOPS.
Intel Arc B580: This model enhances the capabilities of the B570 to provide gamers with superior performance. Specifications include:
12 GB memory;
20 cores and ray tracing units;
160 Vector Engines;
456 GB/s memory bandwidth
233 peak TOPS.
Intel Arc A-Series: This series of Intel GPUs for desktops offers a range of graphics cards designed to enhance gaming and content creation and support processor-intensive AI applications. Models are equipped with 4 to 16 GB of memory and 6 to 32 cores. We will discuss these GPUs further in the professional workstation section.
Laptop GPUs
Laptop computers offer users flexibility and mobility not available with desktop machines. The mobile workforce and student and professionals' adoption of laptop computers have spurred their popularity. Unfortunately, a laptop's hardware limitations can make achieving acceptable graphics processing or gaming performance challenging.
Traditional GPUs are not suitable for the power and size constraints necessary for use in a laptop. Intel's line of Arc-based laptops efficiently addresses this problem and offers users a powerful gaming, business, and content creation platform.
Intel Arc-based laptops feature Intel Core Ultra Processors with built-in Intel Arc GPUs for faster and superior performance across all computing activities. Laptops are built with both the Arc B-Series and A-Series GPUs. The machines leverage optimized architecture to provide exceptional capacities in a slim design. They deliver power and portability while operating quietly and cooly.
Professional workstation GPUs
Intel Arc Pro A-Series GPUs are designed to handle the needs of professional workstations. They offer users built-in ray-tracing hardware, graphics acceleration, and machine learning capabilities. The result is a versatile GPU available in multiple form factors that leverages cutting-edge visual technologies and enhanced content creation.
The Intel Arc Pro A-Series GPUs share the following features.
Intel ensures compatibility between specialized software and the company's high-performance GPUs through a rigorous certification process. Working closely with Independent Software Vendors (ISVs) to provide superior reliability and stability.
Built-in ray-tracing hardware accelerates image creation and supports pro workflows with a cost-efficient GPU. Small Form Factor cards enable the support of up to four ultra-large displays for multi-display home or office use.
Discrete and laptop Arc GPUs support Ultra-High Definition (UHD) and ultrawide UHD display resolutions. The cards are optimized to work with modern viewport technology for maximum performance and stability. Dolby Vision support optimizes image quality to deliver consistently exceptional visuals.
High bandwidth speeds enhance graphics memory and performance. AV1 hardware acceleration provides faster encoding than software alternatives. Dedicated acceleration is available when needed for advanced AI applications.
The Series-A Hyper Compute feature integrates the power of Intel CPUs and GPUs for greater performance. All available compute engines and AI accelerators are employed for tasks like image processing or machine learning.
Dynamic power share capabilities intelligently route power between a laptop CPU and GPU to boost performance for a given task. A smart algorithm allocates power where it is needed most.
The following models are representative of the Intel Arc A-Series of GPUs.
Intel Arc Pro A40 GPUs offer superior graphics acceleration and machine learning capabilities in a small, single-slot form factor. Specifications include:
6 GB memory;
8 cores and ray tracing units;
128 Vector Engines;
192 GB/s memory bandwidth
69 peak TOPS.
Intel Arc Pro A50 GPUs are larger dual-slot units offering a step up from the A40. Its specifications are similar to the A40.
Intel Arc Pro A60 GPUs are a significant improvement from the A40 and A50, offering more performance in a single-slot form. Specifications include:
12 GB memory;
16 cores and ray tracing units;
256 Vector Engines;
384 GB/s memory bandwidth
151 peak TOPS.
Intel Arc GPUs for Edge Computing
Intel Arc Graphics discrete GPUs are designed to boost the performance of edge workloads. The graphics cards help create immersive visual experiences. They also enhance video production, media transcoding, and streaming. Specialized AI engines support the deployment of advanced AI workloads at the edge.
Multiple Intel Arc A-Series GPUs are suitable for edge workloads. The memory capacity of these GPUs ranges from 4 GB to 16 GB, with bandwidths from 124 GB/s to 512 GB/s. GPUs are equipped with 6 to 28 cores and produce speeds between 49 TOPS and 229 TOPS.
Systems equipped with Intel Arc GPUs are being used to innovate in diverse market sectors, such as retail and self-service electric vehicle charging. The ADLINK automated optical inspection solution is built with Intel GPUs and reduces the costs of quality assurance in the manufacturing industry.
Intel Data Center GPUs
Intel's line of data center GPUs is designed to provide businesses with the power they need for mathematically complex and graphics-intensive processing. These GPUs boost CPU performance and provide parallel processing capabilities to speed outcomes and accelerate innovation.
Intel Data Center GPU Flex Series
The Flex Series of data center GPUs is designed to support AI inference solutions, virtual desktop infrastructure, and media processing. The GPUs feature up to four Xe media engines to reach speeds of up to 256 TOPS for AI inferencing. No license or royalty fees make the Flex Series a cost-effective GPU solution.
Built-in AV1 encoding reduces bandwidth requirements and enables high stream density for more media streams. Low power consumption via open source optimizations delivers higher throughput while conserving energy. The Flex Series supports scalable and flexible advanced workloads.
Intel Data Center GPU Max Series
The GPU Max Series is built utilizing the Intel Xe Link high-speed, coherent, unified fabric for extensive flexibility and scalability. The processors support high capacity workloads with up to 128 GB of high bandwidth memory, 64 MB of L1 cache, and 408 MB of L2 cache. Animation and visualization are accelerated by up to 128 ray tracing units on each GPU.
The Max Series accelerates AI workloads and matrix operations via the Intel Xe Matrix Extensions (XMX) built with deep systolic arrays. The Aurora supercomputer at the Argonne National Laboratory is powered by 10,000 server blades equipped with Intel Max Series processors. The blades support a machine learning process that trains AI models to identify structures and create 3D visualizations.
Atlantic Net's Data Center GPU Solutions
Atlantic Net's data center GPU solutions are built on a foundation of NVIDIA GPUs. We offer high-performance systems designed to power next-generation AI models, complex mathematical applications, and parallel computing algorithms.
Contact us today and learn how our GPU solutions can help your business thrive.
### GPGPU vs. GPU: 4 Key Differences and GPGPU Best Practices
What Is a GPU?
A graphics processing unit (GPU) is a specialized processor for graphics rendering. It handles large data blocks and complex calculations, making it crucial for rendering images, videos, and animations in computer applications. GPUs consist of hundreds to thousands of smaller cores than central processing units (CPUs), enabling parallel processing.
Initially, GPUs were developed for real-time graphics rendering for gaming but have since evolved to support tasks requiring massive parallel processing power. They handle tasks like image processing, machine learning, and scientific simulations. By offloading certain tasks from the CPU, GPUs boost overall system performance and efficiency.
What Is GPGPU?
General-purpose computing on graphics processing units (GPGPU) refers to using a GPU to perform computation traditionally handled by a CPU. It transforms a GPU from a specialized graphics engine into a general-purpose parallel processing unit. This capability allows for processing non-graphical mathematical and data-centric tasks.
GPGPU leverages the architecture of GPUs, which are inherently parallel, to accelerate a broad range of tasks beyond graphics. It has become valuable for operations intensive in data and computation, such as deep learning, scientific research, and financial modeling.
This is part of a series of articles about GPU for AI.
Evolution of GPUs
The evolution of GPUs spans several decades, driven by advancements in graphics technology and the increasing need for computational power. Early GPUs, introduced in the 1980s and 1990s, were primarily fixed-function hardware for rendering 2D and 3D graphics. These GPUs focused on accelerating tasks such as rasterization, shading, and texture mapping, which were computationally intensive for CPUs at the time.
In the early 2000s, programmable GPUs emerged, allowing developers to write custom shaders using programming languages like DirectX HLSL and OpenGL GLSL. This shift marked a significant turning point, enabling more flexibility in graphics rendering and laying the groundwork for general-purpose GPU computing.
Modern GPUs, such as those from NVIDIA and AMD, are highly sophisticated, featuring thousands of cores and support for parallel computing frameworks like CUDA and OpenCL. These GPUs are no longer confined to graphics tasks—they now play a central role in high-performance computing applications, including artificial intelligence, video processing, and scientific simulations. The introduction of tensor cores and AI accelerators in recent GPU generations has further solidified their importance for modern computational use cases.
How GPGPU Works
GPGPU leverages the parallel architecture of GPUs to accelerate computational tasks by dividing them into smaller chunks that can be processed simultaneously. Unlike CPUs, which typically have a few powerful cores optimized for sequential processing, GPUs have thousands of smaller cores designed for concurrent execution, making them ideal for tasks with repetitive operations on large datasets.
To utilize GPGPU, developers write programs using parallel computing frameworks like CUDA (NVIDIA) or OpenCL (cross-platform). These programs break down computations into kernels, which are small units of code executed in parallel by GPU threads. For example, in matrix multiplication, each thread might handle the calculation of a single matrix element, enabling thousands of computations to occur simultaneously.
GPGPU's efficiency stems from its memory hierarchy, including shared memory for thread communication and global memory for larger data storage. By minimizing data transfers between the GPU and CPU, and optimizing memory usage within the GPU, performance can be maximized.
Applications of GPGPU range from accelerating deep learning models by rapidly training neural networks to processing large-scale simulations in physics and chemistry. Its ability to handle massive parallelism makes it indispensable in many domains where speed and scalability are critical.
Related content: Read our guide to GPU parallel computing
Tips from the expert:
Richard Bailey
Technical Editor
Richard Bailey brings over two decades of IT expertise, from traditional data centers to cutting-edge cloud solutions. As the founder of turbogeek.co.uk and a seasoned writer, he focuses on delivering authoritative content on our hosting services, HIPAA compliance, and related topics.
In my experience, here are tips that can help you better understand and leverage the differences between GPUs and GPGPU for computational workloads:
Assess computational intensity to determine GPU vs. GPGPU needs: Not all workloads benefit equally from GPGPU. For example, tasks with low parallelizability (like recursive algorithms) may perform better on CPUs or hybrid architectures. Benchmark your specific workload to identify if the complexity justifies GPGPU optimization.
Use domain-specific libraries for faster implementation: Many industries now offer pre-built libraries optimized for GPGPU (e.g., cuDNN for deep learning or TensorFlow-GPU for AI). These libraries take advantage of GPGPU APIs without requiring you to develop low-level kernels, saving development time while ensuring efficiency.
Combine CPU and GPU workloads strategically: Offloading all tasks to a GPU can sometimes lead to inefficiencies. Use a hybrid approach where CPUs handle sequential or low-parallelism tasks while GPUs focus on parallelizable components. Frameworks like CUDA Streams can help synchronize these processes effectively.
Account for PCIe latency in data transfers: Data transfer between the host (CPU) and GPU via PCIe can become a bottleneck. Minimize these transfers by caching data on the GPU memory whenever possible. Consider using Unified Memory or pinned memory to further reduce latency for shared data.
Experiment with mixed-precision computing: Modern GPUs often support mixed-precision computing (e.g., FP16 or Tensor Cores). Using lower precision where possible can drastically increase throughput without significant accuracy loss in many applications like AI training and simulations.
GPU vs. GPGPU: Key Differences
1. Architecture Differences
GPUs traditionally focused on accelerating graphics tasks with a fixed-function pipeline, optimized for the inherent parallelism in image rendering. In contrast, GPGPU utilizes GPUs' programmable nature to address a wider range of computational problems. Unlike traditional GPUs, GPGPU emphasizes flexibility and programmability, supporting diverse operations beyond graphics tasks.
Modern GPUs are architecturally suited for GPGPU workloads, with unified shaders and increased memory bandwidth. They can handle complex calculations needed for scientific computing or machine learning. The move to general-purpose capabilities has driven changes in hardware design, enhancing GPUs' ability to manage irregular workloads common in non-graphics applications.
2. Focus
The primary focus of traditional GPUs is rendering graphics efficiently. They are optimized for displaying images at the highest fidelity and speed possible, essential for video games and multimedia. The architecture is fine-tuned for tasks like shading, texture mapping, and pixel rendering.
On the other hand, GPGPU shifts focus from rendering to computation across various domains. It seeks to maximize computational efficiency using the GPU's cores for parallel processing. The objective is to tackle problems requiring significant data-crunching power, reducing processing times for complex models in scientific research or large-scale data analysis.
3. Programming APIs
GPUs are programmed using graphics-specific APIs like DirectX and OpenGL, tailored for rendering operations. These APIs handle graphics-centric tasks, providing abstractions for developers to create visually intense applications.
In contrast, GPGPU relies on APIs like CUDA and OpenCL that facilitate parallel computing. These APIs provide the tools developers need to harness the immense processing power of GPUs for computing tasks. They unlock the GPU's potential beyond graphics, allowing for applications in areas like computational physics, finance, and artificial intelligence.
4. Key Applications
Traditional GPUs are vital in sectors like gaming, animation, and content creation, where rapid image rendering is crucial. They enable high-resolution displays and smooth, interactive environments. Applications in this domain rely on the GPU's ability to continuously refresh visuals at high frame rates.
GPGPU broadens the scope to include data-intensive applications like deep learning, scientific simulations, and cryptocurrency mining. Its ability to quickly process vast amounts of data makes it indispensable for tasks involving large-scale computations. As a result, industries like healthcare and finance are increasingly leveraging GPGPU for data analysis and predictive modeling.
5 Best Practices for Implementing GPGPU
1. Choose the Right Hardware
Selecting suitable hardware is crucial for effective GPGPU implementation. Consider factors like the number of cores, memory bandwidth, and energy efficiency. High-end GPUs may offer more performance but at higher costs and power consumption. Analyzing workload requirements can aid in decision-making, ensuring the chosen GPU aligns with performance and budget constraints.
Look for hardware that supports the desired APIs and frameworks. Compatibility with existing systems and future-proofing against technological advances should also factor into the hardware selection, as should support features such as ray tracing or AI accelerators.
2. Optimize Memory Usage
Memory bandwidth and management are critical in GPGPU applications, requiring optimization for peak performance. Efficient data transfer between host and device memory minimizes latency and maximizes throughput. Structuring data to align with GPU memory architecture is essential to ensure swift access and processing times.
Avoiding data transfer bottlenecks by compacting data and using shared memory intelligently can lead to substantial performance gains. Memory usage optimizations, such as overlapping data transfer with computation, help maintain high levels of GPU occupancy. Profiling tools can identify memory constraints, guiding refinement steps for more efficient memory usage.
3. Leverage Parallelism Effectively
Parallelism is at the heart of GPGPU, exploiting thousands of GPU cores to perform simultaneous operations. Designing algorithms to maximize parallel processing can significantly speed up tasks. Breaking down problems into smaller, independently executable units is fundamental for harnessing the full power of GPUs.
Considerations like load balancing and minimizing serialization points are vital. Ensuring each GPU core is optimally utilized without idle time can lead to major efficiency improvements. Parallel execution must account for dependencies and potential bottlenecks. Efficient task distribution techniques, such as thread adaptation strategies, can enhance overall performance.
4. Profile and Debug Performance
Profiling and debugging are ongoing tasks in GPGPU development, crucial for identifying performance bottlenecks. Use profiling tools to analyze code execution, understand kernel behavior, and optimize code paths. These tools help in monitoring resource utilization and identifying areas where improvements can increase efficiency.
Debugging parallel applications poses unique challenges, but modern tools offer insights into GPU execution patterns and potential errors. Regular testing and code verification help detect issues early. By iteratively profiling and debugging, developers can hone their applications, achieving optimal performance and reliability in GPU-based computing setups.
5. Stay Updated with Latest SDKs
Staying current with the latest software development kits (SDKs) and updates is essential for taking advantage of new features and performance improvements. Manufacturers frequently release SDK updates to support new hardware capabilities and optimize existing functionalities. Leveraging these updates can lead to substantial performance enhancements and new capabilities.
Keeping track of SDK and driver updates ensures compatibility and harnesses the latest advancements in GPU technology. It also provides access to improved libraries and debugging tools. Regularly revisiting and updating code in line with new SDK features can optimize application performance and align with cutting-edge developments in the field.
Next-Gen Dedicated GPU Servers from Atlantic.Net, Accelerated by NVIDIA
Experience unparalleled performance with dedicated cloud servers equipped with the revolutionary NVIDIA accelerated computing platform.
Choose from the NVIDIA L40S GPU and NVIDIA H100 NVL to unleash the full potential of your generative artificial intelligence (AI) workloads, train large language models (LLMs), and harness natural language processing (NLP) in real time.
High-performance GPUs are superb at scientific research, 3D graphics and rendering, medical imaging, climate modeling, fraud detection, financial modeling, and advanced video processing.
Learn more about Atlantic.net GPU server hosting
### GPU Computing: Use Cases, Challenges, and 5 Critical Best Practices
What Is GPU Computing?
GPU computing involves utilizing graphics processing units (GPUs) to perform computation typically executed by a CPU. This approach leverages the parallel processing capabilities of GPUs to expedite complex computational tasks. Originally designed to render graphics, GPUs are now used for a broad array of applications due to their ability to process many tasks simultaneously. This parallel architecture makes them suited for handling large-scale computations quicker than traditional CPUs.
The significance of GPU computing is rooted in its ability to handle massive datasets and perform extensive calculations at an accelerated pace. It has become a vital tool in fields requiring intensive computation. Through the use of APIs like CUDA and OpenCL, developers can exploit GPUs to reduce execution times for various applications, ranging from scientific computations to machine learning models.
This is part of a series of articles about GPU for AI.
Evolution of GPUs: From Graphics to General Purpose Computing
GPUs were initially designed to accelerate rendering tasks for computer graphics, handling operations like shading, texture mapping, and 3D transformations. These tasks benefited greatly from the parallel processing nature of GPUs, which could handle multiple graphical computations simultaneously. As video games and visual effects demanded increasingly sophisticated graphics, GPU architectures evolved to deliver higher performance and more flexibility.
The shift toward general-purpose computing began in the early 2000s when developers recognized that the parallel processing capabilities of GPUs could also be applied to non-graphical computations. This realization led to the development of programming frameworks like CUDA (by NVIDIA) and OpenCL (an open standard), which allowed GPUs to perform a wider range of computational tasks. These frameworks enabled researchers and engineers to harness GPUs for applications beyond graphics, such as scientific simulations, machine learning, and data analytics.
Modern GPUs are designed with high-performance computing in mind, offering thousands of cores optimized for parallelism, large memory bandwidth, and support for advanced programming models. This evolution has transformed GPUs into tools for solving complex problems across various domains, from medical imaging to autonomous vehicles.
Related content: Read our guide to GPU cloud computing
Key Use Cases of GPU Computing
Scientific Computing
Scientific computing utilizes GPUs to solve complex mathematical problems faster than traditional computing methods. In fields like physics, chemistry, and genomics, the parallel processing power of GPUs enables researchers to conduct simulations and analyze data at unprecedented speeds. The ability to perform large-scale computations simultaneously makes GPUs essential tools in these research areas, delivering results in a fraction of the time previously required.
Machine Learning and Deep Learning
In machine learning and deep learning, GPUs have become indispensable due to their capability to process vast datasets and run computations in parallel. Tasks that involve large neural networks benefit significantly from GPU acceleration, which reduces training time and enhances performance. The architecture of GPUs aligns well with the parallelizable nature of machine learning algorithms, making them ideal for deploying high-performance models.
The use of GPUs in these fields allows for efficient handling of complex operations, such as matrix multiplications and data transformations, which are foundational to neural network training. This efficiency speeds up model development, enabling researchers and developers to iterate and optimize models rapidly.
Data Analytics
Data analytics benefits greatly from GPU computing by accelerating data processing speeds and enabling real-time analysis. As datasets grow in size and complexity, traditional CPUs struggle to keep pace. GPUs, however, offer the necessary compute power to process and analyze large volumes of data quickly, providing insights faster. This characteristic is essential in industries like finance and healthcare, where timely decision-making is critical.
GPU acceleration in data analytics facilitates complex computations such as big data processing and real-time querying. Businesses can leverage GPU power to derive actionable insights from data streams, improving responsiveness and strategic planning.
Cryptography and Blockchain
Cryptography and blockchain technologies have found a natural fit with GPU computing due to the intensive mathematical operations involved. GPUs accelerate tasks such as hashing and encryption by executing multiple calculations in parallel. This capability is especially valuable in cryptocurrency mining, where speed and efficiency directly influence profitability. Blockchain technology relies heavily on the ability to perform secure transactions rapidly, an area where GPUs excel.
The parallel nature of GPU processors supports enhanced encryption and decryption capabilities, making them efficient tools for cryptographic applications. This advantage extends to blockchain operations, such as validating transactions and managing distributed ledgers.
Tips from the expert:
Richard Bailey
Technical Editor
Richard Bailey brings over two decades of IT expertise, from traditional data centers to cutting-edge cloud solutions. As the founder of turbogeek.co.uk and a seasoned writer, he focuses on delivering authoritative content on our hosting services, HIPAA compliance, and related topics.
In my experience, here are tips that can help you better harness GPU computing effectively:
Optimize GPU utilization through workload profiling: Use tools like NVIDIA Nsight Systems or AMD’s ROCm profiler to analyze how your workloads utilize GPU resources. By identifying bottlenecks such as idle cores, memory transfer delays, or suboptimal thread usage, you can fine-tune your code for maximum performance.
Avoid memory oversubscription with careful batching: Instead of transferring the entire dataset to GPU memory at once, split it into smaller batches that fit within available memory. This prevents performance degradation from oversubscription and allows the GPU to operate more efficiently.
Exploit multi-GPU environments with optimized frameworks: For multi-GPU setups, use frameworks like NCCL (NVIDIA Collective Communication Library) to ensure efficient communication between GPUs. Avoid redundant data transfers by designing algorithms with reduced inter-GPU synchronization.
Adopt containerized GPU environments: Use container technologies like NVIDIA Docker or Singularity to standardize and simplify GPU-enabled application deployment. This ensures consistent performance across different environments and avoids compatibility issues.
Incorporate energy-aware scheduling: Develop energy-efficient scheduling techniques that dynamically adjust GPU workloads based on performance and energy trade-offs. Combine this with real-time energy monitoring tools like NVIDIA’s nvidia-smi to reduce power consumption without compromising performance.
Challenges in GPU Computing
Scalability Issues
Scalability is a significant challenge in GPU computing, particularly when deploying applications across multiple GPUs or clusters. The difficulty lies in efficiently distributing workloads and maintaining communication between devices to optimize performance. As applications grow in complexity, ensuring scalability without performance bottlenecks becomes crucial, requiring sophisticated algorithms and efficient data management strategies.
Managing scalability involves addressing hardware limitations and ensuring software frameworks can handle increased loads. Ensuring that applications remain efficient as they scale is complex, demanding constant monitoring and adjustments to balance loads across different GPUs.
Power Consumption
Power consumption is a critical concern in GPU computing, impacting both operational costs and environmental sustainability. GPUs are power-intensive, consuming substantial electricity to maintain their high-performance capabilities. This factor can lead to significant expenses, especially in large-scale or continuous operations, challenging organizations to balance performance gains with energy efficiency.
To address power consumption issues, optimizing GPU applications for energy efficiency is essential. Techniques such as dynamic voltage scaling and workload management can mitigate power usage, but may require trade-offs in performance.
Portability Across Different GPU Platforms
Portability across various GPU platforms presents another significant challenge. Differences in hardware and software environments can complicate application deployment and maintenance. Developers need to ensure that their applications can run efficiently across different GPU architectures, which often involves accounting for varying capabilities and performance benchmarks.
Addressing portability issues requires leveraging platform-agnostic development tools and adhering to standardized APIs. However, achieving true cross-platform compatibility can be labor-intensive, often necessitating modifications to codebases to exploit specific hardware features optimally.
5 Best Practices for Successful GPU Computing
1. Efficient Memory Usage
Efficient memory usage is crucial in optimizing GPU performance. Given their limited memory compared to traditional CPUs, GPUs require careful management of resources to avoid bottlenecks. Techniques like memory coalescing, data compression, and optimizing memory transfers can significantly enhance GPU efficiency. Ensuring that memory is utilized effectively reduces latency and maximizes processing throughput.
Developers should focus on minimizing data movement between the CPU and GPU, as this can slow operations considerably. Enhancing memory access patterns through meticulous coding practices is essential in maximizing resource utilization.
2. Choosing the Right GPU Hardware
Selecting appropriate GPU hardware is vital for achieving desired performance outcomes. Factors like computational power, memory capacity, and power efficiency must be considered based on application requirements. A mismatch in hardware capabilities and application demands can lead to suboptimal performance or increased costs. Understanding the specific needs of your application guides optimal hardware investments.
Evaluating GPUs based on benchmarks and performance metrics ensures compatibility with existing systems and scalability for future needs. Tailoring GPU choice to application specifics can enhance performance efficiency, reduce processing times, and ensure cost-effectiveness.
3. Utilizing GPU-Accelerated Libraries
GPU-accelerated libraries offer pre-optimized solutions to boost application performance without requiring extensive code modifications. Libraries like cuBLAS, cuDNN, and TensorRT provide efficient implementations of common algorithms, allowing developers to leverage GPU power seamlessly. These tools reduce development time while maximizing performance gains in numerical computations and machine learning tasks.
Integrating GPU-accelerated libraries requires understanding their functionalities and compatibility with existing codebases. By utilizing these libraries, developers can focus on application-specific logic while relying on tried-and-tested optimizations for underlying processes.
4. Keeping Up with Driver and Toolkit Updates
Staying current with driver and toolkit updates is essential for maintaining optimal GPU performance. Manufacturers continually release updates to enhance capabilities, fix bugs, and improve security. Ensuring that GPUs operate with the latest drivers and toolkits can enhance functionality and prevent compatibility issues, particularly as new applications and features are developed.
Regular update management involves monitoring release notes and understanding the impact of changes. This practice ensures that you leverage the full potential of GPU advancements and address any emerging vulnerabilities.
5. Consider GPU Server Hosting
Hosted GPU servers offers scalable solutions for organizations requiring high-performance computing environments. Advanced hosting providers provide dedicated GPU resources that can be tailored to specific workload demands, ensuring efficient processing across diverse applications.
Leveraging GPU server hosting can reduce infrastructure costs and simplify IT management. By utilizing external hosting services, companies can focus on core business tasks while ensuring robust computational support. This approach allows for seamless scaling of resources in response to workload fluctuations, providing an adaptable and cost-effective computing environment.
Next-Gen Dedicated GPU Servers from Atlantic.Net, Accelerated by NVIDIA
Experience unparalleled performance with dedicated cloud servers equipped with the revolutionary NVIDIA accelerated computing platform.
Choose from the NVIDIA L40S GPU and NVIDIA H100 NVL to unleash the full potential of your generative artificial intelligence (AI) workloads, train large language models (LLMs), and harness natural language processing (NLP) in real time.
High-performance GPUs are superb at scientific research, 3D graphics and rendering, medical imaging, climate modeling, fraud detection, financial modeling, and advanced video processing.
Learn more about Atlantic.net GPU server hosting
### GPU Parallel Computing: Techniques, Challenges, and Best Practices
What Is GPU Parallel Computing?
GPU parallel computing involves using graphics processing units (GPUs) to run many computation tasks simultaneously. Unlike traditional CPUs, which are optimized for single-threaded performance, GPUs handle many tasks at once due to their thousands of smaller cores. This architecture is suited for tasks where computations can be distributed across multiple processors, making it integral to fields requiring large-scale data processing, such as machine learning, scientific simulations, and financial modeling.
GPU parallel computing relies on executing multiple operations concurrently, leveraging the parallel architecture of GPUs. This is achieved by dividing the workload into smaller tasks and executing them simultaneously across the GPU cores. By utilizing this capability, applications can achieve significant speed improvements compared to CPU-only processing.
This is part of a series of articles about GPU for AI.
Benefits of GPU Parallel Computing
GPU parallel computing offers a range of advantages for applications requiring high performance and efficiency:
Enhanced computational speed: GPUs process multiple tasks simultaneously, significantly reducing execution time for data-intensive operations like machine learning and simulations compared to CPU-based processing.
Energy efficiency: GPUs perform parallel operations more efficiently, consuming less energy per computation. This makes them ideal for large-scale data centers and energy-conscious applications.
Scalability: Modern GPUs scale effectively across increasing data sizes and multiple devices, enabling linear speedups for demanding workloads.
Support for complex algorithms: GPUs facilitate the execution of algorithms, such as those used in deep learning and scientific simulations, which were previously infeasible due to computational limits.
Improved resource utilization: By executing thousands of threads concurrently, GPUs maximize hardware utilization, ensuring computational resources are effectively employed for suitable workloads.
Related content: Read our guide to GPU cloud computing
Programming Models for GPU Parallel Computing
GPU parallel computing utilizes various programming models to facilitate the execution of parallel tasks.
CUDA Programming Model
The CUDA programming model, developed by NVIDIA, is tailored for developers aiming to optimize computing operations on NVIDIA GPUs. It allows direct access to the GPU's parallel architecture, enabling significant performance boosts for applications that can benefit from parallelism. CUDA provides a set of extensions to the C programming language, empowering developers to write functions, known as kernels, that execute across multiple GPU cores. This enables efficient data processing and algorithm execution in fields that demand high computational power.
CUDA excels in scalability and efficiency, allowing developers to handle complex computational tasks with ease. The model supports various memory types and synchronization techniques that enhance data handling and thread coordination. This flexibility and control make it a preferred choice for domains like scientific computing, deep learning, and real-time rendering. CUDA also provides extensive libraries and tools provide support for debugging and optimization.
OpenCL Framework
The OpenCL (Open Computing Language) framework is an open standard for cross-platform parallel computing. It facilitates the execution of tasks across diverse hardware platforms, including GPUs, CPUs, and other processors. OpenCL's flexibility makes it an attractive option for developers seeking to write portable code that can efficiently run on different devices and architectures. It allows the use of a common language to harness the processing power of available hardware.
OpenCL provides detailed control over computational resources, enabling developers to optimize performance across a wide array of devices. It defines a programming interface for writing kernels, which are executed in parallel across processing elements within the system's devices. This model supports parallel execution on heterogeneous systems, bridging the gap between different computational devices.
Vulkan Compute Shaders
Vulkan is a low-level API that allows developers to control graphics and computation on modern GPUs. Specifically, its compute shaders facilitate parallel computation outside traditional graphics rendering tasks. By providing direct access to GPU resources, Vulkan enables fine-tuned performance optimization, making it suitable for applications requiring extensive computational workloads, such as simulations and custom rendering engines.
Compute shaders in Vulkan are designed to handle complex mathematical operations needed for non-graphics computation. The API's low-level nature means a steep learning curve, but it rewards with uncompromised performance and detailed management of GPU operations. Unlike more generalized frameworks, Vulkan's emphasis on explicit resource management can lead to more efficient execution, assuming developers manage synchronization and resource allocation precisely.
Parallel Computing Techniques on GPUs
Data Parallelism
Data parallelism involves executing the same operation on distributed data simultaneously across multiple GPU cores. This technique is effective for workload types that require repetitive operations on large datasets. By processing data chunks in parallel, data parallelism accelerates the computation process, significantly reducing execution time compared to serial processing. This approach is widely applicable in tasks like matrix multiplications, image processing, and neural network training.
One of the primary advantages of data parallelism is its scalability. As datasets grow, the work can be divided into more portions and allocated to the available GPU cores, effectively managing large-scale computations. The increased throughput comes from the parallel execution, which not only speeds up processing but also enhances resource utilization. Effective implementation of data parallelism requires careful synchronization and management of data dependencies to ensure accuracy and efficiency in computational tasks.
Task Parallelism
Task parallelism divides applications into distinct tasks that can be processed concurrently, providing a different approach to parallel computation. Unlike data parallelism, which focuses on dividing data, task parallelism concentrates on splitting the work itself into smaller, independent tasks. This technique is optimal for applications where tasks can run independently and in parallel, such as rendering different frames in parallel within a video game or processing various inputs in a multi-threaded server application.
Implementing task parallelism on a GPU requires careful structuring to ensure tasks execute independently without data conflicts. Since each task can be distinct and possibly varied in resource requirements, load balancing and scheduling become critical. Efficient task parallelism enhances application throughput by executing multiple functions simultaneously, leveraging the full capability of GPU resources. By effectively distributing tasks across GPU cores, developers can maximize processing efficiency and achieve higher performance for complex applications requiring multiprocess execution.
Hybrid Parallelism
Hybrid parallelism combines data and task parallelism, creating a strategy for efficiently utilizing GPU resources. This approach is beneficial in complex applications where both large data sets and diverse task management are required. Hybrid parallelism allows simultaneous management of data and tasks, dynamically adjusting to application demands and improving overall throughput and resource usage.
By integrating both parallelism strategies, hybrid parallelism maximizes GPU potential, particularly in heterogeneous computing environments where multiple task types and data processing needs arise simultaneously. However, successful hybrid parallelism implementation often requires intricate understanding of GPU architecture and workload characteristics to balance and coordinate tasks and data efficiently.
Tips from the expert:
Richard Bailey
Technical Editor
Richard Bailey brings over two decades of IT expertise, from traditional data centers to cutting-edge cloud solutions. As the founder of turbogeek.co.uk and a seasoned writer, he focuses on delivering authoritative content on our hosting services, HIPAA compliance, and related topics.
In my experience, here are tips that can help you better leverage GPU parallel computing for advanced performance and efficiency:
Use GPU occupancy calculators: Use GPU occupancy calculators (e.g., NVIDIA’s Occupancy Calculator) to fine-tune the number of active warps and achieve the optimal balance between register usage, shared memory, and thread count. This ensures maximum throughput while avoiding underutilization or resource contention.
Employ warp specialization: Design threads within a warp to specialize in different subtasks (e.g., some threads handle computation while others manage memory prefetching). This approach reduces memory latency and improves performance for highly memory-bound applications.
Exploit hardware-accelerated tensor cores (where available): If using GPUs like NVIDIA’s Tensor Core GPUs, take advantage of tensor operations (e.g., matrix-matrix multiplications in mixed precision) to drastically accelerate workloads in deep learning and linear algebra. This requires leveraging libraries like cuBLAS or writing custom kernels that utilize these specialized cores.
Minimize divergence in thread execution: Avoid conditional branching (if-else) within GPU warps, as divergent execution paths cause some threads to idle while others execute. Instead, restructure algorithms to use uniform branching or predicated instructions to ensure all threads execute together.
Implement memory prefetching: Manually prefetch data from global memory to shared memory in advance of computation. This overlaps memory latency with computation, preventing threads from stalling while waiting for data transfers.
Common Challenges of GPU Parallel Computing
Despite its advantages, GPU parallel computing poses several challenges:
Debugging Parallel Code
Debugging parallel code involves challenges not typically encountered in single-threaded programs. The concurrent execution of multiple threads can lead to unpredictable results, making it difficult to trace and diagnose issues using traditional debugging methods. This complexity necessitates specialized tools that can track thread activity and state, helping developers identify problems like deadlocks and race conditions, where threads compete for shared resources unpredictably.
These tools must handle the intricacies of parallel execution, providing insights into thread interactions and synchronization issues. Effective debugging requires understanding not only the logical flow of the program but also the memory interactions between concurrent threads. GPUs, with their vast number of cores executing operations simultaneously, exacerbate these issues. Developers often need to employ techniques such as logging states or using parallel debugging utilities to manage and resolve issues arising from parallel code execution.
Handling Race Conditions
Race conditions occur when multiple threads access shared data simultaneously, leading to unpredictable results. Handling these conditions on GPUs is challenging due to the inherent parallelism and the vast number of concurrent processes. Effective management of race conditions requires a comprehensive understanding of synchronization techniques, including mutexes, locks, and atomic operations, which ensure orderly access to shared resources.
Addressing race conditions involves identifying potential conflict areas and implementing appropriate synchronization mechanisms to manage resource access. However, excessive synchronization can hinder performance gains from parallelism by introducing bottlenecks. Striking a balance between ensuring correct data handling and maintaining performance efficiency is essential. Developers must carefully design algorithms to minimize shared resource interaction while utilizing GPU capabilities efficiently.
Scalability Issues
Scalability in GPU parallel computing involves maintaining performance gains as workloads and data sizes grow. A common issue arises when increased workload sizes lead to diminishing returns in speed and efficiency. This challenge can result from inefficiencies in workload distribution, memory access patterns, or insufficient GPU resource utilization. Unbalanced workloads lead to underutilized cores, negating the benefits of parallelism and reducing computational effectiveness.
To resolve scalability issues, developers must focus on optimal resource allocation, efficient memory usage, and effective workload distribution. Techniques such as load balancing, where tasks are evenly distributed across GPU cores, and optimizing memory transfer operations, are vital for maintaining scalability. Additionally, understanding the architectural limitations and leveraging hardware-specific features can enhance performance. By addressing these factors, developers can ensure that their applications scale effectively, maximizing computational capabilities and maintaining high performance levels as workload demands increase.
Best Practices for GPU Parallel Computing
1. Profile and Benchmark Regularly
Profiling and benchmarking are crucial practices in GPU parallel computing, essential for maximizing application performance. Regular profiling involves monitoring the application's runtime behavior to identify bottlenecks, inefficient resource use, and areas where improvements can be made. Tools like NVIDIA Nsight and AMD’s CodeXL allow developers to gain insights into how a GPU executes their code, highlighting inefficiencies in memory usage and execution paths that might hinder performance.
Benchmarking provides a framework for measuring application performance against predefined standards or previous versions, helping developers track improvements and regressions. By comparing these metrics over time, developers can assess the impact of code changes or hardware upgrades on application performance. Regular execution of these practices ensures that applications remain efficient, scalable, and capable of leveraging the full potential of their GPU resources.
2. Optimize Memory Access Patterns
Optimizing memory access patterns is essential for efficient GPU parallel computing. Efficient memory use minimizes access latency and maximizes bandwidth utilization, critical for achieving high performance. GPUs have a hierarchical memory structure with significant speed differences between levels, so accessing global memory is expensive compared to shared memory. For optimal performance, developers should reduce global memory calls, making effective use of faster memory types like shared memory and registers, thus enhancing data throughput and execution speed.
Additionally, coalescing memory accesses—ensuring that memory operations align with GPU architecture—limits unnecessary data transfer and makes better use of memory bandwidth. By organizing data structures and memory access patterns to fit the GPU's architecture, developers can reduce bottlenecks and enhance performance. Understanding GPU memory architecture and its impact on computational efficiency is pivotal. Through careful consideration and optimization of memory access patterns, applications can achieve higher execution rates.
3. Utilize Asynchronous Execution
Asynchronous execution in GPU computing involves executing tasks concurrently without waiting for other operations, significantly enhancing performance by overlapping computations and data transfers. By using streams or command queues, developers can decouple data management from computation, allowing GPUs to process data while simultaneously executing kernels. This reduces idle time and maximizes resource usage, leading to improved throughput and efficiency in GPU applications.
Employing asynchronous execution requires careful planning to avoid race conditions and ensure correct synchronization between tasks. Proper management of asynchronous workflows ensures that data dependencies are respected, and results remain accurate. Utilizing CUDA streams or OpenCL command queues, for instance, provides mechanisms for executing multiple operations asynchronously, optimizing the sequencing and overlap of different tasks.
4. Balance Workloads Across Threads and Blocks
Balancing workloads across threads and blocks ensures that GPU resources are efficiently utilized, preventing some threads from idling while others are overloaded. This balance is vital for maximizing parallel execution efficiency, as uneven distribution can lead to underutilized cores and reduced performance gains from parallelism. Developers need to divide tasks such that all threads and blocks handle equivalent amounts of work, ensuring uniform resource utilization and minimizing waiting time.
Achieving effective workload balance requires understanding the application's computational demands and the GPU's architectural characteristics. Techniques such as dynamic load balancing and adjusting block sizes in response to workload characteristics can help achieve even distribution. By refining the workload division, developers enhance throughput by ensuring all available resources contribute to task execution. This strategic partitioning maximizes computational efficiency and resource usage.
5. Keep Kernels Lightweight
Keeping kernels lightweight is critical for efficient GPU parallel computing, focusing on minimizing the computational complexity and runtime length of each task. Lightweight kernels ensure that tasks execute quickly, maximizing the number of operations that the GPU can perform in a given time. This practice leads to better resource utilization and higher application throughput, reducing the overhead introduced by complex or overly large kernels.
Lightweight kernels can achieve higher performance by facilitating faster context switching and allowing more concurrent task executions within the GPU. Developers should aim to simplify operations within kernels, breaking down complex tasks into smaller, manageable kernels that efficiently utilize the GPU's parallel capabilities. While lightweight design may require more kernels to accomplish a task, their efficiency and reduced computational footprint generally result in superior performance.
Next-Gen Dedicated GPU Servers from Atlantic.Net, Accelerated by NVIDIA
Experience unparalleled performance with dedicated cloud servers equipped with the revolutionary NVIDIA accelerated computing platform.
Choose from the NVIDIA L40S GPU and NVIDIA H100 NVL to unleash the full potential of your generative artificial intelligence (AI) workloads, train large language models (LLMs), and harness natural language processing (NLP) in real time.
High-performance GPUs are superb at scientific research, 3D graphics and rendering, medical imaging, climate modeling, fraud detection, financial modeling, and advanced video processing.
Learn more about Atlantic.net GPU server hosting
### Top 10 NVIDIA GPUs for AI in 2025
What Are NVIDIA AI GPUs?
NVIDIA provides a range of GPUs (graphics processing units) especially designed to accelerate artificial intelligence (AI) workloads, such as the A100 and H200. These GPUs are equipped with features and architectures to handle the computational demands of AI, such as machine learning, deep learning, and big data processing. They are used across various industries to deliver efficient AI model training and inference.
NVIDIA also provides consumer-grade GPUs, such as RTX 6000, which are not specifically designed for AI workloads, but can still effectively accelerate them and come at a much lower cost. By leveraging either specialized AI GPUs or high-end consumer-grade GPUs, organizations and individual developers can gain the computational power they need to carry out ambitious AI projects.
This is part of a series of articles about GPU for AI.
Overview of NVIDIA GPU Product Line for AI Use Cases
NVIDIA Data Center GPUs
NVIDIA's data center GPUs, such as the A100 Tensor Core GPU, are engineered for high-performance computing environments. These GPUs provide processing power for AI workloads, allowing data centers to manage vast amounts of data with ease. They enable large-scale model training and accelerate AI and HPC applications.
Equipped with massive memory capacity and multi-instance GPU capabilities, NVIDIA data center GPUs provide efficiency and scalable performance. They integrate into data center infrastructure, optimizing resource utilization and energy efficiency.
NVIDIA data center GPUs provide the following capabilities:
Tensor Cores and AI acceleration: Tensor Cores improve computation for AI tasks. These cores optimize matrix multiplications, crucial in deep learning model training, enabling faster processing with less power. They provide efficient handling of AI operations, resulting in reduced training times. Tensor Cores also support mixed-precision training, improving performance without sacrificing accuracy.
High memory bandwidth and capacity: NVIDIA AI GPUs can manage large datasets and execute complex AI models. Their high bandwidth ensures data moves rapidly between the processor and memory, crucial for performance in computation-heavy tasks like deep learning. The large memory capacity supports the storage and manipulation of large models and datasets.
CUDA architecture and programming model: These GPUs provide a platform for parallel computing. CUDA enables developers to harness GPU power for diverse applications, improving performance across various computing tasks by parallelizing processes. The programming model enables easy integration and optimization of AI workloads within the NVIDIA ecosystem. CUDA provides extensive library support and community resources.
NVIDIA Consumer-Grade GPUs
NVIDIA also offers consumer-grade GPUs intended for creative professionals and engineers, offering performance and reliability for demanding applications. These GPUs, particularly the RTX series, are especially optimized for tasks like 3D rendering and simulations, but are also effective for AI workloads.
NVIDIA consumer-grade GPUs support workflows in industries such as media, entertainment, and architecture, and are also widely used by AI developers and engineers.
Related content: Read our guide to GPU for deep learning
Common AI Use Cases for NVIDIA GPUs
NVIDIA AI GPUs are useful in several domains, accelerating AI solutions and improving computational capabilities.
AI Training and Inference in Data Centers
In data centers, NVIDIA AI GPUs drive AI training and inference workloads with greater efficiency. They allow vast datasets to be processed swiftly, enabling quicker AI model development and deployment. These GPUs handle AI tasks reliably, making them suitable for data centers aiming to implement or scale AI services.
Edge Computing and Intelligent Devices
NVIDIA GPUs support edge computing applications, optimizing intelligent devices to process data locally. This minimizes latency and boosts performance for real-time applications in autonomous vehicles, healthcare diagnostics, and IoT. By providing on-device AI capabilities, NVIDIA ensures resource-efficient computation close to where data is generated.
Development of AI Applications
NVIDIA AI GPUs empower developers to build and optimize a wide range of AI applications. These GPUs enable efficient training and deployment of machine learning models for tasks such as computer vision, natural language processing, and robotics.
Developers can utilize NVIDIA’s software stack, including CUDA, TensorRT, and the TAO Toolkit, to streamline workflows and improve performance. These tools facilitate model optimization, precision tuning, and integration into production environments.
Tips from the expert:
Richard Bailey
Technical Editor
Richard Bailey brings over two decades of IT expertise, from traditional data centers to cutting-edge cloud solutions. As the founder of turbogeek.co.uk and a seasoned writer, he focuses on delivering authoritative content on our hosting services, HIPAA compliance, and related topics.
In my experience, here are tips that can help you better utilize and implement NVIDIA AI GPUs for optimized performance and scalability:
Design workflows with NVLink for multi-GPU scaling: NVLink interconnects allow GPUs to share memory and work collaboratively on large-scale models. When using multiple GPUs, design workflows to take full advantage of NVLink bandwidth, such as optimizing memory transfers between GPUs or using fused multi-GPU operations. Ensure memory access patterns are streamlined to avoid bottlenecks in large model training.
Integrate NVIDIA BlueField DPUs for improved data management: Pairing NVIDIA GPUs with BlueField Data Processing Units (DPUs) offloads data management tasks like storage, security, and networking, freeing up GPU resources for compute-intensive AI workloads. This is especially beneficial in data center environments running large AI models or HPC tasks.
Optimize data preprocessing with RAPIDS: Use NVIDIA's RAPIDS toolkit to accelerate data preprocessing directly on GPUs. Moving preprocessing tasks (e.g., ETL, feature engineering) from CPUs to GPUs reduces overall training time. Integrating RAPIDS with frameworks like Apache Spark can further speed up distributed workflows.
Deploy GPU clusters with Kubernetes and NVIDIA GPU Operator: For scalable AI deployments, integrate NVIDIA GPUs with Kubernetes. Use the NVIDIA GPU Operator to automate GPU provisioning, monitoring, and updates in containerized environments. This ensures efficient resource allocation and management across GPU clusters for distributed training or inference.
Implement energy-efficient computing with dynamic GPU utilization: Optimize energy consumption by dynamically adjusting GPU clock speeds and voltage using NVIDIA tools like nvidia-smi or the NVIDIA Management Library (NVML). Leverage NVIDIA’s power management APIs to fine-tune performance per workload, reducing operational costs in energy-intensive data centers.
Notable NVIDIA Data Center GPUs
1. A100 Tensor Core GPU
The NVIDIA A100 Tensor Core GPU is a solution to accelerate diverse workloads in AI, HPC, and data analytics. Offering up to 20X performance improvement over its predecessor, the Volta generation, it can scale dynamically, dividing into up to seven GPU instances to optimize resource utilization.
Key features:
Third-generation Tensor Cores: Deliver up to 312 TFLOPS of deep learning performance, supporting mixed precision and enabling breakthroughs in AI training and inference.
High-bandwidth memory (HBM2e): Up to 80GB of memory with 2TB/s bandwidth ensures rapid data access and efficient model processing.
Multi-instance GPU (MIG): Allows partitioning of a single A100 GPU into seven isolated instances, each with dedicated resources, optimizing GPU utilization for mixed workloads.
Next-generation NVLink: Provides 2X the throughput of the previous generation, with up to 600 GB/s interconnect bandwidth for seamless multi-GPU scaling.
Structural sparsity: Improves AI performance by optimizing sparse models, doubling throughput for certain inference tasks.
Specifications:
FP64 Tensor Core: 19.5 TFLOPS
Tensor Float 32 (TF32): 156 TFLOPS (312 TFLOPS with sparsity)
FP16 Tensor Core: 312 TFLOPS (624 TFLOPS with sparsity)
INT8 Tensor Core: 624 TOPS (1,248 TOPS with sparsity)
GPU memory: 40GB HBM2 or 80GB HBM2e
Bandwidth: Up to 2,039 GB/s
Thermal design power: 250W (PCIe) to 400W (SXM)
Form factors: PCIe and SXM4
NVLink: Up to 600 GB/s interconnect
PCIe Gen4: 64 GB/s
Supports NVIDIA HGX A100 systems with up to 16 GPUs.
2. H100 Tensor Core GPU
The NVIDIA H100 Tensor Core GPU is built on the NVIDIA Hopper architecture, delivering performance, scalability, and security for workloads. With faster inference and training for large language models (LLMs) than its predecessor, the H100 includes fourth-generation Tensor Cores, Transformer Engine, and Hopper-specific features like confidential computing redefine enterprise and exascale computing.
Key features:
Fourth-generation Tensor Cores: Delivers performance across a range of precisions (FP64, FP32, FP16, FP8, and INT8), ensuring versatile support for LLMs and HPC applications.
Transformer Engine: Specifically designed for trillion-parameter LLMs, offering up to 30X faster inference performance and 4X faster training for GPT-3 models.
High-bandwidth memory (HBM3): Provides up to 94GB of memory with 3.9TB/s bandwidth for accelerated data access and massive-scale model handling.
NVIDIA confidential computing: Introduces a secure hardware-based trusted execution environment (TEE) to protect data and workloads.
Multi-instance GPU (MIG): Allows partitioning into up to seven GPU instances, optimizing resource utilization for diverse workloads with improved granularity.
Next-generation NVLink: Features up to 900GB/s interconnect bandwidth, enabling multi-GPU communication for large-scale systems.
Specifications:
FP64 Tensor Core: 67 teraFLOPS
TF32 Tensor Core: 989 teraFLOPS
FP16 Tensor Core: 1,979 teraFLOPS
FP8 Tensor Core: 3,958 teraFLOPS
Capacity: 80GB (SXM) or 94GB (NVL)
Bandwidth: Up to 3.9TB/s
Thermal design power: Up to 700W (SXM) or 400W (PCIe)
Form factors: SXM and dual-slot PCIe
NVLink bandwidth: 900GB/s (SXM) or 600GB/s (PCIe)
PCIe Gen5: 128GB/s
Compatible with NVIDIA HGX H100 systems (4–8 GPUs) and NVIDIA DGX H100 systems (8 GPUs).
3. H200 Tensor Core GPU
The NVIDIA H200 Tensor Core GPU is built on the Hopper architecture. It introduces performance features such as HBM3e memory, improved energy efficiency, and higher throughput for large language models and scientific workloads.
Key features:
HBM3e memory: Equipped with 141GB of HBM3e memory, delivering a bandwidth of 4.8TB/s. This enhancement nearly doubles the memory capacity and bandwidth of its predecessor, the H100, enabling faster data processing for LLMs and HPC applications.
Enhanced AI and HPC performance: Provides up to 1.9X faster Llama2 70B inference and 1.6X faster GPT-3 175B inference compared to the H100, ensuring faster execution of generative AI tasks. For HPC workloads, it achieves up to 110X faster time-to-results over CPU-based systems.
Energy efficiency: Maintains the same power profile as the H100, ensuring better energy efficiency and reduced operational costs.
Multi-instance GPU (MIG): Supports up to seven instances per GPU, allowing efficient partitioning for diverse workloads and optimized resource utilization.
Confidential computing: Hardware-based trusted execution environments (TEE) provide secure handling of sensitive workloads.
Specifications:
FP64 Tensor Core: 67 TFLOPS
FP32 Tensor Core: 989 TFLOPS
FP16/FP8 Tensor Core: 1,979 TFLOPS / 3,958 TFLOPS
GPU memory: 141GB HBM3e
Memory bandwidth: 4.8TB/s
MIG instances: Up to 7 (18GB per MIG instance on SXM, 16.5GB on NVL)
TDP: Configurable up to 700W (SXM) or 600W (NVL)
Form Factor: SXM or dual-slot PCIe air-cooled options
Interconnect: NVIDIA NVLink™: 900GB/s, PCIe Gen5: 128GB/s
4. GB200 NVL72
The NVIDIA GB200 NVL72 is a data center solution for high-performance computing (HPC) and AI workloads. Featuring a rack-scale architecture with 36 Grace CPUs and 72 Blackwell GPUs, it achieves performance for trillion-parameter AI models. It offers components like the second-generation Transformer Engine, NVLink-C2C interconnect, and liquid cooling.
Key features:
Blackwell architecture: Enables exascale computing with performance and efficiency.
Second-generation Transformer Engine: Provides support for FP4 and FP8 precision, accelerating AI training and inference.
Fifth-generation NVLink: Ensures high-speed GPU communication with 130 TB/s bandwidth for efficient multi-GPU operations.
Liquid cooling: Reduces data center energy consumption and carbon footprint while maintaining high compute density.
Grace CPU: Delivers performance with up to 17 TB memory and 18.4 TB/s bandwidth.
Specifications:
FP4 Tensor Core: 1,440 PFLOPS
FP16/BF16 Tensor Core: 360 PFLOPS
FP64: 3,240 TFLOPS
GPU memory bandwidth: Up to 13.5 TB HBM3e, 576 TB/s
Core count: 2,592 Arm Neoverse V2 cores
Memory: Up to 17 TB LPDDR5X, 18.4 TB/s bandwidth
NVLink bandwidth: 130 TB/s
NVIDIA Consumer-Grade GPUs Used for AI
NVIDIA's consumer-grade GPU lineup includes several models that can be used for AI use cases.
5. RTX 6000 Ada Generation
The NVIDIA RTX 6000 Ada Generation GPU is engineered for professional workflows, including rendering, AI, simulation, and content creation. Built on the NVIDIA Ada Lovelace architecture, it combines next-generation CUDA cores, third-generation RT Cores, and fourth-generation Tensor Cores to provide up to 10X the performance of the previous generation.
Key features:
Ada Lovelace architecture: Provides up to 2X the performance of its predecessor for simulations, AI, and graphics workflows.
Third-generation RT Cores: Delivers up to 2X faster ray tracing for photorealistic rendering, virtual prototyping, and motion blur accuracy.
Fourth-generation Tensor Cores: Accelerates AI tasks with FP8 precision, offering higher performance for model training and inference.
48GB GDDR6 memory: Supports massive datasets and advanced workloads, including data science, rendering, and AI simulations.
AV1 encoders: Offers 40% greater efficiency than H.264, improving video streaming quality and reducing bandwidth usage.
Virtualization-ready: Supports NVIDIA RTX Virtual Workstation (vWS) software, enabling resource sharing for high-performance remote workloads.
Specifications:
Single-precision: 91.1 TFLOPS
RT Core performance: 210.6 TFLOPS
Tensor Core AI performance: 1,457 TOPS (theoretical FP8 with sparsity)
48GB GDDR6 with ECC
Bandwidth: High-speed for demanding applications
Max power consumption: 300W
Dimensions: 4.4” (H) x 10.5” (L) dual-slot, active cooling
Display outputs: 4x DisplayPort 1.4
Graphics bus: PCIe Gen 4 x16
vGPU profiles supported: NVIDIA RTX vWS, NVIDIA vPC/vApps
6. RTX A6000
The NVIDIA RTX A6000 is a GPU for advanced computing, rendering, and AI workloads. Powered by the NVIDIA Ampere architecture, it combines second-generation RT Cores, third-generation Tensor Cores, and 48GB of ultra-fast GDDR6 memory to deliver high performance for professionals.
Key features:
Ampere architecture CUDA Cores: Double-speed FP32 operations improve performance for graphics and simulation tasks like CAD and CAE.
Second-generation RT Cores: Offer 2X the throughput of the previous generation for ray tracing, shading, and denoising, delivering faster and more accurate results.
Third-generation Tensor Cores: Accelerate AI model training with up to 5X the throughput of the previous generation and support structural sparsity for increased inferencing efficiency.
48GB GDDR6 memory: Scalable to 96GB with NVLink, providing the capacity for large datasets and high-performance workflows.
Third-generation NVLink: Enables GPU-to-GPU bandwidth of up to 112GB/s, supporting memory and performance scaling for multi-GPU configurations.
Virtualization-ready: Allows multiple high-performance virtual workstation instances with support for NVIDIA RTX Virtual Workstation and other vGPU solutions.
Power efficiency: A dual-slot design offers up to twice the power efficiency of previous-generation Turing GPUs.
Specifications:
CUDA Cores: High-performance architecture for demanding workloads
RT Core throughput: 2X over previous generation
Tensor Core training throughput: 5X over previous generation
48GB GDDR6 with ECC (scalable to 96GB with NVLink)
Max power consumption: 300W
Dimensions: 4.4” (H) x 10.5” (L), dual-slot, active cooling
Display outputs: 4x DisplayPort 1.4a
PCIe Gen 4 x16: Enhanced data transfer speeds
Supports NVIDIA vPC/vApps, RTX Virtual Workstation, and Virtual Compute Server
7. RTX A5000
The NVIDIA RTX A5000 graphics card combines performance, efficiency, and reliability to meet the demands of complex professional workflows. Powered by the NVIDIA Ampere architecture, it features 24GB of GDDR6 memory, second-generation RT Cores, and third-generation Tensor Cores to accelerate AI, rendering, and simulation tasks.
Key features:
Ampere Architecture CUDA Cores: Delivers up to 2.5X the FP32 performance of the previous generation, optimizing graphics and simulation workflows.
Second-Generation RT Cores: Provides up to 2X faster ray tracing performance and hardware-accelerated motion blur for accurate, high-speed rendering.
Third-Generation Tensor Cores: Enables up to 10X faster AI model training with structural sparsity and accelerates AI-enhanced tasks such as denoising and DLSS.
24GB GDDR6 Memory: Equipped with ECC for error correction, ensuring reliability for memory-intensive workloads like virtual production and engineering simulations.
Third-Generation NVLink: Enables multi-GPU setups with up to 112GB/s interconnect bandwidth and combined memory of 48GB for handling larger datasets and models.
Virtualization-Ready: Supports NVIDIA RTX Virtual Workstation (vWS) software to transform workstations into high-performance virtual instances for remote workflows.
Power Efficiency: Offers a dual-slot design with up to 2.5X better power efficiency than the previous generation, fitting a wide range of professional workstations.
PCI Express Gen 4: Improves data transfer speeds from CPU memory, improving performance in data-intensive tasks.
Specifications:
CUDA Cores: High-performance architecture for advanced workflows
RT Core Performance: 2X over the previous generation
Tensor Core Training Performance: Up to 10X over the previous generation
24GB GDDR6 with ECC (scalable to 48GB with NVLink)
Max Power Consumption: 230W
Dimensions: 4.4” (H) x 10.5” (L), dual-slot, active cooling
Display Outputs: 4x DisplayPort 1.4
PCIe Gen 4 x16: Faster data transfers for demanding applications
Supports NVIDIA vPC, vApps, RTX vWS, and Virtual Compute Server
8. GeForce RTX 4090
The NVIDIA GeForce RTX 4090 is a specialized GPU for gaming and creative professionals powered by the NVIDIA Ada Lovelace architecture. With 24GB of ultra-fast GDDR6X memory, it delivers high-quality gaming visuals, faster content creation, and advanced AI-powered capabilities.
Key features:
Ada Lovelace Architecture: Offers up to twice the performance and power efficiency, driving cutting-edge gaming and creative applications.
Third-Generation RT Cores: Delivers faster ray tracing, enabling hyper-realistic lighting, shadows, and reflections.
Fourth-Generation Tensor Cores: Improves AI performance with up to 4X the power of brute-force rendering, supporting DLSS 3 for ultra-smooth gameplay.
24GB GDDR6X Memory: Ensures seamless performance for large-scale gaming and creative tasks, including 3D rendering and AI modeling.
NVIDIA DLSS 3: AI-driven upscaling technology that boosts frame rates and delivers crisp visuals without sacrificing image quality.
NVIDIA Reflex: Reduces system latency for a competitive edge in fast-paced games.
NVIDIA Studio: Accelerates creative workflows with optimized tools for creators, including RTX Video Super Resolution and NVIDIA Broadcast.
Game Ready and Studio Drivers: Provides stability and optimal performance for both gaming and content creation applications.
Specifications:
Core Count: 16,384 CUDA Cores
Base/Boost Clock Speed: 2,235–2,520 MHz
Ray Tracing Cores: 128
Tensor Cores: 512
Theoretical Performance: 82.6 TFLOPS (FP32)
Capacity: 24GB GDDR6X
Memory Bus Width: 384-bit
Bandwidth: 1,008 GB/s
Power Consumption: 450W
Transistor Count: 76.3 billion
Die Size: 608 mm², 5nm process technology
API Support: DirectX 12 Ultimate, Vulkan 1.3, OpenGL 4.6, OpenCL 3.0
Advanced Gaming Features: Support for Shader Model 6.7
9. GeForce RTX 4080
The NVIDIA GeForce RTX 4080 is a high-performance GPU to handle demanding gaming and creative workloads. It offers technologies like third-generation RT Cores, fourth-generation Tensor Cores, and AI-accelerated DLSS 3. The RTX 4080 provides unparalleled speed and efficiency for immersive graphics, AI-driven improvements, and productivity workflows.
Key features:
Ada Lovelace Architecture: Offers up to 2X higher performance and power efficiency, driving innovations in gaming and creation.
Third-Generation RT Cores: Provides up to 2X faster ray tracing, delivering realistic lighting, shadows, and reflections for lifelike graphics.
Fourth-Generation Tensor Cores: Accelerates AI performance with DLSS 3, enabling ultra-smooth gameplay and improved image quality.
16GB GDDR6X Memory: Ensures the capacity and speed needed for high-resolution gaming and advanced creative workflows.
NVIDIA DLSS 3: Leverages AI to boost frame rates and optimize performance without sacrificing visual fidelity.
NVIDIA Reflex: Minimizes system latency, offering competitive responsiveness for fast-paced games.
NVIDIA Studio: Improves creative productivity with tools optimized for rendering, editing, and AI-powered workflows.
Game Ready and Studio Drivers: Delivers reliable and optimized performance for gaming and content creation tasks.
Specifications:
CUDA Cores: 9,728 unified pipelines
Base/Boost Clock Speed: 2,205–2,505 MHz
Ray Tracing Cores: 76
Tensor Cores: 304
Theoretical Performance: 48.7 TFLOPS (FP32)
Capacity: 16GB GDDR6X
Memory Bus Width: 256-bit
Bandwidth: 716.8 GB/s
Power Consumption: 320W
Transistor Count: 45.9 billion
Die Size: 379 mm², 5nm process technology
API Support: DirectX 12 Ultimate, Vulkan 1.3, OpenGL 4.6, OpenCL 3.0
Advanced Gaming Features: Shader Model 6.7
10. GeForce RTX 4070
The NVIDIA GeForce RTX 4070 Ti is a high-performance GPU for gamers and creators who require advanced graphics capabilities and efficient performance. Built on the NVIDIA Ada Lovelace architecture, it features third-generation RT Cores, fourth-generation Tensor Cores, and 12GB of ultra-fast GDDR6X memory.
Key features:
Ada Lovelace Architecture: Offers up to twice the performance and power efficiency of the previous generation, enabling next-level gaming and creative applications.
Third-Generation RT Cores: Supports faster ray tracing, providing hyper-realistic lighting, shadows, and reflections in games and creative projects.
Fourth-Generation Tensor Cores: Improves AI-driven tasks, including DLSS 3 for up to 4X faster performance compared to traditional rendering.
12GB GDDR6X Memory: Ensures high-speed performance for advanced gaming and content creation tasks.
NVIDIA DLSS 3: AI-powered technology that boosts frame rates and improves image quality for a smoother gaming experience.
NVIDIA Reflex: Reduces latency for faster response times in competitive gaming.
NVIDIA Studio: Accelerates creative workflows with optimized tools for content creators.
Game Ready and Studio Drivers: Optimizes performance and stability for gaming and professional applications.
Specifications:
CUDA Cores: 7,680
Base/Boost Clock Speed: 2.31–2.61 GHz
Ray Tracing Cores: 93 TFLOPS
Tensor Cores (AI): 641 AI TOPS
Capacity: 12GB GDDR6X
Memory Bus Width: 192-bit
Technology: Ada Lovelace
Ray Tracing and AI Support: Yes
Power Efficiency: Improved over previous generations
DLSS 3.5: Includes Super Resolution, Frame Generation, Ray Reconstruction, and DLAA
Best Practices for Using NVIDIA GPUs in AI Projects
AI teams and organizations can apply the following practices to improve performance and efficiency when working with NVIDIA AI GPUs.
1. Optimize Workloads with CUDA and cuDNN
CUDA (Compute Unified Device Architecture) is the foundation of NVIDIA's GPU programming ecosystem, enabling parallel processing for AI workloads. By optimizing workloads with CUDA, developers can take advantage of GPU acceleration to handle computationally intensive tasks. cuDNN (CUDA Deep Neural Network library) complements CUDA by providing optimized routines for deep learning, such as convolutions and activation functions.
To implement this best practice, ensure the software leverages CUDA's APIs to distribute workloads across GPU cores. Use cuDNN for critical AI operations to improve performance in model training and inference. Proper tuning of parameters, such as block size and grid dimensions, further boosts efficiency. Profiling tools like NVIDIA Nsight Systems and Nsight Compute can help identify bottlenecks and optimize GPU utilization.
2. Utilize NVIDIA's Pre-Trained Models and SDKs
NVIDIA provides a suite of pre-trained models and SDKs, such as NVIDIA TAO Toolkit and NVIDIA DeepStream, that simplify AI deployment. These resources accelerate development by offering optimized architectures for tasks like object detection, language processing, and video analytics.
Adopt pre-trained models to save time on training from scratch, especially for common use cases. Fine-tune these models with data to achieve domain-specific performance. Leverage SDKs like TensorRT for inference optimization, DeepStream for video analytics, or Riva for conversational AI.
3. Utilize Multi-Instance GPU (MIG) for Resource Partitioning
NVIDIA's Multi-Instance GPU (MIG) technology allows partitioning a single GPU into multiple independent instances, each with its dedicated resources. This feature is particularly useful for environments with diverse workloads or shared GPU infrastructure.
To maximize the benefits of MIG, assess the workload requirements and allocate GPU instances accordingly. For example, assign separate instances to lightweight inference tasks while reserving larger instances for training or complex computations. Use NVIDIA's tools like NVIDIA GPU Cloud (NGC) and GPU Manager to configure and monitor MIG instances.
4. Leverage TensorRT for Optimized Inference
TensorRT is NVIDIA’s high-performance deep learning inference optimizer and runtime. It enables developers to maximize inference efficiency by optimizing models for deployment on NVIDIA GPUs. TensorRT reduces latency, minimizes memory usage, and boosts throughput by using techniques like layer fusion and precision calibration.
To implement this practice, convert trained models into TensorRT-optimized formats using its APIs. Pay attention to precision settings, such as FP16 or INT8, to balance performance and accuracy. Use TensorRT with NVIDIA Triton Inference Server for scalable deployment across data centers or edge devices, ensuring consistent and high-speed AI inference.
5. Apply Mixed-Precision Training
Mixed-precision training leverages lower-precision formats (e.g., FP16 or BF16) alongside higher-precision formats (FP32) to accelerate computations without sacrificing model accuracy. NVIDIA GPUs, equipped with Tensor Cores, are optimized for mixed-precision operations.
To apply mixed-precision training, use frameworks like TensorFlow or PyTorch with automatic mixed precision (AMP) support. Ensure the code utilizes Tensor Cores for compatible operations and monitor performance gains. Mixed-precision training reduces memory usage and speeds up computations, useful for scaling AI training on NVIDIA GPUs.
Next-Gen Dedicated GPU Servers from Atlantic.Net, Accelerated by NVIDIA
Experience unparalleled performance with dedicated cloud servers equipped with the revolutionary NVIDIA accelerated computing platform.
Choose from the NVIDIA L40S GPU and NVIDIA H100 NVL to unleash the full potential of your generative artificial intelligence (AI) workloads, train large language models (LLMs), and harness natural language processing (NLP) in real time.
High-performance GPUs are superb at scientific research, 3D graphics and rendering, medical imaging, climate modeling, fraud detection, financial modeling, and advanced video processing.
Learn more about Atlantic.net GPU server hosting
### GPU for Data Science: 4 Free Libraries and 6 Best Practices
What Is GPU Acceleration in Data Science?
GPU acceleration in data science refers to using graphics processing units (GPUs) to improve data processing and analysis speeds. Unlike traditional CPUs, which have a few cores optimized for sequential processing, GPUs consist of thousands of smaller cores that handle multiple operations simultaneously. This parallel processing capability benefits data-intensive tasks such as machine learning, simulations, and data visualization, enabling quicker insights and outcomes.
The transition to GPU acceleration arises from the increasing scale and complexity of data. As datasets grow in size, the demand for rapid computation increases. GPUs provide the ability to process vast amounts of data at speed, which is vital for developing real-time applications. By offloading demanding tasks to GPUs, data scientists can achieve significant reductions in computation times, ensuring the timely analysis of large-scale datasets.
This is part of a series of articles about GPU applications.
The Role of GPUs in Data Science Workflows
GPUs support data science workflows by accelerating various computational processes. From data preprocessing and model training to visualization, GPUs enable faster execution of tasks that would otherwise take hours on CPUs. This performance is especially critical in iterative processes like model training, where multiple runs are needed to optimize parameters.
GPUs are also essential in deep learning tasks, which are computationally intensive. High-dimensional data and complex models, often used in neural networks, benefit from the parallel computing power of GPUs. This results in quicker model convergence and the ability to handle larger datasets efficiently.
Advantages of GPUs Over CPUs in Data Processing
GPUs offer several distinct advantages over CPUs in the context of data processing:
Parallel processing power: GPUs handle multiple operations simultaneously due to their thousands of smaller cores. This makes them suited for tasks like matrix operations and large-scale computations common in data science.
High throughput: GPUs process large volumes of data in parallel, leading to significantly faster execution of data-intensive tasks compared to CPUs, which operate sequentially.
Efficient for iterative tasks: Machine learning workflows, especially training models, often involve repetitive computations. GPUs can speed up these iterative processes, reducing training times from days to hours.
Better handling of high-dimensional data: GPUs manage complex calculations involving high-dimensional datasets, which are prevalent in tasks like deep learning.
Cost-effectiveness for large-scale workloads: While GPUs can be expensive upfront, their ability to handle massive workloads quickly often translates to lower costs in cloud environments where time-based billing is a factor.
Optimization for AI and ML frameworks: Popular frameworks like TensorFlow and PyTorch are optimized for GPU usage, enabling integration and performance gains in data science workflows.
Related content: Read our guide to GPU virtualization
Tips from the expert:
Richard Bailey
Technical Editor
Richard Bailey brings over two decades of IT expertise, from traditional data centers to cutting-edge cloud solutions. As the founder of turbogeek.co.uk and a seasoned writer, he focuses on delivering authoritative content on our hosting services, HIPAA compliance, and related topics.
In my experience, here are tips that can help you make the most of GPU acceleration in data science:
Use mixed precision training for deep learning: Leverage mixed precision training (combining 16-bit and 32-bit floating-point calculations) to reduce memory usage and speed up computations without compromising model accuracy. Frameworks like TensorFlow and PyTorch support this natively with tools like torch.cuda.amp or TensorFlow's MixedPrecision API.
Pin processes to GPU cores: For multi-GPU setups, pin specific processes or tasks to designated GPUs using CUDA_VISIBLE_DEVICES or framework-specific GPU affinity tools. This minimizes resource contention and ensures balanced GPU utilization, especially for distributed training or concurrent tasks.
Preprocess data on the GPU: Move preprocessing tasks like data augmentation, normalization, or feature extraction to the GPU to reduce CPU-GPU transfer overhead. Libraries such as NVIDIA DALI (Data Loading Library) can offload these operations directly to GPUs for higher throughput.
Implement checkpointing in iterative workflows: For long-running model training or iterative simulations, implement checkpointing to save intermediate results. This ensures data scientists can resume operations in case of system interruptions, saving time and GPU resources in redoing previous steps.
Experiment with GPU-optimized neural network architectures: Choose neural network architectures that are optimized for GPU workloads, such as EfficientNet or ResNet. These architectures are designed for reduced computation and memory usage, maximizing the parallel capabilities of GPUs without unnecessary resource strain.
4 Open Source Libraries for GPU-Accelerated Data Science
1. cuDF
License: Apache-2.0
Repository: https://github.com/rapidsai/cudf
GitHub stars: 8K+
Contributors: 200+
cuDF is a GPU-accelerated library for data manipulation, enabling data processing tasks akin to Pandas but optimized for GPUs. It allows manipulation of DataFrames and offers operations like filtering, aggregation, and joining at higher speeds. cuDF integrates with RAPIDS AI, enabling end-to-end data science pipelines to benefit from GPU acceleration.
The adoption of cuDF provides a marked improvement in performance for data science workflows. By offloading computation to GPUs, users experience reduced processing times and increased efficiency when handling large datasets. This advantage is especially evident in real-time data analytics and when iterating over large datasets.
2. cuML
License: Apache-2.0
Repository: https://github.com/rapidsai/cuml
GitHub stars: 4K+
Contributors: 100+
cuML is a suite of machine learning algorithms that runs on GPUs, providing accelerated training and inference capabilities. It aims to replicate the functionality of scikit-learn using GPUs' parallel processing power, supporting a broad range of tasks such as classification, regression, and clustering.
By leveraging cuML, users can speed up model training processes, especially with large datasets. cuML's GPU-centric design ensures scalability and performance in machine learning workflows. For example, operations like k-means clustering or linear regression are expedited, freeing resources and time for further experimentation and refinement.
3. cuGraph
License: Apache-2.0
Repository: https://github.com/rapidsai/cugraph
GitHub stars: 1K+
Contributors: 100+
cuGraph specializes in graph analytics, utilizing GPUs to process graph algorithms efficiently. It supports tasks like PageRank, connectivity, and link analysis, which benefit from GPU's parallel computation capabilities. This library accelerates graph processing compared to CPU-bound frameworks, improving performance for large-scale network analyses in real-world applications.
cuGraph provides data scientists with the tools to quickly derive insights from complex, interconnected data. The speed of execution allows for handling increasingly large graphs relevant in social network analysis, fraud detection, and recommendation systems. By integrating with the RAPIDS ecosystem, cuGraph enables comprehensive analytics solutions.
4. XGBoost for GPUs
License: Apache-2.0
Repository: https://github.com/dmlc/xgboost/tree/master
GitHub stars: 26K+
Contributors: 600+
XGBoost for GPUs is a high-performance library leveraging GPU power for gradient boosting tasks. Offering speed and accuracy, XGBoost is widely adopted in data science for building predictive models. The GPU-accelerated version handles tasks faster than its CPU counterpart by parallelizing tree building and boosting tasks, crucial for iterative modeling and evaluation.
Deploying XGBoost on GPUs provides substantial performance gains, particularly with large datasets and complex models. The reduction in training time allows data scientists to iterate more rapidly, improving model tuning and optimization. The integration of GPU capabilities into XGBoost makes it a favored choice for competitions and scenarios where both speed and accuracy are paramount.
6 Best Practices for GPU-Accelerated Data Science
By implementing the following practices, organizations can ensure the most effective use of GPUs for data science applications.
1. Optimize Data Loading and Preprocessing
Optimizing data loading and preprocessing is crucial in GPU-accelerated data science. Efficient handling of data ensures that GPUs receive the necessary data without bottlenecks. Techniques such as using appropriate data formats (e.g., CSV vs. Parquet), batching, and chunking help maintain data throughput to the GPU, minimizing idle times and maximizing performance.
Investing time in preprocessing can significantly reduce the computational load during actual processing. For example, aligning data types and structures with GPU memory can improve execution speed. Efficient preprocessing also involves scaling and normalizing data to ensure compatibility and performance improvements during data-intensive operations on the GPU.
2. Minimize Data Transfer Between CPU and GPU
Minimizing data transfer between CPU and GPU is essential for maximizing performance in GPU-accelerated workflows. Data transfers are relatively slow compared to the computational capabilities of GPUs, potentially leading to bottlenecks. Strategies such as keeping data within the GPU-memory realm once transferred can significantly improve execution times.
Techniques such as copying all necessary data at once and structuring computations to minimize CPU-GPU interactions help reduce transfer times. This practice speeds up current operations and allows for efficient multitasking and parallel workflows, where more complex operations can run simultaneously without excessive data shuttling requirements.
3. Utilize Efficient Memory Management
Efficient memory management is important for optimizing GPU performance in data science tasks. Properly allocating and deallocating GPU memory prevents resource congestion and maximizes available memory for large datasets and models. Using memory pools and ensuring data structures are suited for GPU cache sizes can prevent memory-related slowdowns.
Conscientious memory management practices include reusing memory allocations instead of frequent reallocations, which is particularly useful in iterative processes. This approach minimizes memory fragmentation, leading to smoother operations.
4. Profile and Monitor GPU Performance
Profiling and monitoring GPU performance are vital for maintaining efficient data science workflows. Continuous monitoring helps identify performance bottlenecks, such as underutilized computational resources or overextended memory use. Tools like NVIDIA's NSight or similar profiling tools can provide insights into GPU usage patterns, helping to optimize tasks.
Regular performance evaluation ensures that any changes in workload or system setup maintain optimal GPU efficiency. This involves tracking metrics like memory usage, processing time, and kernel execution times to understand GPU behavior better.
5. Leverage Parallelism in Algorithms
Leveraging parallelism in algorithms is vital for maximizing GPU capabilities in data science. GPUs are inherently designed for parallel operations, and algorithms that utilize this feature can significantly improve processing speeds. Implementing parallel techniques in tasks like sorting or matrix multiplication allows for full exploitation of GPU architecture.
Designing algorithms to operate in parallel involves decomposing tasks so they can be executed concurrently across multiple GPU cores. This approach is particularly effective in machine learning, where operations such as training can be parallelized, reducing computation time and resources.
6. Utilize GPU Hosting
GPU hosting refers to leveraging cloud-based or on-premises infrastructure to access powerful GPUs for data science tasks. Several cloud platforms and hosting providers offer on-demand GPU instances, enabling data scientists to scale their workflows without the need for costly hardware investments. These services provide flexibility, allowing users to choose configurations that match their requirements, such as the number of GPUs or memory capacity.
GPU hosting allows data scientists to access high-performance resources for tasks like deep learning, model training, and real-time analytics. By opting for managed services, users benefit from optimized environments with pre-installed frameworks, such as TensorFlow or PyTorch, reducing setup time. Hosted GPUs also often include tools for monitoring and optimizing resource usage.
Next-Gen Dedicated GPU Servers from Atlantic.Net, Accelerated by NVIDIA
Experience unparalleled performance with dedicated cloud servers equipped with the revolutionary NVIDIA accelerated computing platform.
Choose from the NVIDIA L40S GPU and NVIDIA H100 NVL to unleash the full potential of your generative artificial intelligence (AI) workloads, train large language models (LLMs), and harness natural language processing (NLP) in real time.
High-performance GPUs are superb at scientific research, 3D graphics and rendering, medical imaging, climate modeling, fraud detection, financial modeling, and advanced video processing.
Learn more about Atlantic.net GPU server hosting
### GPU Virtualization: Techniques, Solutions, and Best Practices
What Is GPU Virtualization?
GPU virtualization allows multiple virtual machines (VMs) or applications to share the resources of a single physical GPU. Unlike traditional setups where a GPU is dedicated to a single machine or application, virtualization abstracts GPU hardware into virtual instances. This enables efficient use of GPU resources across diverse workloads.
Virtualization is typically achieved using specialized software or drivers that create virtual GPU (vGPU) instances. These instances mimic the capabilities of a physical GPU and are managed by a hypervisor or similar orchestration layer. Each VM or application accessing the GPU sees its own isolated vGPU, while the hypervisor ensures equitable resource sharing and isolation.
GPU virtualization is widely used in industries like cloud computing, AI/ML, and gaming, where high-performance computing needs to be scaled or shared efficiently. Technologies from vendors like NVIDIA (e.g., NVIDIA vGPU) and AMD are prominent in this space.
This is part of a series of articles about GPU applications.
Benefits of GPU Virtualization
Here are some of the key benefits of GPU virtualization:
Resource optimization: GPU virtualization allows multiple workloads to share a single GPU, maximizing hardware utilization. This reduces the need for dedicated GPUs for each task, lowering costs while maintaining performance.
Scalability: Organizations can scale workloads by adding virtual instances without needing additional physical GPUs.
Cost efficiency: Virtualized GPUs reduce hardware and maintenance costs by enabling resource sharing. Enterprises can allocate resources based on actual workload requirements instead of provisioning for peak demand.
Flexibility for diverse workloads: GPU virtualization supports various use cases, from rendering graphics to running machine learning models, making it versatile for both enterprise and consumer applications.
Improved isolation and security: Each vGPU instance is isolated from others, ensuring that sensitive data in one VM is secure and unaffected by other workloads running on the same GPU.
Enhanced user experience in virtual environments: Virtualized GPUs enable high-performance computing in virtual desktop infrastructure (VDI), improving the performance of graphics-intensive applications for remote users.
GPU Virtualization Techniques
Here are a few common technical approaches for virtualizing GPUs:
API Remoting
API remoting, also known as API interception, is a GPU virtualization technique where graphics or compute API calls (such as OpenGL or DirectX commands) from an application are intercepted by a host system. These calls are processed on the physical GPU of the host machine, and the results are sent back to the application running in a virtual machine or remote client.
This method is commonly used in remote desktop or cloud gaming setups. While it enables GPU sharing, API remoting often introduces latency and does not fully expose the GPU’s hardware features to the guest system. It is most suitable for use cases where performance requirements are moderate.
Pass-Through GPU Virtualization
Pass-through GPU virtualization, also known as GPU passthrough, assigns a physical GPU directly to a single virtual machine. The VM gets exclusive access to the GPU, bypassing the hypervisor for graphics processing tasks. This provides near-native GPU performance since there is no virtualization overhead.
However, pass-through limits flexibility, as the GPU cannot be shared among multiple VMs. This technique is often used in scenarios requiring maximum performance, such as high-end gaming, scientific simulations, or machine learning workloads.
Mediated Pass-Through (vGPU)
Mediated pass-through, commonly referred to as vGPU, is a hybrid approach that combines resource sharing with near-native performance. In this technique, a physical GPU is split into multiple virtual GPU (vGPU) instances. Each VM or application gets its own vGPU, which shares the GPU’s physical resources under the control of a hypervisor.
This method provides high performance while enabling resource sharing, making it ideal for workloads like virtual desktop infrastructure (VDI), AI/ML training, and 3D rendering. Technologies like NVIDIA vGPU and AMD MxGPU are examples of mediated pass-through solutions.
GPU Emulation
GPU emulation involves simulating the behavior of a GPU entirely in software, without relying on physical GPU hardware. This technique is used primarily for testing, debugging, or running lightweight graphics workloads in environments where a physical GPU is unavailable.
While GPU emulation provides broad compatibility, it is computationally expensive and significantly slower compared to other techniques. It is not suited for performance-intensive applications but is useful for development and compatibility testing.
Related content: Read our guide to GPU for rendering
Tips from the expert:
Richard Bailey
Technical Editor
Richard Bailey brings over two decades of IT expertise, from traditional data centers to cutting-edge cloud solutions. As the founder of turbogeek.co.uk and a seasoned writer, he focuses on delivering authoritative content on our hosting services, HIPAA compliance, and related topics.
In my experience, here are tips that can help you better implement GPU virtualization for maximum performance and security:
Leverage NUMA awareness for GPU workloads: Ensure that virtual machines and GPU workloads are aligned with the Non-Uniform Memory Access (NUMA) topology of the system. Improper NUMA configurations can increase latency and reduce GPU performance. Tools like numactl or hypervisor-specific settings can help with proper alignment.
Implement QoS policies for vGPU resource allocation: Define Quality of Service (QoS) policies to prioritize critical workloads. For example, use GPU resource capping to limit allocation for less essential workloads, ensuring consistent performance for priority applications like AI/ML or 3D rendering.
Use SR-IOV for better performance isolation: For workloads requiring fine-grained isolation and high efficiency, consider Single Root I/O Virtualization (SR-IOV) alongside GPU virtualization. SR-IOV enables direct access to GPU hardware for virtual instances while maintaining isolation, reducing virtualization overhead.
Enable GPU fault tolerance: Plan for GPU failures in virtualized environments by implementing GPU redundancy or failover mechanisms. For example, in cloud-hosted or enterprise settings, use multiple GPUs with hot-spare configurations or tools like VMware vSphere’s HA to maintain workload availability during hardware failures.
Custom vGPU profiles for specific workloads: Beyond the default vGPU profiles offered by vendors, consider creating custom profiles optimized for unique workload demands. This is particularly beneficial when standard profiles underutilize GPU resources or cannot meet the requirements of specialized tasks.
GPU Virtualization Solutions
While it is common to perform GPU virtualization at the software layer, the major GPU vendors provide hardware-level solutions that build virtualization into the GPU itself. We’ll review three such solutions from NVIDIA, AMD, and Intel.
NVIDIA Virtual GPU Solutions
NVIDIA offers a suite of GPU virtualization technologies under its NVIDIA vGPU platform. These solutions enable organizations to partition physical GPUs into multiple virtual GPUs (vGPUs), each capable of delivering high-performance computing for diverse workloads. NVIDIA vGPU is used in industries like AI/ML, virtual desktop infrastructure (VDI), and 3D rendering.
Key features include:
Scalable resource allocation: Administrators can allocate GPU resources based on workload demands, ensuring efficient utilization.
Broad compatibility: Supports major hypervisors such as VMware vSphere, Citrix Hypervisor, and Microsoft Hyper-V.
Performance optimization: Provides near-native GPU performance by leveraging NVIDIA’s proprietary drivers and software stack.
Enhanced user experience: Powers smooth graphics-intensive applications in virtualized environments, improving productivity for remote users.
NVIDIA vGPU products include profiles optimized for specific use cases, from general-purpose computing to high-performance AI/ML workloads.
Source: NVIDIA
AMD MxGPU Technology
AMD MxGPU (Multiuser GPU) is AMD’s approach to GPU virtualization. It leverages hardware-based virtualization to create isolated GPU instances, ensuring secure and predictable performance for multiple users. Unlike software-based solutions, MxGPU operates at the silicon level, minimizing latency and overhead.
Key features include:
Hardware-level isolation: Ensures that each virtual machine has dedicated GPU resources without interference from other VMs.
Open standards support: Compatible with APIs such as OpenCL, Vulkan, and DirectX, making it versatile across applications.
Scalability: Supports a large number of users on a single GPU, making it ideal for VDI and cloud environments.
AMD MxGPU technology is especially useful for industries requiring secure, high-performance graphics workloads, such as finance, healthcare, and design.
Intel GVT-g and GVT-d
Intel offers GPU virtualization solutions under its Graphics Virtualization Technology (GVT) umbrella, with GVT-g and GVT-d as the main variants:
GVT-g (Graphics Virtualization Technology – Shared): Enables multiple VMs to share a single Intel GPU simultaneously. Each VM has its own isolated virtual GPU instance, allowing for efficient resource sharing in moderate-performance workloads.
GVT-d (Graphics Virtualization Technology – Direct): Assigns an Intel GPU directly to a single VM, offering near-native performance by bypassing the hypervisor.
Intel’s GPU virtualization solutions are particularly suited for lightweight workloads, such as office productivity applications and entry-level graphics tasks. They are often integrated into environments where Intel CPUs with integrated GPUs are prevalent, such as enterprise desktops and laptops.
5 Best Practices for GPU Virtualization
Here are some key practices to consider when implementing a virtualized GPU setup.
1. Hardware Compatibility and Requirements
When implementing GPU virtualization, ensure that the hardware is compatible with the virtualization solution being used. Check vendor documentation for supported GPUs, hypervisors, and drivers. For example, NVIDIA vGPU solutions require specific GPUs (e.g., NVIDIA A-series) and compatible hypervisor versions. Similarly, AMD MxGPU and Intel GVT have distinct hardware requirements.
Invest in GPUs with sufficient memory and compute capacity to handle expected workloads. For environments with diverse applications, prioritize hardware that supports flexibility and scalability, such as GPUs designed for virtualized deployments.
2. Optimizing Performance
Optimizing performance in a GPU-virtualized environment requires a balanced approach. Begin by configuring virtual GPU profiles to align with the needs of each workload. For example, machine learning models might require high memory and compute capacity, while lighter tasks like remote desktop sessions can use smaller profiles. Avoid over-provisioning or under-provisioning, as these can lead to resource contention or performance degradation.
Regularly update the GPU drivers and software to leverage the latest performance enhancements and security patches provided by vendors. Fine-tune hypervisor and VM configurations, such as enabling CPU pinning and reserving memory, to minimize latency. For workloads requiring peak performance, consider GPU passthrough to bypass virtualization overhead.
3. Resource Management and Monitoring
Efficient resource management is essential for maintaining the performance and reliability of GPU-virtualized environments. Use monitoring tools to track key GPU usage metrics such as memory consumption, processing power, and thermal performance. Tools like NVIDIA-SMI, AMD ROCm, or hypervisor-specific dashboards can provide visibility into resource utilization.
Establish resource allocation policies to ensure critical workloads receive priority. For example, allocate more GPU resources to applications running deep learning algorithms while throttling less demanding processes. Periodically assess GPU usage trends to identify bottlenecks and optimize allocation strategies.
4. Security Considerations
Security is critical with GPU virtualization, as the shared nature of resources introduces new risks. Select hypervisors with strong isolation mechanisms to prevent unauthorized access or data leakage between virtual machines sharing the same GPU. Ensure that all virtualization software, including GPU drivers, is updated regularly to address vulnerabilities and exploits.
For environments handling sensitive data, consider implementing end-to-end encryption for GPU communication, including data transfers and storage. Workload segmentation is another key practice; for example, isolate high-security applications in dedicated virtual machines with tightly controlled resource access. Enable logging and auditing of GPU activity to detect and respond to suspicious behavior.
5. Licensing and Compliance
Proprietary solutions like NVIDIA vGPU require licenses that dictate the number of virtual GPU instances per physical GPU and often include restrictions on advanced features. Ensure the organization understands the terms and conditions outlined by the vendor and provisions sufficient licenses for anticipated workloads.
Compliance with industry regulations is equally important. For example, organizations in healthcare or finance must adhere to strict data security and privacy requirements. Regularly conduct audits to verify adherence to licensing agreements and regulatory standards, reducing the risk of legal or operational challenges.
Next-Gen Dedicated GPU Servers from Atlantic.Net, Accelerated by NVIDIA
Experience unparalleled performance with dedicated cloud servers equipped with the revolutionary NVIDIA accelerated computing platform.
Choose from the NVIDIA L40S GPU and NVIDIA H100 NVL to unleash the full potential of your generative artificial intelligence (AI) workloads, train large language models (LLMs), and harness natural language processing (NLP) in real time.
High-performance GPUs are superb at scientific research, 3D graphics and rendering, medical imaging, climate modeling, fraud detection, financial modeling, and advanced video processing.
Learn more about Atlantic.net GPU server hosting
### GPU for Rendering: How It Works, Top 10 GPUs and Pro Tips
How Are GPUs Used for Rendering?
A graphics processing unit (GPU) is a component for rendering, accelerating the process of generating images from 3D models. Unlike CPUs, which are for general-purpose processing tasks, GPUs are specialized for parallel processing, making them useful for handling large blocks of visual data. They can quickly render detailed 3D scenes, crucial in applications such as video games, film production, and architectural visualization.
GPUs achieve this by utilizing architecture that supports thousands of small, efficient cores capable of handling multiple threads simultaneously. This architecture allows GPUs to process tasks in parallel, accelerating rendering workflows compared to the sequential processing found in CPUs.
GPUs enable 3D rendering by executing millions of calculations in parallel to simulate lighting, texture, and shading. They perform tasks like geometry processing, transforming 3D models into pixels on the screen. In addition to core processing, GPUs utilize memory management techniques, such as tiling, to optimize the storage and retrieval of textures and images.
This is part of a series of articles about GPU applications.
Types of Rendering That Benefit from GPUs
GPUs are useful for various rendering tasks.
Real-Time Rendering
Real-time rendering creates images on-the-fly as users interact with a scene, crucial for applications like gaming and virtual reality. This type of rendering relies heavily on the GPU's ability to quickly process graphics data to maintain fluid motion.
The real-time rendering process is refined through the use of techniques such as rasterization, where 3D objects are projected onto a 2D screen by converting vertices into pixels. This method optimizes the rendering pipeline, allowing for dynamic and immediate generation of frames.
Offline Rendering
Offline rendering processes images without the need for immediate display, often allowing for more complex scenes with higher visual fidelity. Used extensively in film and animation, this method benefits from the GPU's processing power to handle detailed calculations for effects such as global illumination and physically accurate simulations.
The offline rendering process enables extended compute times, allowing for the use of sophisticated algorithms that can produce photorealistic results. Although not constrained by real-time requirements, the computational demands are still significant, making GPUs essential for reducing rendering times of high-quality visuals.
Hybrid Rendering
Hybrid rendering combines elements of real-time and offline rendering, aiming to deliver high-quality visuals with interactive capabilities. This approach capitalizes on the strengths of both methods, using GPUs to balance real-time interaction with complex image generation.
By leveraging GPUs, hybrid rendering involves the strategic use of real-time techniques, like rasterization, alongside computational methods, like ray tracing, for specialized effects.
AI-Assisted Rendering
AI-assisted rendering utilizes machine learning algorithms to improve rendering processes, optimizing visual output and reducing computational loads. These algorithms, often executed on GPUs, accelerate tasks such as denoising, upscaling, and texture prediction.
The integration of AI in rendering allows for improved image processing techniques that automate and improve the quality of results. GPUs, with their parallel processing capability, are well suited to execute complex AI models, enabling rendering tools to deliver higher fidelity images faster.
Tips from the expert:
Richard Bailey
Technical Editor
Richard Bailey brings over two decades of IT expertise, from traditional data centers to cutting-edge cloud solutions. As the founder of turbogeek.co.uk and a seasoned writer, he focuses on delivering authoritative content on our hosting services, HIPAA compliance, and related topics.
In my experience, here are tips that can help you maximize the performance of GPUs for rendering tasks:
Utilize GPU memory efficiently for large scenes: When working with complex scenes, optimize textures, meshes, and assets to fit within the GPU’s VRAM. Use techniques like texture atlasing, mipmapping, and LOD (Level of Detail) models to reduce memory overhead without sacrificing quality.
Leverage GPU rendering denoising tools: Use AI-based denoising tools, such as those in NVIDIA OptiX or AMD’s ProRender, to reduce noise in rendered frames. This can cut down rendering times significantly by allowing fewer samples per pixel while still achieving photorealistic results.
Enable hardware acceleration for ray tracing and AI: For tasks involving ray tracing, enable dedicated ray-tracing cores (e.g., NVIDIA RTX cores) or AMD’s ray accelerators. For AI-assisted rendering tasks, ensure that Tensor Cores (NVIDIA) or Matrix Cores (AMD) are being utilized by compatible rendering software.
Batch-render animations to maximize GPU usage: When rendering animations, set up batch renders to ensure continuous GPU operation. This avoids idle time between frames and allows for optimal use of the GPU’s processing power. Some tools, like Blender, let teams automate rendering pipelines to increase throughput.
Use out-of-core rendering for memory-intensive scenes: For scenes that exceed GPU memory capacity, utilize out-of-core rendering features offered by rendering engines like Redshift or Octane. This offloads excess data to system memory, avoiding crashes or performance drops while maintaining scene fidelity.
Key Features of GPUs for Rendering
Here are some of the main GPU features that enable rendering.
CUDA Cores/Stream Processors
CUDA cores (NVIDIA) and stream processors (AMD) are essential for executing parallel tasks, directly impacting a GPU's performance in rendering. These cores enable the concurrent processing of numerous calculations, significantly accelerating tasks like shading, physics, and complex geometry calculations in graphic rendering.
The number of CUDA cores or stream processors on a GPU is a critical determinant of its capability in handling demanding rendering loads. More cores allow for increased parallel throughput, translating into smoother and faster rendering.
VRAM
Video random access memory (VRAM) stores textures, meshes, and other data needed for rendering. The amount of VRAM in a GPU affects its ability to handle large datasets and complex scenes without slowdowns. Sufficient VRAM is essential for maintaining performance, especially in high-resolution or resource-intensive applications.
Insufficient VRAM can lead to bottlenecks, causing significant performance degradation during rendering. Choosing a GPU with adequate VRAM ensures that the rendering pipeline operates smoothly.
Ray Tracing Cores
Ray tracing cores, like those found in NVIDIA's RTX series, are specialized units designed to accelerate ray tracing calculations. These cores enable real-time computation of light paths, reflections, and shadows, improving realism in rendered scenes.
The inclusion of dedicated ray tracing cores in a GPU improves rendering capabilities by improving the efficiency of complex lighting simulations. This feature is becoming increasingly important for achieving photorealistic effects.
Thermal Design
Thermal design in a GPU refers to its ability to manage heat output during intensive computational tasks. Effective thermal management is crucial for maintaining optimal performance and preventing thermal throttling, where excessive heat causes a reduction in processing speed.
A well-designed thermal system includes features such as high-performance cooling fans, heat sinks, and adaptive power management techniques. These features ensure that the GPU can operate under peak conditions without overheating.
Driver Support
Driver support is vital for ensuring compatibility and performance of a GPU with rendering software. Regular driver updates provide improvements, bug fixes, and optimizations, directly influencing the efficiency and reliability of rendering tasks.
Driver updates can introduce new features, improve existing functionality, and resolve compatibility issues with rendering software. Maintaining up-to-date drivers is important for optimizing GPU performance.
Popular GPUs for 3D Rendering
When selecting a GPU for 3D rendering, it's important to consider models that offer high performance and compatibility with rendering software. Here are some popular options:
NVIDIA GPUs
NVIDIA A100 tensor core GPU: For AI and high-performance computing, the A100 also excels in rendering with its massive parallel processing power and 80 GB of high-bandwidth memory. Its capability to handle large datasets and complex rendering tasks makes it a top choice for advanced visualizations and simulations.
NVIDIA A30 tensor core GPU: Offering 24 GB of memory and optimized for mixed workloads, the A30 is suitable for rendering workflows that involve AI-enhanced processes. Its balance of performance and efficiency makes it suitable for professional environments requiring scalable solutions.
NVIDIA A2 tensor core GPU: This compact and efficient GPU provides 16 GB of memory and is optimized for entry-level rendering tasks and edge applications. It is a cost-effective solution for lightweight rendering workloads, particularly in AI-assisted or hybrid rendering scenarios.
NVIDIA GeForce RTX 4090: This high-end GPU features 24 GB of GDDR6X VRAM and a large number of CUDA cores, making it suitable for handling complex rendering tasks efficiently.
NVIDIA GeForce RTX 4080: With 16 GB of GDDR6X VRAM, this GPU offers a balance between performance and cost, making it a viable option for demanding rendering applications.
NVIDIA GeForce RTX 4070 Ti: With 12 GB of GDDR6X VRAM, this GPU is suitable for less demanding rendering tasks, offering a more budget-friendly option without significant compromises on performance.
NVIDIA RTX 3090 Ti: Featuring 24 GB of GDDR6X VRAM and a high CUDA core count, the RTX 3090 Ti delivers exceptional rendering performance. It is suitable for professionals handling complex scenes, large datasets, and real-time applications that demand high computational throughput.
AMD GPUs
AMD Radeon Pro W7900: This workstation-grade graphics card features a GPU with 48 GB of memory, enabling it to process large production scenes efficiently. It's tailored for tasks that demand ultimate performance and reliability in animation and rendering projects.
AMD Radeon RX 7900 XTX: Equipped with 24 GB of GDDR6 VRAM, this GPU provides strong performance for rendering tasks, especially in applications optimized for AMD hardware.
AMD Radeon RX 7800 XT: Featuring 16 GB of GDDR6 VRAM, this GPU offers a cost-effective solution for mid-range rendering needs, balancing performance and affordability.
5 Best Practices for Using GPUs in Rendering
Organizations should consider the following practices to ensure optimal use of GPUs for rendering tasks.
1. Choose the Right GPU for the Task
Selecting the appropriate GPU involves assessing the rendering workloads, such as real-time or offline rendering. Different tasks may require varying levels of GPU power, with certain applications benefiting from features like ray tracing or AI acceleration.
It's important to consider the software being used, as some programs are optimized for specific GPU architectures. Researching compatibility and testing performance metrics can guide this decision, ensuring the selected GPU meets the rendering requirements.
2. Optimize the Hardware Configuration
Optimizing the hardware configuration involves balancing all system components, including the CPU, RAM, and storage, alongside the GPU. Ensuring all parts work harmoniously can prevent bottlenecks that limit rendering performance. Investing in complementary hardware that matches the GPU's capabilities is essential for achieving efficient rendering outcomes.
Attention to cooling and power supply can further improve system stability and performance. A well-cooled GPU operates more efficiently, while a reliable power supply ensures consistent performance under heavy loads.
3. Use Compatible Rendering Software
Using compatible rendering software maximizes GPU efficiency by leveraging hardware-specific optimizations. Many applications offer tailored improvements for different GPU brands and models, which can greatly improve performance.
Regularly updating software also ensures access to the latest features and improvements. Compatibility checks and updates maintain the optimal functioning of rendering applications with current GPU technologies.
4. Manage Resource Usage
Effective resource management ensures that the GPU operates at peak efficiency during rendering tasks. Monitoring tools can help track GPU usage, temperatures, and memory consumption, providing insights into the optimization of workloads. Adjusting settings to avoid exceeding resource capacities prevents performance drops or crashes.
Utilizing render queues and scene optimization can help distribute the workload efficiently, preserving GPU resources for critical tasks. Resource management strategies increase the GPU's longevity and ensure seamless rendering operations.
5. Consider Cloud Rendering for Heavy Workloads
Cloud rendering offers scalability and flexibility, using remote GPUs to handle intensive rendering jobs. This approach mitigates local hardware limitations, allowing access to more powerful resources without significant upfront investment. Cloud services can be tailored to meet project requirements.
Cloud rendering also supports collaboration, as teams can share access to rendered scenes and results. Assessing cloud service providers and their offerings ensures alignment with workflow demands and pricing models.
Related content: Read our guide to GPU virtualization
Next-Gen Dedicated GPU Servers from Atlantic.Net, Accelerated by NVIDIA
Experience unparalleled performance with dedicated cloud servers equipped with the revolutionary NVIDIA accelerated computing platform.
Choose from the NVIDIA L40S GPU and NVIDIA H100 NVL to unleash the full potential of your generative artificial intelligence (AI) workloads, train large language models (LLMs), and harness natural language processing (NLP) in real time.
High-performance GPUs are superb at scientific research, 3D graphics and rendering, medical imaging, climate modeling, fraud detection, financial modeling, and advanced video processing.
Learn more about Atlantic.net GPU server hosting
### How Virtual GPUs Work, Use Cases and Critical Best Practices
What Is a Virtual GPU?
A virtual GPU (vGPU) is a technology that simulates the functionality of a physical graphics processing unit (GPU) within a virtualized environment. This allows multiple virtual machines (VMs) to share a single GPU, optimized for handling graphical tasks such as rendering images and processing complex computations.
Unlike traditional setups where each GPU is dedicated to a single machine, vGPU technology enables more efficient use of resources by distributing GPU power across multiple VMs. This setup helps in achieving higher performance without the need for additional hardware. Through shared usage, vGPUs ensure greater availability of resources.
By emulating physical GPU functions, vGPUs make graphical processing accessible in virtual environments. Organizations can leverage these capabilities for virtual desktop infrastructure (VDI), cloud-based applications, and other demanding tasks. This forms a crucial part of modern IT infrastructure, enabling high-end graphics processing on demand.
This is part of a series of articles about GPU applications.
Benefits of Virtual GPUs
Virtual GPUs offer a range of advantages that enhance performance, scalability, and cost efficiency in virtualized environments:
Improved resource utilization: vGPUs allow multiple virtual machines to share a single physical GPU, maximizing the usage of hardware resources. This leads to better allocation of processing power across tasks, reducing waste and increasing efficiency.
Cost efficiency: By enabling resource sharing, vGPUs eliminate the need for dedicated GPUs for each VM. This reduces hardware expenses and overall operational costs while delivering comparable performance.
Enhanced scalability: Organizations can scale their virtual environments more easily by allocating GPU resources dynamically as per workload requirements. This adaptability makes it easier to handle fluctuating demands without over-provisioning.
Support for high-performance applications: vGPUs enable virtual machines to handle graphically intensive applications, such as CAD tools, machine learning models, and 3D rendering. This ensures that users experience smooth and responsive performance even in demanding scenarios.
Centralized management: Administrators can monitor and manage GPU resources centrally within a virtualized infrastructure. This simplifies maintenance, troubleshooting, and performance tuning.
Related content: Read our guide to GPU for rendering
Types of GPU Virtualization Technologies
API Remoting
API remoting is a GPU virtualization technology that abstracts graphical processing away from local hardware to be executed remotely. This approach sends API calls from an application to a remote server that processes them using its GPU capabilities. By offloading the computation-intensive tasks to performant servers, client devices can perform graphical processing without inherent hardware constraints.
This method is suitable for environments with centralized resource management, improving efficiency without overburdening local machines. Benefits of API remoting include reduced hardware requirements and simplified client devices, as they do not need powerful GPUs. The technology also enables integration into web applications, where graphical tasks are executed remotely. This has applications in cloud gaming and remote desktop applications.
GPU Pass-Through
GPU pass-through involves assigning a physical GPU directly to a virtual machine (VM), enabling the VM to utilize the GPU's full capabilities. Unlike shared models, pass-through allows a VM to access GPU functionalities directly, making it suitable for tasks demanding high performance. By providing direct access to a GPU, applications running on the VM can benefit from full processing power without the overhead of virtualization layers.
This approach is beneficial in high-performance environments needing dedicated resources, like detailed 3D rendering or complex scientific computations. However, the trade-off is that the GPU becomes exclusively assigned to the VM, which prohibits resource sharing, potentially leading to unused capacity if not managed correctly.
Mediated Pass-Through (vGPU)
Mediated pass-through, also known as vGPU, virtualizes a single physical GPU into multiple isolated instances shared among VMs. This method permits VMs to utilize a GPU's full performance as if exclusively dedicated to each instance, balancing resource allocation with efficiency. By installing a mediation layer, the virtualization software distributes GPU capacity among users while providing direct access similar to a dedicated setup.
This approach is advantageous for organizations needing concurrent GPU resource use without sacrificing application performance. Mediated pass-through effectively manages multiple heavy workloads, balancing demands and ensuring each application gets necessary compute power. In design, simulation, and data analytics sectors, it offers a unified solution for intensive tasks.
GPU Device Emulation
With GPU device emulation, the GPU's capabilities are emulated in a virtual environment, allowing software to simulate GPU instructions. Emulation creates a virtual representation of GPU functionalities, so applications can operate as if on a physical GPU. While extending virtual compatibility across multiple platforms, it generally exhibits lower performance compared to direct access or pass-through methods due to added processing overhead.
Emulation proves beneficial for systems requiring high portability and flexibility, accommodating various applications not demanding maximum speed. It provides an adaptation layer that improves testing environments, supporting cross-platform development and debugging without the need for the original hardware. However, it may not be suitable for high-end graphical or computational tasks.
Tips from the expert:
Richard Bailey
Technical Editor
Richard Bailey brings over two decades of IT expertise, from traditional data centers to cutting-edge cloud solutions. As the founder of turbogeek.co.uk and a seasoned writer, he focuses on delivering authoritative content on our hosting services, HIPAA compliance, and related topics.
In my experience, here are tips that can help you better deploy and utilize virtual GPU (vGPU) technology for optimal performance and resource efficiency:
Implement resource pooling for burst workloads: Use vGPU resource pooling to accommodate peak workloads by dynamically reallocating GPU resources to VMs as demand increases. This is especially useful in environments with fluctuating requirements, such as VDI during work hours or AI model training at specific times.
Use workload-specific profiles for vGPU allocation: NVIDIA vGPU profiles enable organizations to allocate GPU memory and compute power based on workload requirements. For instance, assign higher memory profiles for CAD or AI tasks, and lower ones for standard office applications. Fine-tuning these profiles optimizes GPU utilization across diverse workloads.
Leverage hybrid GPU setups for cost efficiency: Combine virtualized GPUs with physical GPU pass-through for environments with both high-demand and low-demand workloads. Assign pass-through GPUs for compute-heavy tasks like scientific simulations, while using vGPUs for lighter workloads, ensuring cost-effective infrastructure scaling.
Minimize latency with NUMA affinity: In systems with multiple GPUs and CPUs, align GPU resources with specific CPU nodes using Non-Uniform Memory Access (NUMA) affinity. This reduces cross-node latency, improving performance for latency-sensitive tasks like gaming or real-time analytics.
Plan GPU overcommitment carefully: While overcommitting GPU resources can maximize utilization, excessive overcommitment may cause performance degradation during peak loads. Monitor usage patterns and maintain a balance between resource availability and overcommitment levels for optimal efficiency.
Virtual GPU Use Cases and Applications
Virtual Desktop Infrastructure (VDI)
Virtual Desktop Infrastructure (VDI) uses virtual GPUs to provide graphical performance for virtual desktops. vGPUs enable access to shared hardware resources, enabling users to experience high-quality graphics without physical hardware dependency. This reduces the need for locally dedicated GPUs, optimizing the computing architecture and improving cost efficiency.
VDI supports resource-intense applications across diverse industries, from design to finance. It improves system centralization and data security since information is managed on the server rather than individual devices. Centralized management reduces potential data breaches risk, protecting sensitive information within controlled environments.
Cloud Gaming
Cloud gaming leverages virtual GPUs to stream games from servers to end-user devices, requiring minimal local computing power. vGPUs enable cloud gaming platforms to efficiently allocate GPU resources, delivering high-quality gaming experiences without requiring high-end user hardware. This service model reduces barriers for gamers, making advanced gaming graphics accessible on standard devices.
Additionally, cloud gaming powered by vGPUs reduces the need for frequent hardware upgrades, as processing is handled remotely. This attracts a wider audience, fostering significant cost savings for users. Providers benefit by optimizing server resource distribution, accommodating changes in user demand without expanding physical infrastructure.
Machine Learning and AI Workloads
Machine learning (ML) and AI applications often require substantial computational resources, and virtual GPUs meet this need by providing scalable processing power. By deploying vGPUs, organizations can accelerate ML and AI workloads with efficient resource allocation, optimizing performance without the constraints of traditional hardware limitations.
This capability improves training and inference processes, reducing time to result and enabling complex model development. vGPUs enable enterprises to leverage existing infrastructure more effectively by allocating resources dynamically. This efficient use of resources lowers hardware costs and energy consumption.
High-Performance Computing (HPC)
High-performance computing (HPC) leverages virtual GPUs to perform intricate calculations and simulations. vGPUs improve HPC environments by providing powerful, parallel compute capabilities required for tasks such as scientific modeling, financial simulations, and engineering computations.
This approach utilizes GPU acceleration to achieve higher throughput with reduced processing time, supporting substantial data and workload requirements typical in HPC scenarios. HPC environments benefit from the scalability of virtual GPUs, enabling faster adaption to various workload demands. By virtualizing GPU resources, organizations can efficiently manage computational power across projects without excessive hardware investment.
5 Best Practices for Deploying Virtual GPUs
Here are some of the best practices that organizations should consider when using vGPUs.
1. Assessing Workload Requirements
Consider the graphical processing demands of applications, including frequency, volume, and intensity of graphical tasks. Proper assessment helps determine resource allocation needs, balancing compute capabilities with organizational goals. By clearly understanding application requirements, engineers avoid resource underutilization and overspending while ensuring that infrastructure aligns with workload expectations.
Analyzing current hardware and software capabilities alongside anticipated growth is equally crucial. Forecasting changes in computational needs enables proactive planning, ensuring the vGPU environment remains scalable and adaptable. A detailed requirement assessment aids in deploying a solution that addresses immediate demands and accommodates future workloads.
2. Selecting Appropriate Hardware
Consideration of compatible GPU devices supporting virtualization capabilities ensures efficient resource sharing. High-performance server components, such as adequate CPUs and ample memory, extend resource availability and sustain demanding workloads. Align hardware selection with the requirements of the virtualization software and target applications.
Additionally, networking components and storage solutions must be factored into hardware selection. High-throughput networks help minimize latency issues, ensuring uninterrupted performance for graphics-heavy applications. Strong storage infrastructure supports extensive data handling and retrieval demands typical in virtualized setups.
3. Optimizing Performance Settings
Adjustment of GPU memory and core allocations per virtual machine ensures even distribution of resources, aligning with application requirements. By setting appropriate scheduling and prioritization within the workload, organizations can maximize system throughput, maintaining high-performance standards across dynamic environments.
Regular system monitoring and analysis aid in identifying performance bottlenecks, enabling timely interventions that maintain high efficiency. Advanced tuning involves leveraging hypervisor features such as automatic tuning and load balancing to dynamically adjust resource allocations based on real-time workload variations.
4. Monitoring and Management Tools
Monitoring and management tools are essential for maintaining virtual GPU environments, offering insights into resource allocation, performance metrics, and potential issues. These tools provide real-time data, enabling proactive management and optimized resource utilization. Monitoring dashboards enable administrators to track key performance indicators.
Management tools improve control over resource distribution, allowing dynamic adjustments to vGPU settings and configurations. Automation features, such as alerts and reporting, support timely responses to changing operational demands, reducing downtime and maintaining optimal performance.
5. Ensuring Security and Compliance
Implement isolation mechanisms to prevent unauthorized data access between virtual machines. Encryption techniques, alongside stringent access controls, fortify network and storage security, addressing vulnerabilities in data transmission and storage. The adoption of best security practices ensures compliance with relevant regulations.
Regular vulnerability assessments and updates to security protocols further improve resilience against potential threats. Collaboration with virtualization solution providers to implement the latest security patches addresses emerging vulnerabilities proactively.
Next-Gen Dedicated GPU Servers from Atlantic.Net, Accelerated by NVIDIA
Experience unparalleled performance with dedicated cloud servers equipped with the revolutionary NVIDIA accelerated computing platform.
Choose from the NVIDIA L40S GPU and NVIDIA H100 NVL to unleash the full potential of your generative artificial intelligence (AI) workloads, train large language models (LLMs), and harness natural language processing (NLP) in real time.
High-performance GPUs are superb at scientific research, 3D graphics and rendering, medical imaging, climate modeling, fraud detection, financial modeling, and advanced video processing.
Learn more about Atlantic.net GPU server hosting
### NVIDIA NVLink: How It Works, Use Cases, and Critical Best Practices
What Is NVIDIA NVLink?
NVLink is a high-speed interconnect technology developed by NVIDIA to improve data transfer between GPUs and CPUs. It addresses the limitations of the PCI Express (PCIe) interface in high-performance computing applications by providing a faster pathway with lower latency. NVLink enables better communication and coordination between GPU units, crucial in workloads such as AI, deep learning, and scientific simulations.
The primary benefit of NVLink is its ability to create a unified memory pool across multiple GPUs. This allows for more efficient parallel processing and resource sharing. By reducing bottlenecks and improving the scalability of systems, NVLink significantly improves performance, especially in data-intensive tasks.
This is part of a series of articles about GPU architecture.
How NVLink Works
NVLink works by establishing a direct, high-bandwidth link between compatible processors and memory. This architecture bypasses the slower PCIe system, which can be limiting in scenarios requiring substantial data flow between processors. NVLink's design allows multiple GPUs to communicate directly with one another at higher speeds.
Key to its operation is the support for cache coherence, which ensures data consistency across the GPUs sharing memory space. This feature simplifies programming models because developers do not need to manage memory coherency explicitly. This makes NVLink a viable alternative to traditional PCIe, improving data flow and computing efficiency.
NVLink Architecture
The NVLink architecture is structured around links that connect the computing units within a system. Each NVLink connection supports a significantly higher data throughput compared to PCIe lanes, providing an aggregate bandwidth considerably surpassing conventional interconnects. This architecture supports multiple connectivity options, enabling varied system configurations to suit workload demands.
These links incorporate protocol layers that manage data transfer processes, ensuring resilience and efficiency. By splitting data across multiple parallel paths, NVLink minimizes wait times and improves throughput.
Data Transfer Mechanisms
NVLink uses advanced data transfer mechanisms that optimize how data moves between components. It features protocols that allow for coherent data sharing, reducing the need for manual synchronization and ensuring unity in data view across GPUs.
Another key mechanism is memory pooling, which lets multiple GPUs share a single large memory space. This arrangement reduces redundancy and improves parallel processing capabilities, vital for applications needing broad computational resources.
Advantages of NVLink Over PCIe
NVLink provides several advantages over PCIe, the traditional serial bus standard used in most computer systems:
Higher bandwidth: NVLink offers significantly higher bandwidth compared to PCIe. While PCIe 4.0 provides a maximum throughput of approximately 32 GB/s for a 16-lane connection, NVLink can achieve bandwidths exceeding 200 GB/s, depending on the generation.
Lower latency: NVLink reduces latency by providing a direct connection between GPUs or between a GPU and CPU. Unlike PCIe, which involves multiple intermediary steps, NVLink allows for faster communication by eliminating unnecessary bottlenecks.
Unified memory pooling: One of NVLink's standout features is its ability to create a unified memory pool across GPUs. This allows multiple GPUs to share memory seamlessly, effectively expanding the available memory space for large models or datasets. PCIe-based systems often require explicit data transfers between discrete memory pools, adding complexity and overhead.
Enhanced scalability: NVLink's architecture is designed to scale efficiently across multiple GPUs. It supports mesh and ring topologies, enabling the interconnection of more devices without a significant drop in performance. PCIe-based systems can face limitations in scalability due to contention for shared resources.
Improved power efficiency: By optimizing data transfer and reducing latency, NVLink can offer better performance per watt compared to PCIe.
Simplified programming models: NVLink's support for cache coherence ensures data consistency across GPUs sharing memory. This removes the need for developers to manually manage memory synchronization.
Tips from the expert:
Richard Bailey
Technical Editor
Richard Bailey brings over two decades of IT expertise, from traditional data centers to cutting-edge cloud solutions. As the founder of turbogeek.co.uk and a seasoned writer, he focuses on delivering authoritative content on our hosting services, HIPAA compliance, and related topics.
In my experience, here are tips that can help you better harness NVIDIA NVLink technology:
Optimize NVLink topology for specific workloads: Consider the topology (e.g., point-to-point, mesh, ring) based on workload requirements. For example, AI training models with heavy inter-GPU communication benefit from mesh topologies, while workloads with minimal inter-GPU data transfers can utilize simpler setups.
Leverage NVLink-aware libraries: Use libraries like cuDNN, NCCL, and TensorRT, which are optimized to exploit NVLink's high bandwidth. These libraries handle parallelism and memory pooling efficiently, reducing the need for custom optimization.
Integrate NVSwitch for hyperscale systems: For multi-node configurations, consider NVSwitch for a seamless, scalable architecture. It not only improves GPU communication but also enhances collective operations like all-reduce, which are critical in deep learning and HPC workloads.
Pin memory to optimize transfer speeds: Pinning memory (locking it in physical RAM) ensures faster transfers between host memory and GPUs. Combining pinned memory with NVLink’s unified memory model can further boost performance in applications requiring frequent host-GPU communication.
Combine NVLink with RDMA for cluster computing: In distributed systems, use Remote Direct Memory Access (RDMA) with NVLink to achieve low-latency inter-node GPU communication. This is especially useful in HPC clusters or AI supercomputers to minimize data transfer bottlenecks across nodes.
How NVLink Works with NVSwitch
NVLink and NVSwitch complement each other to enable high-performance, scalable GPU communication in advanced computing systems. While NVLink provides direct, high-speed interconnects between GPUs, NVSwitch extends these connections into a cohesive, multi-node environment. Together, they create an efficient system tailored for data-intensive workloads like AI training and scientific simulations.
NVSwitch serves as a high-bandwidth switch that integrates multiple NVLink connections, enabling seamless, all-to-all communication across GPUs. The latest NVSwitch generation supports 64 NVLink ports and incorporates NVIDIA's Scalable Hierarchical Aggregation Reduction Protocol (SHARP), which optimizes data aggregation and transfer.
In practical terms, NVSwitch improves the capabilities of NVLink by supporting configurations with up to 256 GPUs interconnected at an aggregate bandwidth of 57.6 TB/s.
NVLink Use Cases and Applications
High-Performance Computing (HPC)
In high-performance computing, NVLink enables the handling of massive computing loads, essential for simulations, weather modeling, and scientific research. NVLink's architecture allows clusters of GPUs to work in tandem, improving computational power without the limitations inherent to PCIe.
The rapid transfer speeds offered by NVLink allow researchers to focus on deriving insights and results, reducing the time required for complex calculations. This efficiency translates directly into faster time-to-results in computational-heavy tasks, benefiting scientific projects, financial modeling, and operational research.
Artificial Intelligence and Deep Learning
AI and deep learning frameworks derive considerable benefits from NVLink's data transfer capabilities. AI models often require intensive data processing between GPUs during both training and inference phases, and NVLink alleviates the bandwidth restrictions and latency bottlenecks that can hinder performance with PCIe alone.
By providing a coherent memory space across GPUs, NVLink simplifies the development of AI algorithms, enabling easier scaling and implementation of complex neural networks. The reduction in data bottlenecks allows for more extensive experiments and rapid iteration cycles.
Data Analytics and Big Data
NVLink's high bandwidth and low latency characteristics make it ideal for data analytics and big data computation. These fields require processing vast amounts of data quickly, and any delays can impact decision-making and insights. By optimizing data flow, NVLink curtails processing times and aids in managing real-time analytics applications.
In big data scenarios, NVLink's ability to form expansive memory pools from multiple GPUs means that larger datasets can be processed simultaneously. This parallel processing capability is crucial for organizations looking to leverage data-driven insights rapidly.
4 Best Practices for Optimizing NVLink Performance
Here are some of the ways to ensure optimal performance when using NVLink.
1. Efficient Memory Utilization
Efficient memory utilization with NVLink requires strategic planning of data distribution and caching strategies across GPU networks. Ensuring balanced access to the shared memory resources helps avert performance degradation due to bottlenecks. Techniques such as load balancing and dynamic memory allocation can aid in achieving these goals effectively.
Integrating memory coherence strategies across shared memory pools helps minimize latency and improves data retrieval efficiency. This involves coordinating data access to benefit from NVLink's high bandwidth, optimizing computational workloads across system resources.
2. Balancing Computational Workloads
Balancing workloads across GPUs in an NVLink-enhanced environment ensures that no single GPU is overloaded while others are underutilized. This balance is crucial, as it maximizes the computational power available, allowing for the efficient parallel processing NVLink is designed to deliver. Techniques involving dynamic scheduling and task distribution help achieve this balance.
Developers should aim to distribute tasks in a way that resources are fully utilized without data congestion or idle periods. This approach ensures that each GPU contributes effectively to computation, further leveraging NVLink's strengths in connected operations.
3. Monitoring and Troubleshooting NVLink
Monitoring NVLink performance requires tools that can track data flow, bandwidth usage, and processing bottlenecks. Effective use of monitoring tools aids in identifying issues quickly, ensuring the system runs smoothly. Tools like NVIDIA's system management suite provide insights into NVLink's operational status.
Troubleshooting NVLink involves checking cable connections, ensuring firmware updates, and validating driver installations. These measures help address common issues that might arise, including data transfer slowdowns or connector failures.
4. Ensuring System Compatibility and Updates
To ensure NVLink compatibility, systems must have the right hardware and up-to-date software support. This includes installing the latest drivers and ensuring that firmware is updated to manage NVLink's functions properly. Regularly updating system software helps preempt compatibility problems and ensures continued access to NVLink's latest features and improvements.
Related content: Read our guide to virtual GPU (coming soon)
Next-Gen Dedicated GPU Servers from Atlantic.Net, Accelerated by NVIDIA
Experience unparalleled performance with dedicated cloud servers equipped with the revolutionary NVIDIA accelerated computing platform.
Choose from the NVIDIA L40S GPU and NVIDIA H100 NVL to unleash the full potential of your generative artificial intelligence (AI) workloads, train large language models (LLMs), and harness natural language processing (NLP) in real time.
High-performance GPUs are superb at scientific research, 3D graphics and rendering, medical imaging, climate modeling, fraud detection, financial modeling, and advanced video processing.
Learn more about Atlantic.net GPU server hosting
### Installing MyScale on an Ubuntu Server
MyScale allows you to run similarity searches with SQL. This guide will provide a step-by-step procedure for installing MyScale locally on an Ubuntu server.
Prerequisites
Before you begin the installation process, ensure you have the following prerequisites in place:
An Ubuntu server
root or sudo privileges
Step 1 - Create a MyScale Cluster Online
Create a signup login for MyScale at the following website https://myscale.com.
Give yourself a Username, set your Company, and fill in the required information:
Click on the New Cluster button on the top right:
Launch a Cluster, give it a name, select the free tier:
Once completed, you get given the option to import demo data. In this example we will choose the “movie recommendation” demo data. Next, click import:
The data will now import.
Wait a few moments for the cluster to initialize:
Important: Make sure you get the “Connection Details” from your MyScale cluster. Simply click the tab in the top right corner and select “Connection Details.” You will need this information for later in the procedure.
Step 2 – Update Ubuntu and Install Python
First, update Ubuntu:
apt update
apt upgrade -y
MyScale requires Python. You can install it using the following commands:
apt install python3 python3-pip unzip -y
Note: You may be prompted to restart services after installation. Just click .
Next, install the Python virtual environment package.
pip install -U virtualenv
Step 3 – Install Jupyter Lab
Now, install Jupyter Lab using the pip command.
pip3 install jupyterlab
This command installs Jupyter Lab and its dependencies. Next, edit the .bashrc file.
nano ~/.bashrc
Define your Jupyter Lab path as shown below; simply add it to the bottom of the file:
export PATH=$PATH:~/.local/bin/
Reload the changes using the following command.
source ~/.bashrc
Next, test run the Jupyter Lab locally using the following command to make sure everything starts.
jupyter lab --allow-root --ip=0.0.0.0 --no-browser
Check the output to make sure there are no errors. Upon success, you will see the following output.
[C 2023-12-05 15:09:31.378 ServerApp] To access the server, open this file in a browser:
http://ubuntu:8888/lab?token=aa67d76764b56c5558d876e56709be27446
http://127.0.0.1:8888/lab?token=aa67d76764b56c5558d876e56709be27446
Press the CTRL+C to stop the server.
Step 4 – Configure Jupyter Lab
By default, Jupyter Lab doesn’t require a password to access the web interface.
To secure Jupyter Lab, generate the Jupyter Lab configuration using the following command.
jupyter-lab --generate-config
Output.
Writing default config to: /root/.jupyter/jupyter_lab_config.py
Next, set the Jupyter Lab password.
jupyter-lab password
Set your password as shown below:
Enter password:
Verify password:
[JupyterPasswordApp] Wrote hashed password to /root/.jupyter/jupyter_server_config.json
You can verify your hashed password using the following command.
cat /root/.jupyter/jupyter_server_config.json
Output.
{
"IdentityProvider": {
"hashed_password": "argon2:$argon2id$v=19$m=10240,t=10,p=8$zf0ZE2UkNLJK39l8dfdgHA$0qIAAnKiX1EgzFBbo4yp8TgX/G5GrEsV29yjHVUDHiQ"
}
}
Note this information, as you will need to add it to your config.
Next, edit the Jupyter Lab configuration file.
nano /root/.jupyter/jupyter_lab_config.py
Define your server IP, hashed password, and other configurations as shown below:
c.ServerApp.ip = 'your-server-ip'
c.ServerApp.open_browser = False
c.ServerApp.password = 'argon2:$argon2id$v=19$m=10240,t=10,p=8$zf0ZE2UkNLJK39l8dfdgHA$0qIAAnKiX1EgzFBbo4yp8TgX/G5GrEsV29yjHVUDHiQ'
c.ServerApp.port = 8888
Make sure you format the file exactly as above. For example, the port number is not in brackets, and the False boolean must have a capital F.c.
Save and close the file when you are done.
Step 5 – Create a Systemctl Service File
Next, create a systemd service file to manage Jupyter Lab.
nano /etc/systemd/system/jupyter-lab.service
Add the following configuration:
[Service]
Type=simple
PIDFile=/run/jupyter.pid
WorkingDirectory=/root/
ExecStart=/usr/local/bin/jupyter lab --config=/root/.jupyter/jupyter_lab_config.py --allow-root
User=root
Group=root
Restart=always
RestartSec=10
[Install]
WantedBy=multi-user.target
Save and close the file, then reload the systemd daemon.
systemctl daemon-reload
Next, start the Jupyter Lab service using the following command.
systemctl start jupyter-lab
You can now check the status of the Jupyter Lab service using the following command.
systemctl status jupyter-lab
Jupyter Lab is now starting and listening on port 8888. You can verify it with the following command.
ss -antpl | grep jupyter
Output.
LISTEN 0 128 104.219.55.40:8888 0.0.0.0:* users:(("jupyter-lab",pid=156299,fd=6))
Step 6 – Access Jupyter Lab
Now, open your web browser and access the Jupyter Lab web interface using the URL http://your-server-ip:8888. You will see Jupyter Lab on the following screen.
Provide the password you set during the installation and click on Log in. You will see the Jupyter Lab dashboard on the following screen:
Step 7 - Start the Python3 Notebook
You can now start the Python 3 Notebook.
Step 8 - Install ClickHouse Connect and Prerequisites
Switch over to your Jupyter Notebook and run:
!pip install -U clickhouse-connect scikit-learn unzip pandas matplotlib datasets pyarrow
Download some additional sample data:
!wget https://files.grouplens.org/datasets/movielens/ml-latest-small.zip
Unzip the Sample Data
!unzip ml-latest-small.zip
Step 8 - Build a Dataset
This example uses information provided from the MyScale GitHub Page.
Let's start building a dataset by:
Importing necessary files
Loading movie metadata
Add TMDB IDs (filtered)
import pandas as pd
# obtain movie metadata
original_movie_metadata = pd.read_csv('ml-latest-small/movies.csv')
movie_metadata = original_movie_metadata[['movieId', 'title', 'genres']]
movie_metadata['genres'] = movie_metadata['genres'].str.split('|', expand=False)
# add tmdbId to movie metadata dataframe
original_movie_links = pd.read_csv('ml-latest-small/links.csv')
movie_info = pd.merge(movie_metadata, original_movie_links, on=["movieId"])[['movieId', 'title', 'genres', 'tmdbId']]
# filter tmdb valid movies
movie_info = movie_info[movie_info['tmdbId'].notnull()]
movie_info['tmdbId'] = movie_info['tmdbId'].astype(int).astype(str)
movie_info.head()
You should see output like this:
Now run this command:
Load User Ratings
Check dataset properties
# get movie user rating info
movie_user_rating = pd.read_csv('ml-latest-small/ratings.csv')# remove ratings of movies which don't have tmdbId
movie_user_rating = movie_user_rating[movie_user_rating['movieId'].isin(movie_info['movieId'])]
movie_user_rating = movie_user_rating[["userId", "movieId", "rating"]]
movie_user_rating.head()
The procedure generates two dataframes:
movie_info: Contains movie information (ID, title, genres, TMDB ID).
movie_user_rating: Contains user ratings for movies.
Now run this command:
movie_user_rating.nunique()
You Should see output like this:
userId 610
movieId 9716
rating 10
dtype: int64
Step 10 - Run a Vector Search on the Data
This part of your procedure focuses on generating vector embeddings for users and movies, and then preparing the data for loading into MyScale.
Run the following commands to use NMF. NMF is a dimensionality reduction technique that decomposes a matrix into two smaller matrices with non-negative values. This is suitable for user-item interaction data like movie ratings, as the values are inherently non-negative.
from sklearn.decomposition import NMF
from sklearn.preprocessing import MaxAbsScaler
from scipy.sparse import csr_matrixuser_indices, user_ids = pd.factorize(movie_user_rating['userId'])
item_indices, movie_ids = pd.factorize(movie_user_rating['movieId'])
rating_sparse_matrix = csr_matrix((movie_user_rating['rating'], (user_indices, item_indices)))# normalize matrix with MaxAbsScaler
max_abs_scaler = MaxAbsScaler()
rating_sparse_matrix = max_abs_scaler.fit_transform(rating_sparse_matrix)
This will create a user-item matrix, we can fit an NMF model with the matrix.
# create NMF model with settings
dimension = 512
nmf_model = NMF(n_components=dimension, init='nndsvd', max_iter=500)# rating sparse matrix decomposition with NMF
user_vectors = nmf_model.fit_transform(rating_sparse_matrix)
item_vectors = nmf_model.components_.Terror = nmf_model.reconstruction_err_
print("Reconstruction error: ", error)
# generate user vector matrix, containing userIds and user vectors
user_vector_df = pd.DataFrame(zip(user_ids, user_vectors), columns=['userId', 'user_rating_vector']).reset_index(drop=True)# generate movie vector matrix, containing movieIds and movie vectors
movie_rating_vector_df = pd.DataFrame(zip(movie_ids, item_vectors), columns=['movieId', 'movie_rating_vector'])
Step 11 - Creating Datasets
We now have four dataframes: movie metadata, user movie ratings, user vectors and movie vectors. We will merge the relevant dataframes into a single dataframe.
In the step we will:
Merge the movie_rating_vector_df (containing movie vectors) with the movie_info DataFrame (containing movie metadata) using the movieId column.
Keep the user_rating_df (containing user ratings) separate for later use.
Convert the dataframesto Parquet format using pyarrow. Parquet is a columnar storage format that is efficient for analytical queries and data warehousing. This is a good choice for storing data that will be loaded into MyScale.
user_rating_df = movie_user_rating.reset_index(drop=True)
# add movie vectors into movie metadata and remove movies without movie vector
movie_info_df = pd.merge(movie_info, movie_rating_vector_df, on=["movieId"]).reset_index(drop=True)
movie_info_df.head()
import pyarrow as pa
import pyarrow.parquet as pq# create table objects from the data and schema
movie_table = pa.Table.from_pandas(movie_info_df)
user_table = pa.Table.from_pandas(user_vector_df)
rating_table = pa.Table.from_pandas(user_rating_df)# write the table to parquet files
pq.write_table(movie_table, 'movie.parquet')
pq.write_table(user_table, 'user.parquet')
pq.write_table(rating_table, 'rating.parquet')
Step 12 - Populating Data to MyScale
To populate data to MyScale, first, we load data into panda dataframes.
In [1]:
from datasets import load_dataset
movie = load_dataset("myscale/recommendation-examples", data_files="movie.parquet", split="train")
user = load_dataset("myscale/recommendation-examples", data_files="user.parquet", split="train")
rating = load_dataset("myscale/recommendation-examples", data_files="rating.parquet", split="train")
# transform datasets to panda Dataframe
movie_info_df = movie.to_pandas()
user_vector_df = user.to_pandas()
user_rating_df = rating.to_pandas()
# convert embedding vectors from np array to list
movie_info_df['movie_rating_vector'] = movie_info_df['movie_rating_vector'].apply(lambda x: x.tolist())
user_vector_df['user_rating_vector'] = user_vector_df['user_rating_vector'].apply(lambda x: x.tolist())
You should see output like this:
Generating train split: 9716 examples [00:00, 46166.81 examples/s]
Generating train split: 610 examples [00:00, 60321.24 examples/s]
Generating train split: 100823 examples [00:00, 13216311.29 examples/s]
Step 13 - Connect to MyScale
Now connect to MyScale:
import clickhouse_connect
client = clickhouse_connect.get_client(
host='msc-xxxxxxxx.us-east-1.aws.myscale.com',
port=443,
username='atlanticdotnetdemo_org_default',
password='123456789'
)
Now prep the data to dump into MyScale:
client.command("DROP TABLE IF EXISTS default.myscale_movies")
client.command("DROP TABLE IF EXISTS default.myscale_users")
client.command("DROP TABLE IF EXISTS default.myscale_ratings")# create table for movies
client.command(f"""
CREATE TABLE default.myscale_movies
(
movieId Int64,
title String,
genres Array(String),
tmdbId String,
movie_rating_vector Array(Float32),
CONSTRAINT vector_len CHECK length(movie_rating_vector) = 512
)
ORDER BY movieId
""")# create table for user vectors
client.command(f"""
CREATE TABLE default.myscale_users
(
userId Int64,
user_rating_vector Array(Float32),
CONSTRAINT vector_len CHECK length(user_rating_vector) = 512
)
ORDER BY userId
""")# create table for user movie ratings
client.command("""
CREATE TABLE default.myscale_ratings
(
userId Int64,
movieId Int64,
rating Float64
)
ORDER BY userId
""")
Now upload to MyScale:
client.insert("default.myscale_movies", movie_info_df.to_records(index=False).tolist(), column_names=movie_info_df.columns.tolist())
client.insert("default.myscale_users", user_vector_df.to_records(index=False).tolist(), column_names=user_vector_df.columns.tolist())
client.insert("default.myscale_ratings", user_rating_df.to_records(index=False).tolist(), column_names=user_rating_df.columns.tolist())# check count of inserted data
print(f"movies count: {client.command('SELECT count(*) FROM default.myscale_movies')}")
print(f"users count: {client.command('SELECT count(*) FROM default.myscale_users')}")
print(f"ratings count: {client.command('SELECT count(*) FROM default.myscale_ratings')}")
You should see output like this:
movies count: 9716
users count: 610
ratings count: 100823
Step 14 - Index the Data
Now index the data in MyScale:
# create vector index with cosine
client.command("""
ALTER TABLE default.myscale_movies
ADD VECTOR INDEX movie_rating_vector_index movie_rating_vector
TYPE MSTG('metric_type=IP')
""")
You can check the status with this command:
# check the status of the vector index, make sure vector index is ready with 'Built' status
get_index_status="SELECT status FROM system.vector_indices WHERE name='movie_rating_vector_index'"
print(f"index build status: {client.command(get_index_status)}")
Check the output to make sure it changes from this:
index build status: InProgress
To this:
index build status: Built
Step 15 - You Are Now Ready to Query MyScale
Lets now query the vector database:
import matplotlib.pyplot as plt
import numpy as np
import pandas as pdrandom_user = client.query("SELECT * FROM default.myscale_users ORDER BY rand() LIMIT 1")
assert random_user.row_count == 1
target_user_id = random_user.first_item["userId"]
target_user_vector = random_user.first_item["user_rating_vector"]print("currently selected user id={} for movie recommendation\n".format(target_user_id))# user rating plot
target_user_ratings = user_rating_df.loc[user_rating_df['userId'] == target_user_id]['rating'].tolist()
bins = np.arange(1.0, 6, 0.5)
# Compute the histogram
hist, _ = np.histogram(target_user_ratings, bins=bins)
print("Distribution of ratings for user {}:".format(target_user_id))
plt.bar(bins[:-1], hist, width=0.4)
plt.xlabel('Rating')
plt.ylabel('Count')
plt.title('User Rating Distribution')
for i in range(len(hist)):
plt.text(bins[i], hist[i], str(hist[i]), ha='center', va='bottom')
plt.show()
You should see output like this:
You can also use the following command to find the top 10 movies by rating:
top_k = 10
# query the database to find the top K recommende
# d movies
recommended_results = client.query(f"""
SELECT movieId, title, genres, tmdbId, distance(movie_rating_vector, {target_user_vector}) AS dist
FROM default.myscale_movies
WHERE movieId not in (
SELECT movieId
from default.myscale_ratings
where userId = {target_user_id}
)
ORDER BY dist DESC
LIMIT {top_k}
""")recommended_movies = pd.DataFrame.from_records(recommended_results.named_results())
rated_score_scale = client.query(f"""
SELECT max(rating) AS max, min(rating) AS min
FROM default.myscale_ratings
WHERE userId = {target_user_id}
""")
max_rated_score = rated_score_scale.first_row[0]
min_rated_score = rated_score_scale.first_row[1]print("Top 10 movie recommandations with estimated ratings for user {}".format(target_user_id))
max_dist = recommended_results.first_row[4]
recommended_movies['estimated_rating'] = min_rated_score + ((max_rated_score - min_rated_score) / max_dist) * recommended_movies['dist']
recommended_movies[['movieId', 'title', 'estimated_rating', 'genres']]
This concludes the procedure for installing MyScale on an Ubuntu server and running a basic movie recommendation query. You can now experiment with different parameters and datasets to further explore the capabilities of MyScale - try it on GPU hosting from Atlantic.Net!
### Create a Stable Diffusion Web UI with a Atlantic.Net GPU Server
Stable Diffusion is a text-to-image generation AI model developed by CompVis. It leverages deep learning techniques to produce visually stunning images based on natural language prompts. However, running such a powerful model requires significant computational resources, which is why we use an Atlantic.Net GPU server.
An Atlantic.Net GPU server instance provides the necessary GPU acceleration, ensuring the model operates efficiently. By combining this power with a user-friendly web interface, you can create images seamlessly and share the experience with others.
This guide will explain how to deploy your Stable Diffusion Web UI on the Ubuntu 22.04 GPU server.
Prerequisites
Before proceeding, ensure you have the following:
An Ubuntu 22.04 server with an NVIDIA GPU and a minimum of 6 GB GPU RAM.
NVIDIA Drivers and CUDA Toolkit installed and configured on your server.
Step 1: Update the Server and Install Required Dependencies
Update all the packages to the updated version.
apt update -y
Install Python and other required dependencies.
apt install python3 python3-pip -y
Once installed, verify the versions to ensure everything is set up correctly:
python3 --version
pip3 --version
Step 2: Install Git Large File Storage (LFS)
Stable Diffusion uses large checkpoint files that standard Git cannot handle. Git LFS (Large File Storage) is designed to manage these large files effectively.
Install Git Large File Storage (LFS).
apt install git-lfs -y
After installation, initialize Git LFS to enable its functionality globally:
git lfs install
You should see the following output:
Git LFS initialized.
Step 3: Clone the Stable Diffusion Model Repository
The Stable Diffusion model is hosted on Hugging Face, a platform for AI and machine learning models.
Use Git to clone the Stable Diffusion model repository:
git clone https://huggingface.co/CompVis/stable-diffusion-v-1-4-original
This repository contains the sd-v1-4.ckpt checkpoint file, which is the core of the model. Cloning this repository might take some time, depending on your internet speed, as it includes large files (7.14GB)
Step 4: Clone the Stable Diffusion Web UI Repository
The Stable Diffusion Web UI simplifies interaction with the model. Instead of using command-line tools, you can access all features through a graphical interface.
Run the following command to clone the Web UI repository:
git clone https://github.com/AUTOMATIC1111/stable-diffusion-webui.git
This repository contains all the scripts, assets, and backend logic required to host the Stable Diffusion model on a web server.
Step 5: Configure the Model for Web UI
To make the Stable Diffusion model available in the Web UI, you need to move the model checkpoint file (sd-v1-4.ckpt) to the appropriate directory.
Copy the sd-v1-4.ckpt checkpoint file from the Stable Diffusion directory to the stable-diffusion-webui/models/Stable-diffusion/ Web UI directory and rename it as model.ckpt
cp ~/stable-diffusion-v-1-4-original/sd-v1-4.ckpt ~/stable-diffusion-webui/models/Stable-diffusion/model.ckpt
Once the checkpoint file is copied, you can delete the original Stable Diffusion directory to free up disk space:
rm -rf ~/stable-diffusion-v-1-4-original
Step 6: Install FastAPI Framework
FastAPI is a high-performance Python framework used to build the backend for the Web UI.
Use pip to install FastAPI.
pip3 install fastapi
This framework will handle HTTP requests sent to the Web UI, making it responsive and efficient.
Step 7: Launch the Stable Diffusion Web UI
You’re now ready to start the Web UI. The launch.py script initializes the server and makes the interface accessible.
Start the Stable Diffusion Web UI.
cd stable-diffusion-webui
python3 launch.py --listen
The --listen flag allows you to access the Web UI from any device on the same network.
During the launch, the server will load the model and initialize the interface. This process may take a few minutes. Once complete, you’ll see a message indicating the web server is running, along with the URL to access the UI. Please note your GPU must have 6GB of available RAM to start the application.
Step 8: Test the Stable Diffusion Web UI
1. Open your web browser and access the Stable Diffusion Web UI using the URL http://your-server-ip:7860
2. Under the Stable Diffusion checkpoint dropdown menu, select model.ckpt.
3. Select the txt2img tab.
4. Enter a prompt, such as:
A serene landscape with mountains and a river at sunset
5. Adjust the image dimensions (width and height) for better results.
6. Click the Generate button to create your image. The generated image will appear in the UI and can be downloaded.
Conclusion
Congratulations! You've successfully set up a Stable Diffusion Web UI using an Atlantic.Net GPU server instance. This interface allows you to generate stunning AI images directly from your web browser. Experiment with different prompts and settings to unleash the full potential of Stable Diffusion.
### How to Deploy a Deep Learning Model with Streamlit
Machine learning (ML) and data science are transforming industries with intelligent solutions. However, deploying ML models as web applications can be challenging. It often requires knowledge of backend and frontend tools like Flask, React, or JavaScript. For many, this process is both complex and time-consuming.
Streamlit is a game-changer for such scenarios. It enables machine learning engineers to create interactive web applications quickly without needing advanced web development skills. This Python-based, open-source framework is designed for data scientists and ML engineers. Applications built with Streamlit are easy to scale, making it ideal for both prototypes and production systems.
In this guide, we’ll show you how to deploy a deep-learning model using Streamlit. You’ll learn to create a simple, interactive application in no time.
Prerequisites
Before starting the deployment, ensure you have the following:
An Ubuntu 22.04 server with an NVIDIA GPU.
NVIDIA Drivers and CUDA Toolkit.
Step 1: Set Up Your Environment
1. Update your Ubuntu server to ensure all packages are up-to-date.
apt update
apt upgrade -y
2. If Python3 and pip3 are not already installed, install them.
apt install python3 python3-pip -y
3. Install PyTorch with GPU support.
pip3 install torch torchvision torchaudio --index-url https://download.pytorch.org/whl/cu124
4. Install Streamlit and other dependencies.
pip3 install streamlit
pip3 install numpy pandas scikit-learn matplotlib
Step 2: Create the Streamlit Application
1. Create a new directory for your Streamlit app and navigate to it.
mkdir streamlit_app && cd streamlit_app
2. The model uses ImageNet class labels to interpret predictions. Download the labels file:
wget https://gist.githubusercontent.com/ageitgey/4e1342c10a71981d0b491e1b8227328b/raw/24d78ea09a31fdff540a8494886e0051e3ad68f8/imagenet_classes.txt
3. Create a new Streamlit app.
nano app.py
Add the following content:
"""Create an Image Classification Web App using PyTorch and Streamlit."""
# import libraries
from PIL import Image
from torchvision import models, transforms
import torch
import streamlit as st
# set title of app
st.title("Simple Image Classification Application")
st.write("")
# enable users to upload images for the model to make predictions
file_up = st.file_uploader("Upload an image", type = "jpg")
def predict(image):
"""Return top 5 predictions ranked by highest probability.
Parameters
----------
:param image: uploaded image
:type image: jpg
:rtype: list
:return: top 5 predictions ranked by highest probability
"""
# create a ResNet model
resnet = models.resnet101(pretrained = True)
# transform the input image through resizing, normalization
transform = transforms.Compose([
transforms.Resize(256),
transforms.CenterCrop(224),
transforms.ToTensor(),
transforms.Normalize(
mean = [0.485, 0.456, 0.406],
std = [0.229, 0.224, 0.225]
)])
# load the image, pre-process it, and make predictions
img = Image.open(image)
batch_t = torch.unsqueeze(transform(img), 0)
resnet.eval()
out = resnet(batch_t)
with open('imagenet_classes.txt') as f:
classes = [line.strip() for line in f.readlines()]
# return the top 5 predictions ranked by highest probabilities
prob = torch.nn.functional.softmax(out, dim = 1)[0] * 100
_, indices = torch.sort(out, descending = True)
return [(classes[idx], prob[idx].item()) for idx in indices[0][:5]]
if file_up is not None:
# display image that user uploaded
image = Image.open(file_up)
st.image(image, caption = 'Uploaded Image.', use_column_width = True)
st.write("")
st.write("Just a second ...")
labels = predict(file_up)
# print out the top 5 prediction labels with scores
for i in labels:
st.write("Prediction (index, name)", i[0], ", Score: ", i[1])
This app is a simple image classification tool built with Streamlit and PyTorch. It allows users to upload a JPEG image and processes it using a pre-trained ResNet-101 model, which is a deep-learning model trained on the ImageNet dataset. The app resizes and normalizes the uploaded image to prepare it for prediction, then outputs the top 5 predictions along with their probabilities.
Step 3: Configure Streamlit
Streamlit needs to be configured to allow external access from your browser.
1. Create a .streamlit directory in your home folder.
mkdir ~/.streamlit
2. Create a Streamlit configuration file.
nano ~/.streamlit/config.toml
Add the following configuration:
[server]
headless = true
enableCORS = false
port = 8501
Save and close the file.
Step 4: Run the Streamlit Application
Your Streamlit app is installed and configured. Now, it's time to start it.
1. Run the app using the following command.
streamlit run app.py
Output:
Collecting usage statistics. To deactivate, set browser.gatherUsageStats to False.
You can now view your Streamlit app in your browser.
Network URL: http://your-server-ip:8501
External URL: http://your-server-ip:8501
2. Open your browser and navigate to http://your-server-ip:8501. You will see your app dashboard.
3. Click on Browse files and upload any image (JPEG format).
4. The app will display the image and predict the top 5 classes with their probabilities.
Step 5: Monitor GPU Usage
To ensure that your model is utilizing the GPU, monitor its activity with:
watch -n 1 nvidia-smi
This command displays real-time GPU usage.
Conclusion
Congratulations! You’ve successfully deployed a deep learning model using PyTorch and Streamlit on an Ubuntu 22.04 GPU server. Your web application is now live and can classify images uploaded by users. This deployment leverages GPU acceleration for fast predictions and offers an intuitive interface for non-technical users.
### How to Deploy ComfyUI on and Atlantic.Net GPU Server
ComfyUI is a versatile and user-friendly web interface designed for running AI models. It is widely used for tasks like image generation and other AI-driven workflows. By deploying it on a GPU-powered Atlantic.Net server, you can take advantage of high-performance hardware for faster and more efficient processing.
Running ComfyUI on a dedicated server is ideal for users who need reliable performance without the limitations of local machines. It ensures that your infrastructure can handle computationally intensive tasks seamlessly. Atlantic.Net servers provide scalable GPU resources, making them perfect for AI applications.
This guide will walk you through the process of deploying ComfyUI on an Atlantic.Net GPU server.
Prerequisites
Ensure you have the following before starting:
An Ubuntu 22.04 server with an NVIDIA GPU (minimum 6 GB GPU RAM).
NVIDIA Drivers and CUDA Toolkit installed.
Step 1: Update and Install Python Dependencies
1. Update the package index and upgrade existing packages:
apt update
apt upgrade -y
2. If Python3 and pip3 are not already installed, install them.
apt install python3 python3-pip -y
Step 2: Install ComfyUI
In this section, we will download ComfyUI and install the required dependencies for it.
1. Download the ComfyUI source code using Git.
git clone https://github.com/comfyanonymous/ComfyUI.git
2. Navigate to the ComfyUI directory.
cd ComfyUI
3. Install required dependency packages.
pip install "numpy<2" torch==2.1.0+cu121 torchvision==0.16.0+cu121 torchaudio==2.1.0+cu121 --extra-index-url https://download.pytorch.org/whl xformers
The above command installs the following packages:
torch: A library for machine learning. It provides tools for deep learning with a flexible computational graph.
torchvision: A library for computer vision. It includes utilities for image and video datasets, such as image classification and object detection.
torchaudio: A library for audio processing. It offers tools for loading, transforming, and working with audio datasets.
xformers: A library for transformer-based
4. Install additional dependencies.
pip install -r requirements.txt
5. Navigate to the models/checkpoints directory.
cd models/checkpoints
6. Create a put_checkpoints_here file.
nano put_checkpoints_here
Add the following lines to download Stable Diffusion models.
## SDXL
wget -c https://huggingface.co/stabilityai/stable-diffusion-xl-base-1.0/resolve/main/sd_xl_base_1.0.safetensors -P ./models/checkpoints/
wget -c https://huggingface.co/stabilityai/stable-diffusion-xl-refiner-1.0/resolve/main/sd_xl_refiner_1.0.safetensors -P ./models/checkpoints/
## SD1.5
wget -c https://huggingface.co/runwayml/stable-diffusion-v1-5/resolve/main/v1-5-pruned-emaonly.ckpt -P ./models/checkpoints/
## SD2
wget -c https://huggingface.co/stabilityai/stable-diffusion-2-1-base/resolve/main/v2-1_512-ema-pruned.safetensors -P ./models/checkpoints/
wget -c https://huggingface.co/stabilityai/stable-diffusion-2-1/resolve/main/v2-1_768-ema-pruned.safetensors -P ./models/checkpoints/
Save the file.
7. Run the above file.
bash put_checkpoints_here
8. Switch to your user home directory.
cd
9. Move the ComfyUI project directory to a /opt directory.
mv ComfyUI /opt/
Step 3: Configure ComfyUI as a System Service
Now, you will need to create a system unit file to manage the ComfyUI service.
1. Create a new service file.
nano /etc/systemd/system/comfyui.service
Add the following configurations to the file.
[Unit]
Description=ComfyUI System Service
After=network.target
[Service]
WorkingDirectory=/opt/ComfyUI
ExecStart=python3 main.py --disable-cuda-malloc
[Install]
WantedBy=multi-user.target
2. Reload the systemd daemon to apply the changes.
systemctl daemon-reload
3. Start and enable the ComfyUI system service.
systemctl enable comfyui
systemctl start comfyui
4. Check the service status.
systemctl status comfyui
Output.
● comfyui.service - ComfyUI System Service
Loaded: loaded (/etc/systemd/system/comfyui.service; enabled; vendor preset: enabled)
Active: active (running) since Sat 2024-12-07 05:04:57 UTC; 5s ago
Main PID: 8372 (python3)
Tasks: 3 (limit: 14212)
Memory: 849.9M
CPU: 5.025s
CGroup: /system.slice/comfyui.service
└─8372 python3 main.py
Dec 07 05:05:00 gpu-server python3[8372]: Python 3.10.13 (you have 3.10.12)
Dec 07 05:05:00 gpu-server python3[8372]: Please reinstall xformers (see https://github.com/facebookresearch/xformers#installing-xformers)
Dec 07 05:05:00 gpu-server python3[8372]: Memory-efficient attention, SwiGLU, sparse and more won't be available.
Dec 07 05:05:00 gpu-server python3[8372]: Set XFORMERS_MORE_DETAILS=1 for more details
Dec 07 05:05:01 gpu-server python3[8372]: xformers version: 0.0.22.post7+cu118
Dec 07 05:05:01 gpu-server python3[8372]: Set vram state to: NORMAL_VRAM
Dec 07 05:05:01 gpu-server python3[8372]: Device: cuda:0 GRID A100D-8C : cudaMallocAsync
Dec 07 05:05:02 gpu-server python3[8372]: Using pytorch cross attention
Dec 07 05:05:03 gpu-server python3[8372]: [Prompt Server] web root: /opt/ComfyUI/web
Dec 07 05:05:03 gpu-server python3[8372]: Successfully imported spandrel_extra_arches: support for non commercial upscale models.
Step 4: Configure Nginx as a Reverse Proxy
By default, ComfyUI listens on the localhost port 8188. You will need to set up a reverse proxy such as Nginx to forward all incoming connection requests to the backend port 8188 to enable access to the ComfyUI interface.
1. Install Nginx.
apt install nginx -y
2. Create a new Nginx virtual host configuration file.
nano /etc/nginx/conf.d/comfyui.conf
Add the following configuration.
upstream backend {
server 127.0.0.1:8188;
}
server {
listen 80;
listen [::]:80;
server_name comfy.example.com;
proxy_set_header Host $host;
proxy_http_version 1.1;
proxy_set_header X-Real-IP $remote_addr;
proxy_set_header X-Forwarded-For $proxy_add_x_forwarded_for;
proxy_set_header X-Forwarded-Proto $scheme;
proxy_set_header Sec-WebSocket-Extensions $http_sec_websocket_extensions;
proxy_set_header Sec-WebSocket-Key $http_sec_websocket_key;
proxy_set_header Sec-WebSocket-Version $http_sec_websocket_version;
proxy_set_header Upgrade $http_upgrade;
proxy_set_header Connection "Upgrade";
location / {
proxy_pass http://backend$request_uri;
}
}
3. Test the Nginx configuration for errors.
nginx -t
Output.
nginx: the configuration file /etc/nginx/nginx.conf syntax is ok
nginx: configuration file /etc/nginx/nginx.conf test is successful
4. Restart Nginx to apply the configuration changes.
systemctl restart nginx
Step 5: Access ComfyUI and Generate Images
At this point, ComfyUI is installed and running on your server. You can now generate images using the ComfyUI web interface.
1. Visit the URL http://comfy.example.com using a web browser to access the ComfyUI interface.
2. Navigate to the Prompt node, and enter the prompt "beautiful scenery nature glass bottle landscape, purple galaxy bottle". Also, enter a prompt in the respective node such as "text,watermark". Then, click on Queue to generate a new image.
3. Wait for the image generation process to complete. Your generated image should appear in the Save Image node.
Conclusion
You've successfully deployed ComfyUI on your Atlantic.Net GPU server. With the power of ComfyUI and stable diffusion models, you can now generate high-quality images directly from your web interface.
### How to Extract Tables from Images on an Atlantic.Net GPU Server
Extracting tables from images is a common requirement in data extraction and document processing workflows. With the power of GPU computing and tools like Tesseract OCR and Camelot, we can automate this process effectively.
This guide explains how to set up a Python-based solution on an Ubuntu 22.04 GPU server to extract tables from images.
Prerequisites
Before starting, ensure you have the following:
A GPU-enabled server running Ubuntu 22.04.
Access to an Atlantic.Net GPU server or any other GPU-enabled environment.
NVIDIA Drivers and CUDA Toolkit.
Step 1: Install Python and Required Libraries
Ensure your server has Python and essential libraries installed:
apt install python3 python3-pip imagemagick ghostscript python3.10-venv -y
Here:
imagemagick: For image preprocessing.
ghostscript: For handling PDFs.
python3.10-venv: To create isolated Python environments.
Step 2: Install PyTorch with GPU Support
PyTorch is a popular framework for machine learning and image processing. Installing it with GPU support ensures optimal performance.
pip install torch torchvision torchaudio --index-url https://download.pytorch.org/whl/cu124
Here:
torch, torchvision, and torchaudio are essential PyTorch packages.
The --index-url specifies the CUDA-enabled PyTorch repository for GPU support.
You can verify the installation using:
python3 -c "import torch; print(torch.cuda.is_available())"
This should return True if GPU support is enabled.
Step 3: Install Tesseract OCR
Tesseract is a powerful OCR tool for extracting text from images.
Install Tesseract OCR.
apt install tesseract-ocr libtesseract-dev -y
Verify the installation:
tesseract --version
You should see output similar to:
tesseract 4.1.1
Step 4: Create a Python Virtual Environment
1. Create the project directory structure.
mkdir -p ~/table_extraction_project/{uploads,processed,output,scripts}
2. Create a subdirectory for templates.
mkdir ~/table_extraction_project/scripts/templates
3. Navigate to the project directory.
cd ~/table_extraction_project
4. Create a Python virtual environment.
python3 -m venv venv
5. Activate the virtual environment.
source venv/bin/activate
6. Install required Python dependencies.
pip install flask pytesseract pillow numpy opencv-python camelot-py[cv] pandas
pip install "PyPDF2<3.0.0"
Step 5: Create a Web Interface to Upload Images
1. Create an HTML template file for the upload interface.
nano scripts/templates/index.html
Add the following HTML code.
Table Extraction
Upload an Image
2. Create a Flask backend application.
nano scripts/app.py
Add the following code.
from flask import Flask, request, render_template, send_from_directory
import os
import pytesseract
from PIL import Image
import camelot
app = Flask(__name__)
# Directories
UPLOAD_FOLDER = 'uploads'
PROCESSED_FOLDER = 'processed'
OUTPUT_FOLDER = 'output'
os.makedirs(UPLOAD_FOLDER, exist_ok=True)
os.makedirs(PROCESSED_FOLDER, exist_ok=True)
os.makedirs(OUTPUT_FOLDER, exist_ok=True)
app.config['UPLOAD_FOLDER'] = UPLOAD_FOLDER
@app.route('/')
def index():
return render_template('index.html')
@app.route('/upload', methods=['POST'])
def upload_image():
if 'image' not in request.files:
return "No file uploaded!", 400
file = request.files['image']
if file.filename == '':
return "No selected file!", 400
filepath = os.path.join(app.config['UPLOAD_FOLDER'], file.filename)
file.save(filepath)
# Process image
processed_filepath = process_image(filepath)
table_filepath = extract_table(processed_filepath)
return send_from_directory(OUTPUT_FOLDER, table_filepath, as_attachment=True)
def process_image(filepath):
from PIL import Image
# Load and preprocess image
image = Image.open(filepath)
processed_filepath = os.path.join(PROCESSED_FOLDER, os.path.basename(filepath))
image.save(processed_filepath, dpi=(300, 300)) # Set resolution to 300 DPI
return processed_filepath
def extract_table(filepath):
# Convert image to searchable PDF using Tesseract
pdf_filepath = os.path.join(PROCESSED_FOLDER, os.path.basename(filepath).replace('.jpg', ''))
os.system(f"tesseract {filepath} {pdf_filepath} -l eng pdf")
pdf_filepath += ".pdf" # Tesseract appends ".pdf"
# Check if PDF file was created
if not os.path.exists(pdf_filepath):
raise FileNotFoundError("Tesseract failed to generate the PDF file.")
# Read table from the PDF
tables = camelot.read_pdf(pdf_filepath)
if len(tables) == 0:
raise ValueError("No tables found in the PDF.")
table_filepath = os.path.join(OUTPUT_FOLDER, "extracted_table.csv")
tables[0].to_csv(table_filepath)
return "extracted_table.csv"
if __name__ == '__main__':
app.run(host='0.0.0.0', port=5000)
This Flask app allows users to upload images, processes them into searchable PDFs with Tesseract-OCR, and extracts tables using Camelot, saving results as CSVs for download via a web interface.
Step 6: Run the Flask Application
Your application is now ready. It's time to run and test it.
1. Navigate to the scripts folder.
cd ~/table_extraction_project/scripts
2. Run the Flask app.
python3 app.py
Output.
* Serving Flask app 'app'
* Debug mode: off
WARNING: This is a development server. Do not use it in a production deployment. Use a production WSGI server instead.
* Running on all addresses (0.0.0.0)
* Running on http://127.0.0.1:5000
* Running on http://your-server-ip:5000
Press CTRL+C to quit
Step 7: Upload Images and Extract Tables
1. Open your web browser and access your application using the URL http://your-server-ip:5000.
2. Click on the Upload button and upload a JPG image containing tables. Click on Upload and Extract Table. The server processes the image, extracts the table, and generates a downloadable CSV file.
Conclusion
This guide explains how to set up a GPU-enabled server to extract tables from images. By combining tools like Tesseract, Camelot, and Flask, you can automate table extraction tasks efficiently. This workflow is ideal for businesses or researchers handling large volumes of tabular data in scanned documents.
### How to Install and Use Jupyter Notebook on a Atlantic Cloud GPU Server
Jupyter Notebook is an open-source, interactive computing environment that supports data visualization, analysis, and machine learning workflows. When paired with a GPU-enabled Atlantic.Net server, it allows for accelerated computations, making it an excellent choice for tasks like deep learning and large-scale data processing.
This guide will walk you through setting up and using Jupyter Notebook on a GPU-enabled Atlantic.Net server.
Prerequisites
An Ubuntu 22.04 GPU Server
CUDA Toolkit and cuDNN Installed
A root or sudo privileges
Step 1: Update the Server
To ensure the latest updates and security patches are included, run:
apt update -y
apt upgrade -y
This updates the package repository and upgrades outdated packages.
Step 2: Install Python and Required Packages
Jupyter Notebook is built on Python, and its ecosystem relies on Python libraries for everything from data visualization to machine learning.
Install Python and pip.
apt install python3 python3-pip -y
Check the versions of Python and pip to confirm the installation:
python3 --version
pip3 --version
Install libraries required for machine learning and data analysis:
pip install tensorflow torch matplotlib pandas numpy
These packages include popular frameworks like TensorFlow and PyTorch, along with essential libraries for data manipulation and visualization.
Step 3: Install and Configure Jupyter Notebook Kernel
A kernel is the engine that executes the code in your notebooks. Configuring a kernel ensures it has access to the installed libraries and GPU resources.
Install the ipykernel package.
pip install ipykernel
Create a custom kernel for Jupyter.
python3 -m ipykernel install --user --name=gpu_env --display-name "Python (GPU)"
Output.
Installed kernelspec gpu_env in /root/.local/share/jupyter/kernels/gpu_env
This kernel links your Python environment to Jupyter Notebook, ensuring it recognizes the GPU-enabled libraries.
Step 4: Install Jupyter Notebook
Install Jupyter Notebook using pip.
pip install notebook
Verify the installation by checking its version.
jupyter notebook --version
Output.
7.2.2
Generate a configuration file to enable remote access.
jupyter notebook --generate-config
Edit the generated configuration file to enable access over the network.
nano ~/.jupyter/jupyter_notebook_config.py
Add the following lines:
c.ServerApp.ip = '0.0.0.0'
c.ServerApp.open_browser = False
c.ServerApp.port = 8888
Step 5: Test Jupyter Notebook for GPU Support
Before launching Jupyter Notebook, verify that your GPU is accessible:
Open a Python shell.
python3
Check PyTorch GPU availability.
>>>import torch
>>>print("PyTorch GPU Support:", torch.cuda.is_available())
Output.
PyTorch GPU Support: True
Test TensorFlow GPU support.
>>>import tensorflow as tf
>>>print("TensorFlow GPU Devices:", tf.config.list_physical_devices('GPU'))
Output.
TensorFlow GPU Devices: [PhysicalDevice(name='/physical_device:GPU:0', device_type='GPU')]
These tests confirm that your GPU is ready for computation.
Step 6: Launch Jupyter Notebook
Start Jupyter Notebook on your server with the following command.
jupyter notebook --no-browser --port=8888 --ip=your-server-ip --allow-root
Replace your-server-ip with the server's public IP address. The output will display a URL to access the notebook:
To access the server, open this file in a browser:
file:///root/.local/share/jupyter/runtime/jpserver-8084-open.html
Or copy and paste one of these URLs:
http://45.77.182.191:8888/tree?token=8e99e04461348b61490e1a51559a8be313840260787e7e17
http://127.0.0.1:8888/tree?token=8e99e04461348b61490e1a51559a8be313840260787e7e17
Step 7: Run a PyTorch Model in Jupyter Notebook
Open your web browser and access the Jupyter Notebook using the URL http://your-server-ip:8888/tree?token=8e99e04461348b61490e1a51559a8be313840260787e7e17.
Click on File > New > Notebook. You will be asked to select the Kernel.
Select the "Python (GPU)" kernel and click Select to create a new notebook.
Add the following code to train a simple PyTorch model.
import torch
import torch.nn as nn
import torch.optim as optim
# Check GPU availability
device = torch.device('cuda' if torch.cuda.is_available() else 'cpu')
print(f"Using device: {device}")
# Simple linear model
model = nn.Linear(10, 1).to(device)
print(model)
# Sample data
inputs = torch.randn(100, 10).to(device)
targets = torch.randn(100, 1).to(device)
# Loss and optimizer
criterion = nn.MSELoss()
optimizer = optim.SGD(model.parameters(), lr=0.01)
# Training loop
for epoch in range(5):
optimizer.zero_grad()
outputs = model(inputs)
loss = criterion(outputs, targets)
loss.backward()
optimizer.step()
print(f"Epoch {epoch+1}, Loss: {loss.item()}")
Now, click on the run symbol to run your Notebook. This will print the loss for each epoch, confirming the GPU is being used if device is cuda.
Step 8: Monitor GPU Usage
For the above examples, you can use the nvidia-smi command in the server's terminal to monitor GPU utilization:
nvidia-smi
If the models are correctly using the GPU, you will see GPU memory and utilization metrics updating during training.
Mon Nov 25 08:18:16 2024
+-----------------------------------------------------------------------------------------+
| NVIDIA-SMI 550.90.07 Driver Version: 550.90.07 CUDA Version: 12.4 |
|-----------------------------------------+------------------------+----------------------+
| GPU Name Persistence-M | Bus-Id Disp.A | Volatile Uncorr. ECC |
| Fan Temp Perf Pwr:Usage/Cap | Memory-Usage | GPU-Util Compute M. |
| | | MIG M. |
|=========================================+========================+======================|
| 0 NVIDIA A16-2Q On | 00000000:06:00.0 Off | 0 |
| N/A N/A P0 N/A / N/A | 1398MiB / 2048MiB | 0% Default |
| | | N/A |
+-----------------------------------------+------------------------+----------------------+
+-----------------------------------------------------------------------------------------+
| Processes: |
| GPU GI CI PID Type Process name GPU Memory |
| ID ID Usage |
|=========================================================================================|
| 0 N/A N/A 8257 C /usr/bin/python3 1397MiB |
+-----------------------------------------------------------------------------------------+
Conclusion
By following this guide, you’ve set up a powerful Jupyter Notebook environment on an Atlantic.Net GPU Server. This setup empowers you to perform high-performance data analysis and machine learning tasks with ease. Make sure to explore additional Jupyter features like extensions and plugins to further enhance your productivity.
### Setting Up Your Deep Learning Environment on Atlantic.Net GPU Server
Deep learning has revolutionized industries like healthcare, finance, and gaming by enabling the creation of highly sophisticated models capable of performing complex tasks. These models, however, require immense computational power, and GPUs (Graphics Processing Units) play a critical role in accelerating this process. Atlantic.Net's GPU dedicated servers offer a high-performance GPU infrastructure, making it an ideal platform for deep learning projects.
This guide will walk you through the entire process of setting up a deep learning environment on an Atlantic.Net GPU Server.
Prerequisites
An Ubuntu 22.04 GPU Server
CUDA Toolkit and cuDNN Installed
A root or sudo privileges
Verify NVIDIA GPU
The first step in any GPU-accelerated setup is ensuring that your system detects the GPU. Atlantic.Net GPU server instances come pre-configured with GPU hardware, but verifying its availability is crucial.
lspci | grep -i nvidia
Output.
00:1e.0 3D controller: NVIDIA Corporation GP102 [Tesla P40] (rev a1)
If no GPU is detected, ensure that your server is configured with GPU support.
Install Anaconda
Anaconda is a powerful tool for managing Python environments and packages, which is especially useful in deep learning projects where dependency management is critical.
Visit the official Anaconda Archives Directory to find the latest installer. For this guide, we’ll use a specific version.
wget https://repo.anaconda.com/archive/Anaconda3-2024.10-1-Linux-x86_64.sh
Execute the downloaded script:
bash Anaconda3-2024.10-1-Linux-x86_64.sh
You will be asked the following:
Accept the license agreement by typing yes.
Confirm the installation directory (default is typically /home/your-username/anaconda3).
Allow the installer to initialize Anaconda.
Reload your .bashrc file to enable Anaconda.
source ~/.bashrc
Confirm that Anaconda is correctly installed by checking its version.
conda --version
Output.
conda 24.9.2
Set Up Your Deep Learning Environment
Creating an isolated environment for deep learning ensures that dependencies and libraries do not conflict with other projects.
Create a new conda environment.
conda create -n deep_learning python=3.9
Activate the environment.
conda activate deep_learning
Your terminal prompt should now include (deep_learning), indicating the environment is active.
Install TensorFlow and PyTorch with GPU Support
Leveraging GPU acceleration with TensorFlow and PyTorch drastically improves the speed of training deep learning models.
Install TensorFlow using conda.
conda install -c conda-forge tensorflow
Install the NVIDIA CUDA Toolkit for the Anaconda environment.
conda install -c "nvidia/label/cuda-12.4.1" cuda
Install PyTorch and libraries.
pip install torch torchvision torchaudio --pre -f https://download.pytorch.org/whl/nightly/cu124/torch_nightly.html
This installs the nightly version of PyTorch optimized for CUDA 12.4.
Install additional libraries.
conda install numpy pandas matplotlib
These libraries are useful for:
Data manipulation (numpy, pandas).
Visualization (matplotlib).
Test Your Installation
Now, you will need to ensures that TensorFlow, PyTorch, and GPU acceleration are working as expected.
Start Python using the following command.
python3
In the Python shell, import both tensorflow and torch library.
>>> import tensorflow as tf
>>> import torch
Check the TensorFlow version.
>>> print("TensorFlow version:", tf.__version__)
Output.
TensorFlow version: 2.17.0
Verify the PyTorch version.
>>> print("PyTorch version:", torch.__version__)
Output.
PyTorch version: 2.5.1+cu124
Press CTRL+D to exit from the Python shell.
Check if TensorFlow detects the GPU.
python -c "import tensorflow as tf; print(tf.config.list_physical_devices('GPU'))"
Expected output:
[PhysicalDevice(name='/physical_device:GPU:0', device_type='GPU')]
Conclusion
Congratulations! You have successfully set up a deep learning environment on an Atlantic.Net GPU server. With TensorFlow and PyTorch configured to leverage GPU acceleration, you can now train and deploy complex models efficiently.
Atlantic.Net GPU Server Hosting provides a robust platform for AI and deep learning, empowering you to focus on innovation without worrying about hardware limitations.
### How to Install K3s with NVIDIA GPU Operator on Ubuntu 22.04
K3s is a lightweight Kubernetes distribution designed for simplicity, scalability, and fast deployments. It is perfect for running Kubernetes clusters on resource-constrained environments or edge devices. When combined with the NVIDIA GPU Operator, it unlocks the full potential of GPUs in containerized workloads, allowing developers to run GPU-accelerated applications efficiently.
This guide provides a step-by-step tutorial on installing K3s and configuring it with NVIDIA GPU Operator on Ubuntu 22.04.
Prerequisites
An Ubuntu 22.04 GPU Server
At least 8GB of RAM and 20GB of free disk space (for GPU-accelerated workloads).
A root or sudo privileges
Step 1: Verify GPU Availability
Ensuring that your NVIDIA GPU is detected and operational is a critical first step. This guarantees compatibility with the NVIDIA Container Toolkit and GPU Operator.
nvidia-smi
Output.
Mon Nov 25 04:45:16 2024
+-----------------------------------------------------------------------------------------+
| NVIDIA-SMI 550.90.07 Driver Version: 550.90.07 CUDA Version: 12.4 |
|-----------------------------------------+------------------------+----------------------+
| GPU Name Persistence-M | Bus-Id Disp.A | Volatile Uncorr. ECC |
| Fan Temp Perf Pwr:Usage/Cap | Memory-Usage | GPU-Util Compute M. |
| | | MIG M. |
|=========================================+========================+======================|
| 0 NVIDIA A40-2Q On | 00000000:06:00.0 Off | 0 |
| N/A N/A P0 N/A / N/A | 1MiB / 2048MiB | 0% Default |
| | | N/A |
+-----------------------------------------+------------------------+----------------------+
+-----------------------------------------------------------------------------------------+
| Processes: |
| GPU GI CI PID Type Process name GPU Memory |
| ID ID Usage |
|=========================================================================================|
| No running processes found |
+-----------------------------------------------------------------------------------------+
If no GPU is detected, ensure the GPU is properly installed and powered.
Step 2: Disable Swap
Kubernetes requires swap to be disabled to manage resources efficiently. Swap conflicts with Kubernetes' resource scheduling and can lead to unpredictable behavior.
swapoff -a
To disable swap permanently, edit the /etc/fstab file and comment out the swap entry.
Disabling swap ensures that Kubernetes nodes use actual memory for resource allocation. This improves stability and avoids node taints.
Step 3: Install K3s
K3s is a lightweight Kubernetes distribution, designed for edge devices and development environments. Its streamlined architecture eliminates unnecessary components, making it faster and easier to deploy than traditional Kubernetes.
Run the following command to download and execute the K3s installation script.
curl -sfL https://get.k3s.io | sh -
This command installs containerd as the default container runtime and configures essential services.
Check the status of the K3s service:
systemctl status k3s
Output.
● k3s.service - Lightweight Kubernetes
Loaded: loaded (/etc/systemd/system/k3s.service; enabled; vendor preset: enabled)
Active: active (running) since Mon 2024-11-25 04:46:26 UTC; 33s ago
Docs: https://k3s.io
Process: 9098 ExecStartPre=/bin/sh -xc ! /usr/bin/systemctl is-enabled --quiet nm-cloud-setup.service 2>/dev/null (code=exited, status=0/SUCCESS)
Process: 9100 ExecStartPre=/sbin/modprobe br_netfilter (code=exited, status=0/SUCCESS)
Process: 9101 ExecStartPre=/sbin/modprobe overlay (code=exited, status=0/SUCCESS)
Main PID: 9102 (k3s-server)
Tasks: 86
Memory: 1.3G
CPU: 21.304s
CGroup: /system.slice/k3s.service
├─ 9102 "/usr/local/bin/k3s server"
Export the KUBECONFIG environment variable to access the K3s cluster.
export KUBECONFIG=/etc/rancher/k3s/k3s.yaml
List the nodes in your K3s cluster.
kubectl get nodes
Output.
NAME STATUS ROLES AGE VERSION
ubuntu Ready control-plane,master 83s v1.30.6+k3s1
Step 4: Install NVIDIA Container Toolkit
The NVIDIA Container Toolkit allows containerized applications to access GPU resources. It is a critical component for running GPU workloads in Kubernetes.
Add the NVIDIA repository.
curl -fsSL https://nvidia.github.io/libnvidia-container/gpgkey | gpg --dearmor -o /usr/share/keyrings/nvidia-container-toolkit-keyring.gpg && curl -s -L https://nvidia.github.io/libnvidia-container/stable/deb/nvidia-container-toolkit.list | sed 's#deb https://#deb [signed-by=/usr/share/keyrings/nvidia-container-toolkit-keyring.gpg] https://#g' | tee /etc/apt/sources.list.d/nvidia-container-toolkit.list
Update the repository index.
apt-get update
Install the container toolkit.
apt-get install -y nvidia-container-toolkit
Check the installed version of the NVIDIA Container CLI:
nvidia-container-cli --version
Output.
cli-version: 1.17.2
lib-version: 1.17.2
Configure Docker for GPU support.
nvidia-ctk runtime configure --runtime=docker
Restart Docker to apply the configuration:
systemctl restart docker
Run a container with GPU access to verify the setup:
docker run --rm --gpus all nvidia/cuda:12.6.2-cudnn-runtime-ubuntu22.04 nvidia-smi
Output.
==========
== CUDA ==
==========
CUDA Version 12.6.2
Container image Copyright (c) 2016-2023, NVIDIA CORPORATION & AFFILIATES. All rights reserved.
This container image and its contents are governed by the NVIDIA Deep Learning Container License.
By pulling and using the container, you accept the terms and conditions of this license:
https://developer.nvidia.com/ngc/nvidia-deep-learning-container-license
A copy of this license is made available in this container at /NGC-DL-CONTAINER-LICENSE for your convenience.
Mon Nov 25 04:57:39 2024
+-----------------------------------------------------------------------------------------+
| NVIDIA-SMI 550.90.07 Driver Version: 550.90.07 CUDA Version: 12.6 |
|-----------------------------------------+------------------------+----------------------+
| GPU Name Persistence-M | Bus-Id Disp.A | Volatile Uncorr. ECC |
| Fan Temp Perf Pwr:Usage/Cap | Memory-Usage | GPU-Util Compute M. |
| | | MIG M. |
|=========================================+========================+======================|
| 0 NVIDIA A40-2Q On | 00000000:06:00.0 Off | 0 |
| N/A N/A P0 N/A / N/A | 1MiB / 2048MiB | 0% Default |
| | | N/A |
+-----------------------------------------+------------------------+----------------------+
+-----------------------------------------------------------------------------------------+
| Processes: |
| GPU GI CI PID Type Process name GPU Memory |
| ID ID Usage |
|=========================================================================================|
| No running processes found |
+-----------------------------------------------------------------------------------------+
Step 5: Install Helm
Helm simplifies Kubernetes deployments by managing application packaging and upgrades.
Install Helm using the script below.
curl https://raw.githubusercontent.com/helm/helm/main/scripts/get-helm-3 | bash
Verify the Helm installation.
helm version
Output.
version.BuildInfo{Version:"v3.16.3", GitCommit:"cfd07493f46efc9debd9cc1b02a0961186df7fdf", GitTreeState:"clean", GoVersion:"go1.22.7"}
Step 6: Deploy NVIDIA GPU Operator
The NVIDIA GPU Operator automates the management of NVIDIA GPU drivers, monitoring tools, and runtime in Kubernetes.
Add the NVIDIA Helm repository.
helm repo add nvidia https://nvidia.github.io/gpu-operator
Update the repository.
helm repo update
Install GPU operator.
helm install --wait --generate-name nvidia/gpu-operator
Verify the deployment.
kubectl get pods | grep nvidia
This command will list all NVIDIA-related pods in the cluster:
Please note: it may take some time for the pods to start
nvidia-container-toolkit-daemonset-cl2s5 1/1 Running 0 2m36s
nvidia-cuda-validator-r6pl4 0/1 Evicted 0 2m26s
nvidia-dcgm-exporter-bt8jp 1/1 Running 0 2m35s
nvidia-device-plugin-daemonset-gtgwv 1/1 Running 0 2m35s
nvidia-operator-validator-cbd9z 0/1 Init:2/4 0 2m36s
Ensure that the NVIDIA GPU Operator has configured the nodes correctly.
kubectl describe nodes | grep nvidia
You should see the information about the GPU resources managed by the NVIDIA GPU Operator.
Conclusion
You’ve successfully installed K3s with the NVIDIA GPU Operator on Ubuntu 22.04. This setup allows you to run GPU-accelerated workloads on a lightweight Kubernetes cluster, enabling efficient deployment of machine learning, AI, and other compute-intensive applications. Try to deploy K3s on Atlantic.Net GPU Hosting.
### How to Install NVIDIA cuDNN on Atlantic.Net GPU Server
The NVIDIA CUDA Deep Neural Network library (cuDNN) is a GPU-accelerated library designed to optimize deep learning operations. cuDNN serves as a key component for training and deploying neural networks efficiently on NVIDIA GPUs. It is widely used in frameworks such as TensorFlow, PyTorch, and Caffe to accelerate operations like convolution, pooling, and activation functions.
This guide will help you install and verify cuDNN on an Ubuntu 22.04 GPU server.
Prerequisites
An Ubuntu 22.04 GPU Server
CUDA Toolkit installed
A root or sudo privileges
Step 1: Verify NVIDIA GPU Drivers
Before proceeding with cuDNN installation, verify that your NVIDIA GPU drivers are correctly installed and functioning.
nvidia-smi
This command displays the status of your GPU and driver installation. Example output:
Mon Nov 25 08:18:16 2024
+-----------------------------------------------------------------------------------------+
| NVIDIA-SMI 550.90.07 Driver Version: 550.90.07 CUDA Version: 12.4 |
|-----------------------------------------+------------------------+----------------------+
| GPU Name Persistence-M | Bus-Id Disp.A | Volatile Uncorr. ECC |
| Fan Temp Perf Pwr:Usage/Cap | Memory-Usage | GPU-Util Compute M. |
| | | MIG M. |
|=========================================+========================+======================|
| 0 NVIDIA A16-2Q On | 00000000:06:00.0 Off | 0 |
| N/A N/A P0 N/A / N/A | 1398MiB / 2048MiB | 0% Default |
| | | N/A |
+-----------------------------------------+------------------------+----------------------+
+-----------------------------------------------------------------------------------------+
| Processes: |
| GPU GI CI PID Type Process name GPU Memory |
| ID ID Usage |
|=========================================================================================|
Step 2: Add NVIDIA Package Repository
NVIDIA distributes cuDNN through its package repository. Adding this repository ensures you install the latest and most secure version.
Visit the cuDNN download page and download the NVIDIA keyring with the following command.
wget https://developer.download.nvidia.com/compute/cuda/repos/ubuntu2204/x86_64/cuda-keyring_1.1-1_all.deb
Install the downloaded keyring package using:
dpkg -i cuda-keyring_1.1-1_all.deb
Refresh your system's package list to include NVIDIA's repository:
apt-get update
Adding the repository ensures you’re downloading official, trusted packages directly from NVIDIA, reducing the risk of compatibility issues.
Step 3: Install NVIDIA cuDNN
cuDNN is available in different versions depending on the installed CUDA version. Make sure to choose the correct package.
Install the cuDNN package using the following command.
apt-get -y install cudnn
This command installs the standard cuDNN package, which works with most CUDA installations.
For systems running CUDA 12, install the version-specific cuDNN package:
apt-get -y install cudnn-cuda-12
Step 4: Verify cuDNN Installation
After installation, it’s important to confirm that cuDNN is correctly set up on your system.
Check the installed version of cuDNN by reading the version header file:
cat /usr/include/cudnn_version.h | grep CUDNN_MAJOR -A 2
Output.
#define CUDNN_MAJOR 9
#define CUDNN_MINOR 5
#define CUDNN_PATCHLEVEL 1
--
#define CUDNN_VERSION (CUDNN_MAJOR * 10000 + CUDNN_MINOR * 100 + CUDNN_PATCHLEVEL)
/* cannot use constexpr here since this is a C-only file */
This output confirms the installed version of cuDNN (in this example, 9.5.1). The CUDNN_VERSION macro calculates the complete version number.
Step 5: Verify NVIDIA Drivers (Post Installation)
Re-check your GPU drivers to ensure they are functioning correctly after installing cuDNN:
nvidia-smi
The output should remain consistent with your earlier results, confirming that cuDNN installation did not affect the drivers.
Conclusion
Installing NVIDIA cuDNN on Ubuntu 22.04 empowers your system for efficient GPU-based deep learning tasks. With the steps above, you’ve added the NVIDIA repository, installed cuDNN, and verified its setup. Your system is now ready to accelerate neural network training and inference tasks. Explore the possibilities of cuDNN and take your deep learning workflows to the next level using GPU Hosting from Atlantic.Net.
### How to Install NVIDIA CUDA Toolkit on Atlantic.Net GPU Server
The NVIDIA CUDA Toolkit is a powerful development suite for accelerating computationally intensive applications using the GPU's parallel processing capabilities. CUDA, short for Compute Unified Device Architecture, is a parallel computing platform and programming model developed by NVIDIA. It allows developers to leverage the processing power of NVIDIA GPUs (Graphics Processing Units) to perform general-purpose computing tasks that go beyond graphics rendering.
CUDA is particularly important for high-performance computing, artificial intelligence (AI), machine learning (ML), and deep learning applications. It provides developers with a software environment for writing applications that can run in parallel on thousands of GPU cores, offering significant speed improvements compared to traditional CPU-based computations.
In this guide, we'll show you how to install and setup the NVIDIA CUDA Toolkit on your Atlantic.Net GPU server.
Prerequisites
An Ubuntu 22.04 GPU Server
A root or sudo privileges
Step 1: Update System Packages
Start by updating the system package list to ensure your environment is equipped with the latest updates and patches.
apt update -y
Step 2: Verify Your GPU Compatibility
To confirm that your GPU supports CUDA, run the following command:
lspci | grep -i nvidia
This command lists all NVIDIA GPUs detected by your system. Example output:
06:00.0 VGA compatible controller: NVIDIA Corporation GA102GL [A40] (rev a1)
If the output lists an NVIDIA GPU, your system is CUDA-compatible. If no NVIDIA GPU is listed, update the PCI hardware database and rerun the lspci command:
update-pciids
Step 3: Check GCC Compiler Version
CUDA requires a supported version of the GNU Compiler Collection (GCC). Verify the installed version with:
gcc --version
Example output:
gcc (Ubuntu 11.4.0-1ubuntu1~22.04) 11.4.0
Copyright (C) 2021 Free Software Foundation, Inc.
This is free software; see the source for copying conditions. There is NO
warranty; not even for MERCHANTABILITY or FITNESS FOR A PARTICULAR PURPOSE.
If your GCC version is outdated, install or update it using:
apt install gcc -y
Step 4: Download and Install NVIDIA CUDA Toolkit
Visit the CUDA Toolkit Archive files page and download the NVIDIA CUDA keyring using the below command.
wget https://developer.download.nvidia.com/compute/cuda/repos/ubuntu2204/x86_64/cuda-keyring_1.1-1_all.deb
Install the downloaded package with dpkg command:
dpkg -i cuda-keyring_1.1-1_all.deb
Refresh the package index to recognize NVIDIA's repository:
apt-get update
Install the CUDA Toolkit version 12.6 using:
apt-get -y install cuda-toolkit-12-6
This command downloads and installs the necessary files, including the CUDA compiler, libraries, and tools.
Step 5: Configure Environment Variables
To ensure the CUDA Toolkit functions seamlessly, you will need to update the system environment variables.
Append the CUDA binary directory to the PATH variable:
echo "export PATH=/usr/local/cuda-12.6/bin${PATH:+:${PATH}}" >> ~/.bashrc
Include the CUDA library directory in the LD_LIBRARY_PATH:
echo "export LD_LIBRARY_PATH=/usr/local/cuda-12.6/lib64${LD_LIBRARY_PATH:+:${LD_LIBRARY_PATH}}" >> ~/.bashrc
Activate the updated environment variables:
source ~/.bashrc
By configuring these variables, the system knows where to find CUDA executables and libraries.
Step 6: Verify the Installation
Verify the GPU driver installation using NVIDIA System Management Interface (SMI):
nvidia-smi
Output:
Ensure the NVIDIA CUDA Compiler (NVCC) is installed:
nvcc --version
Output:
nvcc: NVIDIA (R) Cuda compiler driver
Copyright (c) 2005-2024 NVIDIA Corporation
Built on Tue_Oct_29_23:50:19_PDT_2024
Cuda compilation tools, release 12.6, V12.6.85
Build cuda_12.6.r12.6/compiler.35059454_0
Step 7: Test CUDA Installation with Sample Programs
Download sample CUDA programs for testing the installation.
git clone https://github.com/NVIDIA/cuda-samples.git
Switch to the directory containing the deviceQuery sample:
cd cuda-samples/Samples/1_Utilities/deviceQuery
Build the deviceQuery program:
make
Execute the deviceQuery program to test CUDA functionality:
./deviceQuery
If the program runs successfully, your CUDA installation is complete.
Conclusion
Installing the NVIDIA CUDA Toolkit on an Atlantic.Net GPU server enables you to harness the power of GPU computing for complex applications. With this guide, you’ve verified your GPU compatibility, installed the CUDA Toolkit, configured environment variables, and tested the setup with sample programs. You're now ready to develop and run CUDA-accelerated applications. Dive into Atlantic.Net's GPU server hosting options and explore the possibilities CUDA offers!
### How to Use curl with a Specific Interface
The curl command is one of the most widely used tools for data transfers in Linux. It supports various protocols, including HTTP, FTP, and SMTP. By default, curl will use the system's default network interface to make requests. However, there are scenarios where you may want to specify a particular interface for outgoing connections, such as when you have multiple network interfaces or VPN connections.
In this guide, we'll discuss how to use curl with a specific interface.
Understanding Network Interfaces
A network interface in Linux represents a connection point for data communication between the operating system and a physical or virtual network. Examples of network interfaces are:
eth0: The default Ethernet connection.
wlan0: The wireless network adapter.
tun0: VPN tunnel interfaces.
When you have multiple active interfaces, you might want to control which interface curl uses for its requests.
Basic Usage of curl with --interface
The --interface option allows you to use a specific network interface for the request. The syntax is:
curl --interface interface_name url
interface_name: This can be an interface name (e.g., eth0), an IP address, or a hostname.
url: The URL you wish to access.
Example:
curl --interface eth0 https://example.com
In this example, curl will use the eth0 network interface to access https://example.com.
Specifying an IP Address
Instead of specifying the interface name, you can use an IP address assigned to the interface. This method is beneficial if you have multiple IP addresses and want to control which one curl uses for outgoing requests.
Example:
curl --interface 192.168.1.10 https://example.com
Here, 192.168.1.10 is the IP address of the network interface you want to use.
Using a VPN Interface
When connected to a VPN, the virtual network interface is usually named something like tun0 or ppp0. You can specify that interface to ensure that all requests go through the VPN.
Example:
curl --interface tun0 https://example.com
This forces curl to use the VPN connection (tun0) instead of the default network interface.
Verifying the Interface Used
To verify that curl is using the specified interface, you can use tcpdump or Wireshark to monitor traffic.
Example with tcpdump:
tcpdump -i eth0
Run this command to observe all packets on the eth0 interface.
If curl is correctly using eth0, you will see the HTTP request packets in the output.
Advanced Options for curl
If you want to specify whether to use IPv4 or IPv6, you can combine the --interface option with -4 or -6.
curl -4 --interface eth0 https://example.com
Example:
curl -v --interface eth0 https://example.com
Conclusion
The curl command in Linux is a powerful utility for interacting with URLs from the command line. By using the --interface option, you can easily specify which network interface or IP address to use. This method is very useful when working with multiple connections or testing network configurations. Master using curl with a specific network interface on Atlantic.Net’s dedicated server hosting for optimized connectivity!
### How to Use the Linux chage Command Guide with Examples
The chage command in Linux is used to manage password aging for user accounts. It allows system administrators to enforce password expiration policies, making it a vital tool for maintaining system security.
This guide will walk you through the basics of using chage with practical examples to help you manage user accounts effectively.
Understanding Password Aging
Password aging allows administrators to set rules about how often users must change their passwords. This helps enhance system security by reducing the chances of compromised accounts due to outdated credentials. The chage command is used to manage the aging policies.
The syntax of the chage command is:
chage [options] username
Where:
username: Specifies the name of the user for whom you want to manage password settings.
options allow you to control various aspects like password expiration, warning periods, and inactivity.
Checking User Password Aging Information
You can use chage without any options to view the current password aging information for a user.
chage -l username
Output:
Last password change : Aug 20, 2024
Password expires : Nov 18, 2024
Password inactive : never
Account expires : never
Minimum number of days between password change : 0
Maximum number of days between password change : 90
Number of days of warning before password expires : 7
The -l (list) flag shows password information like last password change, account expiration, and password expiry dates.
Setting Password Expiration
The -M option is used to set the maximum number of days a password remains valid. After this period, users are forced to change their password.
chage -M 60 username
This sets the maximum password validity to 60 days. Users will be required to change their passwords every 60 days.
Setting Minimum Days Between Password Changes
You can use the -m option to set the minimum number of days between password changes.
chage -m 7 username
This sets a minimum of 7 days between password changes.
Setting a Password Expiry Warning Period
The -W option sets the number of days before password expiration when the user will start receiving warnings.
chage -W 10 username
Users will receive a warning to change their password starting 10 days before it expires.
Setting an Account Expiration Date
The -E option is used to set an account expiration date, after which the account is disabled.
chage -E 2024-12-31 username
After December 31, 2024, the user account will expire, preventing the user from logging in.
Making Password Inactive After Expiry
The -I option sets the number of days after a password has expired before the account becomes inactive.
chage -I 30 username
The account will become inactive 30 days after the password has expired if the user does not update their password.
Setting All Password Aging Options at Once
You can use the -M, -m, -W, -I, and -E options together to fully configure the password aging policy for a user.
chage -M 90 -m 10 -W 7 -I 15 -E 2024-12-31 username
This command sets up a comprehensive password policy as shown below:
Maximum validity: 90 days
Minimum days between changes: 10 days
Warning period: 7 days
Account becomes inactive: 15 days after password expiry
Account expires on: December 31, 2024
Conclusion
The chage command is an essential tool for managing password policies on Linux. It allows system administrators to enforce security practices and ensure users regularly update their credentials. The powerful Linux chage command can manage user password policies on Atlantic.Net’s dedicated servers.
### Advantages of GPU Dedicated Hosting
Finding the right foundation for your company's advanced computing tasks is essential. Cloud-hosted servers offer a range of capabilities that can be tailored to address virtually any unique business requirements. Organizations performing computationally intensive tasks such as machine learning can benefit from the high-performance computing potential of dedicated GPU servers. GPU dedicated servers offer computational power for high-performance computing tasks not available in traditional CPU-based servers.
Traditional servers rely on the processing power of a central processing unit (CPU). A CPU is a general-purpose processor designed for computing tasks focused on sequential processing. Advanced and fast CPUs are exceptional at performing certain types of data processing tasks. CPUs are not as effective when asked to engage in the types of parallel processing tasks necessary to support advanced scientific research, machine learning, or complex video rendering.
GPU servers support technologies that require additional computational capabilities or parallel processing power. GPUs are essential in supporting emerging artificial intelligence and virtual reality solutions that promise to transform how we live, work, and spend our leisure time. Traditional computing solutions do not provide the power or functionality demanded by these new technologies.
Hosting dedicated GPU servers in the cloud offers companies of any size a chance to implement GPU servers to handle complex tasks beyond the capabilities of their CPU-based systems. An organization does not need to absorb the costs of implementing GPU servers in an onsite data center. We will look at the technical advantages of GPU dedicated servers and the business benefits of attaining their enhanced performance with a cloud hosting solution.
What Are GPU Dedicated Servers?
A dedicated GPU server is a powerful computing machine with one or more graphics processing units (GPUs). The GPUs act as the primary processing units for enhanced performance when handling certain complex tasks. Adding a graphics processing unit enables GPU servers to support high-performance workloads like video rendering, data analytics, machine learning, and artificial intelligence.
A dedicated server indicates that the server's computing resources are provisioned exclusively for one client. A dedicated computing platform offers enhanced control and security over a shared hosting solution.
Benefits of GPU Servers
GPU servers offer several benefits over traditional CPU-based servers. These advantages make a GPU dedicated server the best choice for applications requiring high-performance computing capabilities.
Graphics processing units
The main distinguishing characteristic of GPU dedicated servers is that they contain at least one dedicated graphics processing unit to supplement their central processing units (CPUs). The GPUs provide additional computing resources making the servers more efficient at performing complex computational tasks such as training machine learning algorithms.
GPU cores
High-performance GPUs obtain their immense computational power from specialized GPU cores. GPU cores differ from those equipped in traditional CPU-based systems and can be deployed in large numbers to deliver parallel processing and high-performance computing capabilities. Advanced GPUs may utilize thousands of cores for enhanced performance metrics.
GPU cores can handle multiple tasks simultaneously and manage numerous threads to support concurrent operations. Cores are optimized to enhance performance on computationally intensive tasks such as video rendering or teaching machine learning models. Efficiency is promoted by sharing resources such as cache memory.
GPUs are typically designed using the following types of cores.
CUDA Cores: Compute Unified Device Architecture (CUDA) cores are specialized cores that provide high parallelism and memory bandwidth to support parallelized algorithms.
Tensor Cores: These specialized cores dynamically adapt calculations to accelerate throughput while maintaining accuracy and enhanced security to support AI and high-performance computing.
RT Cores: Ray tracing (RT) cores accelerate the mathematical calculations necessary for efficient ray tracing for realistic image rendering.
Sparsity Cores: These cores are specialized Tensor Cores that accelerate and optimize matrix computations to enable faster neural network processing.
Parallel processing capabilities
A major advantage of GPU servers is their parallel processing capabilities. A GPU server relies on several components besides specialized cores to deliver its immense computational power.
Video RAM (VRAM): VRAM is specialized memory that provides faster data transfer. GPUs also leverage cache memory to store frequently used data and improve processing speed.
Framebuffer: The GPU's framebuffer streamlines rendering graphics by storing finished images before they are displayed. The framebuffer is essential for producing smooth graphics in games and virtual reality applications.
Advanced cooling systems: GPUs produce excessive heat and require additional measures to cool the processor. Lack of cooling negatively impacts the performance capabilities of GPU servers.
Usage Scenarios for GPU Dedicated Servers
Based on the benefits of GPU dedicated servers previously discussed, we can identify multiple usage scenarios where the use of GPU servers results in significant performance improvements. In many cases, traditional, CPU-based servers cannot provide the enhanced performance and advanced computational resources necessary to efficiently address these use cases.
Video processing
GPUs are designed to streamline video processing tasks such as graphics rendering. Leveraging the power of multiple, specialized cores provides enhanced speed when a GPU server performs functions such as displaying graphics. High-speed video rendering delivers smoother displays essential for effective virtual reality presentations. GPUs are essential for addressing the advanced computing requirements of scientific research and modeling complex simulations. They are also essential for delivering smooth and consistent animations required by gaming platforms.
Analyzing large datasets
The parallel processing capabilities of GPU servers make them efficient at analyzing large datasets. Data analytics and big data require the real-time processing of large volumes of information. Big data applications like fraud detection, financial analysis, and customer sentiment analysis rely on the ability to efficiently process large datasets. GPU servers also speed up the production of visualizations that make the results of data analysis more accessible to a larger audience.
Training machine learning models
Machine learning (ML) is a discipline within artificial intelligence that has become a cornerstone of many emerging applications and technical solutions. Machine learning applications automate processes for productive gains throughout an organization. The effectiveness of ML tools is directly influenced by the training they receive.
ML models can be trained using several different methods. Supervised learning is done by example. An operator presents the model with datasets containing known inputs and outputs. The model is trained to observe and predict outcomes when new data is presented.
Unsupervised learning trains a model without the intervention of a human operator. Reinforcement learning is another option that teaches the model through trial and error.
The parallel processing capabilities of GPU dedicated servers make them an excellent choice for training ML models. The computational power of GPU servers is much more efficient at ML training tasks than traditional servers.
Deep learning
Deep learning requires the efficient data analysis of even larger volumes of information than machine learning. Large language models (LLMs) are usually used when training deep learning models. Artificial neural networks are the building blocks of deep learning systems. The processing power of a GPU server is essential to successfully train deep learning applications.
Deep learning systems have many business and societal applications. Popular programs like ChatGPT leverage natural language processing (NLP) to interact seamlessly with users. The technology behind smart cities is based on deep learning models that can perform tasks like managing traffic or conducting surveillance.
Complex mathematical calculations
Organizations performing complex mathematical calculations across any field can benefit from the enhanced processing power of GPU servers. GPU dedicated servers work more efficiently with floating-point mathematics and provide substantially improved performance compared to CPU-based systems. Many organizations leverage the mathematical capabilities of GPUs.
Scientific research and simulations
GPU servers are instrumental in conducting scientific research and producing simulations to study complex systems and reactions. The following examples demonstrate the types of research facilitated by GPU-dedicated systems.
Bioinformatics: Large datasets must be processed for DNA sequencing and other biological simulations.
Climate modeling: The complex mathematical calculations required by weather forecasting and climate modeling can be accelerated by employing GPU servers.
Physics: GPU servers' parallel processing ability facilitates presenting simulations of complex physical processes like quantum mechanics and fluid dynamics.
Computer vision
Computer vision has many applications in multiple disciplines. Real-time and accurate computer vision is imperative for self-driving vehicles and autonomous robots. Facial recognition software also relies on computer vision to identify specific individuals.
Graphics processing units provide the computing resources necessary to support effective computer vision. GPU dedicated servers can handle the intensive graphical processing required to artificially replicate human vision.
Medical imagery and healthcare
GPU servers are often deployed for real-time medical imaging and MRI processing to provide fast and accurate diagnosis. GPU servers are also widely used in the pharmaceutical industry to run simulations related to discovering new drugs and treatment options. GPU speed and accuracy are essential factors in developing vaccines to address viruses that mutate quickly.
Crypto-mining and transaction validation
Complex mathematical calculations are required for activities like crypto-mining and validating blockchain transactions. GPU servers' high-performance computing capabilities support these processor-intensive processes. GPU dedicated servers perform the complex calculations and data analysis required for these activities more efficiently than CPU-based servers.
Business Advantages of GPU Dedicated Hosting
Companies benefitting from parallel computing capabilities or performing intensive computational tasks can leverage Atlantic Net's GPU dedicated server hosting offerings. Businesses can enjoy multiple advantages by utilizing GPU servers from a cloud service provider (CSP).
Cost savings
Using hosted GPU dedicated servers offers companies a cost-effective solution to obtaining the processing power for complex workloads without a significant upfront investment. GPU servers cost more than traditional servers and may not be suitable for some of an organization's more common computing tasks. GPU use is typically reserved for the usage scenarios discussed above.
Eliminating the need to purchase specialized hardware results in substantial savings and allows smaller companies with limited budgets to access advanced computational resources. This levels the playing field in today's competitive business landscape and fosters the development of new and innovative products and services.
Scalability and flexibility
Obtaining the computational power of GPU servers from a CSP gives customers a scalable and flexible platform to address business requirements and objectives. As business needs evolve, the CSP can provide any necessary additional resources without additional capital expenditures by the client.
Scaling up and down to align with customer trends or demand fluctuations can save significant financial resources while optimizing performance. Cloud hosting eliminates concerns regarding the over or under-provisioning computing resources through dynamic scalability.
Configuration control
A dedicated GPU server gives the client more control over server configuration. This allows them to tailor the GPU server to address unique business requirements more efficiently. No concessions need to be made to meet the needs of other clients.
For example, parameters such as memory bandwidth can be configured to enhance system performance for specific usage scenarios. Clients can customize a dedicated server without being concerned about how it will affect other tenants of a shared server. This allows for optimization that typically results in improved productivity.
Enhanced security
A dedicated hosting solution provides resources to a single client. Isolating a company's data processing furnishes improved security by eliminating the possibility of the system being impacted by threat actors exploiting the ineffective security of other server tenants. Clients can implement cybersecurity measures to protect their computing environment, sensitive data, and applications.
Reliable resource availability
GPU dedicated servers provide more consistent overall system performance compared to shared servers. Sharing a server can result in fluctuating resource availability as the demands of other tenants are addressed. Utilizing a dedicated GPU server guarantees that resources are always available to efficiently process data and run applications.
Host Your GPU Dedicated Server with Atlantic Net
Atlantic.net offers customers Next-Gen Dedicated GPU Servers accelerated by NVIDIA to handle the parallel processing and complex computations required by the most demanding business or scientific application. We offer systems built around two different NVIDIA GPUs to address your unique computing requirements.
NVIDIA L40S GPU: The NVIDIA L40S GPU provides customers with multi-workload performance leveraging powerful AI computing ability with best-in-class graphics and media acceleration. The GPU is designed to address the needs of next-generation workloads like medical imaging, training generative AI with LLMs, and graphics rendering.
NVIDIA H100 NVL: This platform is highly optimized for LLM inferences. It combines high compute density and memory bandwidth with energy efficiency provided by its unique NKLink architecture. The GPU delivers exceptional acceleration, allowing it to power complex simulations, artificial intelligence, and high-performance computing applications.
Talk to Atlantic.net's GPU dedicated hosting experts and give your machine learning and complex, high-performance computing tasks the proper foundation.
### Why Is the Default Stack Size Huge in Linux?
The stack is an important component in the Linux operating system. It holds local variables, manages function calls, and stores temporary data during program execution. In Linux, the default stack size is often much larger than necessary for most applications.
This article explains why the default stack size is so large, its importance, and ways to manage it effectively.
Understanding the Stack in Linux
The stack in Linux is a part of memory that a program uses to store information temporarily.
This includes local variables, function arguments, and return addresses.
It grows dynamically as the program runs.
The stack follows a Last-In-First-Out (LIFO) structure, meaning the last item added is the first removed.
Programs need the stack for function calls and recursive operations. Insufficient stack space can cause a program to crash due to a stack overflow.
What Is the Default Stack Size?
In many Linux systems, the default stack size is 8 MB per thread. You can check the default stack size using the ulimit command:
ulimit -s
The output will typically show 8192 (kilobytes), indicating 8 MB. 8 MB is large for many applications, especially for simple programs or threads requiring minimal local storage.
Why Is the Default Stack Size Large?
There are several reasons why Linux provides a large default stack size:
Handling Deep Recursion: Some programs, especially those in scientific computing or complex algorithms, require deep recursion. Each recursive function call adds data to the stack. A large stack size ensures these programs can run without hitting a stack overflow.
Flexibility for Developers: By setting a large stack size by default, Linux gives developers flexibility. Programs with complex operations or large local variables don’t need extra configuration to run smoothly.
Stability in Multithreaded Applications: Multithreaded applications often require significant stack space. Each thread has its stack, and the default 8 MB helps prevent crashes due to insufficient stack space when running multiple threads simultaneously.
Benefits of a Large Stack Size
While it may seem wasteful, a large default stack size has advantages:
Reduces Stack Overflow Risk: Many crashes in software are due to stack overflows. With a large default stack, these risks are minimized.
Simplifies Development: Developers don’t need to adjust stack size for each program. They can assume that Linux provides enough memory for most use cases.
Supports Complex Software: Programs that involve deep function calls or complex data structures require a large stack. The default stack size ensures that these programs run without extra configuration.
Drawbacks of a Large Stack Size
Despite its benefits, a large stack size isn’t always ideal. Here are some drawbacks:
Wasted Memory: Each thread reserves 8 MB of stack space, even if it doesn’t use all of it. In programs with many threads, this can lead to significant wasted memory.
Resource Limitation: For low-memory systems, a large default stack size can limit the number of threads. Each 8 MB stack occupies valuable memory, which could otherwise support additional threads.
How to Adjust the Stack Size
Linux allows users to adjust the stack size as needed. Here are common ways to manage stack size:
1. Using limit
The ulimit command adjusts the stack size for a shell session.
ulimit -s [size_in_kilobytes]
Example: To set the stack size to 4 MB, use:
ulimit -s 4096
2. Setting Stack Size in C/C++ Programs
For multithreaded programs in C or C++, use the pthread_attr_setstacksize function to control stack size for individual threads.
pthread_attr_t attr;
pthread_attr_init(&attr);
pthread_attr_setstacksize(&attr, 1024 * 1024); // 1 MB stack size
3. Modifying System-Wide Stack Size
Adjust the system-wide stack size in /etc/security/limits.conf. This affects all users.
* soft stack 4096
* hard stack 4096
Default Stack Size in Other Systems
Different operating systems have varying default stack sizes:
Windows: 1 MB by default, configurable with linker options.
macOS: Uses 512 KB for threads by default.
Linux’s larger default stack size aligns with its flexibility for running diverse applications and supporting deep recursion.
Conclusion
The default stack size in Linux may seem large, but it ensures reliability across a range of applications. While it can lead to memory waste, the benefits of stability and flexibility often outweigh the drawbacks. Developers and administrators can adjust stack sizes to optimize memory use, especially on systems with limited resources. Discover why Linux stack sizes matter on Atlantic.Net’s dedicated servers and how they optimize your applications!.
### How to Use the Linux sftp Command Guide with Examples
SFTP, or Secure File Transfer Protocol, is a network protocol that allows secure file access, transfer, and management over an encrypted SSH connection. SFTP is commonly used to transfer files between servers securely, often to or from a Linux server. It combines the ease of FTP with the security of SSH, making it suitable for use in environments that require encryption.
In this guide, we'll explore how to use the sftp command effectively with practical examples.
Connecting to a Remote Server
To connect to a remote server using sftp, you can use the following command:
sftp user@remote_server_ip
For example:
sftp john@192.168.1.10
After entering the command, you'll be prompted for the user's password. Once authenticated, you will see the sftp> prompt, indicating that you have successfully connected.
Basic Commands in sftp
When connected via sftp, you can use various commands to navigate and manipulate files, similar to the commands used in a regular shell.
1. Listing Files
To list the files and directories in the current directory on the remote server, use:
ls
You can also use lls to list files in your local working directory:
lls
2. Changing Directories
To change the current directory on the remote server:
cd /path/to/directory
To change the directory on the local system:
lcd /path/to/local/directory
3. Uploading Files
To upload a file from your local system to the remote server, use the put command:
put local_file.txt /remote/directory
For example:
put document.txt /home/john/documents
4. Downloading Files
To download a file from the remote server to your local system, use the get command:
get /remote/directory/file.txt
For example:
get /home/john/documents/report.pdf
5. Uploading/Downloading Directories
To recursively upload a directory:
put -r local_directory /remote/directory
To download a remote directory recursively:
get -r /remote/directory local_directory
6. Renaming Files
To rename a file on the remote server:
rename old_name.txt new_name.txt
7. Deleting Files
To delete a file on the remote server:
rm /path/to/file.txt
Checking Remote Directory
To display the current remote working directory:
pwd
To display the current local working directory:
lpwd
Creating and Removing Directories
To create a new directory on the remote server:
mkdir /path/to/new_directory
To remove a directory on the remote server:
rmdir /path/to/directory
Using sftp in Batch Mode
If you need to automate file transfers, you can use sftp in batch mode by providing a file containing a list of commands.
Create a batch file, commands.txt, with the following content:
lcd /local/directory
cd /remote/directory
put file1.txt
get file2.txt
Then run sftp in batch mode:
sftp -b commands.txt user@remote_server_ip
This allows you to automate repetitive file transfer tasks without manually typing each command.
Using sftp in Non-Interactive Mode
To run sftp non-interactively, echo commands to sftp or use here documents. This is particularly useful for integrating sftp commands into scripts.
Example with here document:
sftp user@hostname <> /var/log/prelogin.log
/path/to/your_command.sh
exit 0
Enable and start the rc-local service.
systemctl enable rc-local
systemctl start rc-local
Note: This method runs commands at boot, making it suitable for tasks that need to start before the login screen is visible, but it does not run every time a user logs in.
Configuring PAM (Pluggable Authentication Modules)
PAM modules provide a way to execute scripts when users authenticate, which can be useful for security policies or performing actions specific to the user before full access is granted.
The PAM configuration files are located in /etc/pam.d/. Depending on the type of login, choose the appropriate file.
For SSH logins, edit /etc/pam.d/sshd:
nano /etc/pam.d/sshd
For local logins, edit /etc/pam.d/login:
nano /etc/pam.d/login
To run your script before login, add the following line to the appropriate file:
auth required pam_exec.so /path/to/your_command.sh
You can also add logging within your script to track login attempts:
#!/bin/bash
echo "User $PAM_USER attempted login at $(date)" >> /var/log/prelogin_pam.log
Creating a Pre-Login Systemd Service
systemd offers precise control over when and how services are executed. You can create a systemd service that runs before the display manager starts, ensuring the command executes prior to any graphical login prompt.
Navigate to /etc/systemd/system/ and create a new service file:
nano /etc/systemd/system/prelogin.service
Add the following configuration to the service file:
[Unit]
Description=Run Pre-Login Script
Before=display-manager.service
[Service]
Type=oneshot
ExecStart=/path/to/your_command.sh
[Install]
WantedBy=multi-user.target
Enable the service to ensure it runs during every boot:
systemctl enable prelogin.service
systemctl start prelogin.service
Use the following command to verify that the service ran successfully:
systemctl status prelogin.service
Running Commands with /etc/profile and /etc/profile.d/
The /etc/profile file and the /etc/profile.d/ directory allows you to run commands when a user session starts. This is more suited for customizing the user environment and runs once the user logs in.
Edit /etc/profile and add commands directly to /etc/profile to make them run at every session start:
nano /etc/profile
Add the following line:
echo "Session started for user $USER at $(date)" >> /var/log/session_start.log
Alternatively, you can create a script in /etc/profile.d/ to achieve similar behavior:
nano /etc/profile.d/prelogin_script.sh
Add your commands to the script:
#!/bin/bash
echo "Running session initialization for $USER" >> /var/log/session_script.log
Note: This method is effective for running commands that configure user environments after login, rather than before authentication.
Using Cron Jobs for Boot-Time Execution
cron jobs can be used to execute commands at system boot. The @reboot cron keyword allows for simple boot-time scripts, though these run alongside other startup tasks and do not necessarily need to be done before login.
Open the crontab editor:
crontab -e
Add the following line to run a script at every system boot:
@reboot /path/to/your_command.sh
Log messages from your script can help you verify its execution:
echo "Boot script executed at $(date)" >> /var/log/boot_script.log
Conclusion
Running commands before user login can be essential for configuring the environment, initializing services, or setting up security measures. Each method offers unique benefits and is suitable for different scenarios, so select the approach that best matches your system's requirements and the specific tasks you wish to perform. Ready to optimize your server environment? Explore Atlantic.Net's dedicated server hosting options today!
### How to Compare ZIP Files in Linux Shell
When managing compressed files in Linux, it is common to compare two ZIP files to verify their contents or identify differences. Linux provides several shell tools to assist in comparing ZIP files without needing to extract them.
In this guide, you will learn how to effectively compare ZIP files using different methods in the Linux shell.
Method 1: Extract and Use diff
The easiest way to compare ZIP files is to extract them and then use the diff command.
Step 1: Extract the ZIP files.
unzip file1.zip -d file1_dir
unzip file2.zip -d file2_dir
The -d option allows you to specify the directory where files will be extracted.
Step 2: Use diff to compare the extracted directories.
diff -r file1_dir file2_dir
The -r flag makes diff compare directories recursively.
This approach provides a line-by-line comparison of the differences between files in the ZIP archives.
Method 2: Using diff with unzip -l
You can also compare ZIP files without extracting their contents. This method uses unzip -l to list the contents and then diff to compare them.
Step 1: List the contents of each ZIP file.
unzip -l file1.zip > file1_contents.txt
unzip -l file2.zip > file2_contents.txt
unzip -l lists the file names, sizes, and modification times.
Step 2: Use diff to compare the file lists.
diff file1_contents.txt file2_contents.txt
This command will show differences in file names, sizes, or timestamps between the two ZIP archives.
Method 3: Using cmp for Byte-Level Comparison
If you need a byte-level comparison between two ZIP files, you can use the cmp command. This compares the raw contents of the ZIP files directly.
cmp file1.zip file2.zip
If cmp finds differences, it will output the location of the first differing byte.
If there are no differences, cmp produces no output.
Method 4: Compare Using 7z
Another powerful tool for ZIP file comparison is 7z, part of the p7zip package.
Step 1: Install p7zip if not already installed.
apt-get install p7zip-full
Step 2: Use 7z to list contents and compare.
7z l file1.zip > file1_list.txt
7z l file2.zip > file2_list.txt
diff file1_list.txt file2_list.txt
The 7z l command lists the contents of the ZIP archive.
Then, use diff to compare the lists.
Method 5: Using vbindiff for Visual Comparison
For a visual comparison of two ZIP files, you can use vbindiff.
Step 1: Install vbindiff.
apt-get install vbindiff
Step 2: Use vbindiff to compare files.
vbindiff file1.zip file2.zip
vbindiff provides a visual, byte-by-byte comparison. This can be helpful when you need to see exactly where differences occur.
Method 6: Using bsdiff
If you need to create a binary patch to represent differences between two ZIP files, you can use bsdiff.
Step 1: Install bsdiff.
apt-get install bsdiff
Step 2: Create a binary patch.
bsdiff file1.zip file2.zip patch_file.bsdiff
This creates a patch file that can represent the changes between two ZIP files. It’s useful for version control of large binary files.
Conclusion
Comparing ZIP files in Linux is not as straightforward as comparing regular text files, but it can be easily done with the right tools. Whether you choose to extract and compare using diff, leverage a visual tool like vbindiff, or automate the process with a script, Linux provides versatile solutions for different needs. Compare ZIP files on Atlantic.Net’s dedicated server hosting with Linux shell commands!
### How to Create a Weaviate Vector Database, Import Data, and Search on the Atlantic.Net Cloud Platform: A Step-by-Step Guide
This guide outlines the process of setting up and connecting to a local Weaviate instance from an Atlantic.Net Cloud server using Docker for containerization and Ollama for the embedding and generative models.
Weaviate is an open-source vector database that enables searches based on similarity. It is popular with Retrieval Augmented Generation (RAG).
Prerequisites
An active Atlantic.Net account with a deployed cloud instance
We recommend selecting a cloud instance with ample resources (at least 8GB RAM, preferably 16GB or more) to accommodate Weaviate and the language models.
SSH access to your cloud server.
Part 1: Prepare the Cloud Platform Environment
Step 1 - Update Ubuntu
Update System Packages:
sudo apt update && sudo apt upgrade -y
Step 2 - Install Docker
Install Docker:
Install the following packages to allow apt to use a repository over HTTPS:
sudo apt install -y ca-certificates curl gnupg lsb-release
Add Docker's Official GPG Key
Download and add Docker's official GPG key:
sudo mkdir -p /etc/apt/keyrings
curl -fsSL https://download.docker.com/linux/ubuntu/gpg | sudo gpg --dearmor -o /etc/apt/keyrings/docker.gpg
Set Up the Docker Repository
Add the Docker repository to APT sources:
echo "deb [arch=$(dpkg --print-architecture) signed-by=/etc/apt/keyrings/docker.gpg] https://download.docker.com/linux/ubuntu $(lsb_release -cs) stable" | sudo tee /etc/apt/sources.list.d/docker.list > /dev/null
Update the Package List Again
Update the package list to include Docker packages from the new repository:
sudo apt update -y
Install Docker Engine
Install the latest version of Docker Engine, containerd, and Docker Compose:
sudo apt install -y docker-ce docker-ce-cli containerd.io docker-compose-plugin
Verify the Installation
Check that Docker is installed correctly by running the hello-world image:
sudo docker run hello-world
You should see output like this:
root@Weaviate:~# sudo docker run hello-world
Unable to find image 'hello-world:latest' locally
latest: Pulling from library/hello-world
c1ec31eb5944: Pull complete
Digest: sha256:d211f485f2dd1dee407a80973c8f129f00d54604d2c90732e8e320e5038a0348
Status: Downloaded newer image for hello-world:latest
Hello from Docker!
This message shows that your installation appears to be working correctly. 1. The Docker client contacted the Docker daemon.
2. The Docker daemon pulled the "hello-world" image from the Docker Hub.
(amd64)
To generate this message, Docker took the following steps:
3. The Docker daemon created a new container from that image which runs the
executable that produces the output you are currently reading.
4. The Docker daemon streamed that output to the Docker client, which sent it
to your terminal.
To try something more ambitious, you can run an Ubuntu container with:
$ docker run -it ubuntu bash
Share images, automate workflows, and more with a free Docker ID:
https://hub.docker.com/
For more examples and ideas, visit:
https://docs.docker.com/get-started/
root@Weaviate:~#
Add Your User to the docker Group (Optional)
To run Docker commands without sudo, add your user to the docker group:
sudo usermod -aG docker $USER
Step 3 - Set Up Weaviate in Docker
Weaviate works very well within a Docker environment. We will us Docker Compose to create the Weaviate Database.
Create docker-compose.yml
nano docker-compose.yml
Use the Provided docker-compose.yml Content (Source: Weaviate Website)
---
services:
weaviate:
command:
- --host
- 0.0.0.0
- --port
- '8080'
- --scheme
- http
image: cr.weaviate.io/semitechnologies/weaviate:1.27.2
ports:
- 8080:8080
- 50051:50051
volumes:
- weaviate_data:/var/lib/weaviate
restart: on-failure:0
environment:
QUERY_DEFAULTS_LIMIT: 25
AUTHENTICATION_ANONYMOUS_ACCESS_ENABLED: 'true'
PERSISTENCE_DATA_PATH: '/var/lib/weaviate'
DEFAULT_VECTORIZER_MODULE: 'none'
ENABLE_API_BASED_MODULES: 'true'
CLUSTER_HOSTNAME: 'node1'
ENABLE_API_BASED_MODULES: 'true'
volumes:
weaviate_data:
...
Start Weaviate
Now start Weaviate using the docker-compose up detached command.
docker compose up -d
You will see output like this:
root@Weaviate:~# docker compose up -d
[+] Running 8/8
✔ weaviate Pulled 7.0s
✔ 43c4264eed91 Pull complete 0.8s
✔ 45d7c130d6ea Pull complete 1.0s
✔ db001b655dd0 Pull complete 3.3s
✔ 1eb7452f9739 Pull complete 3.3s
✔ 2777e559ecf5 Pull complete 4.0s
✔ add3a9abe015 Pull complete 4.3s
✔ 088f4f300a62 Pull complete 4.3s
[+] Running 3/3
✔ Network root_default Created 0.1s
✔ Volume "root_weaviate_data" C... 0.0s
✔ Container root-weaviate-1 Sta... 0.7s
root@Weaviate:~#
Step 4 - Install Ollama
Now, let's install Ollama, a powerful open-source large language model. It is a requirement of Weaviate. This is a self-installable script.
curl -fsSL https://ollama.ai/install.sh | bash
Ollama is a large application that will take a few minutes to download and install.
You should see output like this:
root@Weaviate:~# curl -fsSL https://ollama.ai/install.sh | bash
>>> Installing ollama to /usr/local
>>> Downloading Linux amd64 bundle
##########################################################
100.0%
>>> Creating ollama user...
>>> Adding ollama user to render group...
>>> Adding ollama user to video group...
>>> Adding current user to ollama group...
>>> Creating ollama systemd service...
>>> Enabling and starting ollama service...
Created symlink /etc/systemd/system/default.target.wants/ollama.service → /etc/systemd/system/ollama.service.
>>> The Ollama API is now available at 127.0.0.1:11434.
>>> Install complete. Run "ollama" from the command line.
WARNING: No NVIDIA/AMD GPU detected. Ollama will run in CPU-only mode.
Download Ollama Models
Now we need to download Ollama language models. These are open-source pre-trained LLMs.
First, pull nomic-embed-text
ollama pull nomic-embed-text
You should see output like this:
root@Weaviate:~# ollama pull nomic-embed-text
pulling manifest
pulling 970aa74c0a90... 100% ▕████████▏ 274 MB
pulling c71d239df917... 100% ▕████████▏ 11 KB
pulling ce4a164fc046... 100% ▕████████▏ 17 B
pulling 31df23ea7daa... 100% ▕████████▏ 420 B
verifying sha256 digest
writing manifest
success
root@Weaviate:~#
Next pull llama3.2. Note that this file is over 2GB and will take a while to download and install.
ollama pull llama3.2
You should see output like this:
root@Weaviate:~# ollama pull llama3.2
pulling manifest
pulling dde5aa3fc5ff... 100% ▕████████▏ 2.0 GB
pulling 966de95ca8a6... 100% ▕████████▏ 1.4 KB
pulling fcc5a6bec9da... 100% ▕████████▏ 7.7 KB
pulling a70ff7e570d9... 100% ▕████████▏ 6.0 KB
pulling 56bb8bd477a5... 100% ▕████████▏ 96 B
pulling 34bb5ab01051... 100% ▕████████▏ 561 B
verifying sha256 digest
writing manifest
success
Part 2 - Install Python & Jupyter Notebooks
There are several ways you can use Weaviate, but you must use it with an SDK. This procedure will follow the steps to use Python, but please be aware that Weaviate supports Java and NodeJS if that is your preferred SDK.
Step 1 – Install Python
Jupyter Lab requires Python. You can install it using the following commands:
apt install python3 python3-pip -y
Note: You may be prompted to restart services after installation. Just click .
Next, install the Python virtual environment package.
pip install -U virtualenv
Step 2 – Install Jupyter Lab
Now, install Jupyter Lab using the pip command.
pip3 install jupyterlab
This command installs Jupyter Lab and its dependencies. Next, edit the .bashrc file.
nano ~/.bashrc
Define your Jupyter Lab path as shown below; simply add it to the bottom of the file:
export PATH=$PATH:~/.local/bin/
Reload the changes using the following command.
source ~/.bashrc
Next, test run the Jupyter Lab locally using the following command to make sure everything starts.
jupyter lab --allow-root --ip=0.0.0.0 --no-browser
Check the output to make sure there are no errors. Upon success, you will see the following output.
[C 2023-12-05 15:09:31.378 ServerApp] To access the server, open this file in a browser:
http://ubuntu:8888/lab?token=aa67d76764b56c5558d876e56709be27446
http://127.0.0.1:8888/lab?token=aa67d76764b56c5558d876e56709be27446
Press the CTRL+C to stop the server.
Step 3 – Configure Jupyter Lab
By default, Jupyter Lab doesn’t require a password to access the web interface. To secure Jupyter Lab, generate the Jupyter Lab configuration using the following command.
jupyter-lab --generate-config
Output.
Writing default config to: /root/.jupyter/jupyter_lab_config.py
Next, set the Jupyter Lab password.
jupyter-lab password
Set your password as shown below:
Enter password:
Verify password:
[JupyterPasswordApp] Wrote hashed password to /root/.jupyter/jupyter_server_config.json
You can verify your hashed password using the following command.
cat /root/.jupyter/jupyter_server_config.json
Output.
{
"IdentityProvider": {
"hashed_password": "argon2:$argon2id$v=19$m=10240,t=10,p=8$zf0ZE2UkNLJK39l8dfdgHA$0qIAAnKiX1EgzFBbo4yp8TgX/G5GrEsV29yjHVUDHiQ"
}
}
Note this inano /root/.jupyter/jupyter_lab_config.pynformation, as you will need to add it to your config.
Next, edit the Jupyter Lab configuration file.
Define your server IP, hashed password, and other configurations as shown below:
c.ServerApp.ip = 'your-server-ip'
c.ServerApp.open_browser = False
c.ServerApp.password = 'argon2:$argon2id$v=19$m=10240,t=10,p=8$zf0ZE2UkNLJK39l8dfdgHA$0qIAAnKiX1EgzFBbo4yp8TgX/G5GrEsV29yjHVUDHiQ'
c.ServerApp.port = 8888
Make sure you format the file exactly as above. For example, the port number is not in brackets, and the False boolean must have a capital F.
Save and close the file when you are done.
Step 4 – Create a Systemctl Service File
Next, create a systemd service file to manage Jupyter Lab.
nano /etc/systemd/system/jupyter-lab.service
Add the following configuration:
[Service]
Type=simple
PIDFile=/run/jupyter.pid
WorkingDirectory=/root/
ExecStart=/usr/local/bin/jupyter lab --config=/root/.jupyter/jupyter_lab_config.py --allow-root
User=root
Group=root
Restart=always
RestartSec=10
[Install]
WantedBy=multi-user.target
Save and close the file, then reload the systemd daemon.
systemctl daemon-reload
Next, start the Jupyter Lab service using the following command.
systemctl start jupyter-lab
You can now check the status of the Jupyter Lab service using the following command.
systemctl status jupyter-lab
Jupyter Lab is now starting and listening on port 8888. You can verify it with the following command.
ss -antpl | grep jupyter
Output.
LISTEN 0 128 104.219.55.40:8888 0.0.0.0:* users:(("jupyter-lab",pid=156299,fd=6))
Step 5 – Access Jupyter Lab
Now, open your web browser and access the Jupyter Lab web interface using the URL http://your-server-ip:8888. You will see Jupyter Lab on the following screen:
Provide the password you set during the installation and click on Log in. You will see the Jupyter Lab dashboard on the following screen:
Step 6 - Start the Python3 Notebook
You can now start the Python 3 Notebook and move on Part 3.
Part 3 - Configure Weaviate
Step 1: Install Weaviate Client Library
Choose Your Preferred Language
Weaviate offers client libraries in Python, JavaScript/TypeScript, Go, and Java.
Install the Weaviate Client Library
This can be done from either the command line or directly from the Jupyter Notebook. For ease, I recommend using the Jupyter Notebook.
pip install -U weaviate-client
Install Required Modules
pip install pandas
pip install tqdm
Now test if your Python client can connect to Weaviate.
import weaviate
from weaviate.classes.init import AdditionalConfig, Timeout
client = weaviate.connect_to_local(
port=8080,
grpc_port=50051,
additional_config=AdditionalConfig(
timeout=Timeout(init=30, query=60, insert=120) # Values in seconds
)
)
print(client.is_ready())
You should get this output:
True
You can pull the server's metadata with this command:
import json
metainfo = client.get_meta()
print(json.dumps(metainfo, indent=2))
You should see output like this:
{
"hostname": "http://[::]:8080",
"modules": {
"generative-openai": {
"documentationHref": "https://platform.openai.com/docs/api-reference/completions",
"name": "Generative Search - OpenAI"
},
"qna-openai": {
"documentationHref": "https://platform.openai.com/docs/api-reference/completions",
"name": "OpenAI Question & Answering Module"
},
"ref2vec-centroid": {},
"reranker-cohere": {
"documentationHref": "https://txt.cohere.com/rerank/",
"name": "Reranker - Cohere"
},
"text2vec-cohere": {
"documentationHref": "https://docs.cohere.ai/embedding-wiki/",
"name": "Cohere Module"
},
"text2vec-huggingface": {
"documentationHref": "https://huggingface.co/docs/api-inference/detailed_parameters#feature-extraction-task",
"name": "Hugging Face Module"
},
"text2vec-openai": {
"documentationHref": "https://platform.openai.com/docs/guides/embeddings/what-are-embeddings",
"name": "OpenAI Module"
}
},
"version": "1.23.13"
}
Step 2 - Create some data in Weaviate
Create a Collection
import weaviate
import weaviate.classes.config as wc
import os
client.collections.create(
name="Movie",
properties=[
wc.Property(name="title", data_type=wc.DataType.TEXT),
wc.Property(name="overview", data_type=wc.DataType.TEXT),
wc.Property(name="vote_average", data_type=wc.DataType.NUMBER),
wc.Property(name="genre_ids", data_type=wc.DataType.INT_ARRAY),
wc.Property(name="release_date", data_type=wc.DataType.DATE),
wc.Property(name="tmdb_id", data_type=wc.DataType.INT),
],
# Define the vectorizer module
vectorizer_config=wc.Configure.Vectorizer.text2vec_openai(),
# Define the generative module
generative_config=wc.Configure.Generative.openai()
)
If successful you will see output like this:
Import Data
We are going to impact a free opensource movie database called TMDB.
import weaviate
import pandas as pd
import requests
from datetime import datetime, timezone
import json
from weaviate.util import generate_uuid5
from tqdm import tqdm
import os
data_url = "https://raw.githubusercontent.com/weaviate-tutorials/edu-datasets/main/movies_data_1990_2024.json"
resp = requests.get(data_url)
df = pd.DataFrame(resp.json())
# Get the collection
movies = client.collections.get("Movies")
# Enter context manager
with movies.batch.dynamic() as batch:
# Loop through the data
for i, movie in tqdm(df.iterrows()):
# Convert data types
# Convert a JSON date to `datetime` and add time zone information
release_date = datetime.strptime(movie["release_date"], "%Y-%m-%d").replace(
tzinfo=timezone.utc
)
# Convert a JSON array to a list of integers
genre_ids = json.loads(movie["genre_ids"])
# Build the object payload
movie_obj = {
"title": movie["title"],
"overview": movie["overview"],
"vote_average": movie["vote_average"],
"genre_ids": genre_ids,
"release_date": release_date,
"tmdb_id": movie["id"],
}
# Add object to batch queue
batch.add_object(
properties=movie_obj,
uuid=generate_uuid5(movie["id"])
# references=reference_obj # You can add references here
)
# Batcher automatically sends batches
# Check for failed objects
if len(movies.batch.failed_objects) > 0:
print(f"Failed to import {len(movies.batch.failed_objects)} objects")
Upon completion, you will get an output like this:
680it [00:05, 135.25it/s]
Conclusion
To recap, now that we have imported the data into the Weaviate vector database, we can search and use the data. At this point, I recommend you consult Weaviate's documentation to explore all the different ways you can query the data.
By following this guide, you've successfully set up Weaviate on your Atlantic.Net Cloud Platform. You can now explore the powerful features of Weaviate and build your own RAG applications. Remember to refer to the official Weaviate documentation for more advanced use cases and configuration options.
### What Is VPS: 2025 Buyer’s Guide and Expert Tips
What Is a VPS?
A virtual private server (VPS) combines the best aspects of shared and dedicated hosting. It operates as a separate server within a larger system, offering users a dedicated portion of resources in a virtual environment. This setup provides more control and higher performance compared to shared hosting, as each VPS functions independently.
In essence, VPS hosting provides a private server environment without the cost of a full dedicated server, making it a cost-effective solution for growing businesses.
VPS hosting uses virtualization technology to split a single physical server into multiple virtual ones. Each VPS instance has its own operating system, storage, and bandwidth capabilities. This separation ensures users can customize and manage their environments independently. VPS servers offer performance that can handle higher traffic loads and complex applications.
A VPS operates using a hypervisor, a software layer that sits between the physical server's hardware and the virtual environments. The hypervisor divides the physical server's resources, such as CPU, RAM, and storage, into isolated units, each of which becomes a separate virtual server. These virtual servers, or VPS instances, run their own operating systems and function independently from one another.
Each VPS has dedicated resources, which ensures that the performance of one VPS is not affected by the activities of others on the same physical server. This isolation is one of the main advantages of VPS hosting compared to shared hosting, where resources are shared among multiple users and can lead to performance bottlenecks.
Users of a VPS have full control over the configuration of their server environment. They can install custom software, configure security settings, and choose their operating system. This level of control is similar to what you'd get with a dedicated server, but at a lower cost, since the physical hardware is still shared among several VPS instances.
This is part of an extensive series of guides about compliance management.
Key Use Cases of VPS Hosting
VPS hosting offers a flexible and scalable solution for various business needs, providing dedicated resources and enhanced control at a lower cost than dedicated servers. Below are some of the key use cases where VPS hosting is particularly beneficial.
Hosting websites and applications: VPS hosting is ideal for websites that have outgrown shared hosting but do not require a full dedicated server. With dedicated resources and greater control, businesses can ensure faster load times and better performance, especially during traffic spikes. This makes VPS hosting a popular choice for e-commerce sites, media-rich websites, and applications that need reliable uptime and security.
Running custom software: For businesses or developers who need to run specialized applications or scripts that are not supported by shared hosting, a VPS offers the flexibility to install and manage custom software. This is particularly useful for industries with specific software needs, such as financial services or healthcare, where unique configurations are required.
Testing and development environments: VPS hosting is often used to create isolated environments for development and testing. Developers can use a VPS to run multiple instances of different operating systems or configurations, allowing them to test software or websites under various conditions without affecting the production environment.
Email servers: Running a private email server on a VPS offers greater control over security and performance compared to using third-party email services. This is particularly important for businesses that need to ensure data privacy or comply with specific regulations related to email communication.
Backup and disaster recovery: VPS hosting is also commonly used as a backup solution. Businesses can store critical data on a VPS as part of a disaster recovery plan, ensuring that data is securely stored and easily retrievable in the event of hardware failure or data corruption.
VPS Hosting vs. Other Types of Hosting
Shared Hosting
Shared hosting is an entry-level offering where multiple websites reside on a single server. This means resources like RAM and CPU are shared among all sites. While cost-effective, performance can suffer due to resource limitations, especially if neighboring sites experience high traffic. Each site has limited control over server configurations, making it less suitable for sites requiring custom setups or advanced security measures.
Despite these drawbacks, shared hosting remains popular for beginners or small sites with low traffic expectations, offering a simple, affordable hosting solution. Additionally, since the host manages server maintenance and updates, it is suitable for users who lack the time or expertise to manage technical aspects of their website.
Learn more in our detailed guide to VPS hosting vs shared hosting
Dedicated Hosting
Dedicated hosting provides an entire server for a single user's exclusive use, ensuring maximum control and resource availability. This type of hosting is suitable for large enterprises or high-traffic sites requiring performance and customization capabilities. Users can optimize the server to their specific needs, installing custom software and implementing stringent security protocols.
While dedicated hosting offers power and flexibility, it comes with a higher cost. Users are responsible for server maintenance and management unless they opt for managed services, which incurs additional fees.
Learn more in our detailed guide to VPS vs dedicated server
Cloud Hosting
Cloud hosting involves multiple servers working in tandem to host websites. This configuration offers flexibility and scalability, as resources can be adjusted according to demand. Cloud hosting ensures high reliability by distributing data across several servers, ensuring availability even if one server fails.
Users benefit from pay-as-you-go pricing, making it cost-effective for handling variable traffic loads. Cloud hosting is ideal for businesses that experience seasonal traffic spikes or need disaster recovery solutions.
Types of VPS Hosting
There are three primary types of VPS hosting: managed, unmanaged, and semi-managed.
Managed VPS Hosting
Managed VPS hosting provides support where the hosting provider handles server management tasks, including maintenance, updates, and security patches. This service allows users to focus on their core business activities rather than technical server management. Managed VPS hosting is ideal for those lacking technical expertise or time to manage server-side responsibilities.
Users benefit from expert support, enhancing server reliability and performance. Providers often include monitoring services, ensuring prompt resolution of issues before they impact the business. While this service often comes with a higher price tag than unmanaged options, the peace of mind and professional expertise provided can be invaluable for businesses prioritizing uptime and stability.
Unmanaged VPS Hosting
Unmanaged VPS hosting offers users full control over their server, including all technical aspects. This type of hosting is more affordable, appealing to businesses with a budget or those with in-house technical expertise capable of managing server tasks. Users are responsible for server setup, maintenance, security, and updates.
This hosting demands a deeper technical understanding, as users must resolve issues independently. However, it offers the flexibility to implement specialized configurations and optimizations. For experienced users or businesses with dedicated IT teams, unmanaged VPS can be a cost-effective and tailored solution, although it requires a hands-on approach for successful management.
Semi-Managed VPS Hosting
Semi-managed VPS hosting strikes a balance between managed and unmanaged services. Providers offer basic server management, often covering critical updates, monitoring, and initial setup, while users handle application-level management. This approach delivers a compromise allowing cost savings while mitigating the burden of full server management.
Businesses benefit from provider support for complex infrastructure tasks while maintaining control over their applications. This model is ideal for organizations wanting a blend of professional assistance and personal server management.
When Should You Upgrade to VPS Hosting?
Here are a few considerations for website owners currently running on shared hosting and considering an upgrade to VPS.
High Traffic Volume
High-traffic websites often face issues on shared hosting due to resource limitations. VPS hosting can handle increased traffic by allocating dedicated resources, ensuring consistent performance and reliability. When web traffic begins exceeding the capabilities of shared environments, upgrading to a VPS becomes essential to maintain user satisfaction and operational efficiency.
Need for Customization
Customization needs arise when standard hosting options cannot meet specific software or configuration requirements. VPS hosting offers flexibility and control, enabling users to tailor servers to their exact specifications, install custom applications, and run specialized software. Users gain root access, allowing comprehensive management and configuration freedom.
Security Concerns
Enhanced security requirements often prompt a switch to VPS hosting. In shared environments, the risk of security breaches is higher due to resource sharing. VPS hosting offers isolated environments, significantly reducing vulnerability to attacks from neighboring users. Businesses dealing with sensitive data or requiring robust security measures benefit greatly from VPS hosting.
Performance Issues
Performance issues, characterized by slow load times and server crashes, often necessitate a move to VPS hosting. Shared hosting may bottleneck resources, unable to sustain the computational demands of growing websites. VPS hosting allocates dedicated resources, enabling better performance even under heavy load conditions.
Choosing the Right VPS Hosting Plan
Here are some of the important options you’ll need to choose from when deciding on a VPS hosting plan.
Operating System Options
Choosing a suitable operating system (OS) for VPS hosting depends on application requirements and user familiarity. Common OS options include Linux and Windows, each offering distinct advantages. Linux is praised for its stability, security, and cost-effectiveness, making it popular among tech-savvy users and businesses running open-source technologies.
Windows VPS hosting, integrating seamlessly with Microsoft products, is suitable for those reliant on specific Windows applications. Understanding the OS's compatibility with current applications and required support level is crucial in deciding.
Resource Allocation (CPU, RAM, Storage)
Evaluating CPU, RAM, and storage allocations is vital when choosing a VPS plan. Adequate CPU ensures that applications run smoothly without bottlenecks, while sufficient RAM supports multiple processes and faster data handling. Storage should match current and anticipated data needs, scalable to accommodate growth.
It's essential to assess typical workload demands and resource consumption patterns to choose a configuration that won't restrict business operations. Under-provisioning can lead to performance degradation, while over-provisioning may increase costs unnecessarily.
Reliability and Uptime Guarantees
Uptime guarantees are critical for ensuring service continuity. Most providers commit to uptime percentages, and it’s vital to choose one offering at least 99.9% uptime to minimize disruption risks. High uptime guarantees ensure website accessibility and operational stability, crucial for maintaining customer trust and satisfaction.
Reliability also encompasses the provider's infrastructure, redundancy technologies, and disaster recovery capabilities. By selecting a hosting provider with reliability measures and solid uptime commitments, businesses can mitigate risks associated with downtime, directly protecting revenue and enhancing user experiences through consistent site availability.
Customer Support
Customer support quality is crucial when selecting a VPS hosting plan. Prompt, reliable support can resolve technical issues quickly, minimizing downtime and impact on business. Opt for providers with 24/7 support, available through multiple channels like chat, email, and phone, ensuring accessibility when needed most.
Consider support inclusions such as technical assistance, planned maintenance updates, and security audits. Reliable support can mean the difference between swift recovery and extended outages. Evaluating customer feedback and support responsiveness can offer insights into prospective providers, guiding your decision towards a hosting plan that supports your operational success.
Pricing Considerations
Pricing is an important factor in VPS plan selection. Evaluate cost against features and services offered to determine value. Ensure the plan includes essential features and support that justify its cost. Consider both initial prices and renewal rates, as these may vary significantly between providers.
Transparent pricing structures without hidden fees provide better budgeting predictability. Assess the scalability of plans to accommodate business growth, thus avoiding excessive costs from switching providers later. Carefully considering pricing relative to business needs and performance requirements can guide effective decision-making, balancing affordability with desired service levels.
Expert Tips for Successfully Managing a VPS
1. Regular Security Updates
Consistently applying security updates is essential to protect VPS environments from vulnerabilities and cyberattacks. Regular updates to the operating system and installed software prevent exploitations due to known security flaws. Keeping software up-to-date is a proactive measure for securing data and operations.
Automating updates can help ensure timely application, reducing manual oversight. Regular security audits further enhance protection by identifying potential weaknesses before they are exploited.
2. Monitoring and Performance Optimization
Implementing robust monitoring tools allows for real-time tracking of server performance and resource utilization. Performance optimization involves adjusting resources like CPU and RAM based on usage patterns to prevent bottlenecks.
Monitoring helps identify and address issues swiftly, ensuring server operations run smoothly. Leveraging performance data to optimize configurations can enhance efficiency and response times.
3. Backup and Recovery Strategies
Regular backups and effective recovery plans are vital for data protection and business continuity. Implement automated backup solutions to ensure data is routinely saved, minimizing the risk of loss due to hardware failures or cyber threats. Backups should include all critical data and configurations for comprehensive recovery.
Designing and regularly testing recovery strategies ensure data can be restored swiftly, minimizing downtime. These strategies should include processes for different failure scenarios to enhance resilience.
4. Scalability Planning
Scalability planning ensures the VPS can adjust to growing business demands. Implementing a plan involves forecasting future resource needs based on current usage trends and potential growth spurts. It's crucial to choose a VPS plan that offers easy scaling options to support seamless expansion without service interruption.
Regularly reviewing resource usage helps anticipate when to scale up resources like CPU, RAM, and storage. Planning for scalability ensures that performance remains consistent as demands increase, supporting a seamless user experience.
5. Compliance and Regulations
Managing a VPS requires adherence to industry compliance standards and regulations relevant to your business, such as GDPR or HIPAA. Ensure data handling practices comply with legal and regulatory requirements to protect against penalties and breaches. Regular audits and documentation policies support compliance efforts.
Opt for hosting providers offering compliance support, including encryption services and secure data centers. Providers often include compliance-friendly features tailored to industries with strict data regulations.
VPS Hosting in the Cloud with Atlantic.net
VPS Hosting from Atlantic.Net gives you the freedom to create and deploy one or many virtual servers in seconds. By combining the most advanced VPS hosting innovations and resources available, the Atlantic.Net Cloud offers simplicity, security, scalability, and reliability that will not only improve your virtual private server performance but also reduce your costs.
With Atlantic.Net, you get the full suite of Cloud VPS hosting services: compute, redundant storage platforms, One-Click Apps, DNS, private networking, Onsite Backups, Offsite Backups, Secure Block Storage, and more, all backed by 24x7 support and a full range of managed services your business needs to succeed.
Learn more about Atlantic.net VPS Hosting
See Additional Guides on Key Compliance Management Topics
Together with our content partners, we have authored in-depth guides on several other topics that can also be useful as you explore the world of compliance management.
HIPAA Compliant Hosting
Authored by Atlantic.Net
[Guide] HIPAA-Compliant Hosting | 2025 Award Winning HIPAA Hosting
[Guide] What is Protected Health Information (PHI) in 2025? Atlantic.Net
[Blog] RTLS and Healthcare
[Product] Atlantic.Net HIPAA Compliant Hosting
PCI Compliant Hosting
Authored by Atlantic.Net
[Guide] PCI Hosting Solutions | 12-Point PCI-Compliant Hosting Checklist
[Guide] PCI DSS Cybersecurity Requirements: A Practical Guide
[Blog] How to Reduce Your PCI Scope When Accepting Payments
[Product] Atlantic.Net HIPAA Compliant Hosting
GDPR Compliance
Authored by Exabeam
[Guide] GDPR Compliance: A Practical Guide
[Guide] GDPR Fines Structure and the Biggest GDPR Fines to Date
[Whitepaper] 2024 State of the Security Team Research
[Product] Exabeam | AI-Driven Security Operations
### API Security in a HIPAA Compliant Environment
What Is API Security?
API security is the practice of protecting application programming interfaces (APIs) from cyber threats. APIs serve as the backbone for many web applications and services, and ensuring their security is vital. They allow applications to communicate with each other and exchange data, which makes them susceptible to unauthorized access, data theft, and manipulation. Cybersecurity measures for APIs aim to safeguard against these vulnerabilities through authentication, encryption, and continuous monitoring.
API security is particularly crucial in industries like healthcare, where APIs handle sensitive data such as personal health information. Ensuring secure communication between APIs prevents data breaches. Implementing API security measures involves understanding potential threats, deploying technologies like OAuth and TLS, and adhering to regulatory requirements such as HIPAA in the healthcare sector.
Common API Security Threats in Healthcare
Unauthorized Access
Unauthorized access in healthcare APIs refers to the ability of malicious actors to access systems or data without permission. This threat arises when APIs are not properly secured, allowing hackers to exploit vulnerabilities and gain entry to sensitive data. Often, this is due to weak authentication mechanisms or improper API key management.
To combat unauthorized access, healthcare organizations must implement strong authentication protocols and employ least privilege access. Regular audits of access logs can detect unusual activities, and API gateways can restrict access to only authorized users. By doing so, healthcare providers can ensure that patient information remains confidential and secure.
Man-in-the-Middle Attacks
Man-in-the-middle (MITM) attacks occur when an attacker intercepts the communication between two systems. In healthcare, this can lead to the compromise of sensitive patient data transmitted through APIs. Typically, MITM attacks exploit unsecured connections, allowing attackers to eavesdrop and modify data.
To protect against MITM attacks, healthcare APIs should use transport layer security (TLS) to encrypt data in transit. Implementing digital certificates and mutual TLS can further authenticate parties involved in communication. These measures help ensure that data remains confidential and unaltered during transmission.
Injection Attacks
Injection attacks occur when an attacker sends malicious code to an API, which then executes the code within an application. This threat is significant in healthcare when APIs process user inputs without proper validation, leading to data leaks and system compromises.
Preventing injection attacks requires input validation and sanitization of user data before processing. Employing prepared statements and parameterized queries can significantly reduce this risk. Regular code reviews and employing web application firewalls (WAFs) can also detect and block suspicious activities, thereby ensuring API resilience.
Data Leakage and Loss
Data leakage and loss involve unauthorized exposure or removal of sensitive data from an API. In healthcare, such breaches can have severe implications, compromising patient privacy and incurring legal penalties. Often, they result from misconfigured APIs or inadequate access controls.
Ensuring proper API configuration and implementing data protection policies can mitigate this risk. Encrypting data at rest and during transmission, regular security audits, and continuous monitoring can help detect and prevent unauthorized data access. Protecting against data leakage is crucial for maintaining the integrity and confidentiality of patient information.
What Is HIPAA?
HIPAA, or the Health Insurance Portability and Accountability Act, is a U.S. law designed to protect sensitive patient health information from being disclosed without consent. It mandates standards for safeguarding medical data, impacting how healthcare providers, insurers, and other entities handle patient information. HIPAA requires the implementation of secure electronic access and ensures the confidentiality and integrity of health data.
The law encompasses a set of rules and regulations, including the Privacy Rule, Security Rule, and Breach Notification Rule. Each addresses different aspects of data protection and privacy. The Security Rule, in particular, outlines administrative, physical, and technical safeguards required to secure electronic protected health information (ePHI). Compliance with HIPAA is critical for avoiding significant financial penalties.
HIPAA-Specific API Security Requirements
Access Control
Access control is a foundational requirement for HIPAA compliance, ensuring only authorized personnel have access to patient data. This involves implementing user authentication mechanisms such as usernames, passwords, and two-factor authentication to verify identity. Proper access control mitigates risks of unauthorized access and ensures data integrity.
Role-based access control (RBAC) further enhances security by providing permissions based on user roles. This approach minimizes risks by limiting data access to what's necessary for a specific role. Regular audits and reviews of access permissions help identify and address potential breaches promptly, assisting in maintaining compliance with HIPAA regulations.
Encryption for Data at Rest and in Transit
HIPAA requires encryption to safeguard ePHI, both at rest and in transit. Encryption ensures that data remains unintelligible to unauthorized users. For data at rest, it involves securing databases and storage systems. At transit, it involves using protocols like TLS for secure data communication.
Encrypting APIs that handle ePHI prevents unauthorized access or data leaks during data transmission or in storage. This measure is crucial for protecting patient data against interception and breaches, thereby helping healthcare organizations meet HIPAA standards.
API Logging and Monitoring
API logging and monitoring involve recording API activities to detect and respond to suspicious activities swiftly. Under HIPAA, tracking access logs and maintaining audit trails are crucial for ensuring accountability and detecting unauthorized activities. Effective logging captures relevant data such as user IDs, timestamps, and access points.
Continuous monitoring helps in real-time identification of anomalies or security breaches. Implementing automated alert systems can ensure immediate response to incident detection. Together, logging and monitoring strengthen the security posture of healthcare APIs, aid in compliance, and protect sensitive patient information.
Ensuring Data Integrity During API Communication
Data integrity ensures that information remains accurate and unaltered during API communications. In healthcare, maintaining the integrity of patient data is vital for compliance with HIPAA regulations. Integrity can be compromised through tampering or corruption, necessitating security measures.
Implementing cryptographic hash functions and message authentication codes (MACs) can detect unauthorized changes in data. Regular integrity checks and data validation processes are crucial for maintaining accurate and reliable health information, ensuring that healthcare providers comply with HIPAA.
API Security Best Practices for HIPAA Compliance
OAuth 2.0 and OpenID Connect for Securing API Access
OAuth 2.0 and OpenID Connect offer frameworks for secure API access by enabling third-party applications to access APIs on behalf of a user. OAuth 2.0 enables secure, token-based access, minimizing the risk of exposing user credentials. OpenID Connect adds an identity layer to OAuth 2.0, providing user authentication.
Both protocols help healthcare organizations implement secure single sign-on (SSO) solutions, facilitating streamlined access management. These frameworks also allow healthcare APIs to handle user identity in a secure, compliant manner, essential for protecting sensitive health information and maintaining HIPAA compliance.
Rate Limiting and Throttling
Rate limiting and throttling manage the number of API requests a user can make within a certain timeframe. These practices prevent abuse and ensure fair resource allocation. In healthcare, applying rate limits protects APIs from denial-of-service (DoS) attacks while ensuring legitimate access.
Throttling adjusts the speed at which user requests are processed, maintaining API performance. Healthcare providers can implement these measures to protect APIs from being overwhelmed by excessive requests. Through careful configuration, they enhance API stability and comply with HIPAA requirements.
Limiting API Responses to Necessary Fields
Limiting API responses to necessary fields involves configuring APIs to only return data essential for a given request. This reduces the risk of exposing sensitive information inadvertently. In healthcare, defining strict data policies ensures that APIs only share relevant patient information, aligning with HIPAA regulations.
Implementing techniques like 'selective fields' in API calls can filter out unnecessary data. Regular reviews of API structures and response outputs help maintain minimal data exposure, helping protect patient privacy and secure sensitive health information.
Use of API Gateways for Centralized Management of Security Policies
API gateways serve as a single entry point for enforcing security policies across APIs. They provide centralized security logging, access control, and traffic management. In healthcare, using API gateways ensures consistent application of security measures, critical for complying with HIPAA.
Gateways can also enable threat detection and policy enforcement, reducing the risk of unauthorized access. They streamline monitoring and can integrate with security tools for enhanced protection. This centralized approach helps healthcare providers efficiently manage security and maintain regulatory compliance.
Automated Threat Detection
Automated threat detection leverages machine learning and AI to identify suspicious activities in real-time. These systems monitor API traffic patterns to detect anomalies, often a sign of potential security threats. In healthcare, automation aids in swift threat identification and response, protecting sensitive data.
Integrating automated threat detection into API security frameworks enhances responsiveness. Healthcare organizations can use this technology to identify breaches early, mitigate risks, and adhere to HIPAA requirements. Continuous improvements in detection algorithms ensure adaptive security over time.
Conclusion
API security is crucial for protecting sensitive healthcare data, ensuring compliance with regulations like HIPAA, and maintaining the integrity of healthcare systems. By understanding common security threats, such as unauthorized access and injection attacks, healthcare organizations can implement targeted measures to mitigate risks. Technologies like encryption, OAuth 2.0, and API gateways provide layers of protection, while best practices such as rate limiting and limiting API responses ensure APIs handle data securely.
An API security strategy involves continuous monitoring, automated threat detection, and regular security assessments to stay ahead of evolving cyber threats. Ultimately, safeguarding healthcare APIs is not just about regulatory compliance—it’s about protecting patient privacy and fostering trust in healthcare systems.
### VMware vs. Nutanix: Which Is Preferred in HIPAA Compliant Environments?
What Is VMware?
VMware is a provider of virtualization solutions. It offers software that allows multiple virtual machines to run on a single physical machine. This technology enables organizations to maximize resource efficiency and reduce operational costs. VMware's flagship product, VMware vSphere, provides platform virtualization and cloud computing services. It is widely used across various industries to enhance infrastructure scalability and flexibility.
Founded in 1998, VMware has been a pioneer in virtualization technology. The company's software has revolutionized the IT landscape by facilitating server consolidation and improving disaster recovery solutions. With a portfolio that includes network virtualization, storage virtualization, and desktop virtualization, VMware continues to evolve, offering solutions that cater to modern data center challenges and cloud computing needs.
What Is Nutanix?
Nutanix is an enterprise cloud computing company. It provides hyper-converged infrastructure solutions that unify computing, storage, and networking resources into a single integrated system. Nutanix's platform simplifies data center management by eliminating the need for separate storage, computing, and virtualization resources. This results in enhanced operational efficiency and reduced infrastructure complexity.
Founded in 2009, Nutanix aims to bring the simplicity of public cloud infrastructure to enterprise data centers. Its flagship product, the Nutanix Enterprise Cloud Platform, offers a range of services that facilitate application deployment and scalability. Nutanix has been at the forefront of driving innovation in hyper-converged infrastructure. See this blog post for a detailed comparison of VMware vs. Nutanix.
Overview of HIPAA Compliance Requirements
The Health Insurance Portability and Accountability Act (HIPAA) establishes national standards to protect sensitive patient health information from being disclosed without the patient's consent or knowledge. HIPAA compliance is essential for healthcare organizations, vendors, and any entity that handles protected health information (PHI).
The key requirements for HIPAA compliance fall into several categories:
Privacy rule: This rule governs how PHI can be used and disclosed. It limits the sharing of patient data and ensures that individuals have rights to access their health information. Entities must implement safeguards to protect PHI from unauthorized access or misuse.
Security rule: The Security Rule focuses on protecting electronic PHI (ePHI). It requires covered entities to adopt administrative, physical, and technical safeguards. These include controlling access to ePHI, encrypting sensitive data, and ensuring secure communication channels.
Breach notification rule: In the event of a data breach involving PHI, entities must notify affected individuals, the Department of Health and Human Services (HHS), and, in some cases, the media.
Enforcement rule: This rule sets out the penalties for non-compliance. Organizations can face substantial fines depending on the severity of the violation, whether it was due to negligence, and the steps taken to correct the issue.
Business associate agreements (BAAs): HIPAA requires that any third-party vendors with access to PHI sign a BAA, ensuring that they too follow HIPAA regulations. This extends HIPAA’s security requirements to partners and service providers.
VMware's Approach to HIPAA Compliance
VMware addresses HIPAA compliance primarily through its Carbon Black Cloud and Workspace ONE Unified Endpoint Management (UEM) solutions. These platforms have undergone third-party assessment by Coalfire, an independent security organization, to ensure they meet the technical requirements of the HIPAA Security Rule, which governs the protection of electronic Protected Health Information (e-PHI).
The Carbon Black Cloud and Workspace ONE platforms offer healthcare organizations a security framework that adheres to HIPAA's core principles: confidentiality, integrity, and availability of patient data. Coalfire's evaluation included testing of the platforms in areas such as malware detection and response, endpoint management, and the implementation of administrative and technical safeguards.
By integrating these solutions, VMware helps healthcare providers safeguard their e-PHI through several key features:
Endpoint security: Carbon Black Cloud's ability to detect and block malware ensures that workstations and devices handling e-PHI are protected against unauthorized access.
Device management: Workspace ONE provides centralized control over devices, ensuring that only authorized personnel can access sensitive data. It also supports secure communication channels.
Compliance monitoring: VMware’s platforms assist in meeting HIPAA's administrative and technical safeguards, such as access controls and data encryption.
Nutanix's Approach to HIPAA Compliance
Nutanix helps healthcare organizations address HIPAA compliance through its enterprise cloud platform, which integrates security, data protection, and simplified infrastructure management. By consolidating workloads like electronic health records (EHR), picture archiving and communication systems (PACS), and virtual desktop infrastructure (VDI) on a unified platform, Nutanix ensures that protected health information (PHI) is securely managed.
Key features of Nutanix’s platform that support HIPAA compliance include:
Data security: Nutanix enhances patient data security by automating compliance with regulatory standards such as HIPAA, GDPR, and HITECH.
Scalable EHR deployments: Healthcare organizations can easily scale their EHR systems as needed, supporting compliance by keeping data accessible yet secure during expansions or upgrades.
Protected data access: The platform provides secure access to clinical applications and protected data from any device or location, supporting remote and on-site healthcare workers.
Business continuity: Nutanix’s self-healing architecture and VM-centric data protection keep critical healthcare applications and patient data available, reducing downtime.
VMware vs. Nutanix: Which Is Preferred in HIPAA Compliant Environments?
When evaluating VMware and Nutanix for HIPAA-compliant environments, the choice largely depends on an organization’s specific needs, infrastructure complexity, and priorities in terms of scalability, security, and operational efficiency. Both platforms offer solutions that help healthcare organizations maintain compliance with HIPAA’s data protection requirements.
Security and Compliance Features
VMware’s approach to HIPAA compliance centers on its Carbon Black Cloud and Workspace ONE platforms, which provide endpoint security and unified device management. These solutions offer safeguards for electronic Protected Health Information (ePHI), focusing on malware protection, access control, and encryption. VMware's long history in virtualization and cloud computing makes it a trusted option for healthcare environments requiring adherence to HIPAA's technical safeguards.
Nutanix, on the other hand, emphasizes simplicity and performance in its hyper-converged infrastructure (HCI), combining compute, storage, and networking into a single platform. Nutanix’s security features—such as built-in encryption, automated compliance auditing, and VM-centric data protection—simplify HIPAA compliance by streamlining the management of sensitive data. Its ability to scale easily also allows healthcare providers to expand or adjust their infrastructure without compromising data security.
Infrastructure Management
VMware’s strengths lie in its ability to integrate into existing enterprise infrastructure, offering granular control and management over virtualized environments. This can be particularly beneficial for organizations with complex IT environments, where managing large-scale virtualization alongside security and compliance is crucial.
Nutanix is often preferred for its simplicity and ease of management. Its hyper-converged infrastructure consolidates workloads like electronic health records (EHR) and other healthcare applications into a unified system, reducing the need for separate virtualization and storage solutions. This integrated approach minimizes operational complexity and enhances scalability.
Performance and Scalability
Both VMware and Nutanix offer scalable solutions. VMware's vSphere is well-known for its reliability in managing large-scale data centers, making it suitable for organizations with extensive infrastructure needs. Nutanix, with its modular architecture, allows healthcare providers to scale workloads effortlessly, offering flexibility for organizations with fluctuating or growing demand.
Which Is Preferred?
In HIPAA-compliant environments, the decision between VMware and Nutanix often comes down to the organization’s size, IT complexity, and specific compliance needs. For larger healthcare systems with established virtualized environments and a need for detailed control over security, VMware may be the better choice. However, for organizations seeking a simplified, scalable solution with a focus on reducing infrastructure complexity, Nutanix may be more appealing.
Both platforms provide the necessary tools to support HIPAA compliance, so the best choice will depend on the specific requirements of the healthcare provider.
Conclusion
Both VMware and Nutanix offer solutions to meet the demands of HIPAA compliance in healthcare environments. VMware’s focus on security features like endpoint protection and device management, alongside its mature virtualization platform, makes it a strong contender for organizations with complex IT infrastructures. Meanwhile, Nutanix’s hyper-converged infrastructure offers simplicity, scalability, and integrated security features that appeal to healthcare providers seeking to streamline operations without compromising on compliance.
Ultimately, the decision between VMware and Nutanix should be driven by the specific needs of the organization, including the complexity of its infrastructure, its growth plans, and the level of control required over security and compliance. Both platforms are well-equipped to support HIPAA-compliant environments, ensuring the protection of sensitive patient data while enhancing operational efficiency.
### Using Zilliz with Jupyter Notebooks on Ubuntu
Prerequisites
Ubuntu 22.04: I will be using Ubuntu 22.04 throughout this demo. You can install your Ubuntu server in under 30 seconds from the Atlantic.Net Cloud Platform Console.
Basic Python Knowledge: Familiarity with Python and virtual environments is helpful.
Zilliz Account - You will need a Zilliz Account. They offer a free tier.
Part 1 - Create a Zilliz Free Account & Create Zilliz Cluster
While you can't install the Zilliz Cloud service directly onto an Atlantic.Net Cloud Server, you can use your server to connect to and interact with Zilliz Cloud.
Here's how you can set things up:
Step 1 - Connect to Zilliz Cloud
Create a Zilliz Cloud Account:
Sign up for an account on Zilliz Cloud (zilliz.com/cloud).
Use the Sign-Up pages to create an account as per the below image. You can also use your existing GitHub or Google accounts for added simplicity.
Step 2 - Create Zilliz Cluster
We can now create a Zillz cluster in the GUI.
From the Get Started Page on Zilliz, click on New Cluster.
Select the Free Tier. This will only give you the option to deploy Zilliz in GCP.
Check the details and hit Create.
Wait for the Cluster to build and move on to part 2. You may want to make a note of your endpoint ID and API key at this point. You can view these later, so it's not a disaster if you forget.
Part 2 - Install Python & Jupyter Notebooks
There are several ways you can use Zilliz, but you must use it with an SDK. This procedure will follow the steps to use Python, but please be aware that Zilliz supports Java and NodeJS if that is your preferred SDK.
Step 1 – Install Python
Jupyter Lab requires Python. You can install it using the following commands:
apt update -y
apt install python3 python3-pip -y
Note: You may be prompted to restart services after installation. Just click .
Next, install the Python virtual environment package.
pip install -U virtualenv
Step 2 – Install Jupyter Lab
Now, install Jupyter Lab using the pip command.
pip3 install jupyterlab
This command installs Jupyter Lab and its dependencies. Next, edit the .bashrc file.
nano ~/.bashrc
Define your Jupyter Lab path as shown below; simply add it to the bottom of the file:
export PATH=$PATH:~/.local/bin/
Reload the changes using the following command.
source ~/.bashrc
Next, test run the Jupyter Lab locally using the following command to make sure everything starts.
jupyter lab --allow-root --ip=0.0.0.0 --no-browser
Check the output to make sure there are no errors. Upon success you will see the following output.
[C 2023-12-05 15:09:31.378 ServerApp] To access the server, open this file in a browser:
http://ubuntu:8888/lab?token=aa67d76764b56c5558d876e56709be27446
http://127.0.0.1:8888/lab?token=aa67d76764b56c5558d876e56709be27446
Press the CTRL+C to stop the server.
Step 3 – Configure Jupyter Lab
By default, Jupyter Lab doesn’t require a password to access the web interface. To secure Jupyter Lab, generate the Jupyter Lab configuration using the following command.
jupyter-lab --generate-config
Output.
Writing default config to: /root/.jupyter/jupyter_lab_config.py
Next, set the Jupyter Lab password.
jupyter-lab password
Set your password as shown below:
Enter password:
Verify password:
[JupyterPasswordApp] Wrote hashed password to /root/.jupyter/jupyter_server_config.json
You can verify your hashed password using the following command.
cat /root/.jupyter/jupyter_server_config.json
Output.
{
"IdentityProvider": {
"hashed_password": "argon2:$argon2id$v=19$m=10240,t=10,p=8$zf0ZE2UkNLJK39l8dfdgHA$0qIAAnKiX1EgzFBbo4yp8TgX/G5GrEsV29yjHVUDHiQ"
}
}
Note this information, as you will need to add it to your config.
Next, edit the Jupyter Lab configuration file.
nano /root/.jupyter/jupyter_lab_config.py
Define your server IP, hashed password, and other configurations as shown below:
c.ServerApp.ip = 'your-server-ip'
c.ServerApp.open_browser = False
c.ServerApp.password = 'argon2:$argon2id$v=19$m=10240,t=10,p=8$zf0ZE2UkNLJK39l8dfdgHA$0qIAAnKiX1EgzFBbo4yp8TgX/G5GrEsV29yjHVUDHiQ'
c.ServerApp.port = 8888
Make sure you format the file exactly as above. For example, the port number is not in brackets, and the False boolean must have a capital F.
Save and close the file when you are done.
Step 4 – Create a Systemctl Service File
Next, create a systemd service file to manage Jupyter Lab.
nano /etc/systemd/system/jupyter-lab.service
Add the following configuration:
[Service]
Type=simple
PIDFile=/run/jupyter.pid
WorkingDirectory=/root/
ExecStart=/usr/local/bin/jupyter lab --config=/root/.jupyter/jupyter_lab_config.py --allow-root
User=root
Group=root
Restart=always
RestartSec=10
[Install]
WantedBy=multi-user.target
Save and close the file, then reload the systemd daemon.
systemctl daemon-reload
Next, start the Jupyter Lab service using the following command.
systemctl start jupyter-lab
You can now check the status of the Jupyter Lab service using the following command.
systemctl status jupyter-lab
Jupyter Lab is now started and listening on port 8888. You can verify it with the following command.
ss -antpl | grep jupyter
Output.
LISTEN 0 128 104.219.55.40:8888 0.0.0.0:* users:(("jupyter-lab",pid=156299,fd=6))
Step 5 – Access Jupyter Lab
Now, open your web browser and access the Jupyter Lab web interface using the URL http://your-server-ip:8888. You will see Jupyter Lab on the following screen.
Provide the password you set during the installation and click on Log in. You will see the Jupyter Lab dashboard on the following screen:
Step 6 - Start the Python3 Notebook
You can now start the Python 3 Notebook and move on to Part 3.
Part 3 - Install and Configure Zilliz Cluster
Now go back to your VPS terminal. We will install Zilliz and configure the cluster.
Step 1 - Install Pymilvus
Install PyMilvus compatible with Milvus v2.4.x
python -m pip install pymilvus==2.4.4
Upgrade PyMilvus to the newest version.
python -m pip install --upgrade pymilvus
Verify installation success.
python -m pip list | grep pymilvus
Step 2 - Connect to Cluster
Now let's connect to the cluster.
Go back to your Jupyter notebook and execute the following code. Make sure you update the following parameters:
CLUSTER_ENDPOINT="YOUR_CLUSTER_ENDPOINT" # Set your cluster endpoint
TOKEN="YOUR_CLUSTER_TOKEN" # Set your token
# Connect using a MilvusClient object
from pymilvus import MilvusClient
CLUSTER_ENDPOINT="YOUR_CLUSTER_ENDPOINT" # Set your cluster endpoint
TOKEN="YOUR_CLUSTER_TOKEN" # Set your token
Step 3 - Initialize the Zilliz Cluster
Now initialize the cluster.
# Initialize a MilvusClient instance
# Replace uri and token with your own
client = MilvusClient(
uri=CLUSTER_ENDPOINT, # Cluster endpoint obtained from the console
token=TOKEN # API key or a colon-separated cluster username and password
)
Step 4 - Create a Collection
Let's create a collection.
In Zilliz Cloud, a collection is like a table in a traditional database, but it's specifically designed to store and manage vector data along with its associated metadata.
client.create_collection(
collection_name="quick_setup",
dimension=5 # The dimensionality should be an integer greater than 1.
)
Step 5 - Insert Some Data
Now let's populate the Vector DB with some dummy data for testing.
Note: The official Zilliz documentation provides this data.
Run the following in your Jupyter notebook:
# 4. Insert data into the collection
# 4.1. Prepare data
data=[
{"id": 0, "vector": [0.3580376395471989, -0.6023495712049978, 0.18414012509913835, -0.26286205330961354, 0.9029438446296592], "color": "pink_8682"},
{"id": 1, "vector": [0.19886812562848388, 0.06023560599112088, 0.6976963061752597, 0.2614474506242501, 0.838729485096104], "color": "red_7025"},
{"id": 2, "vector": [0.43742130801983836, -0.5597502546264526, 0.6457887650909682, 0.7894058910881185, 0.20785793220625592], "color": "orange_6781"},
{"id": 3, "vector": [0.3172005263489739, 0.9719044792798428, -0.36981146090600725, -0.4860894583077995, 0.95791889146345], "color": "pink_9298"},
{"id": 4, "vector": [0.4452349528804562, -0.8757026943054742, 0.8220779437047674, 0.46406290649483184, 0.30337481143159106], "color": "red_4794"},
{"id": 5, "vector": [0.985825131989184, -0.8144651566660419, 0.6299267002202009, 0.1206906911183383, -0.1446277761879955], "color": "yellow_4222"},
{"id": 6, "vector": [0.8371977790571115, -0.015764369584852833, -0.31062937026679327, -0.562666951622192, -0.8984947637863987], "color": "red_9392"},
{"id": 7, "vector": [-0.33445148015177995, -0.2567135004164067, 0.8987539745369246, 0.9402995886420709, 0.5378064918413052], "color": "grey_8510"},
{"id": 8, "vector": [0.39524717779832685, 0.4000257286739164, -0.5890507376891594, -0.8650502298996872, -0.6140360785406336], "color": "white_9381"},
{"id": 9, "vector": [0.5718280481994695, 0.24070317428066512, -0.3737913482606834, -0.06726932177492717, -0.6980531615588608], "color": "purple_4976"}
]# 4.2. Insert data
res = client.insert(
collection_name="quick_setup",
data=data
)
print(res)
# Output
#
# {
# "insert_count": 10,
# "ids": [0, 1, 2, 3, 4, 5, 6, 7, 8, 9]
# }
Let's insert more data.
import time
# 5. Insert more data into the collection
# 5.1. Prepare data
colors = ["green", "blue", "yellow", "red", "black", "white", "purple", "pink", "orange", "brown", "grey"]
data = [ {
"id": i,
"vector": [ random.uniform(-1, 1) for _ in range(5) ],
"color": f"{random.choice(colors)}_{str(random.randint(1000, 9999))}"
} for i in range(1000) ]
# 5.2. Insert data
res = client.insert(
collection_name="quick_setup",
data=data[10:]
)
print(res)
# Output
#
# {
# "insert_count": 990
# }
# Wait for a while
time.sleep(5)
Step 6 - Perform a Vector Search
Now let's query the data using a vector search.
Single Vector Search
# 6.1. Prepare query vectors
query_vectors = [
[0.041732933, 0.013779674, -0.027564144, -0.013061441, 0.009748648]
]# 6.2. Start search
res = client.search(
collection_name="quick_setup", # target collection
data=query_vectors, # query vectors
limit=3, # number of returned entities
)
print(res)
You should see output like this:
# Output
#
# [
# [
# {
# "id": 551,
# "distance": 0.08821295201778412,
# "entity": {}
# },
# {
# "id": 296,
# "distance": 0.0800950899720192,
# "entity": {}
# },
# {
# "id": 43,
# "distance": 0.07794742286205292,
# "entity": {}
# }
# ]
# ]
Bulk-Vector Search
# 7. Search with multiple vectors
# 7.1. Prepare query vectors
query_vectors = [
[0.041732933, 0.013779674, -0.027564144, -0.013061441, 0.009748648],
[0.0039737443, 0.003020432, -0.0006188639, 0.03913546, -0.00089768134]
]# 7.2. Start search
res = client.search(
collection_name="quick_setup",
data=query_vectors,
limit=3,
)
print(res)
You should see output like this:
# Output
#
# [
# [
# {
# "id": 551,
# "distance": 0.08821295201778412,
# "entity": {}
# },
# {
# "id": 296,
# "distance": 0.0800950899720192,
# "entity": {}
# },
# {
# "id": 43,
# "distance": 0.07794742286205292,
# "entity": {}
# }
# ],
# [
# {
# "id": 730,
# "distance": 0.04431751370429993,
# "entity": {}
# },
# {
# "id": 333,
# "distance": 0.04231833666563034,
# "entity": {}
# },
# {
# "id": 232,
# "distance": 0.04221535101532936,
# "entity": {}
# }
# ]
# ]
That's it! You are now ready to start using Zilliz Vector Databases with your Atlantic.Net hosted cloud server. Remember, you don't have to use Python, Zilliz natively supports Java and NodeJS if that's your preference.
### What Is the Difference Between Machine Learning and Deep Learning?
Machine learning and deep learning are distinct disciplines of artificial intelligence (AI). The two technologies share many characteristics as they leverage computing power to simulate and augment human intelligence. Key differences in these AI solutions make them appropriate for addressing different classes of tasks and automated processes.
Machine learning (ML) is a broad category that relies on dedicated algorithms and statistical models to automate specific processes without explicit instructions and with less reliance on human intervention. Deep learning (DL) is a subset of machine learning using neural networks to learn or draw insights from large amounts of data. Essentially, all deep learning is machine learning, but all machine learning is not deep learning.
This article discusses the differences between machine learning and deep learning. We will look at the underlying technologies used to provide ML and DL applications with their intelligence and how they are trained to address specific problems. We’ll also investigate how these technologies are responsible for major changes in how businesses and the general public interact with computing systems.
What Is Machine Learning?
Machine learning is a discipline of artificial intelligence that concentrates on developing applications and computer systems that can perform complex tasks they have not been explicitly programmed to accomplish. ML systems learn from exposure to training data that they use to make informed decisions or predictions. The system's accuracy increases as the learning process progresses and additional data is ingested into an ML model.
ML systems enable computers to perform tasks that require human intelligence without explicit programming. The systems employ techniques like linear regression and decision trees for classification and clustering activities. ML models are more effective when working with small datasets. The data used by ML models may need to undergo manual preprocessing by domain experts.
Key Components of Machine Learning
Several key components work together to form the foundation of machine learning systems. Each contributes equally to the accuracy and utility of the resulting system or application.
Data
Data is a required raw material for ML systems. Both structured data such as tables or unstructured data can be used as ML inputs. Unstructured data may include images, audio, or text to train a model to identify objects. Large amounts of data are typically used to train an ML system.
Algorithms
Multiple mathematical models, or algorithms, facilitate the learning necessary to provide functionality to an ML application. The algorithms are trained to identify patterns and relationships in the data. Historical data is processed to perform classification, make predictions, aggregate data points, and generate original content. We’ll look more closely at the various types of ML algorithms later in this article.
Training
An ML model learns by being trained using the previously described data and algorithms. The model is repeatedly fed training data utilizing its algorithms. Accuracy is improved by adjusting the model’s parameters based on its responses to the training data.
Evaluation and Tuning
After training and testing the ML model, its performance is evaluated using new data. The objective is to determine if the model meets expectations or needs further training before deployment.
Machine Learning Algorithms
Different types of machine learning algorithms are used to train ML systems. These algorithms typically fall into one of the following four categories.
Supervised Learning Algorithms
Supervised learning algorithms teach a model by example. An operator presents the machine learning algorithm with a test dataset including desired inputs and outputs. The algorithm attempts to produce those inputs and outputs by recognizing patterns in the data and making observations and predictions. The operator makes necessary corrections until the algorithm attains the desired level of accuracy.
Supervised learning includes a model to address the following types of tasks.
Classification - The ML algorithm evaluates observed values and assigns new elements to an existing category. An example is an email filtering system distinguishing between spam and legitimate correspondence.
Regression - Regression tasks require the ML algorithm to understand the relationship between a single dependent variable and multiple changing variables. Regression is useful for forecasting and making predictions.
Forecasting - These tasks involve making predictions regarding the future based on past and present data. Forecasting is often used to analyze trends to influence business decisions.
Semi-Supervised Learning
Semi-supervised learning is similar to supervised learning with one exception. Training employs labeled data with meaningful tags and unlabeled data without this descriptive information. The goal is to enable the model to label unlabeled data.
Unsupervised Learning Algorithms
Unsupervised learning involves an ML algorithm analyzing data to identify relationships and correlations without intervention by a human operator. The algorithm interprets large data sets and organizes the information to describe its logical structure. The algorithm improves its decision-making ability as the volume of assessed data increases. Applications of unsupervised learning include:
Clustering - Segments data into groups based on defined criteria through analysis.
Dimension reduction - The number of variables under consideration is reduced to focus on the desired outcomes.
Reinforcement Learning Algorithms
In reinforcement learning, the algorithm is given a set of actions, parameters, and outcomes. The model defines rules and explores alternate options to identify the best action to address the problem. The algorithm is taught by trial and error, leveraging past experiences to adapt its responses to achieve optimal results.
Applications of Machine Learning
Machine learning systems are found in multiple usage scenarios across many diverse fields.
Natural language processing (NLP) - ML systems can be trained to converse with humans using natural language. Intelligent chatbots can provide automated customer service or translation services. They can be instrumental in providing information about an organization's products and services.
Speech recognition - Machine learning is the technology responsible for the speech recognition intelligent virtual assistants employ to respond to verbal queries. ML systems can also create written transcripts from human speech.
Robotics - Robotics is an essential component of industrial automation. ML systems enable industrial robots to perform complex tasks that previously required human intelligence. Robots are used to staff assembly lines and engage in activities such as picking stock items for shipping. Delivery drones are another emerging use of ML-powered robotics.
Healthcare - Healthcare professionals utilize ML models trained to make recommendations regarding diagnosis and treatment options to enhance and streamline patient care. Another application in the healthcare field is the development of systems that can identify potential diseases or abnormalities from medical imaging.
Autonomous vehicles - Machine learning systems are powering the development of autonomous vehicles such as self-driving cars. These systems require substantial computing power to address the constantly evolving conditions faced when operating a vehicle.
Recommendation systems - Many ecommerce and entertainment sites utilize recommendation systems to create a more personalized user experience. Recommendations are made based on a user's past interactions with the system that allow an ML model to learn about their preferences.
What Is Deep Learning?
Deep learning is a subset of machine learning that employs many-layered (deep) neural networks to learn from large and complex volumes of data. DL systems leverage complex architectures such as convolutional and recurrent neural networks. Deep learning techniques strive to replicate the operation of the human brain.
Deep learning models automatically extract features from raw data to minimize the need for manual preprocessing. They can learn from their own errors and refine their performance over time. Large data sets are essential for developing accurate deep learning solutions. Deep learning algorithms can handle unstructured data more effectively than ML solutions that perform better with structured data.
Deep Learning Key Characteristics
Deep learning systems and applications typically share several key characteristics that differentiate them from machine learning models.
Artificial neural networks form the foundation of DL solutions. An artificial neural network is made of multiple interconnected layers of nodes. Data is transformed into more abstract representations as it traverses the layers.
The depth of a deep learning application refers to the number of layers in the network. Most DL models have three or more layers consisting of an input layer, an output layer, and multiple hidden layers. Additional layers enable the system to learn more complex features.
Deep learning automatically extracts features from unstructured data without the need for preprocessing or feature engineering. A DL model can successfully process large datasets comprised of text, images, and audio elements. More data typically results in improved model performance.
DL systems need substantial computational power to process the large amounts of data they require. The artificial neural networks use backpropagation to improve the model over time by adjusting the network’s connection weights based on output errors.
Types of Neural Networks Employed in Deep Learning
Different types of neural networks are used to develop deep learning solutions. The following three kinds of neural networks are essential components of deep learning technology.
Feedforward Neural Networks
A feedforward neural network is a simple network in which data moves in one direction from the model’s input layer to its output layer. Data never moves backward to be reanalyzed by the model. Data is fed to the model to train it to make predictions about other data sets. For example, feedforward neural networks are trained to detect fraud and are used in the banking industry.
Convolutional Neural Networks (CNN)
Convolutional neural networks are designed to replicate the visual capabilities of the human brain to process images. These networks are excellent at identifying animal or plant species from photographs. They can also be used to diagnose diseases from medical scans or identify specific items from social media feeds.
Recurrent Neural Networks
Recurrent neural networks employ complex connections that include loops. Data can move forward and loop back to be reanalyzed by previous layers. Each input is fed into the model to be analyzed alone and combined with prior input. Recurrent neural networks can predict sentiments and the ending of a sequence such as a speech.
Applications of Deep Learning Algorithms and Systems
Deep learning has applications in many areas of society and the business world.
Natural language processing - Deep learning models are powering advanced NLP solutions such as OpenAI’s GPT products. Systems can analyze customer sentiment in response to an organization’s products or services to facilitate personalized marketing. Deep learning solutions furnish enhanced functionality in comparison to ML-powered NLP applications.
Computer vision - Deep learning models are used to provide applications with computer vision capabilities. This functionality can be leveraged to perform activities ranging from image classification and object detection to facial recognition. These capabilities are essential in many fields such as security, surveillance, and advanced automation as seen in autonomous vehicles.
Predictive analytics - Deep learning methods analyze vast amounts of historical data from which they can make accurate predictions. This capacity can be used to enhance decision-making, streamline manufacturing operations, and forecast customer trends.
Smart cities - Deep learning solutions have many applications in creating smart cities that provide society with improved living conditions. Examples are surveillance data used to identify dangerous incidents and traffic management to minimize congestion in crowded metropolitan areas.
Financial services - DL is being used by financial services companies to detect and prevent fraud. Organizations are also employing deep learning models to predict and analyze market trends and execute trades quickly to address evolving conditions.
Advantages and Challenges of Deep Learning
Deep learning technology offers multiple advantages and presents several challenges that must be effectively addressed.
Benefits
Automated feature extraction enhances productivity by minimizing manual feature engineering.
Deep learning systems are flexible and versatile due to their ability to process all types of unstructured data.
Systems exhibit high accuracy when operating with complex data.
Challenges
Training deep learning solutions requires large datasets. This can pose difficulties and hinder the use of DL in some applications.
Deep learning applications consume substantial computational resources that can present financial constraints. Specialized hardware such as a graphics processing unit (GPU) may need to be used to support deep learning solutions.
Transparency may be an issue with deep learning systems that appear to be black boxes to a typical user.
Deep Learning vs. Machine Learning
The following chart illustrates the main differences when comparing deep learning vs. machine learning.
Characteristic
Deep Learning
Machine Learning
Dataset size
Works best with large volumes of data
Best suited for use with smaller datasets
Data type
Unstructured data
Structured data
Training methods
Self-learning utilizing neural networks
Supervised and unsupervised learning using specialized machine learning algorithms
Human training requirements
Minimal
Extensive
Training time
Longer than ML solutions
Faster than DL solutions
Hardware requirements
Requires the power of a GPU
Advanced central processing units (CPUs)
Atlantic.Net offers customers a cloud-based GPU server hosting platform to power your machine learning and deep learning applications. We feature two configurations to meet your business needs. Choose the NVIDIA L40S GPU for general artificial intelligence tasks, machine learning and deep learning. The more powerful NVIDIA H100 NVL =furnishes higher memory bandwidth for advanced AI and deep learning.
### CPU Vs GPU: What Is The Difference?
Modern computing systems are built to address a wide range of business requirements and personal interests. A computer’s central processing unit (CPU) is responsible for controlling the data flow and carrying out instructions. It is unquestionably the most essential piece among many critical computer components comprising a modern machine.
While CPUs are extremely important for complex computing tasks, some applications benefit from running on a more specialized processor. Employing a graphics processing unit (GPU) rather than a general-purpose processor can result in substantially improved performance for certain tasks that can be more efficiently addressed with parallel processing. GPUs have become increasingly important to handle the parallel instruction processing necessary to power artificial intelligence (AI) applications.
This article examines the key differences between CPUs and GPUs. One main difference is that a computer can operate with only a CPU, but a GPU needs to be paired with a CPU to function properly. We will investigate how these processors differ physically and the types of problems they are best suited to address. Finally, we will examine typical usage scenarios for both processing units.
What Is a Central Processing Unit (CPU)?
A CPU is the main computer component and is responsible for the majority of processing tasks. It essentially acts as a computer's brain. The CPU processes instructions from a computer's memory to perform specific arithmetic, logical, control, and input/output operations.
CPU components
CPUs are constructed using several key components that perform serial instruction processing.
Control unit: The control unit (CU) manages the CPU's operation. It coordinates the activities of the other CPU components as it executes instructions to perform tasks required by the operating system or applications. The CU decodes instructions to determine CPU activity, generates signals to other components like the ALU, manages data flow, and ensures the operations of all parts of the CPU are synchronized.
Arithmetic logic unit: The ALU is a primary CPU component responsible for multiple tasks essential to a computer system's operation based on signals sent from the CPU's control unit. A CPU's arithmetic logic units perform basic arithmetic functions like addition and multiplication. It also performs logical operations such as AND, NOT, or XOR for decision-making and comparisons. The performance of a CPU can be substantially affected by the speed and efficiency of arithmetic logic units.
Cores: A CPU core is a processing unit within a CPU that independently executes instructions. CPU cores enable the processor to perform multiple tasks simultaneously. CPUs can have multiple cores, with more cores typically resulting in improved multithreading capability. Cores share resources like buses and cache memory, which can impact their performance. Modern CPU architecture enables cores to adjust performance dynamically based on workload requirements.
Cache memory: The CPU cache memory is dedicated storage for frequently accessed data. This high-speed, built-in memory can substantially increase processing speed by reducing the need to load data from other locations. There can be multiple caches of varying sizes to handle data overflow. While a larger cache can hold more data, it may result in slower operations than a smaller, optimized cache.
Registers: CPU registers are small and fast storage locations inside the CPU. They are critical to the CPU's operation and store instructions and temporary data. Registers are directly accessible by the CPU, making them much faster than the main memory. A register is usually no larger than 64 bits, limiting the amount of data it can hold. A CPU can have several types of registers including general-purpose registers used for various purposes and specialized registers such as the program counter that holds the address of the next instruction.
Buses: A bus provides a high-speed, internal connection that transfers information between the CPU and other computing resources. Buses can be serial, transferring data one bit at a time, or parallel, capable of transmitting multiple bits simultaneously. Different types of buses are used as the CPU performs various tasks. For example, data buses carry data between the CPU and other components while an address bus transmits the memory location of data elements. Bus width and speed can impact the CPU's performance.
Clock: The CPU clock, also known as the system clock, continuously generates pulses to synchronize the operation of the CPU and other computer components. Clock speed is measured in hertz (Hz) and indicates how many cycles a CPU can execute per second. For example, a clock speed of 2 GHz generates two billion cycles per second. The clock provides timing control and synchronization for all internal components. Modern CPUs can dynamically adjust clock speed to reduce power consumption and minimize heat generation.
CPU characteristics and functionality
The main function of a central processing unit is to perform logical operations and instructions received from the computer's memory. The ability to perform these operations and process data efficiently is a function of the combined capabilities of its components. CPUs are designed to perform serial processing. They execute elements in the instruction cycle one at a time.
A CPU's components determine its serial computing capabilities. The clock speed provides a benchmark for the amount of processing the chip can handle. A higher clock speed generally indicates a faster-performing computer. Cache memory must be tuned to balance the volume of data it can hold and the latency in accessing that information.
The number of cores is another factor in determining the power of a CPU. Additional cores allow the CPU to perform multithreading to perform calculations and other tasks more efficiently. A multi-core CPU with a high clock speed usually furnishes the best performance.
CPU Architectures
Multiple CPU architectures have been developed to address computational requirements. They can generally be categorized as either a Complex Instruction Set Computer (CISC) or a Reduced Instruction Set Computer based on the number of machine instructions it contains.
The following are some popular CPU architectures found in modern computers.
32-bit x86 - This architecture is commonly found in laptop and desktop computers and processes data in 32-bit chunks per clock cycle. It is a CISC architecture first released by Intel in 1978.
64-bit x86 - This more modern CPU processes data 64 bits at a time and can address more memory than 32-bit processors. Intel and AMD use the architecture which is a popular solution for home computers and servers
ARM64 - This RISC architecture can process more instructions per second than Intel processors. They are energy-efficient, making them a good choice for sustainable computing initiatives.
PowerPC - This RISC architecture is based on IBM’s POWER architecture. Memory access is separated from computational instructions by a register-to-register design.
Types of CPUs
CPUs are manufactured with specific characteristics and form factors to address various computing tasks.
Desktop CPUs
Desktop CPUs are available in multiple models offering different performance levels suitable for various tasks. The Intel Core Series and AMD's Ryzen line are desktop CPUs used in many popular desktop machines.
Mobile CPUs
Mobile devices like laptops need to balance performance and power consumption. The Intel Core Mobile and AMD Ryzen Mobile processors are popular mobile CPUs providing good performance while supporting energy efficiency.
Embedded CPUs
Embedded CPUs are specialized microprocessors designed to perform specific tasks in embedded systems. These dedicated devices typically provide limited and specialized functionality compared with a general-use computer system. Features of embedded CPUs include durability, low power consumption, and real-time operation. Embedded CPUs often integrate multiple components on a single chip to reduce their size and energy requirements.
Server CPUs
Server CPUs need additional power and functionality to handle multiple tasks supporting business applications. A server CPU may offer more cores and error-correcting code memory support. Examples of server CPUs include the Intel Xeon and AMD EPYC lines of processors.
Low-power CPUs
Devices with energy constraints like equipment used for IoT (Internet of Things) implementations require specialized, low-power CPUs. Examples of these energy-efficient CPUs include ARM-based processors and Intel's Atom designed for compact devices.
Gaming CPUs
Gaming platforms may employ specialized CPUs optimized for the high performance required by video and computer games. These CPUs provide higher clock speeds and can perform overclocking when necessary to facilitate a smoother gaming experience.
High-performance CPUs
Supercomputers and machines running processor-intensive tasks benefit from specialized high-performance CPUs. This type of CPU focuses on supporting high-performance computing with multithreading and typically has multiple cores.
What is a Graphics Processing Unit (GPU)?
A graphics processing unit is a specialized processor designed to render images and perform complex mathematical calculations. GPUs typically work in conjunction with a CPU. Some architectures place the CPU and GPU on the same chip. The terms GPU and graphics card are sometimes incorrectly used interchangeably. The GPU is the processor inside a graphics card.
GPU Cores
GPU cores are the processor's foundational processing unit. Cores share similar characteristics that support the GPU's functionality.
GPU cores handle multiple tasks simultaneously, supporting the parallel processing necessary to display graphical data efficiently. Each core can manage numerous threads to streamline concurrent operations.
GPU cores are constructed differently than CPU cores, enabling many cores to be deployed to address parallel workloads and advanced scientific research. In some cases, a high-performance GPU may have thousands of cores.
Cores are optimized to increase the processor's performance with the floating-point calculations important for tasks like displaying images or teaching machine learning models. They share resources such as cache memory for efficiency.
GPU components
GPUs utilize several key components to perform concurrent calculations and parallel computing capabilities.
Streaming multiprocessors and cores: These processors represent the GPU's basic processing units used to execute multiple threads. NVIDIA GPUs employ CUDA cores and AMD GPUs use stream processors for this component. More cores enable the GPU to handle parallel computing tasks more efficiently.
Memory: Video RAM (VRAM) is specialized memory the GPU utilizes for computer graphics as it provides faster data transfer than system memory. The GPU also has cache memory to improve processing speed by storing frequently accessed data.
Framebuffer: This component stores the GPUs finished image before it is displayed. Before reaching the framebuffer, a rasterizer converts vector graphics into pixel-based graphics, and textures are applied to 3D models.
Cooling systems and power management circuits: GPUs can get very hot. Managing power consumption and effectively cooling the processor are critical factors in maintaining high performance.
GPU characteristics and functionality
GPUs demonstrate characteristics and functionality that differentiate them from CPUs. The following are some areas where a GPU can outperform a CPU.
Computer graphics
GPUs were originally developed primarily for rendering graphics to support video games and other visual computerized activities. GPUs are integral to the manufacture of high-performing gaming platforms. They are also critical for displaying complex information graphically to make it more easily understood.
Parallel processing
GPUs are essential for parallel processing applications that handle large volumes of data. The many cores in a GPU can quickly perform repetitive calculations to address the computing needs of financial simulations and other processor-intensive tasks.
Throughput and dedicated memory
Thousands of cores and dedicated memory enable GPUs to perform multiple operations simultaneously and more quickly than CPUs accessing system RAM. Better performance across a range of graphics and processor-intensive applications is possible by leveraging the power of GPUs.
Compatibility
GPUs are compatible with graphics APIs like DirectX or frameworks such as CUDA for parallel processing. This compatibility lets developers benefit from specific GPU capabilities when designing new products.
Types of GPUs
Graphics processing units are available in multiple styles for specific usage scenarios.
Dedicated GPUs: A dedicated or discrete GPU is typically a standalone graphics card or video card used for high-performance tasks.
Integrated GPUs: This type of GPU is built on a single chip with the CPU to share resources such as system memory and reduce energy consumption.
Hybrid GPUs: Hybrid GPUs can switch between dedicated and integrated capabilities to provide enhanced performance or conserve energy based on application requirements.
CPU Vs GPU for Specific Usage Scenarios
The types of tasks and applications running on a given computer must be considered when choosing between a CPU and GPU. Many tasks will run efficiently with a CPU that provides enough speed, cores, and memory. In other cases, users will greatly benefit from the features and performance of a GPU.
The chart below indicates how CPUs and GPUs address some specific usage scenarios. This information may help you select the appropriate platform for your application.
Usage scenario
CPU
GPU
Video editing and rendering
Performs tasks like encoding and applying effects.
Accelerates rendering and real-time playback for faster performance.
Animation and 3D modeling
Manages the software environment and some calculations
Reduces rendering time for enhanced real-time visualization and faster modeling iterations.
Artificial intelligence and machine learning
Effective for sequential processing and training models on small datasets.
Enhanced capabilities for training deep learning models on larger volumes of data.
Gaming
Manages game logic and artificial intelligence capabilities.
Renders graphics for smooth game playing.
Simulations and scientific computing
Good for tasks such as numerical simulations involving complex and conditional logic.
Facilitates physical simulations and scientific applications that can be parallelized.
General computing tasks
Handles the majority of processing tasks.
Accelerates web content and video display.
Atlantic Net Servers Feature Modern CPUs and GPUs
Atlantic Net offers customers modern CPU and GPU server hosting solutions designed to address your unique business objectives and requirements. Our servers can support virtually any application with an appropriate choice of processor and other components.
Talk to us today and learn how we can help your business grow with the right CPU or GPU.
### Resolve “Filename Not Matched” Error When Unzipping an Archive
When working with archives in Linux, you might encounter errors while trying to unzip files. One such common issue is the "Filename not matched" error. This error usually occurs due to mismatches between the file names in the archive and the commands or settings you use when extracting the archive.
In this article, we will explore the causes of the "Filename not matched" error when unzipping an archive and provide detailed solutions to resolve it.
Common Causes of the “Filename Not Matched” Error
Before diving into solutions, it’s important to understand why this error occurs. Here are the most common causes:
Case Sensitivity: Linux file systems are case-sensitive, meaning "File.txt" and "file.txt" are treated as different files.
Whitespace in File Names: File names containing spaces or special characters can cause issues during extraction.
Special Characters in File Names: Characters like @, #, $, or & may cause problems if not handled properly.
Incorrect Path: The extraction command might not be pointing to the correct path or file within the archive.
Solution 1: Handle Case Sensitivity
Linux is case-sensitive, which means that file names must exactly match their cases. If you encounter a mismatch error while unzipping, check whether the file names are typed correctly.
Step 1: Check File Names Inside the Archive
You can inspect the contents of the archive using the unzip -l command. This allows you to see the exact file names, including their case.
unzip -l archive.zip
Output:
Archive: archive.zip
Length Date Time Name
--------- ---------- ----- ----
12345 2023-10-01 12:34 File.txt
67890 2023-10-01 12:35 folder/Subfile.TXT
Step 2: Match File Names Exactly
Once you’ve listed the files, ensure that your extraction command matches the case of the file names exactly.
unzip archive.zip File.txt
Solution 2: Handling Whitespace in File Names
File names that contain spaces can be tricky when unzipping archives, as the shell may treat them as separate arguments.
Step 1: Use Quotes to Handle Spaces
If a file name contains spaces, enclose the file name in quotes to prevent the shell from splitting it into multiple parts.
unzip archive.zip "file with spaces.txt"
Using double quotes around the file name ensures that it’s treated as a single entity, avoiding the "Filename not matched" error.
Step 2: Use Escape Characters
Alternatively, you can use escape characters (\) before each space in the file name.
unzip archive.zip file\ with\ spaces.txt
Solution 3: Handling Special Characters
Special characters like @, #, $, and & in file names can cause the shell to misinterpret them, leading to errors during extraction.
Step 1: Escape Special Characters
To handle special characters in file names, you need to escape them using a backslash (\) or surround the entire file name with quotes.
archive.zip file\@name\#.txt
This will ensure that the shell doesn’t misinterpret the special characters, and the file can be extracted without errors.
Solution 4: Ensure Correct Path When Extracting
If the file you're trying to unzip is located in a subdirectory within the archive, make sure to provide the correct path relative to the archive structure.
Step 1: List Archive Contents with Paths
First, use the unzip -l command to see the file paths inside the archive.
unzip -l archive.zip
Output:
Archive: archive.zip
Length Date Time Name
--------- ---------- ----- ----
12345 2023-10-01 12:34 folder/File.txt
67890 2023-10-01 12:35 folder/subfolder/Anotherfile.txt
Step 2: Extract Using Correct Path
If the file is located inside a folder, include the full path when extracting it.
unzip archive.zip folder/File.txt
If the file is in a deeper directory:
unzip archive.zip folder/subfolder/Anotherfile.txt
Solution 5: Use Wildcards for File Names
If you’re unsure of the exact name of a file or if there are multiple files with similar names, you can use wildcards to match patterns.
Example: Extract All .txt Files
unzip archive.zip "*.txt"
This command extracts all .txt files from the archive, regardless of their names.
Example: Extract Files from a Specific Subdirectory
unzip archive.zip "folder/*"
This extracts all files from the folder directory within the archive.
Conclusion
The "Filename not matched" error when unzipping an archive in Linux is typically caused by issues such as case sensitivity, spaces, special characters, incorrect paths, or an outdated unzip utility. With these solutions, you’ll be able to efficiently unzip files without encountering filename mismatch errors on dedicated server hosting from Atlantic.Net!
### Linux unlink Command Guide with Examples
The unlink command in Linux is used to delete a single file by removing its directory entry. This operation is quite low-level compared to rm, and it doesn’t prompt for confirmation or provide any output unless an error occurs.
In this guide, we’ll explore how the unlink command works, its syntax, and practical examples of its usage.
Syntax of the unlink Command
The basic syntax of the unlink command is:
unlink filename
Where:
filename: The file you want to remove.
The unlink command doesn’t support options or arguments other than the file name.
Example 1: Removing a Single File with unlink
To remove a file using the unlink command, you simply provide the file name as an argument.
unlink file.txt
This command removes file.txt from the current directory. Once executed, the file is deleted, and no confirmation or output is provided unless there is an error.
Example 2: Handling Permission Errors
If you don’t have the necessary permissions to delete a file, unlink will return a permission denied error.
unlink protected_file.txt
Output:
unlink: cannot unlink 'protected_file.txt': Permission denied
To resolve this, use sudo to run the command with superuser privileges:
sudo unlink protected_file.txt
This will bypass the permission issue and remove the file.
Example 3: Deleting Symbolic Links with unlink
The unlink command can also be used to remove symbolic links. It works the same way as with regular files, but it only removes the link and not the actual file it points to.
Step 1: Create a Symbolic Link
ln -s original_file.txt symlink.txt
Step 2: Remove the Symbolic Link
unlink symlink.txt
Example 4: Handling File Paths with unlink
When using unlink, you can specify either relative or absolute paths to remove a file located in another directory.
unlink /home/user/documents/file.txt
This command removes the file located at /home/user/documents/file.txt.
Conclusion
The unlink command in Linux is a simple yet powerful tool for safely and precisely deleting individual files. While it lacks the advanced features of rm, its single-file focus makes it ideal for use in scripts and tasks where caution is required. Learn how to use the unlink command in Linux with practical examples on dedicated server hosting from Atlantic.Net!
### Fix “Access Denied” Error Using systemctl as root
When managing services on a Linux system, the systemctl command is the primary tool for starting, stopping, enabling, and checking the status of services. However, even when executing commands as root, users may sometimes encounter the frustrating “Access Denied” error while using systemctl. This error can occur due to various reasons, including permission issues, incorrect configurations, or problems with systemd itself.
In this guide, we’ll explore the common causes of the “Access Denied” error when using systemctl and provide practical solutions to resolve it.
Solution 1: Check Permissions and Use sudo Correctly
Even though you're running commands as root, certain actions may require using sudo in front of the systemctl command, especially if you've switched to the root user via su or su -. This is because sudo provides additional security contexts in some cases.
Step 1: Try Using sudo
If you are receiving an "Access Denied" error, prepend sudo to your command:
sudo systemctl start apache2
Step 2: Verify Group Permissions
If you are part of an administrative group, such as wheel or adm, ensure that your user has the appropriate privileges to use systemctl.
Check your group memberships:
groups
If you do not belong to an administrative group, you can add your user to the appropriate group with the following command:
sudo usermod -aG wheel your_username
Log out and log back in for the changes to take effect.
Solution 2: Disable SELinux or AppArmor Temporarily
SELinux (Security-Enhanced Linux) and AppArmor are security modules that can restrict actions even for the root user. If these are enabled, they may block access to certain system resources.
Step 1: Check SELinux Status
To see if SELinux is enabled, run:
sestatus
Step 2: Temporarily Disable SELinux
If SELinux is causing the issue, you can temporarily disable it by editing the configuration file.
Open the SELinux configuration file:
sudo nano /etc/selinux/config
Change the SELINUX directive to disabled:
SELINUX=disabled
Save the file and reboot the system:
sudo reboot
Step 3: Check AppArmor Status
If your system uses AppArmor instead of SELinux, check its status with:
sudo aa-status
To disable AppArmor temporarily, use:
sudo systemctl stop apparmor
If disabling SELinux or AppArmor resolves the issue, you may need to fine-tune their security policies to allow access without fully disabling them.
Solution 3: Check Unit File and Service Permissions
The "Access Denied" error can also occur if the unit file of the service you’re trying to manage has incorrect permissions or configurations.
Step 1: Inspect the Unit File
Locate the unit file for the service that’s causing the issue (e.g., Apache):
sudo systemctl cat apache2
Check the unit file for any restrictions that could be blocking access.
Step 2: Check Service File Permissions
Verify that the unit file has the correct ownership and permissions:
ls -l /etc/systemd/system/apache2.service
Ensure that root has ownership and that the permissions are set correctly. If necessary, fix them with:
sudo chown root:root /etc/systemd/system/apache2.service
sudo chmod 644 /etc/systemd/system/apache2.service
Step 3: Reload systemd Configuration
After making any changes, reload the systemd configuration to apply them:
sudo systemctl daemon-reload
Solution 4: Troubleshooting systemctl Errors with Logs
If the above steps don’t resolve the "Access Denied" error, it’s helpful to check the system logs for more information.
Step 1: Check the Journal Logs
The journalctl command provides logs for system services managed by systemd. To view recent logs related to systemctl, run:
sudo journalctl -xe
This will display detailed logs that may contain information on why access is being denied.
Step 2: Check Specific Service Logs
If the issue is related to a specific service, you can filter logs by that service. For example, to view logs for the Apache service:
sudo journalctl -u apache2
Review the logs for any permission errors or access denials.
Conclusion
The “Access Denied” error when using systemctl as root can be frustrating, but it is usually caused by permission issues, misconfigured Polkit rules, or restrictions imposed by SELinux or AppArmor. By following the solutions outlined in this guide, you can diagnose and resolve the error, allowing you to manage your Linux services effectively. Fixing the "Access Denied" error using systemctl as root is made easy with dedicated server hosting from Atlantic.Net!
### List All Linux Services Starting at Boot
Linux services play a crucial role in the system's functionality, and knowing which services start at boot can help in system administration, troubleshooting, and performance optimization. Services that start automatically at boot are usually managed by systemd, the default service manager in most modern Linux distributions.
In this guide, we will explore various methods to list all Linux services that are enabled to start at boot.
Method 1: Using systemctl to List Services at Boot
The systemctl command is part of the systemd service manager and is the most common way to list services that are enabled to start at boot.
systemctl list-unit-files --type=service --state=enabled
Output:
UNIT FILE STATE
sshd.service enabled
apache2.service enabled
cron.service enabled
networking.service enabled
Method 2: Checking the Status of a Specific Service
To check whether a specific service is enabled to start at boot, use the systemctl is-enabled command.
systemctl is-enabled sshd
Output:
enabled
This confirms that the sshd service is enabled to start at boot. If the service is disabled, the output will be:
disabled
Method 3: Using systemctl list-dependencies for a Deeper View
The list-dependencies option in systemctl provides a hierarchical view of dependencies for systemd targets, including the services that start at boot under specific targets like multi-user.target (used for multi-user systems with networking).
systemctl list-dependencies multi-user.target
Output:
multi-user.target
● ├─apache2.service
● ├─cron.service
● ├─networking.service
● ├─sshd.service
● └─remote-fs.target
This shows that services like apache2, cron, networking, and sshd are dependencies of multi-user.target, meaning they start when the system enters this target (usually during boot).
Method 4: Listing Services by Boot Target
In systemd, services are organized under different targets that define specific system states. For example, multi-user.target is a common target for servers, and graphical.target is used on desktops with a GUI. You can list the services associated with a specific boot target.
systemctl list-dependencies graphical.target
Output:
graphical.target
● ├─gdm.service
● ├─cups.service
● ├─NetworkManager.service
● └─multi-user.target
Method 5: Using chkconfig for Older Linux Systems
On older Linux systems that use SysVinit instead of systemd, the chkconfig tool is used to manage and list services that start at boot.
chkconfig --list
Output:
sshd 0:off 1:off 2:on 3:on 4:on 5:on 6:off
httpd 0:off 1:off 2:on 3:on 4:on 5:on 6:off
Note: chkconfig is largely obsolete on modern Linux systems that use systemd, but it’s still useful on older systems.
Method 6: Viewing All Running Services
In addition to listing services that are enabled at boot, you might want to see all services that are currently running. Use the following systemctl command to display active services:
systemctl list-units --type=service --state=running
Output:
UNIT LOAD ACTIVE SUB DESCRIPTION
cron.service loaded active running Regular background program processing daemon
sshd.service loaded active running OpenSSH Daemon
apache2.service loaded active running The Apache HTTP Server
Method 7: Using journalctl to Check Boot Services
You can use journalctl to examine the system boot logs and verify which services started during boot.
journalctl -b
This command will show detailed logs, including messages about which services started, their status, and any potential errors encountered during boot.
Conclusion
Knowing which services are enabled to start at boot is essential for Linux system administration, helping you manage system resources, optimize performance, and troubleshoot boot issues. With systemctl, you can easily list, enable, or disable services, providing fine-grained control over your system’s behavior at startup. Listing all Linux services starting at boot is straightforward on dedicated server hosting from Atlantic.Net!
### How to Check Available Free Disk Space on Linux
Managing disk space is crucial for ensuring the optimal performance of a Linux system. Running out of disk space can lead to critical failures, including system crashes and service downtime. Therefore, regularly checking the available free disk space is an essential task for system administrators and users alike.
In this guide, we’ll explore various methods to check free disk space on Linux. We’ll cover tools such as df, du, lsblk, ncdu, and others, along with practical examples to help you monitor disk usage effectively.
Method 1: Using the df Command
The df (disk free) command is one of the most commonly used tools to check disk space on Linux. It provides a quick overview of the disk usage for all mounted file systems.
Basic Syntax of df:
df [options] [file]
By default, df displays the disk space usage for all mounted file systems.
Example: Display Free Disk Space
df -h
Output:
Filesystem Size Used Avail Use% Mounted on
udev 3.9G 0 3.9G 0% /dev
tmpfs 798M 11M 787M 2% /run
/dev/sda1 50G 20G 28G 42% /
tmpfs 3.9G 44K 3.9G 1% /dev/shm
tmpfs 5.0M 4.0K 5.0M 1% /run/lock
/dev/sdb1 100G 75G 25G 75% /data
Explanation:
Size: Total size of the file system.
Used: Amount of space used.
Avail: Available free space.
Use%: Percentage of space used.
Mounted on: The file system’s mount point.
Method 2: Using du to Check Directory Usage
The du (disk usage) command shows the space used by files and directories.
1. Check Space Usage of a Specific Directory
du -sh /var/log
Output:
500M /var/log
2. Display Disk Usage of Subdirectories
du -h --max-depth=1 /home
Output:
4.0K /home/lost+found
12G /home/user1
8.0G /home/user2
20G /home
This will shows disk usage for each top-level subdirectory inside /home.
Method 3: Using lsblk for Block Device Information
The lsblk (list block devices) command provides detailed information about all block devices, including disk space and partitioning. While it does not directly show free space, it is useful for understanding how disks are partitioned.
lsblk
This shows the block devices, their sizes, and their mount points. It’s useful for visualizing how storage is allocated across different partitions and disks.
NAME MAJ:MIN RM SIZE RO TYPE MOUNTPOINT
sda 8:0 0 50G 0 disk
├─sda1 8:1 0 50G 0 part /
sdb 8:16 0 100G 0 disk
└─sdb1 8:17 0 100G 0 part /data
Method 4: Using df with File Systems
Sometimes, you might want to check the available space for specific file systems or partitions. You can do this by specifying the file system as an argument to df.
Example: Check Free Space for /home
df -h /home
Output:
Filesystem Size Used Avail Use% Mounted on
/dev/sda1 50G 30G 20G 60% /home
This command shows disk usage for the /home directory.
Method 5: Monitoring Disk Usage in Real-Time
For real-time monitoring of disk usage, you can use watch in combination with df to keep an eye on free disk space as it changes.
watch -n 5 df -h
Explanation
watch -n 5: Runs the df -h command every 5 seconds and updates the output in the terminal.
Conclusion
Monitoring disk space is a critical task in Linux system administration. By using tools like df, du, and lsblk, you can effectively track disk usage, identify potential issues, and manage space efficiently. Checking available free disk space on Linux is effortless with dedicated server hosting from Atlantic.Net!
### Linux xargs Command Guide with Examples
The xargs command in Linux is a handy tool used for building and executing command lines from standard input. It allows you to take the output of one command and pass it as arguments to another command, making it a versatile tool for handling bulk operations efficiently.
In this guide, we will explore the various uses of xargs with practical examples.
What Is xargs?
xargs takes input from standard input (or the output of another command) and converts it into arguments for another command. It is particularly useful when dealing with commands that cannot handle input piped directly to them.
Syntax of xargs:
command | xargs [options] [command]
Explanation:
command: The command whose output will be used as input for xargs.
options: Various options to control how xargs processes the input.
command: The command that xargs will run using the input.
Example 1: Basic Usage of xargs
To understand the basic functionality of xargs, let’s start with a simple example. Suppose you have a list of filenames that you want to delete. Instead of passing each file to rm individually, you can use xargs to pass the list in bulk.
echo file1 file2 file3 | xargs rm
Explanation
echo file1 file2 file3: Prints the filenames to standard output.
xargs rm: Takes the filenames as input and runs the rm command on each file.
Example 2: Handling Multiline Input
Often, you will need to handle multiline input. By default, xargs treats input as space-separated, but it can be configured to handle newline-separated input as well.
echo -e "file1\nfile2\nfile3" | xargs rm
The -e option with echo ensures that newlines are preserved in the input. xargs processes each line separately and passes it as arguments to the rm command, deleting the files.
Example 3: Using find with xargs
A common use case for xargs is with the find command. When you use find to locate files, you may want to pass the list of files to another command, such as rm or cp. xargs allows you to do this efficiently.
find . -name "*.txt" | xargs rm
Explanation
find . -name "*.txt": Finds all .txt files in the current directory and its subdirectories.
xargs rm: Deletes each .txt file found by find.
Example 4: Limiting the Number of Arguments
By default, xargs passes as many arguments as possible to the command. However, you can limit the number of arguments passed per execution using the -n option.
find . -name "*.log" | xargs -n 5 rm
Explanation:
xargs -n 5 rm: This limits xargs to passing only 5 arguments (files) to the rm command at a time. If there are more than 5 .log files, xargs will run rm multiple times, each time with up to 5 files.
Example 5: Using xargs with Interactive Commands
Sometimes, you may want to confirm actions before proceeding. The -p option in xargs prompts you before running each command.
find . -name "*.tmp" | xargs -p rm
Explanation:
xargs -p rm: For each .tmp file found, xargs will ask for confirmation before deleting it. This is useful when you want to be cautious about deleting files.
Example 6: Combining xargs with Other Commands
You can combine xargs with various commands, such as mkdir, cp, or mv, to perform bulk operations.
1. Creating Multiple Directories
echo "dir1 dir2 dir3" | xargs mkdir
In this example, xargs mkdir takes the directory names (dir1, dir2, dir3) as input and passes them to mkdir to create multiple directories in one go.
2. Copying Files to Another Directory
echo "file1 file2 file3" | xargs -I {} cp {} /path/to/destination/
Explanation:
-I {}: Defines {} as a placeholder for each input item.
cp {} /path/to/destination/: Copies each file (e.g., file1, file2, file3) to the specified destination directory.
Example 7: Running Commands in Parallel
You can use the -P option to run commands in parallel, which can speed up the execution when dealing with a large number of files.
find . -name "*.log" | xargs -P 4 rm
Explanation:
xargs -P 4 rm: Runs up to 4 instances of rm in parallel to delete the .log files. This can significantly improve performance for tasks that involve many files.
Example 8: Stopping on Errors
If you want xargs to stop executing commands when an error occurs, use the -e option.
find . -name "*.bak" | xargs -e rm
Explanation:
xargs -e rm: Stops execution if rm returns an error. This is useful when you want to halt further operations if a critical error occurs.
Conclusion
The xargs command is an essential tool for anyone working with Linux, especially when dealing with large datasets or file management tasks. Master the xargs command in Linux with practical examples on dedicated server hosting from Atlantic.Net!
### Find Lines Containing Specific Words in Linux
When working with text files or log files in Linux, you often need to search for lines containing specific words or patterns. This is a common task for system administrators, developers, and anyone dealing with large datasets or configurations. Fortunately, Linux provides powerful tools that allow you to search for specific words efficiently.
In this article, we’ll explore several methods to find lines containing specific words in Linux using command-line tools like grep, sed, awk, and others.
Method 1: Using grep to Find Lines Containing Specific Words
The grep command is the most commonly used tool for searching text in Linux. It is fast, flexible, and allows you to search files or command output for lines containing specific words or patterns.
Basic Syntax of grep:
grep [options] 'pattern' file
Explanation:
pattern: The word or regular expression you want to search for.
file: The file in which you want to search.
Example 1: Searching for a Specific Word in a File
grep 'error' /var/log/syslog
This command will search for all lines containing the word "error" in the /var/log/syslog file.
Example 2: Case-Insensitive Search
To ignore case while searching, use the -i option:
grep -i 'error' /var/log/syslog
This will return both "error" and "Error."
Example 3: Search Recursively in Directories
If you need to search across multiple files in a directory, use the -r option for recursive searching:
grep -r 'error' /var/log/
This command will search for "error" in all files and subdirectories inside /var/log/.
Example 4: Invert Search
To find lines that do not contain a specific word, use the -v option:
grep -v 'error' /var/log/syslog
This will return all lines except those containing "error."
Method 2: Using awk to Find Specific Words
awk is a more advanced text-processing tool that allows you to search, filter, and manipulate text. While not as simple as grep, it provides greater flexibility.
Basic Syntax of awk:
awk '/pattern/ {action}' file
Explanation:
/pattern/: The word or pattern to search for.
{action}: The action to perform when a match is found.
Example 1: Finding Lines Containing a Word
awk '/error/ {print}' /var/log/syslog
This command will print all lines containing the word "error" in the file /var/log/syslog.
Example 2: Case-Insensitive Search in awk
To perform a case-insensitive search, you can convert both the input and search word to lowercase:
awk '{ if(tolower($0) ~ /error/) print }' /var/log/syslog
This ensures that both "error" and "Error" are matched.
Method 3: Using sed to Find and Display Lines
sed is a stream editor that can be used for searching, finding, and even modifying text. It is less commonly used for simple searches but offers powerful capabilities.
Basic Syntax of sed:
sed -n '/pattern/p' file
Explanation:
-n: Suppresses automatic printing of lines.
/pattern/p: Prints lines that match the pattern.
Example 1: Find and Print Lines Containing a Word
sed -n '/error/p' /var/log/syslog
This command will print all lines that contain the word "error."
Example 2: Invert Search Using sed
To print all lines not containing the word "error," use:
sed '/error/d' /var/log/syslog
This command deletes all lines containing "error" and prints the rest.
Method 4: Using find with grep for Specific Files
If you want to find specific words in files based on file type or other criteria, you can combine the find command with grep.
Example: Searching for a Word in All .log Files
find /var/log -name "*.log" -exec grep 'error' {} \;
This command searches for the word "error" in all .log files under the /var/log directory.
Conclusion
Finding lines containing specific words in Linux can be easily done using powerful command-line tools such as grep, awk, sed, and others. Each tool offers its own set of features, making them suitable for various tasks, from simple text searches to advanced filtering and processing. Discover how to find lines containing specific words in Linux on dedicated server hosting from Atlantic.Net!
### How to Resolve dpkg Error [2] in Linux
Ubuntu/Debian Linux users may occasionally encounter issues with the dpkg package management system, including the commonly reported dpkg: error: [2]. This error typically occurs due to problems with file permissions, incomplete installations, or file system corruption.
In this guide, we will explore the root causes of this error and provide step-by-step solutions to resolve it.
What Is dpkg?
dpkg is the low-level package manager used in Debian-based Linux distributions, including Ubuntu. It handles installing, configuring, upgrading, and removing software packages. When dpkg runs into issues, package installations and upgrades may fail, potentially leaving the system in an inconsistent state.
Understanding dpkg Error [2]
The dpkg error [2] generally indicates a problem related to file access or permissions. It usually comes with an error message that looks like:
dpkg: error processing archive (--install):
unable to access file: Input/output error [2]
This error can arise when:
The system is unable to access or modify necessary files due to file system corruption.
Incorrect permissions on certain directories or files block dpkg from functioning properly.
Temporary issues with file locks or incomplete installations.
Now, let's dive a deep to resolve dpkg error [2].
Step 1: Check Disk Health
The first step is to ensure there are no underlying disk issues that are causing the error. We can do this by checking the integrity of the file system.
1. Open the terminal and run the following command to check the disk for errors:
fsck -Af -M
Explanation:
fsck is the Linux utility to check and repair the file system.
-A runs the check on all file systems listed in /etc/fstab.
-f forces a file system check, and -M skips mounted file systems.
2. After the disk check, reboot the system:
reboot
This will ensure that any file system corruption is fixed.
Step 2: Reconfigure dpkg
If the error persists, reconfiguring dpkg can help resolve issues caused by incomplete or broken package installations.
1. Use the following command to reconfigure all partially installed packages:
dpkg --configure -a
This command checks for packages that are not fully configured and attempts to complete their installation.
2. After running this command, try installing or updating the problematic package again.
Step 3: Clean Up Package Cache
Sometimes, the package cache may be corrupted, causing errors. Cleaning up the cache can help.
1. Remove all partially downloaded and cached packages:
apt-get clean
This command clears the local repository of downloaded package files and resolves issues caused by corrupted or incomplete downloads.
2. Update the package lists:
apt-get update
3. Now, try re-installing the package:
apt-get install package_name
Step 4: Verify Permissions on /var/lib/dpkg
The dpkg package manager uses the /var/lib/dpkg directory to store its data, including information about installed packages. If the permissions on this directory are incorrect, dpkg may not be able to function properly.
1. Verify that the directory is owned by the root user and has the correct permissions:
ls -ld /var/lib/dpkg
The output should look like this:
drwxr-xr-x 7 root root 4096 Oct 19 10:10 /var/lib/dpkg
2. If the ownership or permissions are incorrect, fix them with the following commands:
chown -R root:root /var/lib/dpkg
chmod -R 755 /var/lib/dpkg
3. After fixing the permissions, re-run the package installation or update.
Step 5: Remove Lock Files
Lock files in the /var/lib/dpkg/ or /var/cache/apt/archives/ directories can prevent dpkg from working correctly. You may need to remove these lock files if they were not cleaned up properly.
1. Check for lock files in the relevant directories:
rm /var/lib/dpkg/lock
rm /var/lib/apt/lists/lock
rm /var/cache/apt/archives/lock
2. After removing the lock files, re-run the dpkg configuration command:
dpkg --configure -a
Conclusion
dpkg: error [2] is typically related to file system or permission issues, but it can also stem from package corruption or incomplete installations. In this guide, we’ve outlined multiple ways to resolve the error, including checking disk health, reconfiguring dpkg, cleaning up package caches, and adjusting file permissions. Follow the above guide to resolve dpkg Error [2] if it appears on dedicated server hosting from Atlantic.Net!
### Grant SFTP User Access to /var/www Directory
When managing web servers, it's common to provide users with secure access to the website’s files. One way to do this is by granting SFTP (Secure File Transfer Protocol) access to the /var/www directory. This allows users to upload, download, and manage website files securely without granting full SSH access.
In this article, we will walk through the process of creating an SFTP user and restricting their access to the /var/www directory.
Step 1: Create a New SFTP User
We'll create a new user specifically for SFTP access. This user will not need SSH access, which helps maintain security.
adduser sftpuser
This command creates a new user named sftpuser. You’ll be prompted to set a password and optional information like name and contact details. Follow the instructions to complete the setup.
Step 2: Modify SSH Configuration for SFTP
To restrict sftpuser to SFTP-only access, we need to modify the SSH configuration file.
1. Open the SSH configuration file:
nano /etc/ssh/sshd_config
Add the following at the end of the file:
Match User sftpuser
ChrootDirectory /var/www
ForceCommand internal-sftp
AllowTcpForwarding no
X11Forwarding no
Explanation:
Match User: Limits the settings to sftpuser.
ChrootDirectory: Restricts the user’s root directory to /var/www.
ForceCommand internal-sftp: Ensures the user can only use SFTP.
AllowTcpForwarding and X11Forwarding: Disable unnecessary services.
2. Save and close the file.
Step 3: Set Permissions on /var/www
To allow sftpuser to write in /var/www, we need to adjust the permissions.
1. Change the ownership of /var/www to root:
chown root:root /var/www
This ensures that sftpuser can access but not modify anything outside the /var/www directory.
2. Create a subdirectory in /var/www where the SFTP user can upload files:
mkdir /var/www/sftpuser_uploads
3. Set ownership of the subdirectory to sftpuser:
chown sftpuser:sftpuser /var/www/sftpuser_uploads
4. Adjust the permissions to allow read and write access:
chmod 755 /var/www
chmod 755 /var/www/sftpuser_uploads
These commands set the permissions so that sftpuser can upload and manage files inside sftpuser_uploads.
Step 4: Restart the SSH Service
After updating the configuration and permissions, restart the SSH service:
systemctl restart ssh
Step 5: Test SFTP Access
Now that the configuration is in place, you can test SFTP access.
1. Use an SFTP client like FileZilla or the command line to connect:
sftp sftpuser@your_server_ip
2. Navigate to /var/www/sftpuser_uploads and upload files. The user should only be able to modify files within this directory.
Conclusion
In this guide, we created an SFTP user and restricted their access to the /var/www directory. We also set permissions to allow them to manage files within a specific subdirectory. This setup ensures the security of the web files while allowing the SFTP user to perform their tasks. You can now easily grant SFTP user access to the /var/www directory on dedicated server hosting from Atlantic.Net!
### How to Disable Avahi-Daemon in Linux
Avahi-Daemon is a service that plays an important role in local network discovery on Linux systems. It facilitates communication between devices using the mDNS (Multicast DNS) and DNS-SD (DNS Service Discovery) protocols, allowing them to discover services such as printers, file shares, and more without manual configuration.
However, in certain environments, such as production servers or devices where minimizing the attack surface is critical, you may want to disable Avahi-Daemon to enhance security, reduce unnecessary network traffic, or save system resources.
This guide will walk you through how to properly disable Avahi-Daemon in Linux.
Checking Whether Avahi-Daemon Is Running
Before disabling Avahi-Daemon, you should verify if it is currently active.
Use the systemctl command to check if Avahi-Daemon is running:
systemctl status avahi-daemon
If the status shows "active (running)" then Avahi-Daemon is currently enabled and operational. If you decide to disable it, follow the next steps.
Stopping Avahi-Daemon
If you want to stop Avahi-Daemon temporarily, you can use the following command. This will stop the service until the system is rebooted.
systemctl stop avahi-daemon
The stop command halts the Avahi-Daemon service immediately, but it will not prevent it from restarting on the next boot.
Disabling Avahi-Daemon Permanently
To ensure that Avahi-Daemon does not start again after a reboot, you need to disable it permanently.
Use the following command to disable Avahi-Daemon:
systemctl disable avahi-daemon
The disable command removes the links that cause Avahi-Daemon to start automatically at boot, ensuring it stays inactive.
Masking Avahi-Daemon for Additional Security
For extra security, you can mask the Avahi-Daemon service. Masking prevents it from being started manually or by other services.
Use the following command to mask the service:
systemctl mask avahi-daemon
Masking a service links its unit file to /dev/null, making it impossible to start the service.
Removing Avahi-Daemon
If you are sure that Avahi-Daemon is not required on your system, you can also choose to remove it completely.
For Debian-based distributions like Ubuntu, use:
apt remove avahi-daemon
For Red Hat-based distributions, use:
yum remove avahi
Conclusion
Disabling Avahi-Daemon can be a practical way to enhance the security and performance of your Linux system, especially if the service is not needed. Before deciding to disable Avahi-Daemon, carefully consider your use case. While it provides useful service discovery features in certain environments, it can pose a security risk in others. You can now disable Avahi daemon on dedicated server hosting from Atlantic.Net!
### How to Install a Specific Package Version Using Snap
Snap is a universal package management system developed by Canonical, which allows developers and users to distribute and install software easily across various Linux distributions. Snap packages are sandboxed, automatically updated, and compatible across multiple platforms, making them a popular choice for both developers and end users.
In this guide, we’ll show you how to install a specific version of a package using Snap.
Installing Snap and Setting Up the Environment
Before you can use Snap to install specific versions of packages, you need to have Snap installed on your system. Most modern Linux distributions, like Ubuntu, come with Snap pre-installed. If it’s not installed, follow the steps below.
First, update your package list and then install Snap:
apt update
apt install snapd
Verify that Snap has been installed correctly by running:
snap version
Searching for Available Package Versions
Snap packages are available in multiple versions, often distributed through different channels. To install a specific version, you first need to find out which versions are available.
To see all available versions of a Snap package, use the snap info command:
snap info package-name
Example: Searching for available versions of the node package:
snap info node
Installing a Specific Version Using Snap
Once you have identified the version you want to install, you can specify the channel to install that version.
Installing from a Specific Channel
To install a specific version of a package, use the --channel option followed by the desired version and channel name.
snap install package-name --channel=version/stable
Example: Installing Node.js version 14 from the stable channel:
snap install node --channel=14/stable
--channel=14/stable: Specifies the version (14) and the channel (stable) from which the Snap should be installed.
Other Channels: Beta and Edge
In addition to the stable channel, you can also choose candidate, beta, or edge channels to install the latest development versions:
snap install package-name --channel=version/edge
Example: Installing the latest beta version of Docker:
snap install docker --channel=19.03/beta
Switching Between Installed Versions
Snap allows you to easily switch between different versions of an installed package without uninstalling.
Using snap refresh to Switch Versions
To switch to a different version of an already installed Snap, use the snap refresh command:
snap refresh package-name --channel=desired-version/stable
Example: Switching to Node.js version 14:
snap refresh node --channel=14/stable
Reverting to a Previous Version
If you want to revert to the previous version after an update, use:
snap revert package-name
Conclusion
Snap provides an easy and convenient way to install specific versions of packages. With Snap, you can also switch between versions and revert to previous ones with ease, helping you maintain control over your software environment. You can now get started using Snap package manager on dedicated server hosting from Atlantic.Net!
### Run BASIC Code in the Linux Terminal
BASIC, which stands for "Beginner's All-purpose Symbolic Instruction Code," was one of the earliest and most accessible programming languages. Created in the 1960s, it became immensely popular in the 1980s due to its ease of use and was widely used in education and on early personal computers.
This guide will show you how to run BASIC code directly in a Linux terminal using various tools and interpreters.
Setting up a BASIC Interpreter on Linux
To run BASIC programs in a Linux terminal, you need a BASIC interpreter. Fortunately, several interpreters are available, including BASIC-256, FreeBASIC, and cbmbasic. In this guide, we will use cbmbasic, which is a reimplementation of the original Commodore 64 BASIC.
You can install cbmbasic using the default package manager in many Linux distributions. If you are using a Debian-based system like Ubuntu, use the following command:
apt install cbmbasic
For Red Hat-based distributions, you can use:
yum install cbmbasic
Once installed, you will be able to run BASIC code in the terminal.
Writing Your First BASIC Program
Let’s start by writing a simple BASIC program. You can use any text editor, such as nano, vim, or gedit, to create a new BASIC file.
Open your text editor and type the following lines of code:
10 PRINT "Hello, World!"
20 END
Save the file as hello.bas.
Explanation:
Line 10: The PRINT statement is used to display a message on the screen.
Line 20: The END statement indicates the end of the program.
Running BASIC Code in the Terminal
Now that you have created your first BASIC program, you can run it using the cbmbasic interpreter.
To execute your BASIC program, type the following command in your terminal:
cbmbasic hello.bas
The cbmbasic interpreter reads the hello.bas file and executes the code, displaying the message "Hello, World!" in the terminal.
Hello, World!
Interactive Mode in BASIC Interpreters
In addition to running scripts, cbmbasic also allows you to start an interactive BASIC session. This can be useful for experimenting with code and learning how BASIC works in real time.
To start an interactive session, type:
cbmbasic
You will see a prompt where you can enter BASIC commands directly.
At the interactive prompt, you can type:
PRINT "This is BASIC in action!"
Output:
This is BASIC in action!
You can also perform calculations or try different commands without writing a full program file.
Practical Use Cases and Examples
BASIC may be simple, but it can still perform interesting tasks. Here are a few practical examples.
Example 1: Writing a Loop to Print Numbers from 1 to 10
Open a text editor and write the following code:
10 FOR I = 1 TO 10
20 PRINT I
30 NEXT I
40 END
Save the file as count.bas and run it:
cbmbasic count.bas
Output:
1
2
3
4
5
6
7
8
9
10
Example 2: Creating a Simple Calculator Using INPUT Statements
Create a new BASIC file with the following code:
10 INPUT "Enter first number: "; A
20 INPUT "Enter second number: "; B
30 PRINT "The sum is "; A + B
40 END
Save the file as calculator.bas and run it:
cbmbasic calculator.bas
Output:
Enter first number: 5
Enter second number: 7
The sum is 12
Conclusion
In this guide, we explored how to run BASIC code in the Linux terminal, from setting up an interpreter like cbmbasic to writing and executing BASIC programs. BASIC is a great way to learn programming concepts, and revisiting it can be a fun and educational journey. You can now easily run BASIC code on dedicated server hosting from Atlantic.Net!
### Linux pwd Command Guide with Examples
The pwd command in Linux, which stands for "print working directory," is a handy command that helps users identify their current location within the directory structure. When navigating the Linux filesystem, especially with deep and complex directory trees, knowing your current path is crucial.
This guide will introduce you to the pwd command, explain its options, and provide practical examples to help you better understand how to use it effectively.
Understanding the pwd Command
The pwd command is used to display the absolute path of the current working directory. It helps users confirm where they are within the directory hierarchy.
Basic Syntax:
pwd [options]
pwd: Prints the current working directory.
[options]: Optional flags to modify the command's behavior.
Using the pwd Command
The most basic usage of pwd is to print the current working directory, which gives you the full path from the root directory (/) to your current location.
Example 1: Displaying the Current Directory
To print the current working directory, simply enter:
pwd
Output:
/home/user/Documents
The output shows the absolute path of the current directory, starting from the root (/). In this example, the user is currently in the Documents directory under /home/user.
pwd Command Options
The pwd command has a couple of useful options that can help you work with both logical and physical paths.
Option 1: -L (Logical Path)
The -L option tells pwd to display the logical path, taking into account any symbolic links that might be part of your path.
pwd -L
This option shows the logical current working directory, which may include symbolic links. This is the default behavior of pwd.
Option 2: -P (Physical Path)
The -P option tells pwd to display the physical path, ignoring any symbolic links and showing the actual location on the filesystem.
pwd -P
Example: Suppose you have a symbolic link /home/user/link_to_docs that points to /mnt/storage/Documents. If you navigate through the symbolic link and use pwd with different options as shown below:
cd /home/user/link_to_docs
pwd -L
Output:
/home/user/link_to_docs
Now, run the following command:
pwd -P
Output:
/mnt/storage/Documents
Explanation:
Using pwd -L returns the logical path (/home/user/link_to_docs), while pwd -P returns the physical path (/mnt/storage/Documents). This can be useful when you need to determine the real location of the directory you're working in, especially in environments with multiple symbolic links.
Practical Use Cases of the pwd Command
The pwd command is useful in several real-world scenarios, especially when navigating complex directory structures or working on scripts.
In scripts, using pwd allows you to store the current directory in a variable, ensuring that your script always works with absolute paths. This helps avoid issues when executing commands that depend on a specific directory structure.
Example script:
current_dir=$(pwd)
echo "The script is running in: $current_dir"
Output.
The script is running in: /home/user/scripts
Storing the current directory path in a variable can be particularly useful when you need to navigate away and return to the original directory within a script.
Conclusion
This article provides a comprehensive guide to using the pwd command in Linux. It aims to help beginners understand the command thoroughly while providing enough context for practical, real-world usage. Ppractice using pwd command on dedicated server hosting from Atlantic.Net!
### Linux su Command Guide with Examples
The su command in Linux, which stands for "substitute user" or "switch user," is a powerful utility that allows you to switch to another user's account. The su command is essential for performing administrative tasks that require elevated privileges, such as installing software or modifying system configurations.
In this guide, we will explore how to effectively use the su command with practical examples.
Understanding the su Command
The su command allows you to switch from your current user account to another user account. It’s commonly used to gain superuser privileges by switching to the root user.
Here is a basic syntax:
su [options] [username]
Options:
-: Load the target user's environment as a login shell.
-c: Execute a command as the specified user.
Difference Between su and sudo
su: Switches the user, requiring the target user’s password (usually root). Once switched, you stay as that user until you exit.
sudo: Runs a single command with elevated privileges, requiring the current user’s password. It’s more controlled, as you don't completely switch users.
Switching to Root User
The most common use of su is to switch to the root user, allowing you to perform administrative tasks.
Example 1: Basic Command to Switch to the Root User
To switch to the root user, simply enter:
su
You will be prompted for the root password. After entering the correct password, you will have root privileges.
Password:
[root@hostname ~]#
Switching to Another User
You can also use su to switch to any other user account.
Example 1: Switching to a Different User Account
To switch to a different user account, specify the username:
su - username
You will be asked to provide your user's password:
Password:
[username@hostname ~]$
Running Commands as Another User
You don't always need to switch to an interactive shell; instead, you can run a single command as another user.
Example 1: Running a Single Command as Root
To execute a command as root without switching to a root shell:
su -c "command_to_run"
Example: To create a directory named example_dir in the /root directory:
su -c "mkdir /root/example_dir"
After entering the root password, the command will be executed, and the directory will be created.
Example 2: Running a Command as Another User
You can also run a command as a specific user:
su - username -c "command_to_run"
Example: To list the files in another user's home directory:
su - john -c "ls /home/john"
This allows you to perform specific tasks for another user without fully switching to their account.
Common Errors and Troubleshooting
1. "Authentication Failure"
If you enter an incorrect password, you will see:
su: Authentication failure
Make sure you are using the correct password for the target user. For root, this means knowing the root password, which may be different from your current user password.
2. Permission Issues
If you attempt to use su to switch to a restricted account, you may encounter permission issues:
su: cannot set user id: Permission denied
You need to ensure that you have the proper permissions to switch to the specified user. Only users with sufficient privileges can switch to certain accounts, like root.
Conclusion
The su command is an essential tool for managing Linux systems, allowing you to switch users, run commands as other users, and perform administrative tasks effectively. You can now easily switch between multiple users on dedicated server hosting from Atlantic.Net!
### Move Directory to Another Directory with Identical Name in Linux
In Linux, moving directories is a common task that can become a bit challenging when dealing with directories that have identical names. The mv command is used to move files or directories from one location to another and can also be used to rename them if needed.
This guide will walk you through the steps to move a directory into another location with the same name.
Understanding the mv Command
The mv command is one of the essential tools for managing files and directories in Linux. Here’s the basic syntax for the mv command:
mv [options] source destination
source: The file or directory you want to move.
destination: The target location.
Options:
-i: Prompts before overwriting.
-v: Shows the progress of the move.
-f: Forces the move without prompting for confirmation.
Preparing for the Move
Before moving directories, it's essential to ensure that both the source and destination directories exist and that you have the appropriate permissions to move them.
Step 1: Verify Directory Existence
To check if the source and destination directories exist, use the ls or find commands:
ls /path/to/source_directory
ls /path/to/destination_directory
If the directories exist, you will see their contents listed. Otherwise, an error will indicate that they do not exist.
Step 2: Check Permissions
Ensure that you have sufficient permissions to move the directories. Use the ls -ld command to check permissions:
ls -ld /path/to/source_directory
The output will show the permissions, owner, and group. If you don't have write permissions, you may need to use sudo or change permissions with the chmod command.
Moving a Directory with an Identical Name
Moving a directory into another location with the same name can be done in multiple ways, depending on whether you want to overwrite or merge the content.
Method 1: Overwriting the Destination Directory
If you want to overwrite the existing directory in the destination, use the mv command with the -f (force) option:
mv -f /path/to/source_directory /path/to/destination_directory/
Explanation:
The -f flag forces the move, overwriting files in the destination without prompting for confirmation. This is useful if you're confident that overwriting the existing files is the desired action.
Method 2: Merging the Contents of Both Directories
If you want to merge the contents of the source directory with the destination directory, using the rsync command is a safer and more effective approach:
rsync -av /path/to/source_directory/ /path/to/destination_directory/
Explanation:
rsync is a powerful utility for copying files and directories.
-a ensures that all attributes are preserved (recursive, permissions, etc.).
-v enables verbose output to see the progress.
Handling Conflicts and Avoiding Data Loss
When moving directories with the same name, conflicts can arise, especially if files in the destination have the same names as files in the source. Here are some ways to handle conflicts:
Example 1: Interactive Confirmation Before Overwriting
Using the -i flag prompts you before overwriting existing files, allowing you to decide:
mv -i /path/to/source_directory /path/to/destination_directory/
You will be asked to overwrite:
mv: overwrite '/path/to/destination_directory/file1.txt'? (y/n)
This prompt gives you control over which files to overwrite.
Example 2: Renaming the Destination Directory
To avoid conflicts entirely, you can rename the destination directory before moving the source directory:
mv /path/to/destination_directory /path/to/destination_directory_backup
mv /path/to/source_directory /path/to/destination_directory/
This ensures that the original destination directory is preserved as a backup, and the source directory takes its place.
Conclusion
The mv command is a powerful tool for managing files and directories in Linux, but when dealing with directories that share the same name, careful planning is required. Practice with small tasks and gradually move on to more complex operations to master Linux file management. You can now easily use mv command on dedicated server hosting from Atlantic.Net!
### Linux rpm Command Guide with Examples
The rpm command is a powerful package management tool used in RPM-based Linux distributions like Red Hat, CentOS, Fedora, and openSUSE. It allows users to install, update, verify, query, and remove software packages.
In this comprehensive guide, we'll explore various rpm commands with practical examples to help you efficiently manage your system's software packages.
Installing RPM Packages
The rpm -i command is used to install RPM packages on your system. Below, we will look at some examples of using this command.
Example 1: Installing a Package
To install an RPM package, use the following command:
rpm -i package.rpm
Explanation:
-i stands for install.
package.rpm is the name of the RPM file you want to install.
Example 2: Installing a Package with Verbose Output
The -v and -h options can be added to make the output more informative and user-friendly.
rpm -ivh package.rpm
Explanation:
-v enables verbose mode, providing more detailed output.
-h displays hash marks (#) to show progress during installation.
Updating RPM Packages
To update an installed package, use the rpm -U command. This command can be used to either install a new version or replace an older version of the package.
Example 1: Basic Update Command
To update an existing package, use:
rpm -U package.rpm
Explanation:
-U stands for upgrade, which installs a new version if available or upgrades an existing version.
Example 2: Using the -F Flag to Update Only If Installed
The -F (freshen) option only upgrades a package if an older version is already installed:
rpm -F package.rpm
Explanation:
-F updates only if the package is already installed. It’s useful for applying updates without accidentally installing new packages.
Removing RPM Packages
To remove an installed package, use the rpm -e command.
Example 1: Basic Removal
To remove a package, use:
rpm -e package_name
Explanation:
-e stands for erase, which removes the specified package from the system.
Example 2: Removing a Package with Dependencies
If you want to remove a package without checking dependencies, use the --nodeps flag:
rpm -e --nodeps package_name
Explanation:
--nodeps forces removal without checking for package dependencies. Use this option with caution, as it can cause other packages to break.
Querying RPM Packages
The rpm -q command is used to query information about installed packages.
Example 1: Querying Whether a Package is Installed
To check if a package is installed:
rpm -q package_name
Example 2: Querying Package Details
To get detailed information about an installed package:
rpm -qi package_name
Example 3: Listing All Installed Packages
To list all installed packages:
rpm -qa
Example 4: Querying Files Provided by a Package
To list all files installed by a specific package, use:
rpm -ql package_name
Example 5: Finding the Package That Provides a Specific File
If you want to know which package owns a specific file:
rpm -qf /usr/bin/package_binary
Verifying RPM Packages
The rpm -V command verifies the integrity of installed packages, checking if any files have been altered since installation.
Example 1: Verifying a Specific Package
To verify an installed package:
rpm -V package_name
Conclusion
Understanding the rpm command is crucial for anyone managing RPM-based Linux distributions. It provides powerful and flexible options for installing, updating, removing, verifying, and querying software packages. Try exploring all available rpm command options on dedicated server hosting from Atlantic.Net!
### How to Use scp Command with Specified Port Number in Linux
SCP (Secure Copy Protocol) is a command-line utility that allows users to transfer files between two machines over a network securely. Typically, SCP operates over the default SSH port, 22. However, there are situations where the SSH server is configured to use a non-standard port for enhanced security. In such cases, specifying a port number in the SCP command becomes essential.
In this guide, we'll explore how to use SCP with a specified port number.
Specifying a Custom Port with SCP
To specify a custom port, use the -P flag followed by the port number. Note that the -P option in SCP is uppercase (-P) and not to be confused with the lowercase -p option, which preserves file attributes.
Here is a basic syntax:
scp -P [custom-port] [Source] [Destination]
Let’s go through some practical examples:
Example 1: Copying a File from a Local Machine to a Remote Server
Suppose you want to copy a file named example.txt from your local machine to a remote server running SSH on port 2222:
scp -P 2222 /home/user/example.txt user@remote_host:/home/user/
Explanation:
-P 2222: Specifies the custom port number.
/home/user/example.txt: Path to the source file on the local machine.
user@remote_host:/home/user/: Remote destination, where user is the username and /home/user/ is the target directory on the remote server.
Example 2: Copying a Directory from a Remote Server to a Local Machine
Now, let’s copy an entire directory named project from a remote server to your local machine. The SSH service on the remote server runs on port 2222:
scp -P 2222 -r user@remote_host:/home/user/project /home/local_user/
Explanation:
-P 2222: Specifies the port number.
-r: Copies the entire directory recursively.
user@remote_host:/home/user/project: Source directory on the remote server.
/home/local_user/: Destination directory on the local machine.
Practical Use Cases for Specifying a Custom Port
1. Enhanced Security by Changing Default SSH Port
One of the most common reasons for specifying a custom port is to avoid using the default SSH port, 22. Changing the SSH port can mitigate automated attacks or bots scanning for open SSH ports, and administrators can reduce the likelihood of unauthorized access attempts using a non-standard port.
2. Multiple Services on the Same Host
In environments where multiple services need to be accessed over SSH, different ports can be used to differentiate between them. For instance, one service might use port 2222 while another uses 2022.
Conclusion
SCP is a powerful tool for secure file transfers between machines, and specifying a port number is often necessary in complex or hardened network environments. You can now ensure your file transfers are efficient and secure. You can now easily use scp to transfer files between multiple servers on dedicated server hosting from Atlantic.Net!
### Passing Arguments to Bash Scripts: A Practical Guide
Bash scripts are files containing a series of commands that are executed in sequence by the Bash shell. These scripts are used for everything from simple file management to complex system administration tasks. One of the most essential aspects of Bash scripting is the ability to pass arguments to your scripts. This feature allows scripts to be flexible and dynamic, capable of handling various inputs and performing different actions based on those inputs.
In this article, we will explore how to pass arguments to Bash scripts, the special variables involved, and some real-world examples to illustrate these concepts.
Basics of Passing Arguments to Bash Scripts
When you pass arguments to a Bash script, they are stored in positional parameters, which are special variables:
$0 is the name of the script.
$1, $2, and so on represent the arguments passed to the script.
$# gives the number of arguments passed.
$@ and $* represent all the arguments passed.
Let’s create an example script.
#!/bin/bash
echo "Script name: $0"
echo "First argument: $1"
echo "Second argument: $2"
echo "Total number of arguments: $#"
echo "All arguments: $@"
Now, we'll run this script using the following arguments:
bash script.sh arg1 arg2
Output:
Script name: script.sh
First argument: arg1
Second argument: arg2
Total number of arguments: 2
All arguments: arg1 arg2
In this example, the script prints the script's name, the first and second arguments, the total number of arguments, and all arguments as a list.
Handling Multiple Arguments
If your script needs to handle various arguments, you can loop through them. You can also use the shift command to move through the arguments.
Let's create a script with the following content.
#!/bin/bash
echo "All arguments: $@"
echo "Looping through the arguments:"
while (( "$#" )); do
echo "Argument: $1"
shift
done
Now, we'll run this script:
bash script.sh one two three four
Output:
All arguments: one two three four
Looping through the arguments:
Argument: one
Argument: two
Argument: three
Argument: four
In this example, the while loop continues until no more arguments ($# becomes zero). The shift command moves each argument out of $1, making the next one the first.
Combining Positional Arguments with Flags
Scripts often need to handle options or flags (like -f or --file). Here’s how you can do this using getopts, a built-in command for parsing options.
Here is an example script:
#!/bin/bash
while getopts ":f:o:" opt; do
case $opt in
f) echo "File option passed with value: $OPTARG" ;;
o) echo "Output option passed with value: $OPTARG" ;;
\?) echo "Invalid option: -$OPTARG" ;;
esac
done
Run the above script:
bash script.sh -f input.txt -o output.txt
Output:
File option passed with value: input.txt
Output option passed with value: output.txt
In this example, getopts is used to parse the -f and -o options, and $OPTARG holds the value of each option. If an invalid option is passed, the script catches it and prints an error.
Error Handling: Validating Input
Good scripts should validate input to ensure they have the necessary arguments. This prevents errors or unexpected behavior.
Here is an example script:
#!/bin/bash
if [ $# -lt 2 ]; then
echo "Error: You need to provide at least two arguments."
exit 1
fi
echo "Arguments are valid. Proceeding..."
Run the above script:
bash script.sh one
Output:
Error: You need to provide at least two arguments.
Here, the script checks if fewer than two arguments were provided. If so, it prints an error message and exits.
Conclusion
Passing arguments to Bash scripts allows you to write flexible, reusable, and dynamic scripts. You can now create scripts that handle a variety of inputs, making them more powerful and useful in real-world applications. Try using Bash scripts to automate application deployment on VPS hosting from Atlantic.Net!
### What Is HIPAA Compliance? History, Rules, and Requirements
What Is HIPAA Compliance?
HIPAA compliance refers to adherence to the Health Insurance Portability and Accountability Act, a U.S. regulation established to protect patient health information. It ensures that medical organizations and businesses manage patient data carefully, preventing unauthorized access while maintaining the confidentiality, integrity, and security of health information. HIPAA requires the U.S. healthcare industry to implement proper documentation, training, and security measures for data management.
Compliance with HIPAA is not optional; it's a legal requirement involving complex rules and guidelines. Organizations must conduct regular self-audits, staff training, and thorough risk management to prevent potential breaches and penalties. This framework impacts covered entities, including healthcare providers, insurers, and other related service providers.
This is part of an extensive series of guides about compliance management.
What Is ePHI?
Electronic Protected Health Information (ePHI) refers to any Protected Health Information (PHI) that is created, stored, transmitted, or received in electronic form. ePHI includes sensitive patient data such as medical histories, diagnoses, treatment plans, and billing information that healthcare providers and their business associates handle in digital systems.
The HIPAA Security Rule governs the protection of ePHI, requiring organizations to implement administrative, physical, and technical safeguards to secure this data against unauthorized access and breaches.
History of the HIPAA Regulation
HIPAA was enacted in 1996 and has gone through several changes over the years. Here are the most significant milestones:
1996: HIPAA was signed into law by President Bill Clinton. The primary objective was to improve healthcare efficiency by encouraging the use of electronic data while safeguarding sensitive health information.
2003: The HIPAA Privacy Rule officially took effect, giving patients rights over their health information and setting strict guidelines for healthcare organizations regarding the use and disclosure of PHI.
2005: The HIPAA Security Rule came into effect. It targeted the protection of ePHI, mandating administrative, physical, and technical safeguards to secure digital patient data.
2009: The Health Information Technology for Economic and Clinical Health (HITECH) Act expanded HIPAA's scope, introducing stricter breach notification requirements and higher penalties for non-compliance.
2013: The Omnibus Rule was introduced, amending HIPAA to address emerging technological challenges and expanding the accountability of business associates handling PHI. It also strengthened the rules around privacy and security compliance.
2021: The HIPAA Safe Harbor Law was signed into law, incentivizing organizations to adopt recognized security practices by reducing penalties for those demonstrating a strong security posture during audits or investigations following breaches.
Who Must Comply with HIPAA?
Covered Entities
Covered entities are those directly involved in healthcare operations and include hospitals, clinics, insurance companies, and other related healthcare outfits. These entities handle large volumes of PHI and are responsible for implementing privacy and security safeguards in line with HIPAA regulations. Compliance requires consistent audits and evaluations to minimize risks associated with data breaches or unauthorized access, ensuring patient information remains protected.
They must establish policies, conduct employee training, and adopt technological solutions to manage PHI effectively. Covered entities often face the challenge of balancing information accessibility and security—a critical aspect of achieving HIPAA compliance.
Business Associates
Business associates are involved in performing services for covered entities that involve access to PHI. Examples include IT providers, billing companies, and transcription services. Under HIPAA, these associates must ensure safeguards for PHI, indemnifying the covered entities against possible data breaches or security violations. They are required to sign Business Associate Agreements (BAAs) with covered entities, detailing compliance responsibilities.
These agreements define the business associate's duties, security obligations, and the permissible use and disclosure of PHI. Moreover, business associates should conduct self-audits and establish policies to manage PHI adeptly.
HIPAA Rules and Regulations
The HIPAA regulation includes the following main components:
HIPAA Privacy Rule
The HIPAA Privacy Rule focuses on the national standards for the protection of medical records and personal health information. Enforced in 2003, it mandates the confidentiality of patient information and gives patients rights over their health information, including rights to obtain a copy of their records and request corrections. The rule applies to all forms of PHI, whether electronic, paper, or oral.
Covered entities must implement safeguards to protect PHI, limit its use and disclosure to the minimum necessary for health purposes, and ensure workforce members comply with these standards. Regular training and updated policies are crucial for maintaining adherence to this rule.
HIPAA Security Rule
The HIPAA Security Rule sets standards for securing electronic PHI (ePHI) through administrative, physical, and technical safeguards. Enacted in 2005, it requires covered entities to implement risk management processes to identify and mitigate vulnerabilities. The rule imposes requirements for data encryption, access controls, and audit controls to protect ePHI from cyber threats, ensuring its confidentiality, integrity, and availability.
Organizations must conduct regular risk assessments, develop risk management policies, and ensure workforce training in security practices.
HIPAA Breach Notification Rule
The HIPAA Breach Notification Rule requires covered entities and business associates to notify patients and the U.S. Department of Health and Human Services (HHS) of any security breaches involving unsecured PHI. No later than 60 days after the breach discovery, organizations must inform affected individuals and provide detailed information about the incident, including potential impacts and steps for mitigation.
Business associates must notify covered entities of breaches, enabling timely reporting and corrective actions. This rule establishes transparency and accountability, compelling organizations to take proactive security measures and maintain openness with patients about their data's safety.
HIPAA Transaction Rule
The HIPAA Transaction Rule standardizes electronic transactions involving healthcare information, ensuring efficient and secure exchange of data between healthcare providers, insurers, and other entities. It mandates the use of uniform code sets, formats, and identifiers for electronic transactions like claims, enrollment, and payment processes.
To comply, covered entities must implement systems that support these standardized transactions, ensuring consistent communication across the healthcare industry. This promotes interoperability and enhances the accuracy and security of sensitive patient data during electronic exchanges.
HIPAA Enforcement Rule
The HIPAA Enforcement Rule outlines the procedures for investigating and penalizing violations of HIPAA regulations. It grants the U.S. Department of Health and Human Services (HHS) the authority to investigate complaints, conduct compliance reviews, and impose civil monetary penalties on entities found to be non-compliant with HIPAA’s Privacy, Security, and Breach Notification Rules.
Penalties under this rule are tiered based on the severity and intent of the violation, with fines ranging from $100 to $50,000 per violation. The Enforcement Rule serves as a strong incentive for organizations to prioritize HIPAA compliance and prevent potential breaches.
HIPAA Identifiers Rule
The HIPAA Identifiers Rule requires the use of unique identifiers to improve the efficiency and accuracy of electronic transactions. It introduced three main identifiers: the National Provider Identifier (NPI) for healthcare providers, the Employer Identification Number (EIN) for employers, and the Health Plan Identifier (HPID) for health plans.
Covered entities must use these HIPAA-mandated identifiers when processing transactions, ensuring a consistent and organized method for identifying entities involved in healthcare operations.
HIPAA Omnibus Rule
The HIPAA Omnibus Rule, implemented in 2013, expanded the responsibilities of business associates and covered entities under HIPAA. It introduced modifications to the Privacy, Security, and Breach Notification Rules and enhanced patient rights concerning the use of their information for marketing and research. This rule also addressed provisions regarding the breach notification process and increased penalties for non-compliance.
Under the Omnibus Rule, business associates are now directly liable for compliance with specific HIPAA requirements. It demands covered entities update business associate agreements to reflect enhanced responsibilities and ensures all parties involved in handling PHI understand their obligations.
Recent HIPAA Updates
Here are some of the latest updates to HIPAA that you should be aware of:
FTC updates Health Breach Notification Rule (April 26, 2024): The FTC expanded the scope of its Health Breach Notification Rule to cover health apps and other technologies that are not governed by HIPAA. This update addresses the collection, processing, and transmission of health information by entities outside of HIPAA’s jurisdiction, ensuring broader protection of sensitive health data.
Biden-Harris administration’s new rule for reproductive health care privacy: A new rule has been introduced to strengthen privacy protections specifically for reproductive health care. It safeguards the medical records and health information of women, their families, and healthcare providers involved in accessing or facilitating lawful reproductive care.
OCR updates FAQs on Change Healthcare incident (April 19, 2024): The Office for Civil Rights (OCR) released updated FAQs concerning the Change Healthcare cybersecurity breach. These FAQs clarify how HIPAA rules apply to the breach, which affected multiple healthcare entities, and offer guidance on managing cybersecurity incidents under HIPAA.
What Are the Key HIPAA Compliance Requirements?
Self-Audits
Self-audits allow covered entities and business associates to regularly assess their security practices and identify any weaknesses in safeguarding Protected Health Information. These audits involve reviewing all aspects of HIPAA compliance, including physical, administrative, and technical safeguards, to ensure all areas meet regulatory standards.
Conducting self-audits helps organizations detect potential vulnerabilities before they lead to breaches or violations. Organizations must maintain detailed records of these audits to demonstrate ongoing compliance efforts.
Requirements for self-audits:
Conduct regular risk assessments
Review security policies and procedures
Assess the effectiveness of administrative, physical, and technical safeguards
Document audit results and identified vulnerabilities
Remediation Plans
A remediation plan is developed to address any vulnerabilities or gaps identified during self-audits or external audits. The plan outlines specific steps an organization must take to fix security deficiencies, including timelines, resources needed, and responsible parties. Proper implementation of remediation plans is crucial for avoiding potential breaches and penalties.
The organization must closely monitor the progress of remediation efforts to ensure timely completion. It’s also essential to update the plan as new risks or challenges emerge, ensuring that all security measures remain current.
Requirements for remediation plans:
Identify and prioritize security gaps
Develop a detailed corrective action plan
Assign responsibilities and timelines
Track progress and adjust as needed
Ensure timely completion of remediation efforts
Policies and Procedures
HIPAA requires organizations to establish comprehensive policies and procedures that align with its privacy and security rules. These documents outline how PHI is handled, stored, and protected within the organization.
Additionally, all employees must undergo regular training to understand HIPAA regulations and their roles in maintaining compliance. Training should cover the organization’s policies and procedures, such as proper data handling practices and breach notification procedures.
Requirements for policies, procedures, and training:
Develop HIPAA-compliant policies and procedures
Conduct regular employee training on HIPAA requirements
Update policies as needed
Ensure all staff understand their roles in maintaining compliance
Keep records of training sessions and participant attendance
Business Associate Management
Managing business associates is a key part of HIPAA compliance, as these entities often have access to PHI. Covered entities must establish Business Associate Agreements (BAAs) with all business associates, clearly outlining their responsibilities in protecting PHI and complying with HIPAA rules.
These agreements ensure that business associates are held to the same security standards as the covered entity. Covered entities must also monitor business associates regularly to ensure they meet their obligations, conducting audits and enforcing compliance when necessary.
Requirements for managing business associates:
Establish BAAs
Define responsibilities and compliance expectations
Conduct regular audits of business associates
Terminate agreements with non-compliant associates
Ensure business associates notify covered entities of any breaches
Incident Management
Incident management involves identifying, responding to, and resolving any security breaches or violations that compromise the integrity of PHI. Organizations must have a clear, structured process in place for reporting incidents, investigating the cause, and mitigating any damage.
Proper incident management helps limit the impact of breaches and ensures timely compliance with HIPAA's Breach Notification Rule. A well-defined incident response plan includes steps for notifying affected parties, correcting vulnerabilities, and preventing future incidents.
Requirements for incident management:
Develop a comprehensive incident response plan
Investigate and document all security incidents
Notify affected individuals and HHS within 60 days of a breach
Implement corrective actions to prevent future incidents
Conduct post-incident reviews to assess response effectiveness
Documentation
Maintaining thorough documentation is essential for demonstrating HIPAA compliance. This includes records of policies and procedures, self-audits, employee training, incident reports, and BAAs. Accurate documentation serves as proof that the organization is consistently adhering to HIPAA requirements and is prepared for compliance reviews or audits by regulatory authorities.
Documentation should be securely stored and regularly updated to reflect any changes in processes, ensuring that all compliance efforts are accurately recorded.
Requirements for documentation:
Maintain records of policies, procedures, and compliance activities
Document self-audits and corrective actions
Keep records of employee training sessions
Securely store incident reports and response actions
Update documentation regularly and ensure easy accessibility
What Is a HIPAA Violation?
A HIPAA violation occurs when an entity fails to comply with any aspect of HIPAA regulations, compromising the confidentiality, integrity, or availability of PHI. Violations can result from inadequate safeguarding of patient information, unauthorized access, or failing to implement necessary policies and procedures. These infractions can result in penalties and jeopardize patient trust and reputation.
Common violations include failing to conduct risk assessments, not encrypting PHI, unauthorized disclosures, and not reporting breaches within stipulated timeframes. Preventing violations requires proactive measures, including regular audits, employee training, and strict adherence to HIPAA rules.
HIPAA Penalties for Non-Compliance
The Office for Civil Rights (OCR), under the Department of Health and Human Services (HHS), enforces HIPAA regulations and categorizes violations into four tiers based on the level of severity and negligence. Fines increase depending on the entity's level of awareness and corrective actions taken:
Tier I – Unknowing: The relevant entity was unaware of the violation and could not have reasonably avoided it. Fines range from $100 to $50,000 per violation, with a maximum annual penalty of $1.5 million per provision violated.
Tier II – Reasonable Cause: The entity should have known about the violation but did not act with willful neglect. Penalties range from $1,000 to $50,000 per violation, with the same annual maximum of $1.5 million.
Tier III – Willful Neglect (Corrected)
The entity acted with willful neglect but corrected the issue within 30 days. Fines range from $10,000 to $50,000 per violation.
Tier IV – Willful Neglect (Not Corrected)
The most severe violations, where the entity acted with willful neglect and failed to correct the issue within 30 days. Penalties can reach up to an annual maximum of $1.5 million per provision.
Examples of HIPAA Violations
Anthem, Inc.: In 2015, Anthem, Inc., one of the largest health insurance providers in the U.S., experienced a massive data breach impacting nearly 79 million individuals. Cybercriminals gained unauthorized access to sensitive PHI due to inadequate security measures. As a result, Anthem agreed to a settlement of over $16 million, marking one of the largest settlements in HIPAA history.
New York-Presbyterian Hospital/Columbia University Medical Center: In 2014, these two institutions faced a $4.8 million settlement after PHI for approximately 6,800 patients was inadvertently made accessible to search engines. The breach occurred when a server was improperly deactivated, allowing sensitive patient information to be indexed online. This incident emphasized the importance of securely decommissioning systems that store or transmit PHI.
Memorial Healthcare System: Between 2011 and 2012, Memorial Healthcare System discovered that employees had been accessing patient records without authorization for over a year, affecting over 115,000 patients. This breach of internal controls resulted in a $5.5 million settlement.
HIPAA Compliance Checklist and Best Practices
1. Designate a Privacy Officer
A privacy officer is responsible for developing and implementing privacy policies, procedures, and practices that align with HIPAA regulations. This position requires a deep understanding of both legal requirements and the operational aspects of the organization.
The privacy officer’s duties include overseeing the creation and enforcement of privacy policies, conducting regular risk assessments, and leading training programs for staff to ensure they understand their obligations under HIPAA. Additionally, the privacy officer acts as the main point of contact for any privacy-related issues, handling inquiries, and managing the resolution of complaints or concerns. They are also responsible for coordinating with IT and security teams to implement appropriate technical safeguards.
2. Conduct Risk Assessments
Conducting regular risk assessments is fundamental to maintaining HIPAA compliance. These assessments should be comprehensive, covering all areas where PHI is handled, stored, or transmitted, including physical locations, electronic systems, and administrative processes.
A thorough risk assessment involves evaluating current security measures to determine their effectiveness, identifying vulnerabilities, and assessing the likelihood and potential impact of various threats, such as cyberattacks, data breaches, or natural disasters. The assessment process should be well-documented, detailing the methodologies used, findings, and recommended actions for addressing identified risks.
3. Implement Administrative Safeguards
Administrative safeguards include the policies and procedures that govern the management of PHI. These safeguards are designed to ensure that organizations establish a foundation for protecting PHI by defining roles, responsibilities, and processes that support the security and privacy of health information.
Key aspects of administrative safeguards include:
Development of a HIPAA compliance program, which should outline the organization’s approach to managing PHI, including risk management, incident response, and contingency planning. This program should be tailored to the specific needs of the organization, taking into account its size, complexity, and the types of PHI it handles.
Workforce training—employees at all levels must receive regular training on HIPAA requirements, the organization's privacy policies, and their specific responsibilities in protecting PHI. Training should cover topics such as identifying and reporting potential breaches, safeguarding electronic communications, and handling PHI securely in both digital and physical forms.
Implementation of access controls, ensuring that only authorized personnel have access to PHI. This involves establishing procedures for granting, modifying, and revoking access to information systems, as well as regularly reviewing access logs to detect and respond to any unauthorized access attempts.
4. Implement Physical Safeguards
Physical safeguards protect PHI from physical threats such as unauthorized access, theft, or environmental hazards. These safeguards involve the implementation of security measures that control access to the physical locations where PHI is stored or processed, as well as the protection of the devices and systems that handle PHI.
Important physical safeguards include:
Securing the physical premises, which includes implementing controlled access systems such as keycards, biometric scanners, or security personnel to restrict entry to areas where PHI is stored. This also involves installing surveillance cameras and alarm systems to monitor for unauthorized access attempts.
Protecting hardware and media that contain PHI. This includes securing workstations, servers, and portable devices like laptops and USB drives, using locks, secure cabinets, and proper storage protocols.
Establishing procedures for proper disposal of devices and media containing PHI, such as degaussing, shredding, or using certified destruction services.
Establishing environmental controls—organizations must ensure that their facilities are protected against natural disasters, power failures, and other environmental risks that could compromise the integrity of PHI. This includes implementing backup power systems, fire suppression systems, and climate control measures to safeguard electronic equipment and data.
5. Implement Technical Safeguards
Technical safeguards are the technological measures that protect ePHI and control access to it, ensuring that only authorized individuals can view or manipulate this sensitive information. These safeguards address the specific requirements for securing electronic data against cyber threats, unauthorized access, and data breaches.
Primary technical safeguards include:
Access control mechanisms, including the use of strong, unique passwords, multi-factor authentication, and role-based access controls that limit access to ePHI based on an individual’s job function. This ensures that users only have access to the minimum necessary information required to perform their duties.
Encryption, which protects ePHI by converting it into an unreadable format that can only be decrypted by authorized parties. Encryption should be applied to ePHI both at rest (when stored on devices or servers) and in transit (when being transmitted over networks).
Audit controls, providing a detailed log of who accessed what information, when, and what actions were taken. Regularly reviewing these logs allows organizations to detect and respond to suspicious activities, such as unauthorized access attempts or potential breaches.
Data integrity measures, such as checksums and digital signatures, ensure that ePHI is not altered or tampered with without detection. Organizations should implement regular data backups and use secure methods for transmitting data to prevent unauthorized changes or loss of information.
6. Develop and Enforce Policies and Procedures
Developing and enforcing policies and procedures is vital for ensuring consistent and effective HIPAA compliance across an organization. These policies and procedures provide a framework for how PHI should be handled, from collection and storage to access, transmission, and disposal. They define the roles and responsibilities of employees, outline the organization's approach to managing compliance, and establish the protocols for responding to incidents and breaches.
Organizations must develop detailed policies covering all aspects of HIPAA compliance, including privacy practices, security measures, and breach notification procedures. These policies should be tailored to the specific needs of the organization, considering factors such as its size, the complexity of its operations, and the types of PHI it handles. Policies should also address the use of technology in managing PHI, including the secure use of email, mobile devices, and cloud services.
7. Sign Business Associate Agreements (BAAs)
Signing Business Associate Agreements (BAAs) is a crucial step in ensuring HIPAA compliance when working with third-party vendors or partners who handle PHI. These agreements establish the responsibilities and expectations for both the covered entity and the business associate, outlining the permissible uses and disclosures of PHI, as well as the security measures that must be in place to protect this information.
BAAs should be comprehensive, detailing the specific HIPAA requirements that the business associate must adhere to, including breach notification procedures, data encryption standards, and access controls. The agreement should also specify the consequences of non-compliance, such as termination of the contract or financial penalties.
Covered entities must ensure that all business associates sign BAAs before any PHI is shared. This includes not only primary vendors but also any subcontractors or third parties that the business associate may engage. Regular reviews and updates of BAAs are necessary to reflect any changes in regulations or business practices.
8. Regularly Audit and Monitor Compliance
Regular audits and ongoing monitoring are essential practices for maintaining continuous HIPAA compliance. Audits involve a systematic review of the organization’s policies, procedures, and practices to ensure they meet HIPAA requirements. This includes evaluating the effectiveness of administrative, physical, and technical safeguards, as well as identifying any gaps or weaknesses that could lead to non-compliance.
An audit should cover all aspects of HIPAA compliance, including privacy practices, security measures, employee training, and incident response protocols. The audit process should be documented, with findings reported to senior management and used to inform corrective actions or improvements to the organization’s compliance program. Regular audits not only help ensure ongoing compliance but also prepare the organization for potential external audits by regulatory bodies.
In addition to formal audits, organizations should implement continuous monitoring processes to detect and respond to compliance issues in real time. This includes monitoring access to PHI, reviewing security logs for unusual activity, and tracking employee adherence to privacy and security policies. Monitoring systems can provide early warnings of potential issues, allowing the organization to address them before they escalate into significant violations.
9. Prepare for Breach Notification
Being prepared for breach notifications is a critical aspect of HIPAA compliance, as it ensures that an organization can respond quickly and effectively in the event of a data breach involving PHI. The HIPAA Breach Notification Rule requires organizations to notify affected individuals, the Department of Health and Human Services (HHS), and, in some cases, the media, of any breaches of unsecured PHI.
To prepare for breach notification, organizations should develop a comprehensive breach response plan that outlines the steps to be taken immediately upon discovering a breach. This plan should include procedures for identifying the nature and scope of the breach, containing the breach to prevent further unauthorized access, and assessing the impact on the affected individuals.
The plan should also specify the timelines for notifying affected parties and the required content of the notification, including a description of the breach, the types of PHI involved, and the steps individuals can take to protect themselves.
In addition to internal preparations, organizations should establish relationships with external partners who can assist in breach response, such as legal counsel, cybersecurity experts, and public relations firms. These partners can provide valuable support in managing the breach, complying with notification requirements, and mitigating the potential damage to the organization’s reputation.
HIPAA-Compliant Hosting Services and Solutions by Atlantic.Net
HIPAA-Compliant Hosting by Atlantic.Net™ is SOC 2 and SOC 3 certified, HIPAA and HITECH audited, and designed to secure and protect critical health data, electronic protected health information (ePHI), and records. We are audited by a qualified and an independent third-party CPA firm to validity of our operational controls and compliance services.
HIPAA Compliant Website Hosting
Our HIPAA Compliant Web Hosting Platform is secured to industry standards, providing a highly durable, feature-rich solution, powered by the latest tech, offering breakneck performance - available in both dedicated and cloud server environments and backed by our 100% uptime SLA.
HIPAA-Compliant Cloud Hosting
Security, scalability, high-speed data transfers, and performance are the focus of our Cloud Hosting Solutions. Atlantic.Net’s HIPAA Cloud solutions offer fast provisioning, ongoing management, and round-the-clock monitoring.
Learn more about Atlantic.net HIPAA hosting
See Additional Guides on Key Compliance Management Topics
Together with our content partners, we have authored in-depth guides on several other topics that can also be useful as you explore the world of compliance management.
HIPAA Compliant Hosting
Authored by Atlantic.Net
[Guide] HIPAA-Compliant Hosting | 2025 Award Winning HIPAA Hosting
[Guide] What is Protected Health Information (PHI) in 2025? Atlantic.Net
[Blog] RTLS and Healthcare
[Product] Atlantic.Net HIPAA Compliant Hosting
VPS Hosting
Authored by Atlantic.Net
[Guide] Cloud VPS Hosting | Virtual Private Servers
[Guide] High-Performance & Affordable Linux VPS Hosting
[Blog] Does Using SaaS Make My IT Environment More Secure or Less Secure?
[Product] Atlantic.Net Cloud Platform | Scalable, Secure Cloud Solutions
DORA Regulation
Authored by Faddom
[Guide] DORA Regulation: Requirements, Penalties & Compliance Checklist
[Guide] How the DORA Regulation Impacts IT
[Product] Faddom | Instant Application Dependency Mapping Tool
### How to Add a Directory to PATH in Linux
In Linux, the PATH environment variable determines which directories the system searches for executable files. Adding a directory to the PATH allows you to run scripts or programs located in that directory without specifying the full path each time.
This guide will show you how to temporarily and permanently add a directory to your PATH.
What Is the PATH Environment Variable?
The PATH environment variable is a colon-separated list of directories that the shell searches for executable files when you type a command. When you run a command in the terminal, the system checks these directories to see if the command exists there.
You can view the current value of the PATH by running:
echo $PATH
Output:
/usr/local/sbin:/usr/local/bin:/usr/sbin:/usr/bin:/sbin:/bin:/usr/games:/usr/local/games
In this example, directories like /usr/bin and /usr/local/bin are part of the PATH. Any executable placed in these directories can be run directly from the terminal without specifying its full path.
Why Add a Directory to PATH?
There are many practical scenarios where adding a directory to your PATH is helpful. For instance, you may have custom scripts stored in /opt/my_program/bin. Adding this directory to your PATH allows you to run those scripts from anywhere in the terminal without typing the full path.
Suppose you have scripts or programs in /opt/my_program/bin. By adding this directory to your PATH, you can run:
my_program_script
Instead of typing the full path like so:
/opt/my_program/bin/my_program_script
Temporarily Add a Directory to PATH
Use the export command to add a directory to the PATH for the current terminal session. This change will only last until the terminal is closed.
1. Use the export command to add the directory:
export PATH=$PATH:/opt/my_program/bin
2. Verify the directory has been added:
echo $PATH
Output:
/usr/local/sbin:/usr/local/bin:/usr/sbin:/usr/bin:/sbin:/bin:/usr/games:/usr/local/games:/opt/my_program/bin
3. You can now run any executable in /opt/my_program/bin without specifying the full path. For example:
my_program_script
Note that this change is temporary and will reset once you close the terminal session.
Permanently Add a Directory to PATH
To permanently add a directory to the PATH, you must modify one of your shell's configuration files. Common files include:
.bashrc: Runs for interactive non-login shells.
.bash_profile: Runs for login shells.
.zshrc: If you're using the zsh shell.
Let’s go through the steps to add a directory to the PATH permanently:
1. Open your shell configuration file. In this case, we'll modify .bashrc for bash users.
nano ~/.bashrc
2. Add the following line at the end of the file:
export PATH=$PATH:/opt/my_program/bin
3. Save and exit the file.
4. Apply the changes by running:
source ~/.bashrc
5. Verify the changes by rechecking the PATH:
echo $PATH
Now, the directory /opt/my_program/bin is permanently added to your PATH, and you can run scripts or executables in that directory from any terminal session.
Conclusion
Adding directories to your PATH in Linux makes it easier to run executables or scripts from any location in the terminal. Whether you're adding a directory temporarily or permanently, it’s a simple yet powerful way to streamline your workflow. Now, you can run your custom programs or scripts without having to type out full paths every time. Try to add PATH to the dedicated server hosting from Atlantic.Net!
### What Is IPv6 and Should I Enable It?
Every single computer device connected to a network or the wider Internet uses an Internet Protocol version (IP) to communicate. For decades, IPv4 has served as the backbone of the Internet, but the rapid growth of the Internet has made its limitations increasingly apparent.
IPv6 was chosen as the successor to IPv4 by the Internet Engineering Task Force (IETF), and it has been designed to address the challenges of the modern internet, a place where billions of devices connect and communicate each day. But what exactly is IPv6, and should you enable it on your home or corporate network?
It's quite surprising how long IPv6 technology has been around; believe it or not, its origins go back to 1992, with the draft standardization being agreed upon. Yet even today, IPv6 is not hugely popular when in reality we should all be using it.
In this technical article, we will learn all about IPv6 and discover the difference between using IPv6 locally and across the Internet. We will also try and answer why the adoption of IPv6 has been so slow across the industry, and then discuss the strengths and weaknesses of IPv6.
What Is IPv6?
IPv6, or Internet Protocol version 6, is the most recent version of the Internet Protocol (IP). It serves as the foundation for communication on the internet by assigning unique IP addresses to devices, allowing them to send and receive data.
The core distinction between IPv4 and IPv6 lies in the allocated address space. IPv4 uses 32-bit addresses, limiting the number of available unique addresses to roughly 4.3 billion. In contrast, IPv6 employs 128-bit addresses, offering an astronomical number of IP addresses.
For context, the IPv6 address space works out at approximately 340 undecillion; that unfathomable number looks like this - 340,282,366,920,938,463,463,374,607,431,768,211,456 (according to Pingdom).
Beyond its expanded address space, IPv6 introduces several other benefits:
Eliminating Network Address Translation (NAT): IPv4's address limitations led to the widespread use of NAT, which allows multiple devices to share a single public IP address. IPv6 removes the need for NAT by providing ample IP addresses for every device.
Enhanced Security: IPv6 incorporates IPsec (IP Security) directly into the IP layer, offering built-in authentication and encryption. This strengthens data confidentiality, providing a more secure environment for online activities.
Improved Efficiency: The IPv6 header has been streamlined, leading to more efficient packet processing at routers and potentially saving network bandwidth. Such efficiency enhances the performance of bandwidth-intensive packet flows, such as those encountered in video streaming and large file transfers.
Important IPv6 Terminology
IPv6 is full of acronyms and new terminology you may not be familiar with. Take a few moments to consider these important terms.
Internet Control Message Protocol (ICMPv6): Used for error reporting, network diagnostics, and control messages in IPv6 networks.
Path MTU Discovery (PMTUD): A mechanism used to determine the path's maximum transmission unit (MTU), the largest packet size that can be transmitted without fragmentation.
Neighbor Discovery Protocol (NDP): Replaces ARP in IPv4 and is used for address resolution, router discovery, and prefix discovery in IPv6 networks.
Router Advertisement (RA): Messages sent by routers to announce their presence and provide configuration information to hosts.
Stateless Address Autoconfiguration (SLAAC): Allows hosts to automatically configure their own IPv6 addresses based on information received from RAs.
DHCPv6: A protocol used for dynamic address allocation and other configuration parameters in IPv6 networks.
What is the History of IPv6?
The rapid expansion of the Internet in the early 1990s raised concerns about the limitations of the existing internet protocol, IPv4. Its 32-bit address space, while sufficient for the time, was projected to be exhausted as more devices connected to the internet. To address this looming issue, the Internet Engineering Task Force (IETF), an open standards organization responsible for developing and promoting internet standards, initiated the development of IPv6, a new internet protocol with a much larger 128-bit address space.
The journey toward IPv6 adoption has been marked by several significant milestones:
1995: The first RFC outlining the basic concepts of IPv6 was published (RFC 1883), laying the foundation for further development.
1998: The IETF finalized the core IPv6 specifications, solidifying the protocol's technical framework and paving the way for implementation (RFC 2460).
2011: World IPv6 Launch Day marked a coordinated global effort to promote and accelerate the transition to IPv6. Top websites and Internet service providers around the world, including Google, Facebook, and Akami joined together with more than 1000 other participating websites to trial IPv6.
2017: The US government mandated IPv6 support for all new federal IT systems, signaling a significant policy shift towards broader adoption.
Despite these efforts, the transition to IPv6 has been gradual. Compatibility issues with existing IPv4 infrastructure, the cost of upgrading network equipment, and a lack of immediate urgency for many users have contributed to the slow adoption rate. However, as the internet continues to grow and the demand for unique IP addresses increases, the full potential of IPv6 is only likely to be realized in years to come.
Internet IPv6 and Public IP Address
IPv6 can be implemented on both private internal networks and the public internet. In this section, we will discuss the different ways IPv6 can be implemented.
Utilizing IPv6 on the internet means that your devices and internet service provider have a public IPv6 address, enabling direct communication with other IPv6-enabled devices and services across the globe.
This opens up a wide range of benefits:
More IP Addresses: We have already discussed IPv6's vastly expanded address space and how it eliminates concerns about running out of IP addresses.
Enhanced Security: IPv6's integration of IPsec (IP Security) as an extension header establishes a foundation for strong data protection. It enables confidentiality through encryption, integrity verification to prevent data tampering, and authentication to confirm the identity of communicating parties, all at the network layer.
More Efficient Routing: IPv6's simplified header structure and streamlined routing tables contribute to more efficient packet processing and forwarding, potentially leading to improved network performance. When compared to IPv4, IPv6 reduces the overhead associated with each packet, allowing routers to process them more quickly.
End-to-End Connectivity: With IPv6, devices can establish direct connections simplifying peer-to-peer applications and improving the overall user experience.
No More NAT: IPv6 eliminates the need for NAT, simplifying network configurations and allowing devices to have globally routable addresses.
However, there are certain challenges associated with adopting IPv6 on the internet. We will go into this in more detail a little later, but it is important to mention some of the immediate problems with IPv6 over the Internet:
Limited ISP Support: Not all Internet Service Providers (ISPs) offer native IPv6 connectivity. Some might utilize tunneling or other transitional mechanisms, while others may discourage users from enabling it or even disable IPv6 by default.
Compatibility: Although most modern websites and services support IPv6, older legacy systems often still rely on IPv4, requiring transitional mechanisms to bridge the gap. If you work in a small, medium, or large organization - has your business enabled IPv6 yet?
Configuration: Enabling and configuring IPv6 on your devices requires a good technical knowledge of networking and that your provider or ISP supports it. The good news is that many devices can automatically configure their IPv6 addresses using mechanisms like SLAAC (Stateless Address Autoconfiguration) or DHCPv6.
Local IPv6
IPv6 can also be implemented on private internal networks, such as within your home or office. This means that devices within your local network communicate using IPv6 addresses, providing local links with several advantages:
Simplified Network Management: With each device having a unique IPv6 address, network management becomes more straightforward.
Enhanced Performance: Applications that heavily utilize peer-to-peer communication or require multiple connections often experience performance gains with IPv6 due to the elimination of NAT and improved routing efficiency.
Future-proofing: As IPv6 adoption grows, having a local network already IPv6-enabled ensures seamless integration with the evolving internet landscape.
Assign Multiple IP Addresses: IPv6 allows you to assign multiple IPv6 addresses to the same device, enabling flexible network configurations and potential security benefits.
Modern routers and operating systems generally include built-in IPv6 support, often requiring only simple configuration changes to the operating system to enable it.
It's important to understand the benefits and challenges of implementing IPv6 on the Internet and local networks. We will inevitably all need to transition to IPv6 in the future, and the transition may present some hurdles.
What Is the Difference Between IPv4 and IPv6?
Hopefully, by now you should have a good understanding of IPv6. If like me, you are more than familiar with IPV4, the transition to IPv6 may seem like a daunting task. In this section, we will highlight the key differences between IPv4 and IPv6.
This table outlines the key distinctions between them, focusing on the technical attributes.
Feature
IPv4
IPv6
IP Addresses Size
32-bit (approximately 4.3 billion addresses)
128-bit (vastly expanded address space, enough for every device on the planet to have its own public IP address)
Address Representation
Dotted decimal notation (e.g., 192.168.1.1)
Hexadecimal notation (e.g., 2001:0db8:85a3:0000:0000:8a2e:0370:7334)
NAT (network address translation)
Necessary due to limited address space
Eliminated, each device receives a unique IP address
Security
IPsec is optional
IPsec is integrated into the IP layer, offering built-in authentication and encryption to enhance data integrity and confidentiality
Header Structure
More complex, with 12 fields
Simplified, with 8 fields, contributing to more efficient packet processing
Multicast
Less efficient
More efficient, with built-in support, enabling efficient communication with multiple destinations simultaneously
Adoption
Widely adopted but nearing its limits
Increasing adoption, but the transition is ongoing
Other Features
Requires manual address assignment and port forwarding for some services
Offers autoconfiguration capabilities (SLAAC, DHCPv6), flow label for QoS, and an extended unique identifier (EUI-64) for improved address assignment
IPv6 addresses the limitations of IPv4, primarily the scarcity of unique addresses. IPv6 also offers inherent security enhancements and improved support for multicast communication. While IPv4 remains dominant, the transition to IPv6 is essential for the continued growth and evolution of the internet.
Weaknesses of IPv6
While IPv6 offers lots of benefits, it's crucial to acknowledge its challenges and limitations.
Transition Complexity: The transition from IPv4 to IPv6 is a difficult task to complete, requiring careful planning and coordination. Compatibility issues often surface with older devices that do not support IPv6. Techniques like dual-stacking and tunneling can help with the transition, but it can also introduce unwanted networking complexity.
Adoption Rate: Although IPv6 adoption is increasing, it's still not universally available. Some ISPs do not offer native IPv6 connectivity, and some websites and services still solely rely on IPv4. This problem leads to connectivity issues for users attempting to access IPv6-only resources. A slow adoption rate discourages users from fully embracing it.
Security Concerns: While IPv6 has built-in security features, it also introduces new attack vectors. For example, broadcast packets can be used for malicious purposes, and router advertisements can be spoofed. As a result, organizations need to be on-top of their security practices to address these new challenges.
Configuration Challenges: IPv6's expanded address space and configuration options are more complex than IPv4. Manual configuration is time-consuming and error-prone. Proper address assignment and IP management is essential for a smooth IPv6 deployment, requiring technically advanced network engineers.
However, cloud hosting providers like Atlantic.Net are actively promoting IPv6 adoption, offering our customer networks seamless IPv6 integration and support on the ACP platform.
IPv6 on Atlantic.Net
Atlantic.Net fully supports IPv6 on its platform, aligning with the industry's move toward the next-generation internet protocol. We provide a range of features and configuration capabilities and benefits for customers seeking to leverage IPv6's capabilities:
Features:
IPv6 Enablement: Atlantic.Net allows users to enable IPv6 on their cloud servers, either during the initial server creation process or at a later time from the ACP console.
Address Allocation: Each cloud server with IPv6 enabled receives 16 IPv6 addresses for use.
Network Configuration: While Atlantic.Net automatically allocates IPv6 addresses, users are responsible for configuring their server's network settings to utilize these addresses.
Dual-Stack Support: Atlantic.Net supports dual-stack configurations, allowing servers to operate with both IPv4 and IPv6 simultaneously, ensuring compatibility with both legacy and modern services.
Benefits:
Improved Performance: IPv6's efficiency gains can translate to faster and more responsive applications for our customers, particularly for services that rely on real-time data exchange.
Future-Proofing: By supporting IPv6, we ensure that our customers' infrastructure is prepared for the future growth of the internet and the increasing number of connected devices.
NAT Elimination: With IPv6, our customers can bypass the need for NAT, simplifying network configurations and enabling direct end-to-end communication between devices.
IPv6 represents the future of the Internet. By understanding the strengths and weaknesses of IPv6, as well as the key technologies and terminology involved, you can make informed decisions about how to best use this next-generation protocol in your network environment.
Cloud providers like Atlantic.Net play a crucial role in facilitating this transition by providing the necessary tools, valuable services, and infrastructure to support IPv6 adoption.
Don't get left behind. Make the switch to IPv6 today!
### What Is PCI Compliance? 12 Requirements, PCI Levels, and Penalties
What Is PCI Compliance?
The Payment Card Industry (PCI) Security Standards Council (which is backed by the leading credit card institutions) developed a set of standards known as the Payment Card Industry Data Security Standard (PCI DSS), to secure credit card transactions and protect related data.
Payment card companies usually require organizations to comply with PCI standards under their network agreements. PCI standards cover merchant processing and additional requirements such as encryption of Internet transactions.
While there is no specific regulation mandating PCI compliance, court precedent treats it as mandatory for all companies processing payment card data. The Federal Trade Commission (FTC) monitors credit card processing to protect consumers. Organizations processing payment card data must comply with standards to ensure the security of transactions and avoid legal penalties.
This is part of an extensive series of guides about compliance management.
Why Is PCI Compliance Important?
Any organization that handles payment card transactions or data must ensure they comply with PCI DSS and other applicable standards. The data security standards described in PCI DSS help organizations enhance their security profile and protect themselves against the business and legal repercussions of a data breach.
Regardless of an organization’s size, credit card companies such as American Express, Visa, and Mastercard require PCI compliance. Complying with PCI standards:
Allows organizations to accept payment cards or transmit, process, and store payment card data
Reduces the risk of payment card data loss
Reduces the risk of customer identity theft
Enables organizations to detect, prevent, and remediate data breaches
If an organization fails to maintain PCI compliance, it could result in fines or the inability to accept payment cards and online transactions.
The 12 Requirements for PCI DSS Compliance
1. Use and Maintain Firewalls
Firewalls are essential for controlling access between trusted internal networks and untrusted external networks like the internet. To comply with PCI DSS, organizations must configure firewalls to restrict inbound and outbound traffic to what is necessary for business operations. Specific tasks include:
Blocking any unauthorized access attempts while allowing legitimate business traffic.
Ensuring firewalls are placed between the cardholder data environment (CDE) and the internet, as well as between internal segments where necessary.
Regularly reviewing firewall configurations to ensure they align with security policies.
Conducting periodic firewall rule reviews to identify and remove outdated or redundant rules.
Firewalls should also be configured to log access and traffic, which helps in auditing and identifying potential security incidents.
2. Proper Password Protections
Passwords are a common entry point for attackers, making proper password policies critical to protecting cardholder data. PCI DSS mandates organizations to:
Eliminate the use of default passwords that come with hardware and software, as these are easily exploited.
Implement strong password policies that require a mix of uppercase and lowercase letters, numbers, and special characters.
Set password expiration policies (e.g., requiring users to change passwords every 90 days) and enforce password history to prevent reuse.
Limit failed login attempts (e.g., locking out users after six failed tries) and set up automatic lockouts after a period of inactivity.
Use multi-factor authentication (MFA) for remote access or systems with high privilege accounts.
Organizations should ensure these protections are applied to all users with access to the CDE, including administrators and third-party service providers.
3. Protect Cardholder Data
Protecting cardholder data involves ensuring that sensitive data is not exposed or retained unnecessarily. PCI DSS requires organizations to:
Store only essential cardholder data and never store sensitive authentication data, such as full magnetic stripe, CVV, or PIN data, after authorization.
Mask the Primary Account Number (PAN) when displaying it. For example, only the last four digits should be visible to employees unless they have a legitimate business need.
Use encryption, tokenization, or truncation to protect stored data. PANs should be encrypted with strong algorithms such as AES-256.
Ensure that cardholder data is stored securely, either in encrypted databases or with restricted access.
Regularly monitor data retention policies and securely dispose of cardholder data once it is no longer needed.
These measures reduce the risk of unauthorized access to stored cardholder data.
4. Encrypt Transmitted Data
When cardholder data is transmitted over public or unsecured networks, encryption is critical to protecting it from interception. PCI DSS mandates that:
Cardholder data must be encrypted using strong cryptographic methods (such as TLS 1.2 or higher) when sent over the internet or other open networks.
Strong encryption keys should be used, and encryption keys must be managed securely with strict access controls.
Cardholder data should never be transmitted via unencrypted email or messaging services. Any transmission over wireless networks must also be encrypted.
Organizations must use secure protocols such as IPsec, SSH, or TLS when transmitting data across internal networks.
Digital certificates should be properly managed and renewed before expiration to ensure the integrity of secure connections.
In addition to encryption, secure transmission protocols help ensure the confidentiality and integrity of data in transit.
5. Use and Maintain Anti-Virus
Malware presents a significant risk to the security of systems that store or process cardholder data. To comply with PCI DSS, organizations must:
Install and maintain anti-virus or anti-malware software on all systems vulnerable to malware, including workstations, servers, and point-of-sale (POS) devices.
Ensure that anti-virus software is configured to perform automatic scans of files, applications, and systems at regular intervals.
Set up automatic updates to the anti-virus software to ensure it can detect the latest known threats.
Regularly review anti-virus logs and alerts to ensure that potential threats are identified and addressed promptly.
Implement a process for responding to detected malware, including quarantining infected systems and conducting root-cause analyses to prevent recurrence.
By proactively maintaining anti-virus software, organizations can reduce the risk of malware compromising cardholder data.
6. Properly Updated Software
Keeping software up to date is critical to preventing vulnerabilities from being exploited. PCI DSS requires that:
Organizations must install security patches for operating systems, applications, and devices within a set timeframe (typically within 30 days of release).
This includes third-party applications, such as web browsers, database systems, and payment processing software.
A formal process should be established for evaluating and applying security patches, including tracking available updates, testing them, and deploying them in production environments.
Legacy software that no longer receives security updates must be phased out or otherwise secured.
Critical updates should be prioritized to minimize the risk of known vulnerabilities being exploited.
Regular patch management ensures that systems are protected against known vulnerabilities, reducing the attack surface for potential threats.
7. Restrict Data Access
Access to cardholder data must be restricted to only those employees or systems that require it for legitimate business purposes. PCI DSS specifies that:
Organizations must use role-based access control (RBAC) to grant access to cardholder data based on job responsibilities. Least-privilege principles should be applied, meaning employees only have access to the data they need.
Access rights should be regularly reviewed and revoked when no longer needed, especially for employees who leave the company or change roles.
Systems should implement mechanisms to control access based on user roles, job functions, or departments.
Administrators should have enhanced access controls to restrict their ability to manipulate systems handling sensitive data.
Controlling access in this way helps limit the exposure of cardholder data to unauthorized personnel or external attackers.
8. Unique IDs for Access
Ensuring that every user has a unique identifier (ID) is critical for tracking and accountability. PCI DSS requires organizations to:
Assign each user a unique ID, ensuring that actions taken on systems handling cardholder data can be traced to a specific individual.
Avoid the use of shared or generic accounts, as this makes it difficult to trace malicious or unauthorized actions to an individual.
Implement password policies to enforce strong authentication for each user, including administrators and third-party providers.
Use multi-factor authentication (MFA) for any remote access to the cardholder data environment and for systems containing sensitive data.
Log all user access to cardholder data, including successful and failed login attempts, to detect potential security incidents.
Unique IDs ensure that organizations can monitor access to critical systems, aiding in compliance audits and forensic investigations.
9. Restrict Physical Access
Cardholder data is not only vulnerable to cyber attacks but also to physical theft. PCI DSS requires organizations to:
Restrict access to areas where cardholder data is stored (e.g., server rooms, payment terminals) using measures like locked doors, ID badges, biometric scanners, or security personnel.
Log and monitor all physical access to sensitive areas, including visitors and maintenance personnel. Visitor access should be limited, and visitors should be escorted by authorized personnel.
Implement surveillance or monitoring systems in sensitive areas to detect unauthorized physical access.
Securely store paper records or physical media containing cardholder data, such as backup tapes or printed documents, in locked cabinets or rooms.
Physically destroy any media containing cardholder data before disposal to prevent unauthorized access.
By controlling who has physical access to sensitive environments, organizations can prevent data theft or tampering.
10. Create and Maintain Access Logs
Logging access to systems that store, process, or transmit cardholder data is essential for detecting suspicious activity. To comply with PCI DSS, organizations must:
Enable logging mechanisms on all systems that handle cardholder data, including servers, databases, network devices, and payment terminals.
Ensure that logs capture details of user activity, including successful and unsuccessful login attempts, file access, changes to user permissions, and security events.
Centralize log management to ensure logs are easily accessible for review and that they are protected from tampering.
Regularly review and analyze logs to detect anomalies or suspicious activity that may indicate a security incident.
Retain logs for a minimum period (typically one year), with immediate access to the last three months' logs as per PCI DSS requirements.
Access logs are crucial for identifying and responding to security incidents, as well as for meeting audit and forensic investigation requirements.
11. Scan and Test for Vulnerabilities
Vulnerability scanning and penetration testing are required to identify and mitigate security weaknesses. To comply with PCI DSS, organizations must:
Conduct internal and external vulnerability scans at least quarterly and after any significant changes to the cardholder data environment, such as new systems or network configurations.
Engage an Approved Scanning Vendor (ASV) to perform external vulnerability scans and provide a report on compliance.
Perform penetration testing at least annually to simulate real-world attacks and identify potential vulnerabilities that may not be captured by automated scans.
Remediate any vulnerabilities or issues discovered during scans and tests according to a prioritized risk-based approach.
Document the results of all scans and penetration tests, and maintain records for review by auditors or security assessors.
Regular vulnerability assessments help ensure that security weaknesses are identified and mitigated before they can be exploited by attackers.
12. Document Policies
To ensure PCI DSS compliance, organizations must establish, maintain, and document formal security policies and procedures. These policies should:
Cover all aspects of PCI DSS compliance, including data security, access control, vulnerability management, and incident response.
Be regularly reviewed and updated to reflect changes in technology, business processes, or compliance requirements.
Provide clear guidance to staff on their roles and responsibilities in protecting cardholder data.
Include a documented incident response plan, outlining steps for detecting, responding to, and recovering from security breaches involving cardholder data.
Ensure that employees receive regular training on security policies, emphasizing the importance of PCI compliance.
Properly documented policies provide a clear framework for maintaining security and ensuring ongoing PCI DSS compliance throughout the organization.
What are the four levels of PCI Compliance?
Here are the PCI compliance levels that apply to merchants based on the volume of payment card transactions they process.
Level 1
A Level 1 merchant processes 6 million or more transactions per annum (e.g., a large international corporation). This compliance level requires third-party Quality Security Assessors (QSAs) to audit the merchant’s practices. QSAs define the audit scope, review the merchant’s data storage and paper trails, and determine PCI compliance in annual Reports on Compliance (ROCs).
Level 1 merchants must also perform quarterly network scans to complement the yearly audits using Approved Scanning Vendors (ASVs). Each merchant must then submit Attestation of Compliance (AOC) forms.
Level 2
A Level 2 merchant processes less than 6 million but more than 1 million transactions per annum (e.g., a medium-sized corporation). PCI compliance level 2 does not require a third-party auditor, but Level 2 merchants must submit ROCs based on internal audits responding to Self-Assessment Questionnaires (SAQs).
Level 2 merchants must also use ASVs to perform quarterly network scans and submit AOC forms.
Level 3
A Level 3 merchant processes less than 1 million but more than 20 thousand transactions per annum (e.g., a small corporation). The third compliance level does not require external audits or ROCs—only the completion of annual SAQs.
A Level 3 merchant must also perform quarterly network scans and submit AOC forms.
Level 4
A Level 4 merchant processes fewer than 20 thousand transactions annually. This compliance level requires merchants to complete annual SAQs and AOCs, in addition to quarterly network scans performed by ASVs.
A Level 4 merchant must use qualified resellers and integrators to install, integrate, and service point-of-sale applications and terminals.
PCI DSS Versions
PCI DSS 1.0
PCI DSS 1.0 was introduced in December 2004 as the first formal attempt to create a unified set of security standards for the payment card industry. Prior to this, individual credit card brands like Visa and Mastercard had their own security programs.
PCI DSS 1.0 established the foundation for protecting cardholder data by requiring organizations to implement basic security measures such as firewalls, password protection, and encryption. Key requirements included building and maintaining secure systems and networks, protecting stored cardholder data, and maintaining a vulnerability management program.
PCI DSS 2.0
Released in October 2010, PCI DSS 2.0 focused on improving clarity and flexibility in the standards. One of the major changes was the introduction of guidelines for risk-based security approaches, allowing organizations to prioritize remediation efforts based on risk assessments.
Additionally, PCI DSS 2.0 introduced more detailed requirements for encryption, especially around wireless networks, and clarified the responsibilities for third-party service providers in securing cardholder data. This version also expanded on the need for strong access control measures.
PCI DSS 3.0
Launched in November 2013, PCI DSS 3.0 aimed to address emerging security threats and vulnerabilities, particularly those highlighted by high-profile data breaches in the retail sector. Key updates included stricter requirements for authentication mechanisms, the implementation of more detailed guidance on vulnerability management, and the introduction of physical security controls.
PCI DSS 3.0 placed greater emphasis on continuous monitoring of security controls, rather than treating PCI compliance as a point-in-time assessment. The introduction of regular penetration testing and more frequent vulnerability scans helped organizations proactively manage security risks.
PCI DSS 4.0
Introduced in March 2022, PCI DSS 4.0 marked a significant evolution in the framework, reflecting the growing sophistication of cyber threats and changes in payment technologies. The new version introduced greater flexibility for organizations to use customized security approaches, allowing them to meet the intent of PCI DSS requirements through methods that fit their specific environments.
PCI DSS 4.0 also emphasized the need for stronger authentication measures, such as more robust multi-factor authentication (MFA) and password controls. Additionally, this version of PCI DSS emphasizes the requirement for real-time threat detection and response capabilities.
Is PCI Compliance Legally Required?
While there is no specific federal law in the United States mandating PCI compliance, companies that process, store, or transmit payment card data are contractually required to comply with the PCI Data Security Standard (PCI DSS).
Major credit card brands, such as Visa, Mastercard, American Express, and Discover, enforce PCI compliance through their network agreements with merchants and service providers. Failure to comply with these contractual obligations can result in significant financial and operational penalties, making PCI compliance functionally mandatory for businesses handling payment card transactions.
In addition, court rulings and state-level regulations have increasingly treated PCI DSS as a de facto standard for demonstrating due diligence in protecting consumer payment card data. Failure to comply may expose organizations to legal action under consumer protection laws, such as those enforced by the Federal Trade Commission (FTC), which holds businesses accountable for securing sensitive financial data.
Noncompliance could also lead to liability in the event of a data breach, increasing the risk of lawsuits and fines under various privacy and security laws, including the California Consumer Privacy Act (CCPA) and the General Data Protection Regulation (GDPR) in Europe.
Penalties and Consequences for Noncompliance [QG1]
Noncompliance with PCI DSS can lead to severe financial and reputational consequences for organizations. Penalties include:
Fines: Credit card companies can impose fines ranging from $5,000 to $100,000 per month for PCI DSS violations, depending on the severity of the noncompliance and the size of the business.
Increased Transaction Fees: Noncompliant businesses may be subject to higher transaction fees, raising operational costs.
Loss of Payment Processing Privileges: In extreme cases, organizations can lose the ability to process credit card payments, crippling their ability to conduct business.
Liability for Data Breaches: If a data breach occurs due to noncompliance, the organization could be held liable for damages, including the costs of forensic investigations, notification to affected individuals, card reissuance fees, and compensation for fraud losses incurred by cardholders.
Reputational Damage: A data breach resulting from noncompliance can significantly harm an organization’s reputation, leading to a loss of customer trust and long-term revenue.
In sum, while PCI compliance is not technically a legal requirement, the contractual, financial, and legal risks associated with noncompliance make it essential for businesses that handle payment card data.
How to Implement a Successful Incident Response Plan for PCI DSS
Two major PCI DSS requirements help organizations implement successful incident response plans—Requirement 10 refers to logging and log management, while Requirement 12 addresses documentation, vulnerability, and risk management.
In addition to considering these two requirements, you should apply the following steps to build a PCI-compliant incident response plan:
Prioritize assets—locate critical assets such as applications and sensitive data and classify them according to the risk they present. Assign a budget and protection strategy for each risk category.
Document clear policies—provide employees with clear procedures for responding to incidents, including details such as roles and responsibilities.
Build your response team—the incident response team can include full-time incident response personnel or other security or IT employees who take on responsibilities. Every individual must have a clear role.
Educate your employees—regularly train your staff to promote security awareness and safe business practices. Ensure that all employees learn to identify and avoid infiltration attempts such as social engineering attacks.
Inform stakeholders of the incident response plan—all stakeholders across the organization should be familiar with the incident response plan. Encourage everyone from management, legal, HR, IT, and development departments to contribute to the plan.
Involve senior management—your incident response plan cannot succeed without the support of senior management. For example, your organization must budget for incident response tools and procedures.
Test your incident response plan—use realistic tabletop exercises to test the effectiveness of your incident response plan. Testing your plans allows you to identify and address any weaknesses.
The Role of SIEM in PCI DSS Compliance
PCI DSS Requirements 10 and 11.5 include the implementation of regular monitoring of the network and configuration changes. PCI DSS focuses on these two aspects because system logs are critical for investigating and responding to security incidents.
When security auditing is enabled on systems in the cardholder environment, security information and event management (SIEM) systems can be used to monitor systems and generate security alerts. SIEM solutions are able to collect and correlate data from across the IT environment, including a PCI-compliant hosting environment, and from hundreds of security tools. They normalize security data and generate reports in a suitable format for regular reviews and PCI DSS audits.
Get Help with PCI Compliance
Do you need PCI-compliant hosting? Atlantic.Net stands ready to help you attain fast compliance with a range of certifications, such as SOC 2 and SOC 3, HIPAA, and HITECH, all with 24x7x365 support, monitoring, and world-class data center infrastructure. For faster application deployment, free IT architecture design, and assessment, call 888-618-DATA (3282), or email us at sales@atlantic.net.
PCI Compliant Hosting
Authored by Atlantic.Net
[Guide] PCI Hosting Solutions | 12-Point PCI-Compliant Hosting Checklist
[Guide] PCI DSS Cybersecurity Requirements: A Practical Guide
[Blog] RTLS and Healthcare – Can Real Time Location System Security Improve Your Healthcare Operations?
[Product] HIPAA-Compliant Website Hosting Services Provider
GDPR Compliance
Authored by Exabeam
[Guide] GDPR Compliance: A Practical Guide | Exabeam
[Guide] GDPR Fines Structure and the Biggest GDPR Fines to Date
[Whitepaper] 2024 State of the Security Team Research
[Product] Exabeam | AI-Driven Security Operations
DORA Regulation
Authored by Faddom
[Guide] DORA Regulation: Requirements, Penalties & Compliance Checklist
[Guide] How the DORA Regulation Impacts IT
[Product] Faddom | Instant Application Dependency Mapping Tool
### Use Read Command to Get User Inputs Into an Array in Bash
In Bash scripting, handling user inputs is an essential task. Often, you need to gather multiple inputs and store them for further operations. Arrays are an efficient way to store such inputs.
In this guide, we’ll explore how to use the read command to capture user inputs and store them in a Bash array.
Introduction to Arrays in Bash
In Bash, an array is a variable that holds multiple values. Unlike regular variables, which store a single value, arrays allow you to store and manage lists of items, making them incredibly useful for many applications.
You can create a simple array like this:
my_array=("item1" "item2" "item3")
To access elements of the array, use the following syntax:
echo ${my_array[0]} # Outputs: item1
echo ${my_array[1]} # Outputs: item2
You can also iterate over the array:
for item in "${my_array[@]}"; do
echo $item
done
Output:
item1
item2
item3
Overview of the read Command
The read command in Bash is used to take user input. By default, it reads a single value into a variable.
Here’s a simple example of using read to capture input:
echo "Enter your name:"
read name
echo "Hello, $name!"
Output:
Enter your name:
John
Hello, John!
The read command can also be used to read multiple values into an array by using the -a option, which we’ll explore next.
Using read -a to Capture User Inputs Into an Array
To read multiple inputs and store them into an array, we use the read command with the -a flag. This flag tells Bash to store the input into an array instead of a single variable.
Here’s an example:
echo "Enter a list of items (separated by spaces):"
read -a items
echo "You entered: ${items[@]}"
Output:
Enter a list of items (separated by spaces):
apple banana orange
You entered: apple banana orange
The user’s input (apple banana orange) is stored in the items array, and we print the array using ${items[@]}.
Prompting the User for Multiple Inputs
You can prompt users to enter multiple values on a single line. Here's how you can capture that input and store it in an array:
echo "Enter your favorite colors (separated by spaces):"
read -a colors
echo "Your favorite colors are:"
# Loop through the array and print each color
for color in "${colors[@]}"; do
echo $color
done
Output:
Enter your favorite colors (separated by spaces):
red blue green
Your favorite colors are:
red
blue
green
In this example, red, blue, and green are stored in the colors array, and we print each color using a loop.
Reading Multiple Inputs (Line by Line) Into an Array
Sometimes, you may want to collect inputs line by line and store them in an array. This can be done using a while loop.
echo "Enter items one by one (leave blank to finish):"
declare -a input_array
while true; do
read item
[[ -z "$item" ]] && break
input_array+=("$item")
done
echo "You entered: ${input_array[@]}"
Output:
Enter items one by one (leave blank to finish):
apple
banana
grape
You entered: apple banana grape
This script reads user input one line simultaneously, appending each value to the input_array. The loop breaks when the user enters an empty line.
Practical Example: Collecting a List of User-Defined Items
Here’s a practical script example where the user can input items for a shopping list, and the script stores them in an array.
echo "Enter items for your shopping list (leave blank to finish):"
declare -a shopping_list
while true; do
read item
[[ -z "$item" ]] && break
shopping_list+=("$item")
done
echo "Your shopping list is:"
for item in "${shopping_list[@]}"; do
echo $item
done
Output:
Enter items for your shopping list (leave blank to finish):
bread
milk
eggs
Your shopping list is:
bread
milk
eggs
This simple shopping list script collects user inputs line by line and displays them at the end.
Error Handling and Edge Cases
When reading inputs into arrays, there are a few potential issues:
1. Handling Whitespace: Be mindful of values with spaces. To handle multi-word inputs, use quotes around the value like so:
read -a input_array <<< "one two 'multi word input'"
echo "${input_array[@]}"
Output:
one two multi word input
2. Validating User Inputs: Always check for empty or invalid inputs before adding them to the array.
3. Escaping Special Characters: If the user’s input contains special characters (like &, |, etc.), make sure to escape or handle them accordingly.
Conclusion
Using the read command in Bash is a powerful way to capture user input, and with the -a option, you can easily store multiple inputs into an array. Whether you need to collect input in a single line or line by line, this method provides flexibility in handling user data in Bash scripts.
Experiment with arrays and user inputs to enhance your Bash scripts and make them more interactive and efficient on dedicated server hosting from Atlantic.Net!
### ps -ef Command with Practical Examples
The ps command is a crucial tool in Linux for monitoring running processes. It displays information about the processes running on your system, helping you manage system resources, identify issues, and kill unnecessary processes. One of the most commonly used variations of this command is ps -ef.
In this article, we will explore how the ps -ef command works and how to use it effectively, using practical examples.
Understanding the -e and -f Options
The -e option tells ps to display all processes running on the system, not just those associated with the current terminal. The -f option stands for full-format listing, which includes additional details about each process.
To get a comprehensive view of all the processes on your system, you can use the ps -ef command:
ps -ef
Output:
UID PID PPID C STIME TTY TIME CMD
root 1 0 0 09:22 ? 00:00:02 /sbin/init
root 719 1 0 09:22 ? 00:00:00 /usr/lib/systemd/systemd-journald
root 1369 1 0 09:22 ? 00:00:00 /usr/sbin/sshd -D
user 1421 1369 0 09:22 ? 00:00:00 sshd: user [priv]
user 1422 1421 0 09:22 pts/0 00:00:00 -bash
user 1567 1422 0 09:22 pts/0 00:00:00 ps -ef
This command shows all running processes, regardless of the terminal. Each column in the output provides essential information about the processes.
Here’s what each column in the ps -ef output means:
UID: The user ID of the process owner.
PID: The Process ID of the running process.
PPID: The Parent Process ID, which refers to the process that spawned this one.
C: CPU utilization of the process.
STIME: Start time of the process.
TTY: The terminal associated with the process.
TIME: Total CPU time used by the process.
CMD: The command that started the process.
Filtering Processes with ps -ef
You can filter specific processes using the grep command with ps -ef. For example, if you want to see all processes related to Apache, you can run:
ps -ef | grep apache
Output:
root 1350 1 0 09:25 ? 00:00:00 /usr/sbin/apache2 -k start
www-data 1352 1350 0 09:25 ? 00:00:00 /usr/sbin/apache2 -k start
www-data 1353 1350 0 09:25 ? 00:00:00 /usr/sbin/apache2 -k start
user 1365 1422 0 09:26 pts/0 00:00:00 grep --color=auto apache
This shows all Apache-related processes. The last line with grep is the actual command we used to search.
Using ps -ef to Find Parent and Child Processes
Every process in Linux is either a parent or a child process. The PPID (Parent Process ID) field helps you identify the parent process of a given child process. You can use the ps -ef command to check the parent-child relationship of processes.
For better visualization, you can use the ps -ef --forest option, which displays a tree of processes:
ps -ef --forest
Output:
root 1 0 0 09:22 ? 00:00:02 /sbin/init
├─/usr/lib/systemd/systemd-journald
├─/usr/sbin/sshd -D
│ └─sshd: user [priv]
│ └─/bin/bash
└─ps -ef --forest
This tree structure helps you understand how processes are related, which is especially useful when debugging.
Sorting the ps -ef Output
You can sort the output of ps -ef based on different criteria, such as CPU usage, memory usage, or PID. For example, to sort processes by CPU usage in descending order, use:
ps -ef --sort=-pcpu
Output:
UID PID PPID C STIME TTY TIME CMD
user 1367 1369 2 09:25 pts/0 00:00:02 firefox
user 1345 1341 1 09:22 pts/0 00:00:01 gnome-shell
user 1567 1422 0 09:22 pts/0 00:00:00 ps -ef --sort=-pcpu
This example sorts processes by their CPU usage (represented by the C column).
Listing Processes for a Specific User
To list all processes running under a specific user, you can combine ps -ef with grep. For example, to list all processes run by the current user:
ps -ef | grep $USER
Output:
user 1422 1421 0 09:22 pts/0 00:00:00 -bash
user 1367 1369 2 09:25 pts/0 00:00:02 firefox
user 1567 1422 0 09:22 pts/0 00:00:00
This shows only the processes owned by the logged-in user.
Killing a Process with ps -ef and kill
When you identify a process that needs to be stopped, you can use its PID from the ps -ef output and terminate it with the kill command. For example, to kill a process with PID 1350:
kill 1350
To ensure the process is terminated, you can recheck by running ps -ef again.
Using ps -ef to Monitor System Performance
ps -ef can also be used for performance monitoring by identifying high CPU or memory-consuming processes. For example, to list processes consuming the most memory, use:
ps -ef --sort=-pmem
Output:
UID PID PPID C STIME TTY TIME CMD
user 1367 1369 1 09:25 pts/0 00:01:05 firefox
root 1001 1 0 09:20 ? 00:00:50 apache2
user 1345 1341 0 09:22 pts/0 00:00:30 gnome-shell
This output helps you identify memory-heavy processes so you can take action if needed.
Conclusion
The ps -ef command is a powerful tool for process management in Linux. It allows you to easily view, filter, and manage running processes. Whether you're troubleshooting system performance, monitoring resource usage, or managing applications, ps -ef is an essential command to know. You can now use ps -ef command to manage processes on dedicated server hosting from Atlantic.Net!
### Fixing Mount Point Does Not Exist Error in Linux
In Linux, mounting devices or filesystems allow users to access external drives, network filesystems, and partitions. However, one common error encountered during this process is the "Mount Point Does Not Exist" error.
This guide will help you understand the causes of this error and provide clear steps to resolve it.
What Is a Mount Point in Linux?
A mount point is a directory in the Linux filesystem where an external device or partition is attached. Once a device is mounted, its contents become accessible via this directory. Common mount points include /mnt, /media, and user-created directories like /mnt/my_mount_point.
Understanding the "Mount Point Does Not Exist" Error
The "Mount Point Does Not Exist" error means the directory where you are trying to mount your filesystem does not exist. This usually happens when you specify a path that is either misspelled or has not been created.
For example, running a command like:
mount /dev/sda1 /mnt/nonexistent_directory
You will see the following error:
mount: /mnt/nonexistent_directory: mount point does not exist.
This error indicates that the directory /mnt/nonexistent_directory doesn’t exist, so the system can’t attach the partition to it.
Let’s explore how to fix this issue step-by-step.
How to Check If a Mount Point Exists
First, check if the directory (mount point) exists. You can do this with the ls or find commands:
Check using ls command.
ls /mnt/my_mount_point
You will see the following output if the directory doesn’t exist.
ls: cannot access '/mnt/my_mount_point': No such file or directory
Check using find command.
find /mnt -type d -name "my_mount_point"
You can not see any output if the directory is not found.
If the directory doesn’t exist, you’ll need to create it.
Creating a Mount Point Directory
To fix this error, you need to create the mount point using the mkdir command. Let’s assume we want to create the directory /mnt/my_mount_point.
Create a new mount point directory.
mkdir /mnt/my_mount_point
Verify the directory was created:
ls /mnt
Output:
my_mount_point
Now that the mount point exists, we can move forward with mounting the filesystem.
Mounting the Filesystem to the New Mount Point
Once the mount point is created, you can proceed with mounting the filesystem or device. Let’s look at a few different examples of mounting filesystems:
Mount a local partition.
mount /dev/sda1 /mnt/my_mount_point
Mount an external USB drive.
mount /dev/sdb1 /mnt/my_mount_point
Mount a network filesystem (NFS).
mount -t nfs server-ip:/path /mnt/my_mount_point
Verify the filesystem is mounted.
df -h | grep my_mount_point
Output:
/dev/sda1 50G 20G 30G 40% /mnt/my_mount_point
Making Mount Points Persistent Across Reboots
By default, when you mount a device or filesystem using the mount command, it will be unmounted after a system reboot. To make the mount point persistent, you must add it to the /etc/fstab file.
1. Edit the /etc/fstab file:
nano /etc/fstab
2. Add an entry for the device:
/dev/sda1 /mnt/my_mount_point ext4 defaults 0 0
3. Save and exit.
4. Test the /etc/fstab entry:
Run the following command to verify that the fstab entry is correct and the filesystem can be mounted automatically:
mount -a
If no errors are returned, the entry is correct, and the device will be mounted automatically after each reboot.
Checking for Mount Point and Filesystem Issues
If you’re still encountering issues with mounting, you can use dmesg or journalctl to check for system logs related to the mounting process:
Using dmesg to check system messages:
dmesg | grep mount
Using journalctl for recent logs:
journalctl -xe | grep mount
If the issue is related to the filesystem (e.g., corrupted files), you can run the fsck (filesystem check) utility to repair the device:
fsck /dev/sda1
Follow the on-screen prompts to repair any issues with the filesystem.
Conclusion
The "Mount Point Does Not Exist" error in Linux can be frustrating, but it's usually straightforward to fix. By creating the mount point directory, checking for typos, and verifying device connectivity, you can resolve the error and successfully mount your device. Hopefully the above methods will now help you fix the mount error if you encounter it on dedicated server hosting from Atlantic.Net!
### VPS Hosting vs. Shared Hosting: Pros/Cons, Differences, and Expert Tips
What Is VPS Hosting?
VPS (virtual private server) hosting offers a virtualized server environment, providing users with dedicated resources on a shared physical server. This setup balances the cost benefits of shared hosting while offering more control, similar to a dedicated server. VPS hosting uses hypervisor technology to create and manage multiple virtual servers on a single physical machine, allowing users to enjoy isolated server environments without the high price of a dedicated server.
VPS hosting provides better performance, security, and control compared to shared hosting. Each VPS operates independently, meaning server resources like CPU and RAM are not shared with other users. This reduces the risk of resource contention and improves performance consistency. Additionally, since the server environment is isolated, users can install and manage software, apps, and configurations according to their needs.
Pros of VPS Hosting
Dedicated resources: Each VPS has allocated CPU, RAM, and storage, providing better performance without interference from other users on the server.
Customization: Users have root access, allowing for custom software installations and server configurations to meet their requirements.
Scalability: VPS hosting is easily scalable, enabling users to increase resources like CPU and storage without significant downtime.
Enhanced security: With isolated environments, VPS hosting offers improved security compared to shared hosting, reducing risks from neighboring websites.
Cons of VPS Hosting
Higher cost: VPS hosting is more expensive than shared hosting due to dedicated resources and increased control options.
Technical expertise needed: Managing a VPS requires a higher level of technical knowledge, particularly when it comes to server configuration and security.
Limited physical resources: While resources are dedicated, they are still limited by the underlying hardware of the physical server, unlike a fully dedicated server.
Potential overhead: If not properly managed, VPS resources can be inefficiently used, leading to performance degradation or the need for frequent upgrades.
What Is Shared Hosting?
Shared hosting involves multiple websites being hosted on a single physical server, sharing resources such as CPU, RAM, and storage. It is the most economical hosting type, making it a popular choice for small businesses and personal websites. The primary advantage of shared hosting is its cost-effectiveness, as the fees are distributed among many users who share the same server infrastructure. Hosting providers manage server maintenance and provide technical support.
While shared hosting offers affordability, it comes with resource constraints. Websites on a shared server may experience slower performance during peak times because other sites consume the shared resources. Security is another consideration, as vulnerabilities in one website could potentially affect others on the same server. Additionally, users have limited control over server settings, which may restrict customization.
Pros of Shared Hosting
Cost-effective: Shared hosting is the most affordable option, suitable for small websites and those with limited budgets.
Managed service: Server maintenance and security are handled by the hosting provider, making it easy for non-technical users.
Easy setup: Hosting providers often offer one-click installations for popular platforms like WordPress, simplifying website setup.
Low maintenance: Since the hosting provider manages the server, users can focus on their website without worrying about technical aspects.
Cons of Shared Hosting
Limited resources: Shared resources can lead to performance bottlenecks, especially if neighboring websites experience high traffic.
Security risks: Vulnerabilities in one site can potentially expose other sites on the same server to security threats.
Restricted control: Users have limited access to server configurations, which may restrict advanced customizations or software installations.
Scalability issues: Shared hosting doesn’t easily scale, making it unsuitable for websites experiencing significant growth in traffic or resource needs.
Shared Hosting vs VPS Hosting: Key Differences
The following table summarizes the key differences between shared and VPS hosting.
Feature
Shared Hosting
VPS Hosting
Cost
Low, with costs shared among multiple users
Higher, with dedicated resources and flexible pricing
Performance
Can suffer due to resource sharing with other websites
Consistent performance with dedicated CPU, RAM, and storage
Security
More vulnerable due to shared environment
Better security with isolated environments and customizable settings
Reliability
Risk of downtime if other sites consume excessive resources
High reliability due to isolated operations and dedicated resources
Scalability
Limited, requires upgrading to higher plans or VPS
Easily scalable by adjusting CPU, RAM, and storage as needed
Control & customization
Limited, with managed server settings and little customization
Full control with root access, allowing custom software and configurations
Ideal for
Small websites, blogs, and startups with tight budgets
Growing businesses, high-traffic websites, and resource-intensive applications
1. Cost
Shared hosting is typically more affordable than VPS hosting. In shared hosting, server costs are distributed among many users, resulting in low prices. This makes it an excellent choice for small websites or startups with tight budgets, as the cost is generally fixed and predictable. VPS hosting involves dedicated resources and better performance, reflected in higher pricing. With VPS, costs vary based on the level of resources allocated and may include additional fees for extra features or management services.
While generally more expensive, VPS hosting may provide value for money through better performance and control, catering to businesses needing more than basic hosting. The increased cost offers tangible benefits like dedicated resources, enhanced security, and more configuration options.
Expert tip: Consider starting with shared hosting and upgrading to VPS as your traffic grows. Many hosting providers make it easy to migrate between plans.
2. Performance
Performance is a significant differentiator between shared and VPS hosting. Shared hosting's resource pooling means that if one site experiences high traffic, others can suffer performance issues. This unpredictability can affect load times, user experience, and SEO rankings.
VPS hosting provides dedicated resources, ensuring consistent performance regardless of other users. This makes VPS ideal for websites that require reliable speed and handling of higher traffic volumes or resource-intensive applications.
In VPS hosting, resilience and better resource allocation typically translate into faster load times and a smoother user experience. Websites with high visitor numbers or dynamic content benefit from the enhanced processing power and memory availability that VPS offers. Data-intensive applications such as eCommerce sites and interactive platforms often require the increased CPU and RAM that VPS provides to maintain optimal functionality.
Expert tip: For improved performance, regularly monitor your VPS resource usage and adjust allocations to ensure your website or application runs optimally without lag.
3. Security
Shared hosting is generally more vulnerable and presents greater security risks due to resource sharing. A breach in one site could potentially expose others on the same server to risks. Shared servers often have stricter security settings, meaning users have less control over individual security configurations. Despite managed server security protocols by the provider, shared hosting environments can still be at a disadvantage when compared to VPS.
VPS hosting offers better security due to isolated environments. Each VPS functions independently, akin to a dedicated server, ensuring that the activities of one do not compromise others. Users can configure security settings and install specific security tools, providing better data protection. However, VPS hosting does not offer a physically separated environment, so it can still be vulnerable to attacks against the virtualized environment, such as hypervisor compromise.
Expert tip: Always enable a firewall and keep software up to date on both shared and VPS hosting to minimize the risk of security breaches.
4. Reliability and Stability
Shared hosting's reliance on a common pool of resources can negatively impact reliability. If one site consumes excessive resources, others on the server may face downtime or reduced performance. However, most shared hosting plans offer adequate reliability for small sites, as providers manage the infrastructure to balance loads and ensure basic stability. Still, the risk of resource contention and potential downtime remains higher compared to VPS solutions.
VPS hosting enhances reliability and stability through dedicated resources and independent operations. Each VPS maintains consistent performance irrespective of other virtual servers on the same physical machine. Such isolation provides greater uptime and resilience against spikes in traffic, ensuring consistent user experiences. The dedicated resource allocation in VPS minimizes the risk of downtime due to server overload.
Expert tip: Opt for managed VPS hosting if you want enhanced reliability and stability without the responsibility of manually maintaining the server infrastructure.
5. Scalability
Scalability in shared hosting is limited. As businesses or websites grow, exceeding the shared resources' capabilities requires upgrading to higher plans or relocating to VPS or dedicated servers. This limitation poses a challenge for rapidly growing websites that need flexibility in resource expansion. Shared hosting suits small sites with stable traffic but lacks the scalable infrastructure for businesses anticipating significant growth.
VPS hosting provides a scalable solution, allowing users to adjust resources like CPU, RAM, and storage as needed. This flexibility accommodates website growth without needing downtime or data migration. Users can seamlessly scale their resources to match demands, making VPS an attractive choice for growing businesses or those with variable traffic levels.
Expert tip: VPS hosting can be scaled in real-time, so set automated alerts to notify you when resources like RAM or CPU approach their limits.
6. Control and Customization
Shared hosting offers limited control due to its managed nature. Hosting providers control server configurations, limiting users to what is necessary for basic site functionality. While this provides ease of use for beginners and non-technical users, it restricts customization opportunities, posing challenges for businesses with specific needs or requiring unique software installations. Users are generally confined to pre-established settings and available applications as determined by the hosting provider.
VPS hosting affords users greater control and customization over their server environment. With root access, users can configure settings, choose operating systems, and install custom software, tailoring the server to specific needs. This level of control supports websites or applications with unique requirements, allowing tailored optimizations and fine-tuning. VPS hosting is suited for developers, businesses requiring particular tech stacks, or those wishing to exert more influence over their hosting conditions.
Expert tip: Use VPS hosting to test and implement custom server configurations or software, which is often impossible on shared hosting plans.
How to Choose Between VPS and Shared Hosting
When choosing between VPS and shared hosting, understanding the specific needs of your website or application is crucial. Each hosting type offers distinct advantages and limitations, making them suitable for different scenarios. Below are key considerations to help guide your decision:
Resource allocation transparency
In shared hosting, resource allocation is typically opaque, making it difficult to understand exactly how much CPU, RAM, or bandwidth is available to your site at any given time.
VPS hosting offers clear resource allocation, allowing you to monitor and manage exactly how much of each resource your site uses.
Backup and recovery options
Shared hosting often comes with basic backup solutions provided by the hosting company, but these may have limitations in frequency and accessibility.
VPS hosting usually offers more robust backup options, including the ability to create your own backup schedules and configurations.
Compliance and regulatory requirements
For websites subject to specific industry regulations (e.g., GDPR, HIPAA), shared hosting might not provide the necessary environment to meet strict compliance standards.
VPS hosting can be configured to meet strict compliance requirements, offering the isolation and customization needed to implement specific security measures and data controls.
Development and testing environments
Shared hosting is less suited for creating staging or testing environments, as it typically lacks the flexibility to support multiple isolated environments on a single plan.
VPS hosting allows you to set up multiple environments (e.g., production, staging, testing) on the same server, making it a preferred choice for developers and teams.
Support for legacy software
Shared hosting environments often have restrictions on the types of software and versions you can run, making it challenging to support older, legacy applications.
VPS hosting provides the freedom to run legacy software or specific configurations that may not be supported by shared hosting.
Cross-platform compatibility
Shared hosting environments are generally standardized, which can limit your ability to use specific operating systems or frameworks.
VPS hosting allows you to choose and configure your operating system and software stack, ensuring compatibility with a wider range of platforms and technologies.
VPS Hosting in the Cloud with Atlantic.net
VPS Hosting from Atlantic.Net gives you the freedom to create and deploy one or many virtual servers in seconds. By combining the most advanced VPS hosting innovations and resources available, the Atlantic.Net Cloud offers simplicity, security, scalability, and reliability that will not only improve your virtual private server performance but also reduce your costs.
With Atlantic.Net, you get the full suite of Cloud VPS hosting services: compute, redundant storage platforms, One-Click Apps, DNS, private networking, Onsite Backups, Offsite Backups, Secure Block Storage, and more, all backed by 24x7 support and a full range of managed services your business needs to succeed.
Learn more about Atlantic.net VPS Hosting
### The 4 Levels of PCI Compliance: What You Need to Comply
What Are PCI Compliance Levels?
PCI (Payment Card Industry) compliance levels categorize merchants based on their volume of credit card transactions per year. The PCI Security Standards Council establishes these criteria to prevent fraud. Depending on the number of transactions, companies must adhere to different security measures. This classification ensures that merchants implement necessary safeguards commensurate with the risks involved in processing transactions.
This is part of a series of articles about PCI compliant hosting.
The 4 PCI Compliance Levels in Detail
PCI Level 1 Compliance: Global Retailers and Enterprises
Level 1 PCI compliance is mandatory for large enterprises processing over 6 million credit card transactions annually. These organizations face significant risks due to their transaction volumes, requiring stringent security measures. To achieve Level 1 compliance, businesses must conduct an annual on-site assessment by a Qualified Security Assessor (QSA). They must also perform a network scan by an Approved Scanning Vendor (ASV) each quarter.
This compliance level focuses on thorough protection against data breaches. Companies at this level typically have complex infrastructure, necessitating detailed security controls. This includes encryption, secure processing environments, and security policies. Continuous monitoring and regular assessments ensure these practices are maintained, reducing the risk of data loss.
PCI Level 2 Compliance: Regional and Mid-Sized Enterprises
PCI Level 2 compliance targets businesses processing between 1 and 6 million transactions annually. While the transaction volume is lower than Level 1, these entities still face considerable risks. Companies must complete a Self-Assessment Questionnaire (SAQ) annually and conduct quarterly network scans. This helps them identify and mitigate potential vulnerabilities in their systems.
Similar to Level 1, compliance involves maintaining stringent security protocols, although the audit process might be less intensive. Focus areas include maintaining a secure network and implementing access control measures. By fulfilling these requirements, mid-sized enterprises can significantly reduce the risk of data breaches.
PCI Level 3 Compliance: Medium-Sized Businesses
Level 3 compliance is suited for businesses processing 20,000 to 1 million transactions annually, typically involving e-commerce operations but also relevant to any business handling that number of transactions online. These enterprises must complete an annual Self-Assessment Questionnaire (SAQ) and conduct quarterly network scans to identify vulnerabilities. Such measures help safeguard sensitive cardholder information within their payment systems and reduce exposure to cyber threats.
Network security and secure transaction processing are core components under Level 3 requirements. By adhering to PCI DSS requirements, businesses can prevent unauthorized access and data disclosure.
PCI Level 4 Compliance: Small and Local Businesses
PCI Level 4 compliance is for businesses processing fewer than 20,000 transactions annually. This level addresses the unique security needs of small and local businesses. Although the transaction volume is lower, these entities must still take steps to ensure data security. Completing annual Self-Assessment Questionnaires (SAQs) and undertaking quarterly scans are crucial components in this process.
While the requirements may not be as stringent, maintaining compliance is essential for protecting customer data from vulnerabilities. Level 4 businesses must implement basic security measures such as firewall configurations and secure access controls.
PCI DSS Levels for Service Providers
Service providers play a critical role in the payment processing ecosystem, and their compliance is just as important. PCI DSS levels for service providers are defined differently from merchant levels.
Level 1 Service Provider
Level 1 service providers process over 300,000 card transactions annually. These providers must undergo an annual on-site audit by a Qualified Security Assessor (QSA). Additionally, they are required to conduct network scans by an Approved Scanning Vendor (ASV) quarterly. This rigorous process ensures that all systems are properly secured and vulnerabilities are addressed immediately.
Level 2 Service Provider
Level 2 service providers handle less than 300,000 transactions annually. They are required to perform an annual Self-Assessment Questionnaire (SAQ) to evaluate their security practices. Additionally, quarterly network scans are critical components in the compliance process.
PCI Evaluations by Compliance Level
The following table explains the different evaluations required for PCI Compliance and which evaluations are relevant for each compliance level.
Evaluation
Description
Merchant L1
Merchant L2
Merchant L3
Merchant L4
SP L1
SP L2
QSA (Qualified Security Assessor)
An independent external audit conducted by a PCI-approved security assessor to ensure compliance with PCI DSS standards.
v
v
ASV (Approved Scanning Vendor)
A vulnerability scan performed quarterly by a PCI-approved vendor to identify potential weaknesses in the network infrastructure.
v
v
v
v
v
SAQ (Self-Assessment Questionnaire)
A self-assessment that merchants and service providers complete annually to evaluate their security controls and adherence to PCI DSS requirements.
v
v
v
How to Determine Your PCI DSS Compliance Level
Determining your PCI DSS compliance level involves assessing the volume of payment card transactions your organization processes annually. The process typically includes the following steps:
Calculate annual transaction volume: Start by calculating the total number of credit card transactions your business processes in a year. This includes all transactions, whether they are online, in-store, or through any other sales channel.
Identify merchant or service provider status: Determine whether your business is classified as a merchant or a service provider. Merchants are entities that accept payment cards as a form of payment, while service providers manage transactions on behalf of merchants or other service providers.
Match transaction volume to PCI compliance level: Compare your annual transaction volume to the thresholds set by the PCI Security Standards Council:
Level 1: More than 6 million transactions annually.
Level 2: Between 1 and 6 million transactions annually.
Level 3: Between 20,000 and 1 million e-commerce transactions annually.
Level 4: Fewer than 20,000 e-commerce transactions or up to 1 million transactions across other channels annually.
Review compliance requirements: Once your compliance level is determined, review the specific PCI DSS requirements for that level. This will include understanding the required documentation, security controls, and assessment procedures such as whether you need an on-site audit or a Self-Assessment Questionnaire (SAQ).
Regularly reevaluate: Transaction volumes can change, especially as your business grows. It’s important to regularly reevaluate your PCI compliance level and adjust your security practices accordingly to stay compliant.
PCI Hosting Services and Solutions by Atlantic.Net
PCI Hosting by Atlantic.Net™ is SOC 2 and SOC 3 certified, designed to secure and protect critical health data, audited by a qualified and an independent third-party CPA firm. If your company requires PCI-DSS compliance (Payment Card Industry Data Security Standard), Atlantic.Net's managed security and compliance hosting services coupled with our Cloud Platform and Dedicated Hosting will provide you the easy button to help achieve and exceed your credit card industry PCI compliance requirements!
With our expanded network capacity and hardened data centers, your business will be able to achieve the uptime and cyber-security requirements for PCI compliance. You can meet your customers' needs and accept online payments while maintaining PCI compliance and reducing your overall cost. Gain the competitive advantage you need with ease with our PCI-Compliant Hosting, backed by a 100% SLA.
Learn more about Atlantic.net PCI-compliant web hosting
### What Is Dedicated Server Hosting?
What Is Dedicated Server Hosting?
Dedicated server hosting provides a physical server exclusively for one user or organization. This contrasts with shared hosting, where multiple users share a single server. Because the server has dedicated resources, performance is typically superior compared to shared or virtual hosting, with more reliable uptime and faster processing speeds.
Furthermore, dedicated servers allow full control over server configuration, software, and security measures. Users can tailor the hardware and software environment to meet specific needs, ensuring compatibility with various applications. This makes dedicated hosting preferable for businesses with specific technical requirements and security protocols.
This is part of an extensive series of guides about IaaS.
What Are the Benefits of a Dedicated Server?
Let’s explore the key benefits that set dedicated servers apart from other hosting options:
Enhanced performance and reliability: With dedicated server hosting, all server resources are allocated to a single user. This exclusivity ensures that high-demand applications receive the necessary computing power without being affected by other users, as is common in shared hosting environments.
Improved security: Dedicated servers provide a higher level of security compared to shared hosting. Since no other users share the server, there is no risk of cross-site contamination or security breaches caused by neighboring accounts. Additionally, dedicated servers allow for the implementation of customized security measures, including firewalls, encryption protocols, and intrusion detection systems tailored to specific organizational needs.
Complete control and customization: A dedicated server grants full administrative access, enabling users to customize the server environment extensively. This includes the ability to select the operating system, install preferred software, and configure settings to optimize performance for specific applications.
Vertical scalability: Dedicated servers offer extensive options for vertical scalability, allowing businesses to adjust resources like CPU, RAM, and storage to accommodate growth. As demand increases, the server's hardware can be upgraded to meet new requirements. However, in some cases vertical scaling might require migrating to a different physical server.
Exclusive IP address: Unlike shared hosting, where multiple users share a single IP address, dedicated server hosting provides a unique IP address for each server. This is particularly important for businesses running eCommerce sites. A dedicated IP also reduces the risk of being blacklisted due to the actions of other users, ensuring that email deliverability and search engine rankings are not negatively impacted.
How Does Dedicated Hosting Work?
Dedicated hosting operates by allocating an entire physical server exclusively to a single client. Unlike shared hosting, where multiple users share the same hardware resources, dedicated hosting ensures that all of a server's CPU power, RAM, storage, and network bandwidth are available solely to the tenant.
When a user opts for dedicated hosting, they are typically given administrative control over the server. This control allows them to configure the server environment according to their specific needs, including the choice of operating system, software installations, and security settings. Depending on the hosting provider, the server may come pre-configured, or the user might set it up from scratch.
Dedicated servers are hosted in data centers, where they are connected to high-speed internet and power infrastructure. These data centers often have security measures in place, including physical security, redundancy for power and networking, and fire protection.
The client is responsible for managing the server unless they opt for a managed service, in which the hosting provider takes care of maintenance tasks such as updates, backups, and monitoring. In the case of unmanaged hosting, the client must have the technical expertise to handle these aspects themselves.
Main Types of Dedicated Server Hosting
General-Purpose Servers
General-purpose servers are versatile machines designed to handle a wide array of tasks ranging from web hosting to simple database management. These servers balance processing power, storage, and memory to cater to diverse needs. Ideal for businesses that require reliable yet cost-effective solutions without the need for specialized hardware.
These servers provide an excellent starting point for businesses planning to scale. They offer a balance between performance and affordability for companies that do not require high-end computing power. As business requirements grow, these servers can be upgraded or transitioned into more specialized types that cater to more specific demands.
GPU Dedicated Servers
GPU dedicated servers are optimized for tasks that involve intensive graphical computations, such as video rendering, machine learning, and scientific simulations. Equipped with powerful graphics processing units, they excel in handling parallel processing tasks that would otherwise be too demanding for standard CPUs. They are essential for industries relying heavily on visual data processing or computational prediction models.
These servers offer substantial advantages in fields requiring rapid data processing and real-time feedback. By leveraging GPU technology, businesses can accelerate workflows that involve complex calculations, significantly reducing production times. These systems are becoming increasingly crucial as demand for applications featuring artificial intelligence grows.
Bare Metal Servers
Bare metal servers refer to physical servers with no virtualization layer, providing maximum performance. Users gain direct access to the server's full resources, eliminating the overhead associated with virtualized environments. This direct access results in improved speed and responsiveness, crucial for applications requiring high performance and minimal latency.
These servers are optimal for applications needing a high level of customization and security. By using bare metal, users can control the server environment entirely, implementing bespoke solutions not possible on virtualized platforms. This configuration is preferred for mission-critical applications where consistent performance and security are non-negotiable.
Managed Dedicated Servers
Managed dedicated servers come with a service package where the hosting provider handles server setup, maintenance, security, and monitoring. This service removes the burden of day-to-day server management from the client, allowing them to focus on core business activities. Such an arrangement ensures servers operate efficiently while expert teams handle regular updates and troubleshooting.
This approach is ideal for businesses lacking in-house technical expertise or resources to manage complex infrastructures. Managed services offer peace of mind, ensuring that professional teams address server issues promptly, optimizing uptime and performance.
Unmanaged Dedicated Servers
Unmanaged dedicated servers give users complete control over all server aspects, providing flexibility to manage software installations, security configurations, and patches. This approach suits businesses with strong technical teams capable of handling server operations autonomously. While more responsibility falls on the user, it also allows for deeper customization according to specific operational needs.
This hosting type is particularly advantageous for companies with unique technical requirements, as they can adjust the server environment without relying on third-party services. While unmanaged servers reduce hosting costs, the need for in-house expertise can increase internal expenses.
Dedicated Server vs. Shared Hosting vs. Cloud Hosting
Choosing the right hosting solution can significantly impact your website's performance and security. Here are the key differences between dedicated servers and other common hosting options:
Dedicated server hosting Dedicated server hosting provides exclusive access to a physical server, offering unparalleled performance, control, and security. This option is ideal for businesses with high-traffic websites, resource-intensive applications, or stringent security requirements.
Shared hosting Shared hosting is the most cost-effective hosting solution, where multiple users share a single server's resources. This makes it suitable for small websites or personal blogs with limited traffic and resource demands. However, shared hosting comes with limitations, such as slower performance, reduced security, and limited control over server configurations.
Cloud hosting Cloud hosting utilizes a network of virtual servers to host websites and applications, offering flexibility and scalability. Resources can be scaled up or down based on demand, making it an excellent choice for businesses with fluctuating traffic patterns. Cloud hosting provides redundancy and high availability, as data is distributed across multiple servers. However, it may not offer the same level of control and customization as dedicated hosting, and costs can vary depending on usage.
Learn more in our detailed guide to dedicated server vs shared hosting (coming soon)
How Much Does Dedicated Server Hosting Cost?
The cost of dedicated server hosting varies widely depending on the provider and the specific server specifications required by the user. On average, you can expect to pay at least $100 per month for a basic dedicated server. This entry-level pricing typically offers lower resources, such as minimal CPU power, RAM, and storage, making it suitable for small businesses or startups with moderate traffic and resource needs.
As you move to higher price tiers, the available resources increase. Mid-priced dedicated servers generally provide better hardware, such as more CPU cores, larger amounts of RAM, and faster storage options like NVMe SSDs. These servers are designed for growing businesses that need to handle more complex workloads and larger volumes of data.
For enterprises with demanding performance needs, premium dedicated servers offer cutting-edge hardware and maximum resources. These top-tier servers are equipped with the highest number of CPU cores, extensive RAM, advanced security features, and high-speed storage solutions. Pricing for these servers reflects their capabilities, often reaching several hundred dollars per month, depending on the exact configuration and additional services provided.
Related content: Read our guide to low cost dedicated server hosting (coming soon)
How to Choose a Dedicated Server Hosting Provider
Understand Your Workload
Understanding your workload is essential when selecting a dedicated server hosting provider. Businesses must evaluate the type and amount of data managed to ensure they choose a server that can handle peak loads efficiently. This includes assessing the number of simultaneous users, application demands, and storage needs, ensuring that the selected server matches your business’s operational requirements.
This evaluation will prevent overinvestment in unnecessary specifications or under-provisioning, which can lead to performance issues. By accurately assessing workload requirements, businesses can make informed decisions, ensuring their servers’ performance matches current and future demands.
Evaluate Hardware Options
Evaluating hardware options is a critical step in choosing a hosting provider for your dedicated server. The server’s processor, RAM, storage type, and network capabilities must align with your business's computing needs. For instance, businesses running intensive applications should opt for servers equipped with powerful CPUs and large memory capacities for optimal performance.
Additionally, the choice between SSDs and HDDs can impact server speed and reliability, influencing data access times and overall system responsiveness. By matching hardware components with your business's specific technical demands, you can optimize server performance, ensuring effective resource utilization and scalability as needs evolve.
Consider the Location of Data Centers
Considering the location of data centers is pivotal in selecting a dedicated server provider. Data center proximity affects latency and data transfer speeds, impacting user experience and application performance. Choosing a provider with strategically located data centers can enhance service delivery, ensuring faster response times for end-users and meeting compliance with data residency laws.
Proximity also influences factors like redundancy and backup processes. Businesses can benefit from choosing data centers near primary user bases to minimize downtime and ensure quick recovery in case of disruptions.
Check for Reliability and Uptime Guarantees
Checking for reliability and uptime guarantees is crucial when evaluating dedicated server hosting providers. High uptime percentages, often exceeding 99.9%, are indicative of robust network infrastructures and diligent maintenance practices, ensuring minimal downtime and consistent availability of services. Providers with strong SLAs (Service Level Agreements) can offer peace of mind by promising specified performance levels.
It’s essential to scrutinize a provider’s historical uptime records and service transparency to ensure reliability. Robust infrastructures help safeguard against potential disruptions, allowing business operations to proceed without interruptions.
Evaluate Security and Compliance Features
Evaluating security features is paramount when choosing a dedicated server hosting provider. With cyber threats becoming increasingly sophisticated, it’s crucial to ensure that hosting services offer security measures such as firewalls, DDoS protection, and regular security audits. Reliable providers often include security monitoring and incident response strategies as part of their service offerings.
Additionally, compliance with industry standards and regulations (such as GDPR or HIPAA) should be an integral consideration, aligning with the business’s specific data protection requirements.
Dedicated Server Hosting with Atlantic.Net
Unleash the huge server power of Atlantic.Net dedicated server hosting services, America's most experienced dedicated server hosting provider. Each private, physical dedicated server comes with full root access, backed by the latest hardware specifications and USA-based support.
Atlantic.Net provides various types of dedicated server hosting options, all available with discounts for long-term contracts. Dedicated Servers are a standalone hardware offering not tied into any existing Cloud platforms or hypervisors, such as the Atlantic.Net Cloud Platform. The hardware is solely set up for your requirements along with any additional Managed Services to ensure the hosting environment meets your needs.
Our Dedicated Servers are custom-built to your specification with a choice of CPU, Disk, and Memory (RAM). Each server is available with full root access for complete server control. Our dedicated hosting services come with a dedicated network IP address, free SSL certificate, and support for a wide selection of operating systems and control panel options to supercharge your web hosting experience.
Learn more about Atlantic.net dedicated server hosting
Learn More About Dedicated Hosting Services:
What is a dedicated server?
Dedicated server hosting is a service where users are provided with multiple resources specifically dedicated to their hosting requirements and business needs. There is no sharing of resources; rather, the user gets to control resources such as bandwidth, RAM, or memory as per their needs. Dedicated server hosting services provide complete server control directly to the user from the web hosting provider. With a dedicated server, you control resource allocation, operating system, and all other services. Our support teams are available should you need help. For our dedicated hosts, bare metal servers, and dedicated servers, we can provide SATA SSDs, or NVMe SSDs.
What do you mean by dedicated hosting?
Dedicated hosting is a service where users are provided with multiple resources specifically dedicated to their hosting requirements. There is no sharing of resources; rather, the user gets to control dedicated server resources such as bandwidth, RAM, or memory as per their dedicated hosting needs. It is ideal for the growing needs for powerful infrastructure, security, compliance,
flexibility, and cost-effectiveness that come with having its own computing infrastructure. You may need a dedicated web host to support a large number of business websites; perhaps you are a
reseller who plans to set up shared hosting and offer your dedicated server as virtual private server hosting for your customers. Dedicated hosting gives you the power to manage your site, your server, and the storage as you please since you are fully in control of the server.
Do I need dedicated hosting?
Dedicated hosting services can be used for more resource-intensive projects. Dedicated Servers are perfect for any mission-critical application, as these programs need guaranteed uptime, improved control, and superb reliability. Dedicated servers work well for high-volume websites and as backup servers because the IO throughput is extremely quick, perfect for data-intense backup clusters.
Who is the best dedicated server host in the USA?
When choosing web hosts and identifying the best dedicated hosting services, it's important to consider reliability, flexibility, cost, and performance. Atlantic.Net USA has been providing quality, award-winning web hosting services since 1994. We have a proven track record in providing world-class dedicated server solutions. Atlantic.Net has been recognized for multiple prestigious awards including Excellence in Customer Service Award in 2024, America's Stevie Awards, Global Infosec Award, Fortress Cyber Security Award, Gold Globee Award, and more.
What does a dedicated server do?
Dedicated servers can be used for various projects, especially projects that are more resource-intensive. Dedicated servers are perfect for any mission-critical application, as these programs need
guaranteed uptime, improved control, and superb reliability. They make a great value server, perfect for database servers and data science platforms, and are excellent video conferencing hosts due
to the extensive bandwidth available. Dedicated Servers are the first iteration of providing dedicated resources to a customer to host their website, applications, files, and more. Today, a single dedicated server is a great starting place for a business with a good reason not to move into Atlantic.Net’s Cloud Platform. Some reasons why a customer might want a Dedicated Server over Virtual Private Servers are the need for an operating system at end-of-life, physical hardware keys, software restrictions, custom configurations, and compliance requirements. Another
reason that customers opt for dedicated servers is when they provision a fully private cloud environment built with dedicated servers to meet their uptime needs, but want to avoid using any part of a public cloud. Dedicated servers are also very popular with our healthcare customers, as we have made it easy to make them HIPAA-Compliant with our Managed Services.
Who needs dedicated hosting?
Choosing the best managed hosting plan for your needs is always challenging, especially considering the breadth of options available on the market. If you need just a simple website, then shared hosting VPS hosting plans are a great choice. With shared web hosting, you get options for unmetered bandwidth, a free SSL certificate, and a useful user control panel, all perfect for web hosting. On the other hand, if you need to host multiple sites or critical business applications with the option for fully managed services, then dedicated web hosting is what you need instead of shared hosting.
Why is dedicated web hosting expensive?
This is a question we get asked all the time: why does dedicated web hosting have relatively high prices compared to other hosting plans? The simple answer is that in real terms with most web hosts, the associated costs are way cheaper than going it alone. A typical dedicated server costs anywhere from $20,000 and up, not to mention the costs of cooling, power, redundancy, managed hosting, unmetered bandwidth, and technical support teams. In reality, Atlantic.Net has some of the most affordable dedicated hosts available from any cloud web hosting provider.
Why use Atlantic.Net hosting services instead of using a server in my office?
In theory, yes, it's possible to self-host a server. However, you will need to contact a service support provider and fork out thousands of dollars to purchase the server. You will need to buy storage, networking hardware and pay for bandwidth, have a rack space to host and cool the server, and hire employees to support the server, manage access, and so forth. You’ll also need generators, physical security, monitoring, and more – functions that Atlantic.Net takes care of for you with dedicated hosting. You also benefit from the redundancy for physical space, servers, networking, and more resulting Atlantic.Net’s economies of scale and industry pricing we get on all parts of our products. Purchasing a dedicated server from us will save you money throughout the contract compared with the relatively high prices if doing it yourself.
How do I buy or lease a dedicated server?
You can spec out your application, site, or project and email or call us at sales@atlantic.net and 888-618-3282, and we will be happy to assist you. Generally speaking, you can get the best affordable price if you commit to a three-year term, but custom and flexible plans with monthly prices with one-year and two-year terms are also available.
Can a dedicated server have more than one IP address?
Absolutely yes, we can provide you with additional IP addresses for your dedicated servers, allowing you to meet those more complicated needs. If you need help configuring multiple IP addresses or need help with your bandwidth requirements, please contact our support teams
How good is a 32GB dedicated server?
It all depends on your needs, but a 32GB dedicated server has ample memory to conduct memory-intensive tasks. Most resources that are required depend on the workload and users that will be using the server and the services the server provides. It also depends on your budget; as you add more memory, your monthly cost goes up, too. If you are unsure, please reach out to sales@atlantic.net where we have sales engineers ready to answer your questions and help you achieve optimal performance for your budget.
How much is a dedicated server?
Dedicated Servers can range from mid-$200s to thousands of dollars, depending upon your needs and workloads. Atlantic.Net has options to fit your needs and your budget
How do I manage a dedicated server?
A dedicated server will be provided to the customer with RDP or SSH access, and a dedicated cloud host can be controlled through the Atlantic.Net Cloud Portal. Bare-metal servers can be supplied with any operating system the customer chooses, be it Windows, Linux, Hyper-V, or VMware ESXi, and we will provide remote access to manage them.
What is the difference between SATA SSDs and NVMe SSDs?
NVMe SSDs are much faster than SATA SSDs...7x faster! Generally, both SATA and NVMe use the same type of solid-state data storage technologies, but they differ in the type of interface speed used to read and write data. NVMe allows modern SSDs to operate at the read/write speeds of their flash memory by directly communicating through the computer's PCIe interface, whereas SATA SSDs are limited by the slower SATA interface. For our dedicated hosts, bare metal servers, and dedicated servers, we can provide SATA SSDs, or NVMe SSDs.
What operating system is available on dedicated hosting?
Flexibility is key; you can have almost any operating system your wish. This includes server hypervisors such as Hyper-V and VMware, Windows Server, and Linux flavors. Don't see the
operating system you want? No problem! Just get in touch today, and we will be happy to accommodate your requirements and help you with the maximum customization possible. While there is no set standard for operating systems, most data center service providers provide various options to choose from, including Debian, OpenBSD, NetBSD, FreeBSD, Fedora Core, and CentOS, just to name a few. Available now on Atlantic.Net: Linux: CentOS, Ubuntu, Rocky, Fedora, Debian, Arch, and FreeBSD Windows Server: Windows Server 2016, Windows Server 2019, and Windows Server 2022.
Do I get unlimited bandwidth on my server?
We provide fully customized solutions and flexible bandwidth options to meet and exceed your requirements. All servers come with unlimited inbound bandwidth.
What is the 100% Uptime SLA?
Our servers (and all of our hosting platforms, private, public, and shared hosting) feature a 100% uptime guarantee. Atlantic.Net has created a hosting environment that offers the best
possible environment to help prevent hardware issues. Our tier 3 data centers are the backbone of our server hosting, protected by our industry-leading service level agreement,
all of our customers can be assured of the best possible service and support.
Network Uptime - 100% Guaranteed
We have invested immensely in our network infrastructure services, and they are the cornerstone of our entire platform. The network is built with security, performance, and resiliency at
its core and Atlantic.Net ensures that the network will be available 100% of the time in any given month (excluding scheduled maintenance). If it takes us more than 30 minutes to resolve the network issue from the time a ticket is opened, Atlantic.Net will refund the customer 5% of the monthly fee for each additional 30 minutes of downtime (up to 100% of the customer’s monthly fee for the specific equipment affected). Network uptime includes the functioning of all network infrastructure such as routers, switches, and cabling, but does not include software and services running on your server.
Hardware - 100% Guaranteed
We only use the latest hardware in our data centers, and each server uses Intel Xeon CPU and other premium hardware. Protecting your hardware is vitally important. Atlantic.Net guarantees all hardware components in your dedicated server and will replace any failed components at no cost to you. Once Atlantic.Net determines the cause of the problem, hardware replacement will commence. If it takes us more than one hour to replace the faulty hardware from the time the cause is determined, Atlantic.Net will refund 5% of the monthly fee
per additional hour of downtime (up to 100% of your monthly fee for the specific server affected).
Infrastructure - 100% Guaranteed
The rest of our hosting infrastructure is also protected by a 100% SLA, all critical infrastructure components including power supplied to your server and HVAC will be available 100% of the time in a given month (excluding scheduled maintenance). If it takes us more than 30 minutes to resolve the infrastructure issue from the time the trouble ticket is opened, Atlantic.Net will refund 5% of the monthly fee per additional 30 minutes of downtime (up to 100% of your monthly hosting account fee for the specific server affected). Critical infrastructure includes the functioning of all power, HVAC, and cabling but does not include the power supplies on customers’ servers.
Are the dedicated hosting data centers certified?
We provide hosting services and solutions from eight global regions. Every region is certified and certifications vary from region to region. Here is a list of some of the certifications:
HIPAA Audited
HITECH Audited
SOC 1
SOC 2
SOC 3
ISO 27001
ISO 14001
ISO 90001
NIST
What are your data center regions in the USA?
We provide hosting services and solutions from eight global regions. Every region is certified and certifications vary from region to region. Here is a list of our USA-based hosting regions:
New York
San Francisco
Dallas
Ashburn
Orlando
See Additional Guides on Key IaaS Topics
Together with our content partners, we have authored in-depth guides on several other topics that can also be useful as you explore the world of IaaS.
AWS Cost Optimization
Authored by Finout
Free and Open Source AWS Cost Optimization Tools
AWS Cost Optimization: 6 Free Tools & 10 Hacks to Cut AWS Bills
What Are AWS Spot Instances, Pros/Cons, and 6 Ways to Save Even More
Cloud Cost Optimization
Authored by Intel Tiber
Cloud Cost Optimization: 8 Key Best Practices
What Is Cloud Cost Management? Best Models and Tools
How Do Cloud Server Costs Work? A Quick Cost Comparison
AWS ECS
Authored by Lumigo
AWS ECS: Understand Launch Types, Service Options & Pricing
AWS ECS vs. EKS: 5 Key Differences and How to Choose
ECS vs. Kubernetes: 6 Key Differences and How to Choose
### Ecommerce Security Best Practices & Adding Ease-of-Use
Ecommerce businesses typically handle large volumes of sensitive customer data, such as credit card data, personal details, other financial data, and browsing history. Protecting this sensitive data is not only a legal and ethical responsibility but also crucial for maintaining customer trust and the long-term success of your online business.
In this article, we will explore the complexity of ecommerce security and look at common ecommerce security threats that businesses face. We'll discuss essential security measures to implement and provide actionable tips for enhancing the overall user experience on your ecommerce website. By understanding the risks and taking proactive steps to mitigate them, you can create a secure and trustworthy online environment for your customers.
Understanding Ecommerce Security
Ecommerce is a prime target for hacking communities, and ecommerce security threats are constantly changing. This rapidly changing security ecosystem makes it imperative for ecommerce businesses to stay vigilant and adapt their security strategies as the trends change.
Let's examine some of the most common ecommerce security threats that may target your platform and customer data:
#1: Data Breaches
Data breaches involve unauthorized access to sensitive customer data, often resulting in identity theft, financial fraud, and reputational damage for e-commerce sites. Ecommerce security breaches occur for various reasons, but some of the most common reasons include weak system passwords, unpatched software vulnerabilities, and inadequate security protection such as anti-malware software and anti-virus software.
The repercussions of a data breach can be devastating for your ecommerce business, potentially leading to financial losses, losing customers, and potential legal consequences.
#2: Cross-Site Scripting (XSS)
Cross-site scripting (XSS) is a popular attack vector used to exploit vulnerabilities in web applications to inject malicious code into web pages. This malicious code can then be executed on the victim's browser, allowing hackers to steal customer information, hijack sessions, or deface an ecommerce site.
XSS attacks are particularly dangerous because they can target unsuspecting users who simply visit a compromised ecommerce site.
#3: SQL Injection
SQL injection attacks target vulnerabilities in web applications to gain unauthorized access to databases. By injecting malicious SQL queries, hackers can retrieve, modify, or delete sensitive customer data directly from the database.
SQL injection attacks can also be used to hijack websites or gain complete control over ecommerce website content. These attacks highlight the importance of strong database security and enabling input validation protections.
#4: Brute Force Attacks
Hackers use brute force attacks to repeatedly guess passwords or encryption passphrases until they gain access to the systems that hold the sensitive data. These attacks can be time-consuming but are often successful against weak or easily guessable passwords.
Implementing strong password policies, multi-factor authentication, and account lockout mechanisms will help to effectively prevent brute force attacks.
#5: Distributed Denial of Service (DDoS) Attacks
DDoS attacks aim to overwhelm ecommerce websites with a massive spike of traffic, rendering an ecommerce site inaccessible to legitimate customers and disrupting online transactions. These attacks are often launched by botnets coordinated by groups of hackers.
DDoS often results in downtime, and downtime costs ecommerce businesses money, which can result in significant financial losses and reputational damage. DDoS mitigation managed services and robust network infrastructure (and monitoring) are crucial for repelling such attacks.
#6: Phishing Attacks
Phishing attacks rely on deceptive tactics to trick users into revealing their personal information or login credentials. These attacks often involve fraudulent emails, websites, or social media messages that impersonate legitimate ecommerce companies or financial institutions. Educating customers about phishing scams and social engineering is critical, and implementing email authentication protocols can improve the ecommerce security required to help prevent phishing attacks.
#7: Malware and Ransomware Attacks
Malware and ransomware attacks involve the use of malicious software to infect ecommerce sites, steal data, and encrypt files. Ransomware attacks, in particular, can cripple online businesses by demanding a ransom payment in exchange for the decryption key.
Regular software updates, anti-malware solutions, and secure backups are essential for protecting against these threats.
#8: Third-Party Integrations
Integrating third-party services into your ecommerce platform offers significant benefits to business, but remember: ecommerce security is a shared responsibility. When you partner with a third-party provider, you're essentially extending your trust to them. Choose providers that prioritize security as much as you do, ensuring their ecommerce security practices align with industry best practices.
Safeguarding Your Ecommerce Business Customer Data
Protecting your business and your customer data requires a multi-layered approach to e-commerce security. The good news is that there is plenty that can be done to improve your security posture.
By implementing the following essential ecommerce security measures, you will significantly reduce your risk of cyberattacks and data breaches.
#1: Secure Sockets Layer (SSL) Certificates
SSL certificates encrypt data transmitted between the customer's browser and a web server, ensuring genuine connections and secure online transactions on your ecommerce website. This encryption prevents hackers from intercepting and stealing sensitive information, such as credit card details or login credentials.
Look for the padlock icon and "https://" in the address bar to confirm that an ecommerce website is using an SSL certificate. You can also view more information about the certificate from your browser to ensure you are browsing the genuine site.
#2: Strong Password Policies
Enforcing strong password policies is fundamental to e-commerce security. Encourage customers and employees to create complex passwords that include a combination of uppercase and lowercase letters, numbers, and symbols. Such policies can be enforced by tools like Group Policy.
Create a policy that requires the user to implement regular password changes and consider implementing password managers to help users generate and store secure passwords.
#3: Multi-Factor Authentication (MFA)
Multi-factor authentication (MFA) adds an extra layer of security to servers and websites by requiring users to provide additional verification, such as a code sent to their mobile device or a fingerprint scan, before accessing their accounts. This significantly reduces the risk of unauthorized access even if passwords are compromised.
#4: Web Application Firewalls (WAFs)
Web application firewalls (WAFs) filter and monitor traffic to e-commerce websites, blocking malicious requests and protecting against common security threats like SQL injection and cross-site scripting. The WAF acts as a logical barrier between your website and potential attackers, analyzing incoming traffic and identifying suspicious patterns.
Remember, its also possible to configure your WAF to intelligently block known ecommerce security threats, and if a 0-day threat is detected, the WAF can be quickly updated to give you immediate protection across your entire technology stack.
#5: Anti-Malware and Anti-Virus Software
Regularly updating your anti-malware and anti-virus software, along with timely installation of security patches, is crucial for detecting and removing malicious software that could compromise your e-commerce systems.
These programs are often the first physical line of defense against security threats on your devices; they scan your files and network traffic for known threats and can quarantine or delete infected files.
#6: Regular Security Audits and Vulnerability Scans
Conducting periodic security audits and vulnerability scans helps to identify and address potential weaknesses in your ecommerce platform and security measures. These assessments can uncover outdated software, misconfigurations, or other vulnerabilities that could be exploited by hackers.
Regular audits ensure that your ecommerce business security posture remains strong and up-to-date, they serve as a baseline for all future security hardening. It's important to have administrative safeguards in place to follow up on the recommended actions to ensure the issues found are fixed promptly.
#7: Data Encryption
Encrypting sensitive customer data, both at rest (stored on your servers) and in transit (transmitted over networks), protects it from unauthorized access in case of a data breach. Encryption scrambles the data, making it unreadable without the decryption key. This adds an extra layer of protection for your customer's information, such as credit card details or personal information.
#8: PCI-DSS Compliance
If your ecommerce website accepts credit card payments, ensure compliance with the Payment Card Industry Data Security Standard (PCI DSS). This standard outlines a set of security requirements for handling cardholder data, including encryption, secure storage, and regular vulnerability assessments. PCI DSS compliance demonstrates your commitment to protecting customer payment information.
#9: Intrusion Protection Systems (IPS)
Intrusion detection and prevention systems (IDPS) monitor network traffic for suspicious activity and can automatically block potential threats. These systems analyze traffic patterns, identify anomalies, and take action to prevent unauthorized access or data exfiltration. An IPS can be a valuable tool for detecting and stopping cyberattacks no your online store in real-time.
#10: Regular Backups
Creating and storing secure backups of your e-commerce website and customer data is essential for recovering from disasters such as cyberattacks, hardware failures, or natural disasters. Backups should be performed regularly and stored in a secure off-site location. This ensures that you can restore your data and resume operations quickly in case of an unexpected event.
Enhancing User Experience for Your Online Store - Adding Ease-of-Use
For obvious reasons, ecommerce security is usually the number one priority when designing an e-commerce platform; however, defining the user experience is also key to creating security and adding ease-of-use to an online store.
Optimizing the user experience on your e-commerce site is crucial for building customer trust and driving sales. Now let's take another look and explore some best practices for creating a seamless and enjoyable shopping experience for customers in your online store:
#1:Guiding Customers Through Your Site
Implement clear and sensible navigation menus, breadcrumbs, and search functionality to help customers easily find the products they're looking for. A well-organized ecommerce store site structure and logical categorization of products contribute to a positive user experience and reduces customer frustration.
#2: Streamlined Checkout Process
Simplify the checkout process by minimizing the number of steps and required information. Offer guest checkout options, provide clear shipping and return policies, and ensure that the payment process is secure and user-friendly. A seamless checkout experience reduces cart abandonment rates and encourages repeat purchases.
#3: Mobile Optimization
With the increasing use of smartphones for online shopping, it's essential to optimize your e-commerce site for mobile devices. It's essential to get on top of the approval processes for Apple and Android app stores.
Ensure that your online store is responsive and adapts seamlessly to different screen sizes. A mobile-friendly experience enhances accessibility and caters to the growing number of on-the-go shoppers.
#4: Clear Product Descriptions and Images
Provide detailed and accurate product descriptions, along with high-quality images, to help customers make informed purchasing decisions. Transparency about product features, dimensions, and materials builds trust and reduces the likelihood of returns or customer dissatisfaction.
#5: Provide Customer Reviews and Ratings
Encourage customers to leave reviews and ratings for products they've purchased. Positive reviews and testimonials provide evidence of customer satisfaction and can influence other shoppers' purchasing decisions. Online stores that display customer feedback demonstrate transparency and build credibility.
#6: Offer Live Chat Support
Providing live chat support on your e-commerce site allows customers to get immediate answers to their questions or concerns. This real-time interaction fosters a sense of personalized service and can significantly improve customer satisfaction.
If you don't have the manpower, perhaps look at integrating virtual AI assistants to answer common customer questions. Live chat often helps ensure customers complete their purchase by addressing any last-minute hesitations or issues.
#7: Fast and Reliable Web Hosting
Choosing a fast and reliable web hosting provider is essential for ensuring that your e-commerce site is always accessible and performs optimally. Slow loading times or frequent downtime can frustrate customers and lead to lost sales, not to mention harm your SEO performance and ranking!
Look for a hosting provider that offers high uptime guarantees, robust security features, and scalable resources to accommodate traffic spikes.
#8: Transparent Pricing and Shipping Information
Be upfront and transparent about your pricing, shipping costs, and any additional fees. Surprising customers with hidden charges at checkout can lead to lost custom and negative reviews.
Clearly display all costs associated with a purchase and offer various shipping options to cater to different customer needs.
#9: Easy Returns and Exchanges
Having a clear and hassle-free return and exchange policy builds customer confidence and encourages purchases. Clearly communicate your return process and timeframe, and make it easy for customers to initiate a return or exchange if needed.
A positive return experience can turn a potentially negative situation into an opportunity to demonstrate excellent customer service.
#10: Personalized Recommendations
Utilize customer data and browsing behavior to provide personalized product recommendations. This can be achieved through algorithms that analyze purchase history, search queries, and other relevant factors.
Personalized recommendations enhance and streamline the shopping experience by showcasing products that are most likely to resonate with individual customers.
#11: Secure Payment Gateway
Partnering with a reputable and secure payment gateway is critical for protecting sensitive customer payment information. Ensure that your payment gateway is PCI DSS compliant and employs robust encryption and fraud prevention measures.
Displaying trust seals and security badges on your checkout page can further instill confidence in customers.
#12: Post-Purchase Engagement
Continue engaging with your customers even after they've made their purchase. Send order confirmation emails, provide tracking information, and solicit feedback on their shopping experience. Consider offering loyalty programs or exclusive discounts to encourage repeat business and foster long-term customer relationships.
Atlantic.Net: Your Ecommerce Security Hosting Partner
One of the quickest and most reliable ways to get ahead in ecommerce security is to partner with a proven hosting service provider like Atlantic.Net. Our security-defined hosting solutions harden your ecommerce platforms and protect customer information. Our VPS solutions provide industry-leading ecommerce security measures to protect your critical systems.
Our managed services add additional layers of protection, such as a managed SQL database. encrypted connection to your platform, intrusion detection systems, plus robust security measures like managed backup, server management, and DDoS protection to protect customer data. Handled payment data? No problem, we offer PCI-DSS ready managed hosting too.
Contact the team today and discover how Atlantic.Net can protect your ecommerce company from successful cyber attacks.
### How to Find Open Ports and Close Them in Linux
Managing open ports in Linux is crucial for system security. Open ports can be entry points for unauthorized access if not monitored properly.
This guide will walk you through finding open ports on your Linux system and how to close them to enhance your system's security.
What Are Open Ports in Linux?
An open port is a network port that accepts incoming connections. Ports are communication endpoints for networked devices, allowing services and applications to communicate over a network. There are two main types:
TCP Ports: Ensure reliable communication with error checking.
UDP Ports: Faster communication without error checking.
Each service or application running on your Linux system may listen on a specific port for incoming connections.
How to Find Open Ports in Linux
There are several tools available to identify open ports on your Linux system:
netstat: Network statistics tool.
ss: Socket statistics, a modern replacement for netstat.
lsof: Lists open files and ports.
nmap: Network scanner for discovering hosts and services.
1. Using netstat to List Open Ports
The netstat command displays network connections, routing tables, and interface statistics.
netstat -tuln
Output:
Active Internet connections (only servers)
Proto Recv-Q Send-Q Local Address Foreign Address State
tcp 0 0 0.0.0.0:22 0.0.0.0:* LISTEN
tcp6 0 0 :::80 :::* LISTEN
udp 0 0 0.0.0.0:68 0.0.0.0:*
This output shows SSH (port 22) and HTTP (port 80) are open and listening for connections.
Explanation:
-t: Shows TCP connections.
-u: Shows UDP connections.
-l: Lists listening ports.
-n: Displays addresses and port numbers in numerical form.
2. Using ss to Check Open Ports
The ss command provides similar functionality to netstat but is faster and more efficient.
ss -tuln
Output:
Netid State Recv-Q Send-Q Local Address:Port Peer Address:Port
udp UNCONN 0 0 0.0.0.0:68 0.0.0.0:*
tcp LISTEN 0 128 0.0.0.0:22 0.0.0.0:*
tcp LISTEN 0 128 [::]:80 [::]:*
The output shows open ports similar to Netstat.
3. Using lsof to Find Listening Ports
The lsof command lists open files, which can include network connections since they are treated as files in Unix-like systems.
lsof -i -P -n | grep LISTEN
Output:
sshd 1234 root 3u IPv4 1234567 0t0 TCP *:22 (LISTEN)
apache2 5678 www-data 3u IPv6 7654321 0t0 TCP *:80 (LISTEN)
This output shows that sshd is listening on port 22 and apache2 is listening on port 80.
Options Explained:
-i: Lists IP-related files.
-P: Shows port numbers instead of service names.
-n: Avoids DNS lookup for hostnames.
4. Scanning Open Ports with nmap
nmap is a powerful network scanning tool that can discover hosts and services on a network.
Run the following command to scan localhost.
nmap -sT localhost
Output:
Starting Nmap 7.60 ( https://nmap.org ) at 2023-10-01 12:00 UTC
Nmap scan report for localhost (127.0.0.1)
Host is up (0.000012s latency).
Not shown: 998 closed ports
PORT STATE SERVICE
22/tcp open ssh
80/tcp open http
This output shows that ports 22 and 80 are open on the localhost.
How to Close Open Ports in Linux
To close an open port, you generally need to stop the service using it.
The basic syntax to stop the service is shown below:
systemctl stop service-name
For example, if you want to close HTTP port 80, you will need to stop the Apache service.
systemctl stop apache2
To stop SSH port 22, run the following command:
systemctl stop sshd
Blocking Ports Using Firewall (iptables or UFW)
You can use firewall rules if you cannot stop a service but want to block access to a port.
Using iptables to Block a Port
iptables -A INPUT -p tcp --dport 80 -j DROP
Verify the added rules.
iptables -L
Output:
Chain INPUT (policy ACCEPT)
target prot opt source destination
DROP tcp -- anywhere anywhere tcp dpt:80
Using UFW to Block a Port
UFW (Uncomplicated Firewall) is a user-friendly frontend for iptables.
To close/block the port 80, run:
ufw deny 80/tcp
Verify UFW Status:
ufw status
Output:
Status: active
To Action From
-- ------ ----
80/tcp DENY Anywhere
80/tcp (v6) DENY Anywhere (v6)
Conclusion
Monitoring and managing open ports is a fundamental aspect of Linux system security. Regularly checking for open ports and closing or securing them reduces potential vulnerabilities. You can now easily find open ports and close them on dedicated server hosting from Atlantic.Net!
### How to Fix HTTPS Download Errors with wget
The wget command is one of the most powerful tools in Linux for downloading files from the web. It supports both HTTP and HTTPS protocols, allowing users to download files securely. However, HTTPS downloads can sometimes fail due to certificate issues or misconfigurations.
In this guide, we'll explore how to troubleshoot and fix HTTPS download errors when using wget.
What Is wget and Why Use It?
wget is a non-interactive command-line tool for downloading files over the web. It can download files via HTTP, HTTPS, and FTP protocols. wget is especially useful because it works in the background, supports recursive downloads, and can resume broken downloads.
While wget works seamlessly with HTTP links, HTTPS downloads can sometimes cause issues due to SSL certificate verification failures or other security-related problems.
Common Causes of HTTPS Download Errors with wget
When using wget with HTTPS URLs, some of the most common reasons for download failures include:
SSL certificate verification failure: The server's certificate is not trusted.
Outdated CA certificates: The client machine's certificate authority (CA) file is missing or outdated.
Self-signed certificates: The server is using a self-signed certificate.
Proxy misconfiguration: A proxy server or firewall is blocking the connection.
Outdated OpenSSL: wget relies on OpenSSL, and if it's outdated, issues may occur.
Let’s look at common HTTPS download error messages and how to fix them.
Common HTTPS Download Errors
Some typical errors you might encounter when downloading files via HTTPS using wget include:
SSL Certificate Error:
ERROR: The certificate of 'example.com' is not trusted.
ERROR: The certificate of 'example.com' hasn't got a known issuer.
Self-signed Certificate Error:
ERROR: The certificate of 'example.com' is self-signed.
Connection Timed Out:
ERROR: Failed to establish a connection.
Now, let’s go through how to fix these issues step by step.
Method 1: Ignoring SSL Certificate Checks
Sometimes the certificate verification fails due to a misconfigured server or an expired certificate. In such cases, you can bypass SSL verification with the --no-check-certificate option. However, be cautious when using this method as it disables security checks.
wget --no-check-certificate https://example.com/file
Note: This method is insecure and should only be used as a last resort or for trusted internal connections.
Method 2: Updating CA Certificates
If your system's CA certificates are outdated or missing, wget may fail to verify the SSL certificate of the server. Updating your CA certificates can resolve this issue.
Update CA Certificates on Debian/Ubuntu:
apt-get install --reinstall ca-certificates
Update CA Certificates CentOS/RHEL:
yum reinstall ca-certificates
After reinstalling CA certificates, try downloading the file again with wget.
Method 3: Manually Specifying a Certificate Authority (CA) File
If you have a custom or self-signed certificate, you can manually specify the CA file to be used by wget.
wget --ca-certificate=/path/to/ca-cert.pem https://example.com/file
This tells wget to use the specified CA certificate file to validate the server’s certificate.
Method 4: Fixing Proxy Issues
If your network uses a proxy, misconfigurations can cause wget to fail when downloading via HTTPS. To fix this, you can configure wget to use a proxy server either via the .wgetrc file or directly in the command.
wget --proxy=on --https-proxy=https://proxyserver:port https://example.com/file
Alternatively, edit the .wgetrc file to set proxy options globally:
nano ~/.wgetrc
Add the following lines:
use_proxy=yes
https_proxy=https://proxyserver:port
Method 5: Updating or Reinstalling OpenSSL
wget relies on the OpenSSL library to handle HTTPS connections. An outdated or missing version of OpenSSL can cause HTTPS errors. To fix this, update OpenSSL to the latest version.
Update OpenSSL Debian/Ubuntu:
apt-get install openssl
Update OpenSSL CentOS/RHEL:
yum install openssl
After updating OpenSSL, retry the wget command.
Conclusion
In this guide, we have provided clear steps to troubleshoot and fix HTTPS download errors with wget. HTTPS download errors with wget can be frustrating, but they are usually easy to fix once you understand the underlying cause. Hopefully this guide helps you troubleshoot HTTPS downloading errors on dedicated server hosting from Atlantic.Net!
### What Are the Benefits of Managed Hosting?
Managed hosting removes the complexity of building and managing the entire IT ecosystem. Specialist managed service providers take responsibility for the entire IT operation, such as procurement, server monitoring and management, and day-to-day business operations.
Building a suitable data center and hosting environment requires teams of expert personnel, engineers, and analysts capable of designing, building, and managing every component that makes up the IT platform. Trying to do all this in-house is a complex and challenging task, and that is why managed cloud server hosting is so important.
In this article, we'll break down what managed hosting is, how it stacks up against unmanaged hosting, and give you the info you need to choose the best service for your business.
The Key Benefits of Managed Hosting Services
First, let's look at some of the key reasons business leaders choose managed hosting:
#1: Enhanced Security
Cybersecurity is one of the most important and challenging aspects of modern business. Security must be a top priority for any business that has any form of online presence or relies on any cloud or server-based services.
Cyber challenges and the threat landscape are constantly changing. Data breaches and security vulnerabilities have the potential to cripple businesses, leading to financial losses, reputational damage, and legal repercussions.
Managed hosting can step in to deploy proven security measures that ensure your network infrastructure remains protected at all times. Here are some of the core security protections you should expect from your managed hosting partner:
Firewalls: Advanced firewalls filter incoming and outgoing network traffic, blocking unauthorized access attempts and potential threats at the network perimeter. For your web-based applications, it's highly recommended to also invest in a Web Application Firewall (WAF), typically a software-based firewall that can be dynamically updated to respond to changes in the threat landscape.
Intrusion Protection Systems (IPS): An IPS actively monitors network activity, identifying suspicious patterns and potential intrusions, allowing for swift response and mitigation. An IPS works seamlessly with SIEM platforms to alert the relevant support personnel if a security baseline is breached.
Regular Security Audits: It's highly recommended to complete thorough risk assessments, security audits, and complete vulnerability scanning at least once every 6 to 12 months. Additionally, it's essential to implement any necessary improvements, ensuring your systems remain up-to-date and protected against the latest threats.
Data Encryption: Sensitive data must be encrypted both at rest and in transit. We recommend a minimum of AES256 encryption standards to add an extra layer of protection in case of an unauthorized access breach, plus SSL certificates to validate your ecommerce sites. Remember, Atlantic.Net offers free SSL certificates with our Managed WordPress hosting!
DDoS Protection: Distributed Denial of Service (DDoS) attacks can overwhelm your servers and disrupt your business operations. Managed hosting employs DDoS mitigation integration to absorb and deflect such attacks, ensuring your services remain available to your customers.
Patch Management: Regular update scans will identify potential hotfixes for your systems. Manufacturers and software vendors frequently release security patches and updates to improve application protection. Ensure these updates are applied on a regular, and ideally scheduled basis.
Compliance Assistance: If your business operates in a regulated industry (e.g., healthcare, finance), a managed hosting services can help to ensure that you meet the necessary compliance standards, such as HIPAA or PCI DSS.
#2: Server Maintenance and Monitoring
Another major benefit of choosing managed hosting is server management. Maintaining optimal server performance requires constant attention and technical expertise. Managed hosting takes on the responsibility of server monitoring and maintenance, ensuring your systems operate at peak efficiency 24/7.
Managed Hosting providers like Atlantic.Net offer a service wraparound that includes alert response to common system alerts such as low disk space, high CPU, or low memory warnings. Managed services exist that enhance the service; our engineers can be involved as much (or as little) as you want.
Other popular server maintenance tasks include:
Hardware and Software Updates: Regularly updating server hardware and software is essential for optimal performance and security. Managed hosting handles these updates seamlessly, minimizing downtime and ensuring compatibility. Remember that the underlying infrastructure is also entirely managed by the hosting provider.
Server Backups: Data loss can be catastrophic for businesses. Managed hosting implements reliable backup strategies for your systems. This ensures that your critical data is protected and can be easily restored in case of unforeseen events.
Proactive Issue Resolution: With continuous server monitoring, potential issues are identified and addressed before they escalate into major problems, minimizing downtime and disruptions to your business. Analysis of regular issues helps improve overall server performance and improves reliability.
Load Balancing: As your business grows, traffic to your applications and services may increase. Managed hosting can implement application load-balancing techniques to distribute traffic evenly across multiple servers, ensuring optimal performance and responsiveness even during peak periods.
Performance Optimization: Hosting management experts can fine-tune your server configurations and optimize resource allocation to enhance performance and speed.
#3: Cost Savings
Managed hosting introduces significant cost savings because it eliminates the need for expense outlays on hardware procurement, licensing, support, and data center costs. Managed hosting offers predictable monthly hosting plan fees by using a pay-as-you-go model, allowing for better budget planning and eliminating unexpected expenses associated with purchasing hardware, maintenance contracts, and engineer visits to fix problems.
You can also purchase long-term usage plans, typically from 1 to 3 years. This introduces further cost savings because the rate you pay is much lower than the pay-as-you-go price. This is a fantastic option if you know what hardware you need for the foreseeable future. Extended payment plans are popular for database servers which remain online 24x7 and are rarely decommissioned.
Additionally, managed hosting eliminates the need to hire in-house system admins to manage the server environment. This can lead to significant cost savings for businesses and is one of the major benefits of managed hosting to senior management.
#4: Scalability
Business needs change over time, and as your business grows, your managed web hosting solution should scale to accommodate increased traffic, data storage requirements, and application demands.
Managed hosting service providers offer flexible plans that allow you to easily upgrade your hosting resources to accommodate additional resource demands. Scalability ensures optimal performance and responsiveness even during peak trading periods such as Black Friday and Christmas.
#5: Expert Support
Technical issues can happen at any time, potentially disrupting your business operations and causing frustration to employees and customers. Managed hosting offers round-the-clock technical support, ensuring expert assistance is always at your fingertips.
Providers are expected to offer dedicated 24x7 support teams that are trained to troubleshoot a wide range of server-related problems, providing timely solutions and minimizing downtime. Professional support means you have access to a knowledgeable team whenever you need them.
#6: Focus on Core Business Goals
From the feedback we get from our customers, one of the most popular benefits of managed hosting is that it gives the business back the opportunity to focus on running their business. Customers are no longer fighting with their IT systems or struggling to get things working because Atlantic.Net's experts now manage the systems, giving the customers their precious time back to focus on what's important to them.
By offloading day-to-day business operations and server management, businesses can dedicate their valuable time to helping their customers and driving innovation.
#7: Access to the Latest Technologies
Technology in IT is constantly changing, with new software, hardware, and security protocols emerging all the time. Keeping up with these advancements can be challenging (and expensive), especially for businesses with limited IT resources.
Managed hosting partners with hardware technologists to get access to the latest technology, plus they have the required capital to invest in the latest hardware, ensuring your infrastructure is always up-to-date and equipped to handle the demands of modern business applications.
#8: Improved Website Performance
Website owners know that speed and performance are crucial for user experience and search engine rankings. Popular services like managed WordPress hosting are available too.
Managed hosting providers use various techniques to optimize website performance, such as:
Content Delivery Networks (CDNs): Edge network services like CDNs distribute website content across multiple content servers (caching) around the world, ensuring fast loading times for visitors regardless of their location.
Server-Side Optimization: Managed hosting can fine-tune server configurations and optimize code to enhance website performance.
High Performance Server Hardware: VPS servers with SSD storage and advanced Intel processors offer excellent performance for your web server.
#9: Disaster Recovery and Business Continuity
Unforeseen events such as natural disasters, hardware failures, or cyberattacks can disrupt your business operations and lead to significant downtime. Having a reliable web hosting provider that can offer managed disaster recovery capabilities is essential, especially if you need compliance hosting (such as HIPAA) where Disaster Recovery is a required part of compliance.
Redundant Infrastructure: Data is often stored across multiple cloud servers in various locations, ensuring that even if one server fails, your data remains safe and accessible. Having redundant server infrastructure means that if one of your servers fails, a like-for-like server is available to automatically pick up the workload
This also applies to backups where the hosting company keeps copies of your data safe in different locations, essential if you are hit by a disaster where your online store or e-commerce sites are taken offline.
Failover Systems: In the event of a server failure, traffic is automatically redirected to a secondary server, minimizing downtime and ensuring business continuity.
Regular Testing: Managed hosting providers regularly test their disaster recovery plans to ensure they are effective and can be executed swiftly in a crisis.
#10: Customization and Flexibility
Managed hosting providers like Atlantic.Net understand that businesses have unique needs and requirements. We know that one size does not fit all, and because of this, we offer a range of customizable solutions, allowing you to tailor the hosting environment to your specific needs.
This can include:
Choice of Operating Systems: Select the operating system that best suits your applications and workloads. Our VPS servers are available with a choice of Windows Server or Linux Operating Systems. Or if you opt for our co-location hosting you can use whatever operating system you want, Hyper-V, VMware, AIX, I-Series - it doesn't matter.
Software Installation and Configuration: Managed hosting providers can help install and configure the software you need to run your business. We are partnered with all of the major software and hardware vendors, and we can offer competitive licensing options. Just get in touch to learn more about how managed hosting works.
Resource Allocation: Customize your shared and dedicated hosting server resources, such as CPU, RAM, and storage, to match your specific requirements. All of our servers use SuperMicro Servers with genuine Intel CPUs, all our storage is at a minimum SSD with NVMe options available. We even have dedicated hosts if you need extra power.
Managed Services: Choose from a variety of managed services, such as database management, security monitoring, and application optimization, to further enhance your IT infrastructure.
What Is the Difference Between Managed vs. Unmanaged Hosting Services?
Now you know what Managed Hosting offers you. But did you know that with Atlantic.Net you can also go down the Unmanaged Hosting route? Understanding the key distinctions between managed and unmanaged hosting is crucial in selecting the right solution for your business.
Unmanaged Hosting: The DIY Approach
DIY Server Management
You have complete control over your dedicated server or cloud servers, meaning you get to decide how it's set up, maintained, and secured. This level of control is ideal if you want to fine-tune every aspect of your server environment to match your exact needs.
Hybrid Technical Support
Atlantic.Net support teams are always available, even for our unmanaged hosting clients. We know that some of our customers have teams of IT experts in-house, so we are more than happy for you to handle any technical concerns; just remember, we are here if you need us.
Cost
Unmanaged hosting typically comes with a lower price tag, making it an attractive option for businesses on a tight budget or those who want to maximize their resources. You only pay for the server itself, without any additional fees for management services. It can eliminate some costs associated with managed hosting.
Flexibility and Customization
With unmanaged hosting, you're not bound by any pre-defined configurations or restrictions. You can install any software you need, configure the server to your liking, and experiment with different setups without having to seek approval or assistance.
Overall, unmanaged hosting is a good option for businesses or individuals who:
Value Control: Want complete control over their server environment.
Have Technical Expertise: Possess the technical skills to manage a server effectively, including things like running backups, software upgrades, and basic security measures.
Seek Cost Savings: Want to minimize hosting costs.
Need Flexibility: Require a high degree of customization and freedom to experiment.
While unmanaged hosting offers many benefits, it's essential to be realistic about your technical capabilities and time commitment. If you're not comfortable managing a server or don't have the resources to dedicate to it, managed hosting might be a more suitable choice, especially if you value things like 24/7 support, customer data protection, and having a hosting company handle the technical side so you can focus on your core business and customer relationships.
Remember, whether you choose unmanaged hosting, managed VPS hosting, managed WordPress hosting, or even shared hosting, the key is to select the hosting service that best aligns with your needs and resources.
Why Choose Atlantic.Net Managed Hosting?
We know that selecting a reliable managed hosting provider is a critical decision that can impact your IT infrastructure's performance, security, and overall efficiency. When you choose us for your hosting, you get so much more:
Performance and Uptime
Our platform is architected durably and robustly. Our engineers have spent years perfecting our platform. We are that confident in the service that we offer class-leading 100% uptime SLA.
Security Features
Security is key with Atlantic.Net. With our managed hosting you get access to security measures such as firewalls, intrusion protection systems, data encryption, multi-factor authentication, Network Edge protection, and more to protect your critical business information.
Scalability
With Atlantic.Net, your business can grow and scale as needed. All our services can scale up as needed to provide greater performance, and more storage, of a bigger hosting plan. We have flexible plans that can easily scale to accommodate your business growth.
Technical Support
Our support teams are all based in the United States. We offer around-the-clock support, every day of the year. The team is available via phone and email. We also offer professional support services for your next project.
Customer Reviews and Reputation
Atlantic.Net's hosting platforms are award-winning. Don't just take our word for it; check out what our customers say.
Pricing and Value
Compare our pricing plans with different providers, and you will see that we are competitively priced and offer more bang for your buck.
Multiple Hosting Choices
Consider whether you need to opt for shared hosting, dedicated servers, dedicated hosting, virtual private server (VPS) hosting, or cloud hosting, depending on your traffic levels, resource requirements, and budget.
Atlantic.Net: Your Trusted Managed Hosting Partner
At Atlantic.Net, we offer a range of award-winning managed hosting solutions tailored to your unique requirements. Our team of experts is dedicated to providing exceptional service, ensuring your network remains secure, performs optimally, and scales seamlessly with your business.
Contact us today for a free consultation and discover how we can help you achieve your IT goals with a customized managed hosting solution.
### VMware vs Hyper-V: Which Is Best?
Hypervisors like Microsoft technologies Hyper-V server and VMWare vSphere products are popular for creating your own private and public cloud environments. You can even launch dedicated Hyper-V and VMware clusters directly on some cloud providers - avoiding the need to purchase your own virtualization solutions hardware.
VMware ESXi and Hyper-V are Type-1 hypervisors, meaning that the virtualization software is installed directly onto bare-metal hardware and does not require a host operating system. Your virtual machine resides on top of the hypervisor layer, and you can run multiple virtual machines on any operating system inside a VM.
In this article, we explore Hyper-V vs VMWare as virtual machine management tools. We will discover the strengths of each type of hypervisor, then do a comparison between Hyper-V vs VMware to give you the information to decide which advanced virtual machine features work best for your business.
What Is Hyper-V?
Hyper-V is a native virtualization platform that's deeply integrated into the Windows Server operating system. It was first introduced in Windows Server 2008 R2 as a downloadable Windows Update, but since Windows Server 2012, Hyper-V has been a built-in core component of the operating system.
But it's not limited to Windows Server; you can also enable Hyper-V in client versions of Windows such as Windows 10 or Windows 11 operating systems. It's important to note that these versions are classified as Type-2 hypervisors because they rely on the host operating system to function. The Type-1 Windows Server version runs independently and has access to the hardware layer to manage virtual disks and virtual networking directly.
Hyper-V allows the user to create and manage virtual machines (VMs) from a dedicated Windows host. It's possible to run multiple operating systems in Hyper-V, including Windows, Linux, and FreeBSD, simultaneously on the same physical server. With seamless integration into the Windows Server and OS ecosystem, Hyper-V offers a familiar management experience for Windows administrators.
Hyper-V: How It Works
Hyper-V uses hardware-assisted virtualization technologies (like Intel VT-x or AMD-V) to create virtualized hardware environments for each VM, allowing VMs to run directly on the physical CPU, and providing near-native performance with dynamic resource allocation.
The hypervisor manages and allocates the physical resources (CPU, memory, storage, network) to the VMs based on pre-configured settings and current demands, ensuring efficient utilization of resources and allowing multiple VMs to run simultaneously on the same virtualization technology.
Each virtual machine runs in its own isolated space, preventing interference from other VMs or the host system. Hyper-V Manager or other management tools (like System Center Virtual Machine Manager or Windows Admin Center) allow administrators to create, configure, start, stop, manage, and run virtual machines, as well as perform tasks like live migration and replication.
What are the benefits of Windows Server Hyper-V?
Microsoft Hyper-V is a popular way to introduce virtualization technology to Windows-centric environments and organizations without investing huge amounts of capital to get started.
Cost-effectiveness: Hyper-V is included with Windows Server licenses, making it an attractive option for organizations already invested in Microsoft technologies.
Ease of use: Hyper-V Manager offers a straightforward graphical user interface (GUI) for creating, configuring, and managing virtual machines, simplifying the virtualization process for Windows administrators.
Integration with Windows ecosystem: Hyper-V seamlessly integrates with other Microsoft technologies like System Center Virtual Machine Manager (SCVMM) and Windows Admin Center, providing centralized management for your entire virtualized environment. If you know how to use Windows Server, you will pick up Hyper-V very quickly.
Dynamic memory: Hyper-V's dynamic memory feature allows VMs to allocate memory dynamically based on their needs, optimizing resource utilization on the host server. This is a great way to get high-performing virtual machines, but remember that resources are not infinite.
Live migration: Hyper-V enables you to move running virtual machines between physical host server(s) without downtime, ensuring high availability for your critical applications.
Security features: Hyper-V offers several security features, including Shielded VMs, Secure Boot, and Virtual Trusted Platform Module (vTPM), to protect your VMs from unauthorized access and malware
What Is VMware?
VMware is a leading provider of virtualization and cloud computing software and services. It's a company that offers a comprehensive suite of solutions that enable organizations to virtualize their IT infrastructure, from servers and storage to networking and desktops.
VMware's flagship product, vSphere, is a server virtualization platform that allows you to create and manage multiple virtual machines (VMs) on a single physical server, running different operating systems and applications simultaneously.
VMware has been around for decades, starting life back in 1998. VMware workstation was released in 1999, and VMware ESXi server virtualization platform was released in 2001. Its been hugely popular, but it can be argued that its popularity has dropped significantly since the mass adoption of cloud based services. However, there is definitely still a big market for VMware virtualization solutions and products.
Key VMware Products
VMware has lots of virtualization products. But when people talk about VMware, they are typically referring to vSphere.
However, its important to know that the big 5 VMware products are:
vSphere: VMware's flagship server virtualization platform.
vSAN: Software-defined storage solution that pools storage resources from multiple servers.
NSX: Network virtualization platform that enables you to create and manage virtual networks.
Horizon: Virtual desktop infrastructure (VDI) solution that delivers virtual desktops and applications to users. (Similar to Citrix)
Workspace ONE: Unified endpoint management (UEM) platform that enables you to manage and secure mobile devices, desktops, and applications.
VMware vSphere: How it Works
At its core, vSphere enables you to create and manage multiple virtual machines (VMs) on a single physical server, each running its own operating system and applications independently.
Resource allocation is dynamically managed by VMware ESXi, ensuring optimal utilization. The physical server's CPU, memory, storage, and network capabilities are distributed amongst the VMs according to their configured settings and real-time demands.
vCenter Server is used as a control center for the entire vSphere environment. From this central hub, administrators can create, configure, and deploy VMs, along with monitoring their resource consumption and overall performance. Install VMWare tools on the VMware VMs to get better performance and interaction with the virtual machine.
There are several key components of VMWare to understand:
VMware ESXi Hypervisor: VMware ESXi is installed directly on the host hardware and is used to directly manage your host hardware resources. VMware ESXi is a type-1 (bare-metal) hypervisor that installs directly onto the physical server's hardware. It has complete control over the server's resources (CPU, memory, storage, network) and creates a virtualized environment for each VM.
Virtual Machines (VMs): These are software-based representations of physical computers created by vSphere. Each VM has its own virtual hardware (vCPU, vRAM, vNIC, etc.) and runs its own guest operating system and applications.
vCenter Server: A centralized management platform that provides a single pane of glass for managing multiple VMware ESXi hosts and their VMs. It offers features like VM provisioning and deployment, resource allocation and monitoring, high availability and disaster recovery, configuration, and policy management.
What are the benefits of VMware ESXi Hypervisors?
VMware has lots of benefits, especially when combined with VMware Vcenter server. You get an entire virtualized data center in your control to manage virtual machines to your hearts content.
Here are some of the key benefits of VMware:
Performance and scalability: VMware is known for its class-leading performance and scalability, making it suitable for demanding workloads and large-scale deployments. Technology such as NSX and vSAN enable flexible storage and networking upgrade.
Advanced management features: VMware vSphere includes vCenter Server, a centralized management platform for managing multiple VMware ESXi hosts, VMs, and other resources in your virtualized environment. VMware memory management techniques cleverly manage resources throughout your virtual data center.
High availability and fault tolerance: VMware offers various features, like vMotion and vSphere HA, to ensure high availability and fault tolerance for your critical VMs.
vSphere Distributed Resource Scheduler (DRS): DRS dynamically balances workloads across multiple VMware ESXi hosts, optimizing resource utilization and ensuring consistent performance.
Extensive hardware compatibility: VMware supports a broad range of server hardware, offering flexibility in choosing your infrastructure.
Third-party Support: VMware boasts a vast ecosystem of third-party tools and solutions that integrate seamlessly with its virtualization platform. You can integrate VMware directly into cloud solutions, backup solutions, and third party management tools with ease.
Comparing VMware and Microsoft Hyper-V Virtual Machines
Both VMware and Hyper-V are mature products that have decades of development built into the products. Broadly speaking they offer similar services, but there are some big differences between the two solutions.
Both VMware and Hyper-V are powerful virtualization platforms with unique strengths. VMware excels in performance, scalability, and advanced management features, while Hyper-V offers cost-effectiveness, ease of use, and seamless integration with the Windows ecosystem.
Your ideal choice will depend on your specific requirements, budget, and technical expertise.
Cost Considerations
Cost is one area that is a major differentiator. Both virtualization platforms require expensive hardware with multiple CPUs, stacks of memory, and redundant networking and storage. If you want high availability (HA) you need to purchase multiple virtualization hosts, if you want disaster recovery capabilities you need to replicate the setup in a secondary location, ensuring storage and network layer replication. These types of requirements alone are an extremely expensive pre-requisite for enterprise-grade virtualization.
On the other hand, Hyper-V is included with Windows Server licenses, making it a cost-effective option for organizations already invested in Microsoft. So for example, if you have 16 cores across 2 CPUs, Windows Server Standard Edition will cost around $1069 and allow you to run two virtual machines (VMs) on top of it. Windows Server Datacenter Edition will cost around $6155 and allows you to run an unlimited number of VMs.
VMware, on the other hand, has a higher upfront costs, with licensing typically based on the number of CPUs in your environment. Their pricing model is also much more complicated and seems to change every few months. vSphere is priced per CPU (not per core), and there are limits about how many cores you can have per CPU, it's all very confusing. Therefore, you're looking at roughly VMware vSphere Enterprise for $3,540 per CPU, and VMware vSphere Enterprise Plus at around $4,805 per CPU. Plus you have to licence features like disaster recovery, vSan and NSX.
Ease of Use
Hyper-V is tightly integrated with the Windows Server operating system, and is generally considered easier to learn and manage, especially for Windows administrators familiar with Microsoft technologies. Hyper-V Manager offers a straightforward graphical user interface (GUI) for creating, configuring, and managing virtual machines (VMs). You can manage Hyper-V from any domain connected Windows Server providing it has the Hyper-V Snap-In installed and your user account has relevant permissions.
VMware vSphere, while arguably more powerful, has a steeper learning curve and requires some expertise to navigate the vSphere client interface. However, once mastered, the VMware UI is slick and easy to use because it uses a very well designed HTML6 virtualization client. vCenter is also based on an OS called Photon, a heavily customized Linux Kernel, which makes the CLI very reliable and super fast.
Management Tools
Both platforms provide reliable management tools. VMware vCenter Server is a centralized management appliance for multiple ESXi hosts, VMs, and other resources. Hyper-V integrates with tools like System Center Virtual Machine Manager (SCVMM) and Windows Admin Center for comprehensive management capabilities.
Whichever you prefer comes down to personal choice. I find the Hyper-V integrations quite clunky and slow, plus the UI is basic and unintuitive. However, would I pay more for VMware just because of the UI? I'm not so sure if I were picking up the cost.
Performance and Scalability
VMware is renowned for its excellent performance and scalability, making it suitable for large-scale deployments and demanding workloads, such as enterprise environments with mission-critical applications. VMware is normally the number one choice for the enterprise because of its performance. You can tell that vSphere is a mature, highly efficient product.
It handles errors and issues seamlessly, and every one of the features works faultlessly. You can happily leave VMware running knowing that your virtualization platform is safe and will heal automatically.
Hyper-V also offers good performance but is generally better suited for small to medium-sized deployments. While Hyper-V is reliable, it's not uncommon for features to simply not work, such as automated failover; if the operating system throws an error, the failover may hang or freeze. From experience, I have had a much more seamless experience with VMware ESXi.
Guest OS Support
Both VMware environments and Hyper-V have their strengths when it comes to guest operating system support and flexibility with virtual machine images. Both support Windows Centric environments and will deploy Linux VMs. VMware shines with its expansive compatibility, welcoming a wide range of guest operating systems, even those that are older, out of manufacturer support or less common. This makes it an excellent choice if you have diverse or legacy workloads that need to be virtualized.
On the other hand, Hyper-V primarily focuses on Windows and Linux, but it's incredibly well-optimized for these environments, often delivering superior performance and smoother integration with these operating systems.
When it comes to VM images, both platforms allow you to create custom images, giving you control over your virtual environments. However, VMware's ecosystem boasts a richer selection of pre-configured images available through its marketplace and third-party vendors. Hyper-V users on Azure have access to the extensive Azure Marketplace library.
If you need a wide variety of readily available images or the flexibility to create highly customized ones, VMware might be a better fit.
High Availability (HA)
Both platforms provide features to ensure the high availability of your VMs. VMware offers vMotion for live migration of VMs between hosts without downtime, as well as vSphere HA and Fault Tolerance for automatic VM restarts and protection against data loss.
Hyper-V provides Live Migration and Failover Clustering for similar high-availability capabilities. When considering Hyper-V vs VMWare, I prefer the way that VMWare handles HA.
Security Features
Both platforms offer robust security features to protect your virtual environment. VMware includes encryption, vTPM (virtual Trusted Platform Module), and Secure Boot. Hyper-V offers Shielded VMs, Secure Boot, and vTPM for enhanced security. These services are essentially the same, so both offer goo security features.
VMware and Hyper-V Hosting with Atlantic.Net
Atlantic.Net provides support for both VMware and Hyper-V environments. We offer private cloud hosting with either platform, and our award-winning virtualization solutions can cater to your business's diverse needs, supporting virtual machines running on any operating system.
Whether you're managing Windows Servers, utilizing Windows Server licenses, or exploring other operating systems, Atlantic.Net's offerings can fit your requirements.
Atlantic.Net's flexible approach allows you to select the virtualization software best aligned with your needs. For organizations heavily invested in Windows Servers, Hyper-V might be a natural fit. VMware's broad operating system support and extensive feature set make it a compelling choice for enterprise-scale environments.
Contact Atlantic.Net today to explore your options and embark on a seamless virtualization journey.
Our team of experts will assist you in choosing the ideal platform, configuring your environment, and ensuring optimal performance for your virtual machines. Whether you're seeking enhanced resource utilization, streamlined management, or improved disaster recovery capabilities, Atlantic.Net has the solution for you.
Unlock the full potential of your IT environment with Atlantic.Net.
### VPS RAM: Understanding the Importance of RAM for Your Cloud Server
When it comes to VPS performance, the total size and speed of Random Access Memory (RAM) will make all the difference. Think of it as the workspace of your virtual server - the more RAM you have, the more tasks and files your VPS can handle simultaneously without slowing down. From running complex software and handling large databases and files to managing multiple websites and applications, RAM is a critical factor in ensuring optimal performance and user experience.
In this article, we will deep dive into how the speed and total size of your VPS impact your system performance. We will also highlight which scenarios where having vast amounts of RAM makes everything run smoothly, but also demonstrate in some circumstances, throwing additional RAM to create a VPS might not necessarily be the best option.
Atlantic.Net VPS Service Offerings: A Closer Look at RAM
Atlantic.Net is a leading cloud hosting solution provider that has been in business for over 30 years, and we offer a diverse range of VPS plans that cater to various user needs and budgets. Each plan comes with a specific amount of RAM, carefully balanced with other resources like CPU and storage to deliver the best possible performance for different use cases.
We have data center locations throughout the United States, Canada, Europe, and Asia. The service plans are universally available across our website for every site and data center region. We also offer dedicated hosting options and shared hosting options.
With Atlantic.Net, you will find a suitable VPS Plan that offers the RAM you need. Here is a brief overview of the types of plans available.
General-Purpose Plans (G3 Series)
G3 Plans feature RAM options ranging from 2GB to up to 192GB.
Balanced Allocation of CPU, RAM, and Storage
Ideal for a Wide Range of Applications and Websites
RAM Options from 2GB to 192GB
Entry-Level to Enterprise-Level Solutions
Storage Optimized Plans (S2 Series)
S3 plans, although focused on storage speed, also have access to good RAM options ranging from 16GB and 64GB.
Designed for Applications with High Storage Bandwidth Requirements
Adequate CPU and RAM Resources
RAM Options of 16GB and 64GB
Suitable for Data-Intensive Workloads
Memory Optimized Plans (M2 Series)
M2 Series feature ECC Memory option with DDR4 and DDR5 options, the RAM Options range from 16GB and 64GB.
Optimized for RAM-Heavy Environments
Full Bandwidth and Enhanced RAM Performance
RAM Options of 16GB and 64GB
Ideal for Memory-Intensive Applications
CPU Optimized Plans (C2 Series)
C2 prioritizes high-performance and multi-core CPU architecture. However, super-fast RAM is also standard ranging from 8GB to 64GB.
Geared Towards Computationally Intensive Applications
Balanced Allocation of CPU, RAM, and Storage
RAM Options from 8GB to 64GB
Suitable for High-Performance Computing
Why RAM Matters: Finding the Perfect Amount for Your VPS
Selecting the appropriate amount of RAM is crucial for ensuring the smooth operation of your virtual server. Too little RAM can lead to sluggish performance, crashes, and downtime, while too much RAM can be an unnecessary expense.
Here are some factors to consider when determining your VPS RAM requirements:
Type of Applications and Websites: Resource-intensive applications and websites with high traffic volumes will require more RAM than simpler ones.
Number of Concurrent Users: The more users accessing your VPS simultaneously, the more RAM you'll need to handle their requests efficiently.
Database Size and Complexity: Databases store most of their live data in active memory, therefore large and complex databases demand more RAM for optimal performance.
Growth Potential: It's essential to factor in future growth when choosing your VPS RAM to avoid performance bottlenecks down the line.
How Much RAM Do I Need?
This is the million-dollar question. You should always read the documentation of the site or application you plan on hosting on your VPS server. You also need to consider if your VPS will have a single use or multiple uses.
In the next section, we will break down the requirements to demonstrate which application types require minimal amounts of RAM, and show an example of which application types need lots of RAM.
What Applications Require Minimal Amounts of RAM?
Several types of server applications are known for their relatively low RAM requirements, making them suitable solutions for resource-constrained cluster environments or VPS with limited memory.
Lightweight Web Servers:
Nginx: Renowned for its efficiency and low memory footprint, Nginx is a popular choice for serving static content and handling reverse proxy duties.
Lighttpd: Another lightweight web server option known for its speed and minimal resource usage.
Caddy: A modern web server with automatic HTTPS support and a focus on ease of use, often requiring less RAM than traditional web servers.
File Servers & FTP Servers:
vsftpd: A secure and efficient FTP server with a small memory footprint, ideal for basic file sharing and transfer needs.
ProFTPD: Another popular FTP server is known for its stability and relatively low RAM usage.
Samba: While slightly more resource-intensive, Samba enables file sharing between Windows and Linux/Unix systems and can still run on servers with modest RAM.
Mail Servers:
Postfix: A widely-used mail transfer agent (MTA) with a focus on efficiency and security, typically requiring minimal RAM for standard email operations.
Dovecot: A popular IMAP and POP3 server known for its fast performance and relatively low memory usage.
DNS Servers:
BIND: The most widely deployed DNS server software, capable of running efficiently on systems with limited RAM.
Unbound: A modern, validating, recursive, and caching DNS resolver with a small memory footprint and a focus on security.
Monitoring & Logging Servers:
Nagios: A popular open-source monitoring system that can run effectively on servers with modest RAM.
Zabbix: Another powerful monitoring solution known for its scalability and ability to operate on systems with limited resources.
rsyslog: A versatile and efficient logging system that typically requires minimal RAM for standard log collection and forwarding tasks.
Other Lightweight Applications:
OpenVPN: A popular open-source VPN solution that can be run on servers with limited RAM for secure remote access.
DHCP Servers: Dynamic Host Configuration Protocol servers for automatically assigning IP addresses to network devices usually require minimal RAM.
Simple Proxy Servers: Basic proxy servers for web browsing or content filtering can often run efficiently on systems with limited resources.
These examples demonstrate that you don't need to throw memory at a VPS to get enterprise-grade applications. For the best results, it would be sensible to run these applications on Linux.
What Applications Require Large Amounts of RAM?
So, what applications need lots of RAM for the best performance?
Databases:
Large relational databases: MySQL, PostgreSQL, Oracle, and Microsoft SQL Server can consume significant RAM, especially with large datasets and complex queries.
NoSQL databases: MongoDB, Cassandra, and Couchbase can also require ample RAM for caching and handling large volumes of data.
Virtualization Platforms:
Hypervisors: VMware ESXi, Hyper-V, and KVM need substantial RAM to host and manage multiple virtual machines efficiently.
Web Servers & Application Servers:
Java application servers: Tomcat, JBoss, and WebSphere can be memory-intensive, particularly when running complex Java applications.
High-traffic web servers: Apache, Nginx, and IIS may require more RAM when serving large numbers of concurrent users or handling resource-intensive web applications.
Big Data & Analytics Platforms:
Hadoop, Spark, and other big data frameworks: These platforms often process and analyze massive datasets, necessitating ample RAM for optimal performance.
Machine Learning & AI:
TensorFlow, PyTorch, and other ML frameworks: Training and deploying complex machine learning models can be computationally intensive and require significant RAM.
Gaming Servers:
Popular multiplayer games: Minecraft, Counter-Strike, and other popular games can require dedicated servers with plenty of RAM to support many concurrent players and ensure smooth gameplay.
Media Servers:
Plex, Emby, and other media servers: Transcoding and streaming high-quality video and audio content can demand a good amount of RAM, especially when serving multiple users simultaneously.
Linux VPS & Dedicated Server
Linux servers are generally much more memory efficient. At Atlantic.Net, we provide a diverse array of open-source distributions for VPS hosting.
Here's what's on offer:
Ubuntu Server (16.04, 18.04, 20.04, 22.04 - LTS)
Debian (9.13, 10.13, 11.6)
Oracle Linux (7.9, 8.5)
Rocky Road (8.5, 9.2)
CentOS (6.9, 7.8, 8.2)
Fedora (33, 34)
FreeBSD (11.4, 12.2, 13.0)
Arch Linux distributions
Each distribution is available in various release versions and editions (32-bit or 64-bit), ensuring compatibility with a wide range of customer applications and cloud services. Altogether, we offer users 26 distinct open-source builds for general release.
Windows VPS & Dedicated Server
Windows Servers typically require more RAM, especially when opting for the Desktop Experience. The minimum RAM recommended is 4GB for a good experience. With administrator privileges, you have complete control over the operating system and access to the familiar Microsoft software applications you rely on. Skip the hassle of complex installations – each Windows instance you create is deployed automatically and ready to use in approximately 60 seconds.
We offer the following software versions, each available in different editions (Server Edition, Desktop Experience, Container Edition):
Windows Server 2022
Windows Server 2019
Windows Server 2016
Windows Server 2012 R2
Windows Server 2008 R2
Atlantic.Net's Expertise: Guiding You to the Right RAM Choice
Atlantic.Net's team of experts is always ready to assist you in selecting the most suitable VPS plan with the right amount of RAM for your specific needs. We will take into account such factors as your current requirements, future growth potential, and budget to determine and recommend the best solution for your business or project.
VPS RAM and Atlantic.Net: A Winning Combination
Whether you're a startup launching your first website or an established enterprise managing complex applications, Atlantic.Net's VPS plans with carefully balanced RAM allocations offer the performance, reliability, and scalability features you need to succeed.
VPS RAM: Key Considerations and Tech Tips
If you are already hitting RAM limits on your VPS, there are plenty of options available to you. Of course, you can always scale up your plan to allocate more memory to manage the VPS, but have you thought about these tech tips?
Startup Scripts and RAM: Startup scripts, which execute commands automatically when your VPS boots up, can consume RAM. Ensure your scripts are optimized to minimize RAM usage.
Operating Systems and RAM: Different operating systems have varying RAM requirements. Choose an OS that is compatible with your VPS RAM and application needs.
Accessing and Managing VPS RAM: Atlantic.Net provides tools and interfaces to monitor and manage your VPS RAM usage effectively.
VPS RAM and Performance Optimization
Efficient RAM management is essential for maximizing your VPS performance. Here are some tips to optimize your RAM usage:
Regularly Monitor RAM Usage: Keep an eye on your RAM usage using tools provided by Atlantic.Net to identify potential bottlenecks and take corrective action. Consider using additional monitoring tools such as htop, glances, or nmon for a more detailed view of your system's resource usage. Configure alerts to notify you when your RAM usage reaches a critical threshold.
Optimize Applications and Databases: Ensure your applications and databases are configured to use RAM efficiently. Conduct thorough code reviews and use profiling tools to identify areas of your application code that might be inefficiently using memory. Look for memory leaks, excessive object creation, or inefficient data structures.
Close Unnecessary Processes: Terminate any processes that are not actively being used to free up RAM. Use tools like top or ps to identify processes that are consuming a disproportionate amount of RAM.
Upgrade RAM if Needed: If you consistently experience RAM limitations, consider upgrading to a VPS plan with more RAM.
free -m Command: This command provides a quick overview of your VPS's RAM usage, including total RAM, used RAM, free RAM, shared RAM, and buffers/cache. The -m flag displays the output in megabytes for easier interpretation.
Swap Space: Swap space acts as an extension of your RAM, allowing your system to temporarily store less frequently used data on your disk when your RAM is full.
Atlantic.Net's Commitment to Customer Success
Atlantic.Net is dedicated to providing exceptional customer support and ensuring the success of your projects. Our team of experts is available 24/7 to assist you with any questions or issues you may encounter, including those related to VPS RAM.
Contact the team today to learn about our VPS hosting services and how it can help your business succeed.
### How to Mitigate the Terrapin SSH Attack
SSH (Secure Shell) is an essential protocol for securely accessing remote servers. However, as SSH usage has grown, so has the number of attacks targeting SSH, with one of the most common being the Terrapin SSH attack. This type of attack typically involves brute-forcing SSH credentials to gain unauthorized access.
In this guide, we will explain the Terrapin SSH attack, how to detect it, and steps to mitigate it effectively.
What Is the Terrapin SSH Attack?
The Terrapin SSH attack is a brute-force attack that targets SSH servers by attempting to guess login credentials. Attackers use automated tools or botnets to try a large number of username-password combinations, hoping to find one that grants access. Once the attacker gains access, they can install malware, steal sensitive data, escalate privileges, or use the compromised server to launch additional attacks.
How to Find Out If Your SSH Server Might Be Under Attack
You can detect a possible SSH attack by observing the following:
Frequent failed login attempts: SSH logs will show a high number of failed login attempts.
Unusual IP addresses: Login attempts from unfamiliar or suspicious IPs.
High server load: Brute-force attacks can cause a spike in server CPU usage.
Suspicious entries in logs: You may notice repeated access attempts in /var/log/auth.log (Debian/Ubuntu) or /var/log/secure (CentOS/RHEL).
To check for failed login attempts, use:
grep "Failed password" /var/log/auth.log
Output:
Oct 1 10:12:34 server sshd[2345]: Failed password for invalid user admin from 203.0.113.56 port 54832 ssh2
Oct 1 10:12:37 server sshd[2345]: Failed password for invalid user guest from 203.0.113.56 port 54832 ssh2
Let's dive deep to mitigate the Terrapin SSH Attack:
Step 1: Disable Root SSH Login
Disabling root login ensures that attackers cannot brute-force the root account, which often has the highest privileges.
Edit the SSH configuration:
nano /etc/ssh/sshd_config
Find the line PermitRootLogin and change it to:
PermitRootLogin no
Restart the SSH service:
systemctl restart sshd
Disabling root access via SSH forces attackers to guess non-root usernames, significantly increasing security.
Step 2: Use Strong SSH Passwords or Key-Based Authentication
Weak passwords are vulnerable to brute-force attacks. The best practice is to use SSH key-based authentication, which is much more secure.
Generate an SSH key pair:
ssh-keygen -t rsa -b 4096
Follow the onscreen prompts to generate the key.
Copy the public key to the server:
ssh-copy-id user@server_ip
This installs your public key on the server, allowing passwordless login while blocking password-based brute-force attempts.
Step 3: Change the Default SSH Port
Changing the default SSH port from 22 to another port reduces the chance of automated brute-force attacks targeting your server.
Edit the SSH configuration:
nano /etc/ssh/sshd_config
Change the default port:
Port 2222
Restart the SSH service:
systemctl restart sshd
Be sure to update firewall rules to allow traffic on the new port.
Step 4: Enable SSH Rate Limiting with Fail2Ban
Fail2Ban monitors SSH login attempts and blocks IP addresses after a certain number of failed login attempts, effectively preventing brute-force attacks.
Install Fail2Ban:
apt-get install fail2ban
Configure Fail2Ban for SSH:
Edit the /etc/fail2ban/jail.local file and add the following:
[sshd]
enabled = true
port = 22
logpath = /var/log/auth.log
maxretry = 5
Restart Fail2Ban:
systemctl restart fail2ban
Now, after 5 failed login attempts, Fail2Ban will block the attacking IP address for a set period.
Step 5: Enable Two-Factor Authentication (2FA) for SSH
Adding two-factor authentication (2FA) provides an additional layer of security, requiring both a password and a one-time code generated on your mobile device.
Install the Google Authenticator PAM module:
apt-get install libpam-google-authenticator
Configure 2FA:
Run google-authenticator for each user and follow the prompts. Then, add the following line to /etc/pam.d/sshd:
auth required pam_google_authenticator.so
Restart SSH to apply the changes.
systemctl restart sshd
What to Do If You’ve Been Compromised
If you suspect that an SSH attack has compromised your server, take the following steps:
Disconnect the server from the network to prevent further damage.
Run a rootkit and malware scan using tools like rkhunter or chkrootkit.
Check SSH logs for any unauthorized access or suspicious activity.
Change all passwords and SSH keys to prevent the attacker from regaining access.
Conclusion
The Terrapin SSH attack is a serious threat, but it can be effectively mitigated through proactive security measures. By disabling root login, using strong authentication methods like SSH keys and 2FA, changing the default SSH port, and enabling tools like Fail2Ban, you can significantly reduce the risk of unauthorized access to your SSH server. Try implementing the above technique on dedicated server hosting from Atlantic.Net to mitigate the terrapin SSH attack.
### Copy Files in Linux with Visual Progress: A Comprehensive Guide
Copying files in Linux is a common task for system administrators, developers, and everyday users. While basic tools like cp can easily copy files, they don't provide any real-time visual feedback on the progress of the file transfer. This is particularly inconvenient when copying large files or directories where knowing the remaining time and transfer speed can be essential.
In this article, we'll explore several ways to copy files in Linux while getting real-time visual feedback using tools like rsync, pv, and combining these tools for more advanced use cases.
Basic File Copying in Linux
The cp command is the standard method for copying files in Linux. It’s simple, efficient, but it lacks any progress indicator, which makes it hard to know how long the process will take for larger files.
For example, the following command copy a file1.txt to the /opt directory.
cp file1.txt /opt/
Copying Files with Visual Progress Using rsync
rsync is a handy tool that copies files efficiently and offers an option to display a progress bar. It’s especially useful for large transfers or network-based transfers, as it provides visual progress, file size, transfer speed, and estimated time remaining.
Run the rsync command with the --progress option for copying file with progress.
rsync --progress file1.txt /opt
This command shows the file name, the file size being copied, the percentage completed, the current transfer speed, and the estimated time to completion.
file1.txt
123,456,789 100% 1.23MB/s 0:00:02 (xfr#1, to-chk=0/1)
Using pv (Pipe Viewer) for Real-Time Progress
You can also use pv (Pipe Viewer) command-line tool to display real-time progress bar during file copying process. It can display transfer speed, estimated time remaining, and the amount of data transferred. You can use it with other commands like dd or tar to visualize the progress of file transfers or other data operations.
Using pv and dd:
Let's use the pv command with dd to copy a file1.txt.
pv file1.txt | dd of=/opt/file1.txt
Here, pv displays the file size, time elapsed, and transfer speed. This method is useful when copying files directly or creating disk images using dd.
123MB 0:00:01 [123MB/s] [================================================>] 100%
Using tar and pv:
You can also use the pv with tar command to copy a directory with real-time progress bar.
tar -cf - my-directory | pv | tar -xf - -C /opt
In this example, pv helps monitor the progress of copying a directory using tar. It’s especially useful for archiving large directories.
345MB 0:00:03 [115MB/s] [================================================>] 100%
Copying Large Files With rsync and pv Combined
You can combine rsync with pv for maximum efficiency and detailed progress reporting. This setup gives you the best of both worlds: rsync for robust file transfer, and pv for real-time progress feedback.
Let's use the rsync with pv to copy a directory named test-directory:
rsync -av --progress /mnt/test-directory /opt | pv
This combination allows rsync to handle the file transfer while pv provides a unified progress display. You get the advanced features of rsync, such as file comparison and incremental copying, along with a visual progress bar.
sending incremental file list
file1.txt
123,456,789 100% 1.23MB/s 0:00:02 (xfr#1, to-chk=0/1)
file2.txt
234,567,890 100% 2.34MB/s 0:00:01 (xfr#2, to-chk=0/1)
345MB 0:00:04 [86MB/s] [================================================>] 100%
Using scp for Network Transfers With Progress
scp is a standard tool for securely copying files over a network. While it does not offer a built-in progress bar, it can be combined with pv to achieve the same result.
The following command copies a file1.txt to the remote machine with a progress bar.
pv file1.txt | scp -C - root@remote-server-ip:/opt/file1.txt
Output:
file1.txt
345MB 0:00:05 [69MB/s] [================================================>] 100%
Conclusion
In Linux, copying files efficiently with visual progress can greatly enhance the user experience, especially when handling large files or directories. By using tools like rsync, pv, and combinations of commands, you can get real-time feedback on file transfers, ensuring you always know how long your task will take.
Try to explore more advanced combinations to suit your needs on VPS hosting from Atlantic.Net!
### How to Extract and Create RAR Files in Linux
RAR files are one of the most popular file compression formats, often used to pack multiple files into a single archive and compress them for easier storage or transfer. If you work on Linux, managing RAR files is quite straightforward with the right tools.
In this guide, we will walk you through how to extract and create RAR files in Linux systems.
Install rar and unrar
To handle RAR files on Linux, you need to install the rar and unrar utilities. Unfortunately, these aren’t included by default in many Linux distributions because RAR is proprietary software.
Install rar and unrar on Ubuntu/Debian:
apt update
apt install rar unrar
Install rar and unrar on Fedora/RHEL:
dnf install rar unrar
Once installed, you're ready to start working with RAR files.
How to Extract RAR Files in Linux
To extract RAR files, you can use the unrar command. The syntax is simple, and you can specify the target directory if necessary.
Extracting a RAR File in the Current Directory
To extract the contents of a RAR file into the current directory, use the following command:
unrar x archive.rar
Extracting a RAR File to a Specific Directory
You can specify a directory to extract the contents to using the following command:
unrar x archive.rar /opt/
Extracting Password-Protected RAR Files
If your RAR file is password-protected, you can extract it by specifying the password when prompted:
unrar x archive.rar
How to Create RAR Files in Linux
To create RAR archives, you’ll use the rar command. Here’s how you can compress files into a RAR archive.
Creating a Simple RAR Archive
To create a RAR file from multiple files, run the following command:
rar a archive.rar file1.txt file2.pdf file3.jpg
Creating a RAR File with a Password
You can create a password-protected RAR file using the -p option:
rar a -p archive.rar file1.txt file2.pdf file3.jpg
Specifying Compression Levels
You can control the compression level when creating RAR files using the -m option followed by a number between 0 (no compression) and 5 (maximum compression):
rar a -m5 archive.rar file1.txt file2.pdf file3.jpg
Conclusion
This guide covered installing the rar and unrar utilities, extracting files from RAR archives, and creating new RAR files. We also explored on password protection and adjusting compression levels. You can easily manage RAR archives on your Linux system just as on Windows or macOS. Try practicing rar with all available options on VPS hosting from Atlantic.Net!
### Exclude Files and Directories from rsync
rsync is a flexible tool for syncing files and directories between different locations. It’s highly efficient because it only transfers the differences between source and destination, saving time and bandwidth. It is commonly used for backup, file transfers, and mirroring. rsync supports various options, including the exclusion of specific files and directories during the sync process.
In many scenarios, you may not want to sync every file or directory. For example, temporary files, logs, or large data files might not be necessary for the target system. This is where the—-exclude and—-exclude-from options come into play.
In this guide, we’ll explore how to use these options to exclude files and directories from rsync with practical examples.
Exclude a Single File
The --exclude option allows you to specify files and directories that should not be copied during the sync operation. Let’s look at some basic examples of how to use it.
To exclude a single file from the sync, use the --exclude option followed by the file name or path relative to the source directory:
rsync -av --exclude 'file.txt' /source/ /destination/
Output:
sending incremental file list
./
file1.txt
file2.txt
file.txt
sent 90 bytes received 45 bytes 270.00 bytes/sec
total size is 200 speedup is 1.33
Here is the explanation:
-av: Archive mode and verbose output.
--exclude 'file.txt': Excludes the file file.txt from the sync.
/source/ /destination/: The source and destination directories.
In this example, file.txt is excluded, but other files (file1.txt, file2.txt) are copied.
Exclude a Directory
If you want to exclude an entire directory, use the directory name in the --exclude option:
rsync -av --exclude 'dir1/' /source/ /destination/
Output:
sending incremental file list
./
dir2/
file1.txt
file2.txt
sent 140 bytes received 60 bytes 400.00 bytes/sec
total size is 300 speedup is 1.67
Here, dir1/ is excluded from the sync, and only the remaining files and directories are synced.
Exclude Files with Specific Patterns
You can also exclude files based on patterns, such as excluding all .log files:
rsync -av --exclude '*.log' /source/ /destination/
Output:
sending incremental file list
./
file1.txt
file2.txt
In this case, all .log files are excluded, and only files that don’t match the pattern are synced.
Using the --exclude-from Option
The --exclude-from option allows you to specify a file containing a list of exclusions. This file can include multiple lines, each representing a file or directory to exclude.
First, create an exclusion file with the items you want to exclude:
echo 'file.txt' > exclude-list.txt
echo 'dir1/' >> exclude-list.txt
echo '*.log' >> exclude-list.txt
The exclude-list.txt file now contains the following:
file.txt
dir1/
*.log
Now, use the --exclude-from option to exclude all the patterns in the file:
rsync -av --exclude-from='exclude-list.txt' /source/ /destination/
In this example, all the exclusions from exclude-list.txt are applied, and the specified files, directories, and patterns are not synced.
Conclusion
In this guide, we’ve covered the basics of excluding specific files, directories, and patterns in rsync, along with practical examples of each use case. Excluding files and directories in rsync allows you to fine-tune your sync operations by omitting unnecessary or unwanted files. Try it out by syncing a backup directory on VPS hosting from Atlantic.Net!
### How to Execute a Command in Multiple Directories on Linux – A Step-by-Step Guide
In Linux system administration, there are many situations where you may need to execute the same command across multiple directories. Automating this task can save significant time and reduce the likelihood of human error, whether it’s cleaning up log files, updating configurations, or managing files in bulk.
In this tutorial, we’ll explore different ways to execute commands in multiple directories using Linux tools, such as for loops, find, xargs, and shell scripting.
Why Execute Commands Across Multiple Directories?
There are several practical scenarios where executing commands across multiple directories is necessary:
Updating Git repositories: Running git pull in several directories to keep repositories up to date.
Cleaning up logs: Removing old log files from multiple directories.
Batch file processing: Converting or moving files across directories.
Using a For Loop in Bash to Execute Commands in Multiple Directories
One of the simplest ways to execute a command in multiple directories is by using a for loop. This method is straightforward and ideal when you have a fixed list of directories.
Here is an example of listing files in multiple directories:
for dir in /home/user/dir1 /home/user/dir2 /home/user/dir3; do
(cd "$dir" && ls)
done
Output:
file1.txt file2.txt file3.txt
file4.log file5.txt file6.jpg
file7.mp4 file8.doc file9.png
In this example:
The for loop iterates over each directory listed in /home/user/dir1, /home/user/dir2, and /home/user/dir3.
The cd "$dir" changes the directory, and && ls lists the files in that directory.
Using the find Command to Target Directories Dynamically
The find command is a handy tool for searching for directories based on specific criteria, such as names, types, or modification dates. You can also use it to execute a command in each found directory.
Here is an example of how to find directories and run ls in each directory.
find /home/user -type d -exec bash -c 'cd "{}" && ls' \;
Output:
file1.txt file2.txt file3.txt
file4.log file5.txt file6.jpg
file7.mp4 file8.doc file9.png
In this example:
find /home/user -type d searches for all directories (-type d) under /home/user.
The -exec option allows us to execute the ls command in each directory found.
This method is ideal for dynamically targeting directories, especially when the directory structure is large or unknown.
Parallel Execution of Commands Using xargs
If you have many directories and want to execute commands in parallel to speed things up, you can use xargs. This tool allows you to run commands concurrently by specifying the number of processes.
Here is an example to run ls in parallel across directories.
find /home/user -type d | xargs -n 1 -P 4 bash -c 'cd "$0" && ls'
Output:
file1.txt file2.txt file3.txt
file4.log file5.txt file6.jpg
file7.mp4 file8.doc file9.png
In this example:
xargs -n 1 tells xargs to pass one directory at a time to the bash command.
-P 4 runs the command in parallel using 4 processes.
Using Shell Scripting for More Complex Operations
For more complex tasks, such as error handling, conditional execution, or logging, writing a shell script is often the best solution. Let’s see how to create a script to process directories and log the output.
Here is a simple shell script for logging file listings.
#!/bin/bash
LOGFILE="output.log"
for dir in /home/user/dir1 /home/user/dir2 /home/user/dir3; do
if cd "$dir"; then
echo "Listing files in $dir:" >> $LOGFILE
ls >> $LOGFILE
else
echo "Failed to change directory to $dir" >> $LOGFILE
fi
done
When you run the above script, the following output will be produced:
Listing files in /home/user/dir1:
file1.txt file2.txt file3.txt
Listing files in /home/user/dir2:
file4.log file5.txt file6.jpg
Listing files in /home/user/dir3:
file7.mp4 file8.doc file9.png
This script does the following:
It attempts to change to each directory listed in the for loop.
If the directory change is successful, it logs the file listing into output.log.
If it fails, it logs an error message.
This method is useful for automating tasks that require logging and error handling.
Conclusion
Executing commands in multiple directories is a common task for Linux administrators and developers. By using methods like for loops, find, xargs, and shell scripting, you can automate repetitive tasks efficiently and avoid manual errors.
Try to experiment with these methods to find the one that best suits your needs, and consider combining them for even more complex scenarios on VPS hosting from Atlantic.Net!
### How to Execute a Bash Script Directly from a URL
Bash scripts are an integral part of automating tasks in Linux environments. One interesting use case is executing a bash script directly from a URL. This can save time by allowing you to instantly run scripts hosted on the web without downloading them to your machine first. However, while this can be useful, it's essential to understand the risks and security implications.
This guide will walk you through different methods to execute bash scripts directly from URLs.
Method 1: Using Curl and Pipe to Bash
The curl command is one of the easiest ways to execute a bash script from a URL. The general syntax is as follows:
curl -s https://example.com/script.sh | bash
Explanation:
-s flag: This flag enables silent mode, suppressing progress bars and errors to make the command cleaner.
Piping to Bash: The pipe | sends the output of curl directly to the bash interpreter.
Example: Let’s assume there is a script hosted at https://example.com/hello-world.sh that prints “Hello, World!” when executed.
curl -s https://example.com/hello-world.sh | bash
Output:
Hello, World!
Method 2: Using Wget and Pipe to Bash
wget is another popular tool for downloading files from the web. To execute a script from a URL using wget, you can use the following syntax:
wget -qO- https://example.com/script.sh | bash
Explanation:
-q flag: This flag enables quiet mode, suppressing output.
-O- option: This tells wget to output the file contents to the terminal (stdout) instead of saving to a file.
Example: Using the same hello-world.sh script as before:
wget -qO- https://example.com/hello-world.sh | bash
Output:
Hello, World!
Method 3: Downloading the Script First, Then Executing
In some cases, it is safer to download the script first, review its content, and then run it. Here’s how you can download a bash script and execute it manually.
Step 1: Download the script using wget or curl:
wget https://example.com/hello-world.sh
Step 2: Review the script to ensure it’s safe. You can use a text editor like nano or cat to read the contents:
cat hello-world.sh
Step 3: Make the script executable:
chmod +x hello-world.sh
Step 4: Run the script:
./hello-world.sh
Output:
Hello, World!
Conclusion
In this guide, we explored different methods to run a script from URLs. However, we recommend validating the script's content and executing it in a secure environment. Whether you’re using curl, wget, or downloading scripts manually, these methods offer flexibility but should be handled with care. You can try any of the above methods on VPS hosting from Atlantic.Net!
### Running a Shell Script on a Remote Machine Through SSH
Remote access and automation are critical in modern system administration. SSH (Secure Shell) allows you to connect securely to remote machines, making it easy to run tasks or scripts from anywhere.
This guide will show you how to run a shell script on a remote machine using SSH. You’ll learn how to automate tasks, transfer scripts, and troubleshoot common issues.
Why Use SSH for Running Shell Scripts?
Running shell scripts on a remote machine is useful for:
Automating tasks like backups, system updates, or deployments.
Managing remote servers without physically accessing them.
Centralizing workflows, making it easy to manage multiple machines from a single location.
Setting up SSH Key-Based Authentication
To avoid entering your password every time, use SSH keys:
1. Generate SSH Key Pair:
ssh-keygen -t rsa -b 4096
Output:
Generating public/private rsa key pair.
Enter file in which to save the key (/home/your_username/.ssh/id_rsa):
2. Copy the Public Key to the Remote Server:
ssh-copy-id user@remote-server
Once this is set up, you can log in without a password.
Writing and Preparing the Shell Script
Start by creating your shell script on your local machine. For example, a simple script like backup.sh could look like this:
#!/bin/bash
# Backup script to archive home directory
tar -czf /backup/home_backup.tar.gz /home/user/
Make the script executable:
chmod +x backup.sh
Running a Shell Script on a Remote Machine via SSH
To run a shell script on a remote machine directly through SSH, use this command:
ssh user@remote-server 'bash -s' < ./backup.sh
Output:
Compressing /home/user/ directory...
Backup saved at /backup/home_backup.tar.gz
Here’s a breakdown:
user@remote-server: The username and remote host.
'bash -s': Tells the remote machine to interpret the script as standard input.
< ./backup.sh: Sends the script through SSH for execution.
Transferring and Running Shell Scripts with SCP
Another way to run a script is to transfer it first and then run it. You can use scp to copy the script to the remote server.
Step 1: Copy the Script to the Remote Machine
scp ./backup.sh user@remote-server:/home/user/
Output:
backup.sh 100% 234 12KB/s 00:00
Step 2: Run the Script on the Remote Machine
ssh user@remote-server 'bash /home/user/backup.sh'
Automating Remote Script Execution with SSH Config and Bash Aliases
You can set up an SSH config file or a Bash alias to simplify the process.
Setting up an SSH Config File
Create or edit the ~/.ssh/config file and add the following:
Host remote-alias
HostName remote-user
User user
Now, you can use the alias remote-alias to log in:
ssh remote-alias
Creating a Bash Alias
You can also create a Bash alias to simplify running the script:
alias run_backup="ssh user@remote-server 'bash /home/user/backup.sh'"
Now, simply type run_backup to execute the script.
Conclusion
Running shell scripts on remote machines via SSH simplifies automation and system management. You can either run the script directly using SSH or transfer it and execute it later. Use SSH config and Bash aliases to streamline repetitive tasks. Keep experimenting with more complex scripts to automate your workflow on VPS hosting from Atlantic.Net!
### Using sar Command to Get System Resource Stats
The sar command is a handy tool for monitoring system performance on Linux. It can report CPU usage, memory consumption, network activity, and more. System administrators and DevOps engineers use sar to track resource usage and troubleshoot system issues.
This guide will show you how to install and use the sar command to gather system resource stats.
Installing the sar Command
The sar command is part of the sysstat package, which needs to be installed before you can start using sar. The installation process varies depending on the Linux distribution you’re using.
On Ubuntu/Debian:
To install sysstat on Ubuntu or Debian-based systems, run the following commands:
apt-get update
apt-get install sysstat
Once installed, you need to enable the sysstat data collection process:
systemctl enable sysstat
systemctl start sysstat
The sysstat service will now automatically start at boot and collect data every 10 minutes by default.
On CentOS/Fedora:
On CentOS or Fedora-based systems, install sysstat using the following command:
yum install sysstat
Again, you’ll need to enable and start the service:
systemctl enable sysstat
systemctl start sysstat
Basic Syntax and Options
The sar command offers a variety of options that allow you to collect and report system statistics over a specific interval and for a specific count. The general syntax for the sar command is as follows:
sar [options] [interval] [count]
Explanation:
interval: The time between each data sample, in seconds.
count: The number of samples to be collected.
For example, if you want to collect CPU usage statistics every 5 seconds for a total of 3 times, you would run:
sar -u 5 3
Output:
Linux 6.5.0-35-generic (ubuntupc) 09/10/2024 _x86_64_ (4 CPU)
09:13:48 AM CPU %user %nice %system %iowait %steal %idle
09:13:53 AM all 8.83 0.00 4.00 0.62 0.00 86.56
09:13:58 AM all 10.40 0.00 4.39 0.37 0.00 84.85
09:14:03 AM all 9.68 0.00 3.31 0.36 0.00 86.65
Average: all 9.63 0.00 3.90 0.45 0.00 86.02
Here are some commonly used options for sar:
-u: Reports CPU usage statistics.
-r: Reports memory and swap space statistics.
-n DEV: Reports network activity
-b: Reports disk I/O statistics.
Monitoring CPU Usage with sar
One of the most common use cases of sar is to monitor CPU usage. The -u option shows how much CPU time is spent on different types of processes, such as user processes, system processes, and idle time. It also indicates how much time the CPU spends waiting for I/O operations.
Run the following command to monitor CPU usage.
sar -u 1 5
Output:
Linux 6.5.0-35-generic (ubuntupc) 09/10/2024 _x86_64_ (4 CPU)
09:16:21 AM CPU %user %nice %system %iowait %steal %idle
09:16:22 AM all 11.52 0.00 3.40 0.00 0.00 85.08
09:16:23 AM all 4.62 0.00 2.31 0.51 0.00 92.56
09:16:24 AM all 4.10 0.00 2.31 0.26 0.00 93.33
09:16:25 AM all 3.09 0.00 2.32 0.26 0.00 94.33
Here’s what each column means:
%user: Percentage of CPU time spent on user processes (non-kernel).
%system: Time spent on system (kernel) processes.
%iowait: Time spent waiting for I/O operations to complete.
%idle: Time when the CPU is idle.
Checking Memory Usage with sar
The sar -r command allows you to monitor memory usage, providing insights into both physical memory (RAM) and swap space.
Run the following command to monitor memory usage.
sar -r 1 3
Output:
09:17:46 AM kbmemfree kbavail kbmemused %memused kbbuffers kbcached kbcommit %commit kbactive kbinact kbdirty
09:17:47 AM 233660 1787928 4811984 60.78 66284 2413060 28737052 286.96 3526444 3294540 5628
09:17:48 AM 241400 1795668 4809148 60.74 66284 2408156 28731948 286.91 3527020 3294540 5456
09:17:49 AM 241472 1795740 4809288 60.75 66284 2407952 28733012 286.92 3528096 3294540 5392
Average: 238844 1793112 4810140 60.76 66284 2409723 28734004 286.93 3527187 3294540 5492
Here’s what each column represents:
kbmemfree: Free memory in kilobytes.
kbmemused: Used memory in kilobytes.
%memused: Percentage of memory used.
kbbuffers: Memory used by kernel buffers.
kbcached: Memory used by the page cache.
kbcommit: Committed memory (the amount of memory reserved for processes).
Analyzing Network Activity with sar
The sar -n DEV option shows you how much data is being transferred over your network interfaces.
Run the following command to monitor network activity.
sar -n DEV 1 3
Output:
12:03:01 AM IFACE rxpck/s txpck/s rxkB/s txkB/s rxcmp/s txcmp/s
12:03:02 AM eth0 34.03 12.12 4.22 2.56 0.00 0.00
12:03:03 AM eth0 32.43 14.01 4.35 3.01 0.00 0.00
Explanation:
rxpck/s: Number of packets received per second.
txpck/s: Number of packets transmitted per second.
rxkB/s: Kilobytes received per second.
txkB/s: Kilobytes transmitted per second.
Monitoring Disk I/O with sar
The sar -b command provides detailed information on disk I/O activities, such as the number of reads and writes per second, and the amount of data read or written.
Run the following command to monitor disk I/O.
sar -b 1 3
Output:
09:20:41 AM tps rtps wtps dtps bread/s bwrtn/s bdscd/s
09:20:42 AM 371.00 0.00 371.00 0.00 0.00 4128.00 0.00
09:20:43 AM 0.00 0.00 0.00 0.00 0.00 0.00 0.00
09:20:44 AM 0.00 0.00 0.00 0.00 0.00 0.00 0.00
Average: 123.67 0.00 123.67 0.00 0.00 1376.00 0.00
Explanation of columns:
tps: Total transactions per second.
rtps: Read transactions per second.
wtps: Write transactions per second.
bread/s: Bytes read per second.
bwrtn/s: Bytes written per second.
Scheduling sar to Run at Intervals
You can automate monitoring process by scheduling sar using cron jobs. This allows you to gather long-term performance data for later analysis.
To schedule sar to collect system resource stats every hour, edit your crontab file:
crontab -e
Add the following line to schedule data collection every hour:
0 * * * * /usr/lib/sysstat/sa1 1 1
This command tells sar to collect one sample per hour and store it in /var/log/sa/. You can view this historical data by using the -f option with sar:
sar -f /var/log/sa/sa10
This allows you to analyze system performance over time and detect any trends or anomalies.
Conclusion
The sar command is a powerful and flexible tool for monitoring system performance in Linux. It provides detailed reports on CPU, memory, network, and disk usage, helping system administrators identify and resolve performance issues. You should use sar a regular part of your system monitoring toolkit for improved system health and efficiency. You can try sar to monitor system resource usage on VPS hosting from Atlantic.Net!
### VPS vs. Dedicated Server: 6 Key Differences and How to Choose
What Is a VPS?
A virtual private server (VPS) is a virtualized server, hosting a part of a physical server's resources dedicated to a specific user. This setup allows multiple users to share the same physical machine while maintaining separate access to resources like CPU power, memory, and disk space.
VPS provides an isolated environment where each user can install and run an independent operating system, making it ideal for those needing more flexibility than shared hosting. VPS hosting provides a balance between cost and performance, offering greater control than shared hosting without the price of a dedicated server.
VPS services typically support custom configurations, enabling users to tailor the server environment to their specific needs. A VPS is scalable, allowing resources to be increased as demand grows.
What Is a Dedicated Server?
A dedicated server is a physical server entirely dedicated to a single user or organization, providing full access to its resources such as CPU, memory, and storage. Unlike VPS, a dedicated server offers a physically separate hardware stack, offering high performance and reliability for demanding applications. This type of hosting is ideal for large businesses and websites with high traffic volumes, requiring robust resources and security.
Dedicated servers allow full customization in terms of operating system, software installation and configuration. Users can manage the server to meet their precise needs, from hardware components to security measures. This option is typically more expensive than VPS solutions, but it ensures maximum performance, security, and control, making it a preferred choice for enterprises or large websites with specific technical requirements and sufficient budgets.
This is part of a series of articles about "What Is VPS?"
Pros and Cons of VPS
Advantages of VPS include:
Cost-effective: VPS hosting is generally more affordable than dedicated servers, offering a good balance of performance and price.
Scalability: VPS allows easy scaling of resources like CPU, RAM, and storage as your business grows. Adjustments can typically be made quickly without downtime.
Isolation and security: Each VPS operates independently from others on the same physical server, providing a secure environment compared to shared hosting.
Customization: Users have significant control over their server environment, including root access, allowing the installation of custom software tailored to specific needs.
Managed options available: Many VPS providers offer managed services, which can handle routine maintenance, updates, and security configurations, reducing the technical overhead for users.
Disadvantages of VPS include:
Performance variability: Since resources are shared on the same physical server, performance can be affected by the activity of other VPS users, especially during peak times.
Limited resource access: While VPS provides dedicated resources, these are still constrained compared to a dedicated server. Resource-intensive applications might not perform optimally on a VPS.
Complexity in management: Although easier than managing a dedicated server, VPS management still requires technical knowledge, particularly when configuring security measures or troubleshooting performance issues.
Potential for downtime: VPS environments can experience downtime if the underlying physical server encounters issues, affecting all virtual servers on that hardware.
Pros and Cons of Dedicated Servers
Advantages of dedicated servers include:
Exclusive resources: All server resources are dedicated to one user, ensuring consistent performance and high reliability. This eliminates the risks associated with resource contention.
Maximum performance: Dedicated servers are ideal for high-traffic websites, complex applications, and large databases that require high computational power and low latency.
Complete control and customization: Users have full control over the server, including the ability to configure hardware, install any operating system, and customize the software environment according to precise requirements.
Enhanced security: Dedicated servers offer superior security due to physical isolation from other users. This setup allows full customization of security measures, making it suitable for businesses handling sensitive data or needing to comply with strict regulations.
Reliability and stability: Dedicated servers provide exceptional stability, especially for mission-critical applications. They are less prone to issues like downtime and performance degradation compared to shared environments.
Disadvantages of dedicated servers include:
High cost: Dedicated servers are more expensive than VPS options due to the exclusive use of hardware resources. This can be a significant investment, especially for small businesses.
Scalability challenges: Scaling a dedicated server often requires physical hardware upgrades, which can be complex and costly. Unlike VPS, adding resources isn't instantaneous.
Maintenance requirements: Dedicated servers often require a high level of technical expertise for setup, maintenance, and troubleshooting, potentially requiring a dedicated IT team or managed services.
Energy consumption: Dedicated servers consume more power due to their exclusive use, which can result in higher operational costs and environmental impact compared to shared solutions like VPS.
Dedicated Server vs. VPS: The Key Differences
1. Resource Allocation
Dedicated servers allocate all hardware resources to a single user, ensuring consistent performance and stability. All CPU, RAM, and storage are reserved, which prevents contention. Conversely, a VPS shares physical resources among multiple users. Although each VPS has its allocated virtual resources, occasionally, heavy usage from other users may impact performance.
In environments where resource predictability is crucial, dedicated servers shine. They're apt for high-demand applications that cannot afford latency. VPS is adequate for moderate workloads with scalability in mind. Businesses that forecast variable demands might prefer VPS due to its flexibility in adjusting resources based on need.
2. Flexibility and Scalability
VPS offers significant flexibility and scalability, making it ideal for growing businesses. Users benefit from easily adjustable server resources like RAM, CPU, and storage, which can be modified to meet changing demands. This offers an easier transition as your website traffic grows.
Dedicated servers, while offering more limited scalability, provide unmatched flexibility in terms of hardware and software customization. As users have complete control, they can implement specific configurations inaccessible on VPS. However, scaling a dedicated server often involves hardware upgrades, which can take time and require a migration effort.
3. Performance
Dedicated servers provide superior performance due to exclusive resource access, ensuring stable and high-speed operations, which are vital for resource-intensive applications and high-traffic websites. In contrast, VPS performance can fluctuate because resources are shared, though virtualization technology helps mitigate this by compartmentalizing server segments. For many applications, VPS performance is sufficient, offering a balance between stability and cost.
The dedicated nature of a server means it can also handle unexpected traffic spikes more efficiently than a VPS, where any surge in demand might lead to resource contention among users. Dedicated servers are advantageous for businesses where performance is non-negotiable. If some variability is permissible, a VPS remains a cost-effective, competitive choice for various scenarios without a significant performance outlay.
4. Cost
VPS hosting is generally more affordable than dedicated servers because resources are shared among multiple clients, significantly reducing operational costs. This makes VPS an attractive option for small to medium businesses or startups that require dedicated-like performance without exceeding budgetary constraints.
Dedicated servers, however, involve a higher investment since all resources are exclusive to one user. This exclusivity justifies the premium pricing for businesses needing top-tier performance and control. Maintenance and management costs are additional considerations, as dedicated servers may require specialized IT personnel.
5. Security
Generally speaking, dedicated servers offer superior security as resources are unique to a single client. The isolation from other users reduces vulnerabilities, making dedicated servers suitable for businesses with sensitive data or strict compliance needs. Users gain full control over security measures, which allows tailoring of firewalls, monitoring, and other protective mechanisms to specific requirements, enhancing overall data protection. However, there is greater responsibility placed on customers to secure their servers.
In contrast, while VPS also provides a level of security far surpassing shared hosting, it does pose some risks due to resource sharing. Although virtualization provides effective segmentation, vulnerabilities could arise if the physical server is compromised. With mindful configurations and cautious management, VPS can still serve as a secure option.
6. Configuration and Customization
Dedicated servers allow for complete freedom of customization, enabling precise setups tailored to specific business needs. Users have full root access, meaning there is freedom to modify the server's software stack and operating system to match intricate use-case scenarios. It is typically possible to select custom hardware components such as CPUs, GPUs, and hard disks. This level of control is optimal for companies needing bespoke IT solutions that align with unique operational objectives.
VPS, while offering substantial customization options, is limited compared to dedicated servers due to shared infrastructure constraints. Users still enjoy significant control over software installations and settings, beyond what's available in shared hosting scenarios. For most moderate business needs, these capabilities might be sufficient.
Related content: Read our guide to VPS vs shared hosting (coming soon)
VPS vs. Dedicated Server: How to Choose?
Choosing between a VPS and a dedicated server depends on your specific needs, budget, and the nature of your business. Each option has distinct advantages and potential drawbacks, making the decision critical to your hosting strategy.
Traffic predictability
Dedicated server: Best for environments where traffic is consistently high and predictable. Dedicated resources ensure that the server is highly reliable.
VPS: Works well if your traffic is variable or gradually increasing. It's suitable for businesses that experience occasional spikes but don’t need dedicated resources 24/7.
Compliance and regulatory requirements
Dedicated server: Essential for industries like healthcare, finance, or e-commerce, where strict compliance with data security regulations (e.g., HIPAA, GDPR) is necessary. A dedicated server allows you to fully control security settings and ensure compliance.
VPS: Can be used for businesses with less stringent compliance needs. While VPS offers a secure environment, shared resources might not meet the highest standards of data protection required by certain regulations.
Disaster recovery and redundancy
Dedicated server: Typically requires a more complex and potentially costly disaster recovery plan, as redundancy has to be built into the infrastructure (e.g., multiple servers, backups, failovers).
VPS: Easier and often more affordable to set up redundancy through virtualization. Many VPS providers offer built-in disaster recovery options, such as automated backups and snapshots, at a lower cost.
Maintenance and technical support
Dedicated server: Often demands a higher level of technical expertise for maintenance, troubleshooting, and upgrades. This can involve a dedicated IT team or outsourced managed services.
VPS: Usually comes with more robust managed services as part of the package. For businesses lacking deep technical expertise, VPS providers often offer managed support, simplifying server maintenance.
Energy efficiency and environmental impact
Dedicated server: Generally consumes more power as the resources are dedicated to a single user, which might lead to higher energy costs and a larger carbon footprint.
VPS: More energy-efficient as it maximizes the use of a physical server by hosting multiple virtual servers. This shared infrastructure approach can reduce overall power consumption and is a greener option.
Dedicated Server Hosting with Atlantic.net
Unleash the huge server power of Atlantic.Net dedicated server hosting services, America's most experienced dedicated server hosting provider. Each private, physical dedicated server comes with full root access, backed by the latest hardware specifications and USA-based support.
Atlantic.Net provides various types of dedicated server hosting options, all available with discounts for long-term contracts. Dedicated Servers are a standalone hardware offering not tied into any existing Cloud platforms or hypervisors, such as the Atlantic.Net Cloud Platform. The hardware is solely set up for your requirements along with any additional Managed Services to ensure the hosting environment meets your needs.
Dedicated Server Hosting Plans
Our Dedicated Servers are custom-built to your specification with a choice of CPU, Disk, and Memory (RAM). Each server is available with full root access for complete server control. Our dedicated hosting services come with a dedicated network IP address, free SSL certificate, and support for a wide selection of operating systems and control panel options to supercharge your web hosting experience.
Learn more about dedicated server hosting with Atlantic.Net
### What Is the 3-2-1 Backup Rule?
Data Protection: A Critical Necessity
Hardware failures, human error, natural disasters, and cyberattacks are constant threats that can compromise data integrity and lead to data loss.
To safeguard against these risks, a robust data protection strategy is essential. The 3-2-1 backup rule is best practice for ensuring data safety and business continuity for any data stored across your organization.
This article will explain what the 3-2-1 backup rule is, how it works, and explain why it's important. We will also give details about how Atlantic.Net implements this strategy on our award-winning cloud platform.
Understanding the 3-2-1 Backup Rule
The backup rule is a straightforward yet highly effective approach to data backup that provides multiple layers of redundancy, crucial in safeguarding against data loss.
#1: Keep Three Copies
It is essential to maintain at least three copies of your data. This includes your original data and two backup copies.
#2: Use Two Storage Media Types
Store the data on two separate storage types. This could involve a combination of:
Local storage: such as an external hard drive or network-attached storage (NAS) for quick and convenient access.
Off-site storage: such as cloud storage or tape backup. This protects against physical damage, fire, or theft at your primary location.
#3: Keep One Backup Copy Off-Site
Store one backup copy in a geographically different location either at a colocation site or perhaps at a specialist records management company. This creates a safety net against local disasters like fires, floods, or even simple accidents.
The 3-2-1 rule isn't just about having backups; it's about having a resilient strategy. By incorporating multiple copies, diverse storage media, and off-site protection, you significantly reduce the risk of permanent data loss. It's a simple yet effective way to ensure your digital backups and critical information remain safe and accessible at all times.
The Importance of the 3-2-1 Backup Rule
Now that we know what the 3-2-1 backup strategy is, let's explore how it directly strengthens your data recovery capabilities and safeguards your business operations.
Data Loss Prevention
Hardware failures, accidental deletions, cyberattacks, and natural disasters can all lead to data loss. The 3-2-1 backup rule ensures multiple data copies are stored across different locations and storage mediums, minimizing the impact of any single point of failure.
Disaster Recovery and Business Continuity
For businesses, data loss can disrupt operations, impact productivity, and damage reputation. The 3-2-1 backup rule helps define your disaster recovery by enabling the rapid restoration of critical data and systems, minimizing downtime, and ensuring business continuity. We have many healthcare organizations using our HIPAA-compliant hosting, and this strategy is mandatory for compliance.
Protecting Against Human Error
Accidental deletions, overwrites, and misconfigurations are common causes of data loss. It's often a simple case of users accidentally deleting data - it happens! The 3-2-1 backup rule provides a safety net, allowing you to revert to a previous version of your data in case of human error.
Defending Against Ransomware
Ransomware attacks are a serious risk and a growing threat; cyber criminals are extorting businesses by encrypting valuable data and demanding payment for its release. Having successful backup strategies gives you the advantage; you'll have leverage in negotiations! By restoring data from a protected offsite backup, you can dodge the ransom and instead focus on your infrastructure security.
Compliance and Data Security
Many industries have regulatory requirements for data retention and protection. We have already mentioned healthcare, but financial, education, government, and retail are all subject to compliance requirements. The 3-2-1 backup rule helps organizations meet these compliance standards and ensures data integrity and safety.
Implementing the 3-2-1 Backup Rule in Practice
How do you implement the 3-2-1 backup rule? Firstly, did you know that Atlantic.Net has an optional backup-managed service that can be implemented into our VPS offering? Check out this page for more information.
The First Copy: Production Data
The first copy of your data is the original data that resides on your primary storage device, such as your computer's hard drive, server, VPS SSD, or SAN. This is classed as production data that you actively use and modify.
According to the 3-2-1 backup strategy, the production data is the original, actively used information residing on your primary storage medium. This is live data that drives your daily operations and is subject to constant change.
The Second Copy: Local Backup
Recognizing the risk of a single point of failure, the rule suggests at least two backups locally. For individuals, this could be as simple as creating a data copy on an external hard drive. Businesses may opt for more robust backup solutions, such as a Network Attached Storage (NAS) device or a dedicated VEEAM backup server. Regardless of the method, the proximity of these local backup copies ensures swift data recovery in scenarios like accidental deletions, file corruption, or hardware failure.
The Third Copy: Off-Site Backup (Cloud Storage)
The third copy of data is what sets the 3-2-1 backup strategy apart from standard backups. The third copy must be stored in a geographically separate location. An offsite copy of data is a great insurance policy for your data. It's physically located away from your primary data, typically in a secondary data center, and often in a different part of the country.
Having data offsite introduces several benefits. It creates disaster recovery and business continuity options. It's protected from natural disasters, fire, and flood. Above all else, it gives you peace of mind that the data is safe.
Some good options for an off-site data copy include:
Cloud Storage: Using a cloud service provider offers scalability, accessibility, and often built-in data security measures. Services like object storage provide cost-effective solutions for large data volumes. The storage layer has its own data protection which is yet another layer of safety. With some providers, you can also archive to cold archival storage automatically.
Physical Off-Site Storage: This traditional approach involves storing backup copies on media like tapes or hard drives, and transporting them to a secure location. Although this is less common today, many businesses still want to keep a copy of data offsite for extra safety. Popular businesses that offer this service are Iron Mountain and Crown Records Management.
Hybrid Solutions: Combining cloud and physical storage leverages the strengths of both strategies. This is more common with colocation service providers where businesses store server equipment in a provider's data center, they will pay for a backup service where critical data copies are kept at the provider, either on disk or media typically kept in a safe.
The ideal off-site storage choice depends on factors like data volume, recovery point objective, budget, and data sensitivity.
Key Considerations for 3-2-1 Backup Rule Data Storage
What are the important things you need to know when implementing a backed-up data strategy?
Plan the Backup Frequency: You must know what frequency of your backups is required. This is not an easy task because it depends on how often your data changes. Critical data may require daily or even hourly backups, while less frequently modified data may only need weekly or monthly backups.
Use Backup Automation: Utilize backup software or use a cloud-managed services provider like Atlantic.Net that can automate the backup process. Automation ensures that backups are performed consistently and reduces the risk of human error.
Backup Verification and Testing: It is critical to know you can trust your backups! Regularly verify the integrity of your backups and perform recovery testing to ensure that you can successfully restore data in the event of a data loss incident.
Data Encryption: Encrypt your backup data both in transit and at rest to protect it from unauthorized access. The Atlantic.Net managed backup service uses AES256 encryption as standard.
Off-Site Storage Options: Evaluate different off-site storage options, such as cloud backup, physical off-site storage, or a combination of both, based on your budget, data volume, recovery time objectives (RTOs), and recovery point objectives (RPOs).
Immutable Storage: Consider using immutable storage for your off-site backups. Immutable storage prevents data from being modified or deleted, providing an extra layer of protection against ransomware and accidental deletions.
Atlantic.Net Backups and Replication
Atlantic.Net's Cloud Backup and Replication services offer a comprehensive solution to safeguard your critical data and ensure business continuity. The high-performance ACP cloud infrastructure provides lightning-fast, robust, and fault-tolerant backup and replication capabilities.
Cloud Backups
Our snapshot-based backup service operates seamlessly in the background, automatically capturing your data according to a predefined schedule. This ensures your data is consistently protected without manual intervention, minimizing the risk of human error. With configurable backup frequencies ranging from 5 minutes to daily, you can tailor the service to match your RTO and RPO.
Key Features of Atlantic.Net Cloud Backups
File-Level Recovery: Recover individual files or folders from any backup point without the need for a full system restore. This granular approach saves time and resources, allowing you to quickly retrieve specific data as needed.
Full System Restore: Restore your entire cloud server to any previous backup point with a single click. This comprehensive recovery option ensures rapid recovery in the event of major system failures or data corruption.
Off-Site Backups: Safeguard your data against local disasters by storing backups in a geographically separate off-site location. Atlantic.Net offers multiple data center locations to choose from, ensuring your data remains safe and accessible even in the face of unforeseen events.
Replication
Our snapshot replication service takes your disaster recovery plan to the next level. By replicating your cloud VPS to one or more failover nodes, you can achieve high availability and minimize downtime in case of unexpected issues. These nodes can be located in the same data center or at a remote location, offering flexibility and redundancy.
Advantages of Atlantic.Net Backup and Replication Services
Seamless Integration with Cloud Infrastructure: Leverage the power and reliability of Atlantic.Net's cloud platform for efficient and secure backups and replication.
Flexible Backup Frequencies: Tailor your backup schedule to match your RTO and RPO requirements, ensuring your data is protected according to its criticality.
Rapid Recovery Options: Choose between file-level recovery or full system restore for quick and efficient data retrieval.
Off-Site Protection: Safeguard your data against local disasters with off-site backups stored in geographically separate locations.
High Availability with Replication: Ensure business continuity with snapshot replication, enabling rapid failover to redundant computing nodes.
Cost-Effective Solutions: Atlantic.Net offers competitive pricing and a free trial to help you get started.
Sign up for a free trial todayand experience the peace of mind that comes with knowing your data is protected. Our team of experts is ready to assist you in tailoring a backup strategy that meets your unique needs and ensures your critical data remains safe and accessible, no matter what challenges come your way.
Contact Atlantic.Net today and start on your data backup journey.
Here are some valuable resources from Atlantic.Net:
Does Atlantic.Net Offer Data Backup for Cloud Servers?
How to Enable Cloud Backups
What Is a Backup?
File-Level Recovery
Veeam Backup from Atlantic.Net
RTO vs. RPO
Atlantic.Net has an industry-leading selection of hosting options, one-click applications, and managed cloud hosting choices for your consideration. Learn more about Atlantic.Net’s hosting solutions, including HIPAA-compliant disaster recovery services. For faster application deployment, free IT architecture design, and assessment, call 888-618-DATA (3282), or email us at sales@atlantic.net.
Read More About Backup Server Solutions
Get a Backup Server from Atlantic.Net
Is a Cloud-Based Backup Service the Best Way to Back Up Data?
### How to Install and Use 'locate' on an Ubuntu Server
In this procedure, you will learn how to improve your file management skills on the Linux operating system with locate, a powerful command-line tool for efficient indexed file searching. The locate command can help you accelerate troubleshooting, perform system audits, and enhance everyday tasks with rapid file location capabilities.
What is 'locate'?
'locate' is a command-line utility that allows you to quickly find files on Linux systems by simply searching for the file names. Unlike other search tools that traverse the entire file system in real-time, 'locate' relies on a regularly updated file database to perform its searches. The concept is very simple, the database contains a list of all the files on your system along with their paths. When you execute a 'locate' command, it searches this database by file name rather than the file system itself, resulting in significantly faster search times.
Did you know there are two versions of the locate command? There is mlocate and plocate. When you install locate, you get both versions installed. But you can optionally install either mlocate or plocate. While both mlocate and plocate help locate files on Linux systems, plocate offers superior performance and efficiency due to its optimized data structures. It generates smaller databases, conducts faster searches, and is designed for modern Linux features.
Notably, some distributions have transitioned to plocate as their default locate implementation. While mlocate still functions and can be suitable when seeking files matching any of the provided patterns, plocate is generally preferred for its speed and efficiency advantages.
How 'locate' Works on the Linux System
The locate command is an extremely useful utility. Before tools like it, users had to craft complex find commands to find files in Linux. Locate is clever because immediately after installation, the filesystem is quickly indexed and saved to a database. As we mentioned before, instead of searching the filesystem, the locate command searches the database manually - it's that simple!
Let's discover in more detail how it works:
#1: Database Creation
The file database underpinning 'locate' is typically generated and maintained by a system process known as 'updatedb'. This process runs at scheduled intervals using a crontab that's created during installation. The update runs generally once a day, but this can easily be changed. The updatedb commands the service to systematically scan the entire file system to capture a snapshot of all files and their locations.
mlocate is fast at indexing the file system because it uses an incremental update strategy, an optimized database update structure, and minimizes its impact on the system with low-priority I/O tasks.
#2: Database Storage:
The default database storage location of 'locate' resides within the '/var/lib/mlocate/' directory. Should the need arise, this location can be easily changed. You can opt to save the database to an NVME or SSD storage for even quicker indexing and searches.
#3: Search Execution:
Upon executing a 'locate' command, it scans the pre-built database for files that align with your specified search criteria. The search results output and include the complete paths of the matching files.
The search looks for partial and an exact match, you can even include a globbing option such as regex values. The output shows on your default system standard output. (TTY stdout)
Ubuntu Install Locate - A Step-by-Step Guide
I am not aware of 'locate' being pre-installed in any Linux distribution. Other commands like 'find' are included, but in all distributions I have used, installing mlocate manually was necessary.
In this next section, we will explain how to install 'locate' package. Let's dive into the process of installing and using 'locate' on your Ubuntu server:
Step 1 - Install Locate Command
In the majority of contemporary Linux distributions like Ubuntu, the 'locate' utility is not included by default. You'll install 'locate' package, which provides the 'locate' command to usr/bin/locate and the required packages for managing the file databases.
Launch your terminal and execute the following command to install 'locate':
#To Install locate use (Recommended)
sudo apt install locate
#To install specifically plocate use (Optional)
sudo apt install plocate
If you have the Yum Package Manager installed you can install locate with this command line utility
sudo dnf install mlocate
Step 2 - Update the Locate DB
After installing the mlocate package, you need to populate the 'locate' database for the first time. You can do this by running the following command as root user:
sudo updatedb
This process might take some time, depending on the size of your file system. Once it's complete, you're ready to start using 'locate'.
Step 3 - Find Files Using the Locate Command
The basic syntax for using the locate command is as follows, you can also search the main pages to learn more.
locate [options] filename
man locate
Replace the filename with the name of the file you're searching for. You can also use wildcards (*) to search for multiple files that match a certain pattern.
Here are a few examples of how to use locate:
Search for a file by its exact name:
locate myfile.txt
Search for all files that contain the word "report":
locate *report*
Search for all files with the ".pdf" extension:
locate *.pdf
Step 4 - Additional Options and Tips
By default, 'locate' searches are case-sensitive. If you want to perform a case-insensitive search, you can use the -i option:
locate -i myfile.txt
'locate' also supports the use of regular expressions for more complex search patterns. To use a regular expression, you can use the -r option:
locate -r '^myfile.*\.txt$'
If you expect a large number of search results, you can limit the output using the -n option:
locate -n 10 *report*
If you've created new files or made changes to your file system, you might need to manually update the 'locate' database to ensure accurate search results. You can do this by running the updatedb command again:
sudo updatedb
Troubleshooting
"locate command not found" error: If you encounter this error, it means the mlocate package is not installed on your system. Follow the steps in the "Install Locate Command" section to install it.
"sudo updatedb" permission denied: Make sure you're running the updatedb command with sudo or as the root user.
Outdated search results: If 'locate' is returning outdated results, try manually updating the database using the sudo updatedb command.
The 'locate' command is a powerful tool for quickly finding files on your Linux system. By understanding how 'locate' works and following the steps outlined in this guide, you can efficiently manage your files and streamline your workflow. Remember to keep your 'locate' database up-to-date to ensure accurate search results.
### HIPAA Security Rule: Concepts, Requirements, and Compliance Checklist
What Is the HIPAA Security Rule?
The HIPAA Security Rule is a set of standards created to protect electronic protected health information (ePHI). Enacted under the Health Insurance Portability and Accountability Act (HIPAA), the Security Rule specifically addresses the technical and non-technical safeguards that organizations, known as covered entities, must implement to secure ePHI.
The Security Rule applies to any healthcare provider, health plan, or healthcare clearinghouse that transmits health information in electronic form. Unlike the HIPAA Privacy Rule, which governs the overall protection of PHI in all formats, the Security Rule focuses solely on ePHI. It requires covered entities to ensure the confidentiality, integrity, and availability of ePHI, guarding against potential threats, unauthorized access, or misuse of the data.
The Security Rule is structured to be flexible and scalable, allowing organizations of different sizes and capabilities to implement appropriate protections.
This is part of a series of articles about HIPAA compliance.
What Is PHI?
Defining what classifies protected health information (PHI) is critical for a covered entity. Essentially, PHI is any individually identifiable health information.
You may also encounter the acronym ePHI or e-PHI, or electronic protected health information. Electronic protected health information is protected health information stored or accessed in an electronic format. Common examples include:
Treatment reports
Test results
Prescription information
Any information that includes the name
Phone numbers
Addresses
Social security numbers
Medical records numbers
Health insurance details
What Are the Three Standards of the HIPAA Security Rule?
The HIPAA Security Rule is organized around three primary standards:
Administrative Safeguards:These are the policies and procedures designed to manage the selection, development, implementation, and maintenance of security measures to protect ePHI. Key components include conducting risk assessments, assigning security responsibilities, developing security policies, and providing workforce training.
Physical Safeguards:These involve the protection of physical access to electronic information systems and the facilities where they are housed. Physical Safeguards cover access controls, device and media controls, and workstations, ensuring that only authorized individuals have access to sensitive areas and equipment.
Technical Safeguards:These are the technology and policies that protect ePHI and control access to it. Technical Safeguards include implementing access controls, audit controls, integrity controls, and transmission security measures. They ensure that ePHI is accessed only by authorized individuals and remains unaltered during storage or transmission.
How to Comply with HIPAA Security Rule: Compliance Checklist
Below are the main steps required to comply with each of the three standards of the HIPAA Security Rule.
Complying with Administrative Safeguards
Conduct a Risk Analysis: To comply with the Administrative Safeguards under the HIPAA Security Rule, organizations must first conduct a comprehensive risk analysis. This involves identifying potential risks to the confidentiality, integrity, and availability of ePHI, assessing all areas where ePHI is stored, accessed, or transmitted, and documenting the findings to establish a baseline for future assessments.
Develop a Risk Management Plan: After identifying the risks, organizations must develop and implement a risk management plan. This plan outlines specific actions to mitigate identified risks, prioritizing these actions based on the severity of each risk and its potential impact on ePHI. The plan should also include the selection of security measures tailored to the organization’s size, complexity, and operational capabilities.
Appoint a Security Officer: A critical step in compliance is appointing a Security Officer responsible for overseeing the development and implementation of security policies and procedures. The Security Officer acts as the main point of contact for all security-related issues and ensures that the organization’s security measures are aligned with HIPAA requirements.
Implement Workforce Training: Workforce training is essential for compliance. All employees, from executives to front-line staff, must be trained on the organization’s security policies and procedures. This training should be continuous, with regular updates to address new threats and technological changes, ensuring employees can recognize and report potential security incidents.
Establish Incident Response Procedures: Organizations must have procedures for managing and responding to security incidents, including a clear incident response plan. This plan should detail steps to take in the event of a breach, such as containment, investigation, remediation, and reporting. Regular testing and updating of the plan are necessary to ensure it remains effective against evolving threats.
Conduct Regular Evaluations: Regular evaluations of security measures are essential to maintaining compliance. These evaluations assess the effectiveness of current safeguards and identify areas needing improvement. The evaluation process should be dynamic, incorporating feedback from past incidents and changes in the organization’s risk profile.
Complying with Physical Safeguards
Control Access to Facilities: To comply with the Physical Safeguards, organizations must focus on protecting the physical environment where ePHI is accessed, stored, or transmitted. This begins with implementing access controls, such as locked doors, security badges, and biometric systems, to ensure only authorized personnel can enter sensitive areas.
Monitor and Document Access: Organizations must monitor and document who enters and exits areas containing ePHI. This can be achieved through visitor logs, security cameras, and other monitoring systems. Regular reviews of these records are crucial to detect and address any unauthorized access attempts.
Secure Workstations: Workstation security is another key aspect of Physical Safeguards. Organizations must ensure that workstations used to access ePHI are secure, which involves placing computers in safe locations, using privacy screens to prevent unauthorized viewing, and implementing automatic screen locks to protect unattended devices.
Manage Mobile Device Security: Mobile devices pose unique security challenges due to their portability. Organizations must implement security measures such as encryption, remote wiping capabilities, and strict access controls on mobile devices. Employees should be trained on these security protocols and the procedures to follow if a device is lost or stolen.
Manage Hardware and Media Lifecycle: Proper management of the lifecycle of hardware and media containing ePHI is crucial. Organizations need procedures for the secure disposal or reuse of equipment like hard drives and USB drives, including using certified data destruction services or physical destruction methods to ensure ePHI cannot be recovered.
Implement Environmental Security Controls: Environmental security controls are vital for protecting physical infrastructure. This includes measures such as fire suppression systems, climate control, and emergency power solutions that help safeguard against environmental threats like fires, floods, or power outages, thereby maintaining the availability and integrity of ePHI.
Complying with Technical Safeguards
Implement Access Controls: Technical Safeguards focus on technologies and policies that protect ePHI from unauthorized access, alteration, or destruction. Implementing robust access controls is essential, including assigning unique user IDs to track access and using role-based access to ensure users only access necessary information based on their job functions.
Establish Emergency Access Procedures: Organizations must establish and document emergency access procedures to ensure authorized individuals can access ePHI during emergencies. These procedures should be regularly tested to ensure they are effective in crisis situations.
Deploy Audit Controls: Audit controls are a critical component of Technical Safeguards. Organizations must use systems that log user access, changes to ePHI, and security-related events. Regular review of audit logs is necessary to detect unauthorized activities, and logs must be protected from tampering to maintain their integrity.
Maintain ePHI Integrity: To maintain the integrity of ePHI, organizations should use integrity controls like checksums or hash functions to prevent data alteration or corruption. If an integrity breach is detected, processes must be in place to recover and verify the original ePHI.
Ensure Transmission Security: Transmission security is essential for protecting ePHI when transmitted electronically. Encryption is a primary technology for safeguarding ePHI during transmission, making data unreadable without the appropriate decryption keys. Organizations should also employ secure communication channels like VPNs or TLS.
Continuously Monitor and Update Technical Safeguards: Continuous monitoring and updating of technical safeguards are necessary to address new vulnerabilities and threats. This includes applying software patches, updating encryption protocols, and conducting regular security assessments to ensure all technical measures remain effective against the latest threats.
What Is a Covered Entity?
Covered Entities (CE) are organizations that handle PHI or e-PHI during day-to-day business operations. A Covered Entity must abide by HIPAA regulations, including the HIPAA Security Rule, which are enforced by the HSS.
The U.S. Department of Health and Human Services (HHS) officially defines a Covered Entity as belonging to one of the following groups:
Healthcare Providers – such as doctors, dentists, nursing homes, pharmacies, etc.
Health Plans – health insurance companies, HMOs, Medicare, Medicaid, etc.
Clearinghouses – transcription services, etc.
How Are Business Associates Affected by the HIPAA Security Rule?
Business Associates are organizations that work with Covered Entities in handling e-PHI or PHI. Just as a Covered Entity must abide by HIPAA regulations in handling e-PHI or PHI, so too must any Business Associate they work with. Atlantic.Net is a Business Associate of each healthcare organization with whom we process, store, manage or otherwise deal with electronic protected health information.
What is a Business Associate (BAA)?
Therefore, we are legally obliged to sign a contract of service with each organization to guarantee our HIPAA compliance status. We outline our security policies and procedures and our administrative, physical, and technical safeguards that detail how we maintain the confidentiality, integrity, and availability of electronic protected health information.
HIPAA Security Rule vs. Privacy Rule: What Is the Difference?
The HIPAA Security Rule focuses exclusively on protecting electronic protected health information (ePHI) by setting standards for how ePHI must be stored, accessed, and transmitted securely. It mandates administrative, physical, and technical safeguards that covered entities and business associates must implement to ensure the confidentiality, integrity, and availability of ePHI.
The HIPAA Privacy Rule applies more broadly, covering all forms of protected health information (PHI), whether it is electronic, paper-based, or oral. The Privacy Rule sets standards for how PHI can be used and disclosed, establishing individuals’ rights over their health information, such as the right to access their records or request corrections.
While the Security Rule deals with how ePHI is protected, the Privacy Rule governs how PHI is shared, emphasizing the need for patient consent and limiting unauthorized disclosures.
Secure HIPAA Compliant Hosting
Are you in need of an infrastructure that can protect the health data of your organization? At Atlantic.Net, we can offer a secure HIPAA-Compliant Hosting solution. Get a free consultation today, or get started with a free trial today!
Learn more about our HIPAA-compliant web hosting and HIPAA cloud hosting solutions.
Written by Richard Bailey
Linux, Cloud, and Lead IT Consultant with 30 years of experience. Graduate of the University of Bradford, England. Enthusiastic about Technology, Automation, and Infrastructure as Code. Passionate writer, keen to understand and disseminate as much technical knowledge as possible
This article was updated with the most recent information on September 3, 2024.
Read More About HIPAA Compliance
HIPAA Compliance Checklist
How to Become HIPAA Compliant
Top Considerations for HIPAA File Storage
HIPAA Data Storage Requirements
Protecting e-PHI in the Cloud
What Is HIPAA Cloud Computing?
What Is Healthcare Hosting?
What Is PHI?
### How to Retrieve Console Geometry in a Bash Script
Console geometry refers to the dimensions of the terminal window—specifically, the number of columns and rows. These values determine how much text can fit on a single line and how many lines can be displayed at once.
Knowing the size of the terminal allows your script to adapt its output, avoiding awkward line breaks or misaligned text. In this article, we’ll walk through how to retrieve console geometry, explain why it's useful, and show you practical examples.
Retrieving Console Geometry in Bash
There are a few ways to retrieve the console geometry in a Bash script. We’ll cover three methods: using tput, stty, and command substitution.
Method 1: Using tput
The tput command is a simple way to get terminal dimensions. Here's how you can use it:
#!/bin/bash
# Get the number of columns
cols=$(tput cols)
# Get the number of rows
rows=$(tput lines)
echo "Terminal size: ${cols} columns, ${rows} rows"
In this script, tput cols returns the number of columns, and tput lines returns the number of rows. We store these values in variables and then print them out.
The above script will produce the following output.
Method 2: Using stty
Another way to retrieve terminal size is with the stty command:
#!/bin/bash
# Get terminal size
size=$(stty size)
rows=$(echo $size | cut -d' ' -f1)
cols=$(echo $size | cut -d' ' -f2)
echo "Terminal size: ${cols} columns, ${rows} rows"
The stty size command gives you the number of rows and columns in a single line. We split this line into two variables using the cut command.
After running the above script, the output looks like shown below:
Terminal size: 168 columns, 43 rows
Method 3: Using Command Substitution
Command substitution lets you combine commands to get the geometry in one go:
#!/bin/bash
# Get terminal size
cols=$(echo $(stty size) | cut -d' ' -f2)
rows=$(echo $(stty size) | cut -d' ' -f1)
echo "Terminal size: ${cols} columns, ${rows} rows"
This method is similar to the stty example, but it uses command substitution to streamline the process.
You will get the following result after running the script.
Terminal size: 168 columns, 43 rows
Using Geometry Values in a Script
Now that you know how to get the terminal size, let's use these values in a script. For instance, you might want to center some text based on the terminal width:
#!/bin/bash
# Get terminal size
cols=$(tput cols)
# Text to display
text="Welcome to Bash Scripting!"
# Calculate the position to center the text
padding=$((($cols - ${#text}) / 2))
# Print the centered text
printf "%${padding}s%s\n" "" "$text"
Here, ${#text} gets the length of the text string, and padding calculates how much space to add on the left to center the text.
This script will generate the following output.
Welcome to Bash Scripting!
Conclusion
Retrieving console geometry in a Bash script is a valuable skill. It allows you to make your scripts more interactive and responsive to the user’s environment. Whether you use tput, stty, or command substitution, these methods allow you to format your output dynamically.
Now that you know how to retrieve and use console geometry. You can start making your scripts more user-friendly and adaptable on dedicated server hosting from Atlantic.Net!
### Extract Specific Columns from Files in Linux with grep, sed, and awk
When you work with text files in Linux, you'll often need to extract specific columns. Whether you’re dealing with CSV files, logs, or any tabular data, Linux command-line tools like grep, sed, and awk can make this task easy.
This guide will show you how to use these tools to get the data you need.
Using grep to Extract Specific Columns
grep is a simple and efficient tool for searching text. But when it comes to extracting columns, grep needs help from other tools like cut. Here’s how you can use them together.
Example: Extracting a column with grep and cut
Suppose you have a file data.txt with the following content:
Name Age Location
Alice 30 New York
Bob 25 Los Angeles
Charlie 35 Chicago
You want to extract the "Age" column. First, use grep to filter the lines you need:
grep -v "Name" data.txt | cut -d ' ' -f 2
Output:
30
25
35
Here’s what happens:
grep -v "Name" filters out the header line.
cut -d ' ' -f 2 splits the line by spaces and selects the second field.
Using sed to Extract Specific Columns
sed is a stream editor, perfect for text substitution and simple data extraction. You can use sed to extract columns by combining it with the cut command.
Example: Using sed to remove unwanted parts
Imagine you have the same data.txt file, and you want to extract the "Location" column:
sed '1d' data.txt | cut -d ' ' -f 3
Output:
New York
Los Angeles
Chicago
Here’s how it works:
sed '1d' deletes the first line (the header).
cut -d ' ' -f 3 extracts the third field.
Using awk to Extract Specific Columns
awk is the powerhouse of text processing. It’s designed for extracting and processing text, especially when working with columns.
Example: Extracting columns with awk
Let’s extract both "Name" and "Location" from the data.txt file:
awk '{print $1, $3}' data.txt
Output:
Name Location
Alice New York
Bob Los Angeles
Charlie Chicago
Explanation:
awk '{print $1, $3}' tells awk to print the first and third columns.
Skipping the header
You might want to skip the header when extracting data:
awk 'NR>1 {print $1, $3}' data.txt
Output:
Alice New York
Bob Los Angeles
Charlie Chicago
In this example:
NR>1 ensures awk only processes lines after the first one.
Conclusion
You now know how to extract specific columns from files using grep, sed, and awk. Each tool has its strengths, and knowing when to use which one can make your work with text files much more efficient. Start practicing with your own files on dedicated server hosting from Atlantic.Net!
### Ultimate 9-Step HIPAA Compliance Checklist
What Is HIPAA Compliance?
HIPAA compliance means meeting the requirements of HIPAA (the Health Insurance Portability and Accountability Act), a law regulated by the US Department of Health and Human Services (HHS). Practically speaking, HIPAA compliance involves adherence to the physical, administrative, and technical safeguards outlined in HIPAA, which covered entities and business associates must uphold to protect the integrity of Protected Health Information (PHI).
Brief Overview of HIPAA’s Four Rules
To achieve HIPAA compliance, you need to thoroughly understand the rules set forth by the HIPAA regulation. These rules are divided into four key areas:
The Privacy Rule outlines how PHI can be used and disclosed, giving patients rights over their health information.
The Security Rule sets standards for safeguarding electronic PHI (ePHI) through administrative, physical, and technical safeguards.
The Breach Notification Rule requires covered entities and business associates to notify affected individuals, the HHS, and in some cases, the media, in the event of a breach of unsecured PHI.
The Final Omnibus Rule made several amendments to the previous rules, enhancing patients' privacy protections and strengthening the ability of the HHS to enforce compliance.
Beginner's Guide to HIPAA Compliance
Click here to download the HIPAA Compliance Beginner's Guide PDF
Ultimate 9-Step HIPAA Compliance Checklist
1. Dedicate Responsible Personnel
HIPAA compliance requires assigning specific roles within your organization to ensure that all aspects of the regulations are met. This involves appointing a HIPAA Privacy Officer and a HIPAA Security Officer:
The Privacy Officer is responsible for developing and implementing privacy policies and procedures that comply with the HIPAA Privacy Rule. This includes handling complaints and ensuring that all employees are trained on the organization's privacy practices.
The Security Officer is tasked with the implementation and management of the security measures necessary to protect ePHI. This role involves conducting risk assessments, overseeing the technical safeguards, and ensuring that security measures are updated to address new threats.
2. Develop a HIPAA Compliance Administration Plan
A comprehensive HIPAA compliance administration plan is essential for managing all aspects of HIPAA compliance within your organization. This plan should outline the policies and procedures that your organization will follow to comply with HIPAA.
Key components of this plan include:
Risk assessments to identify potential vulnerabilities in your handling of PHI and ePHI.
Incident response procedures for managing potential breaches or non-compliance issues.
Regular audits to ensure that all departments are adhering to HIPAA policies and procedures.
Documentation protocols to track compliance efforts and demonstrate adherence to HIPAA rules.
3. Implement Physical Safeguards
Physical safeguards are necessary to protect the integrity of PHI and ePHI by preventing unauthorized physical access to your facilities and systems.
Important measures include:
Controlled access to facilities where PHI and ePHI are stored, using secure locks, access control systems, or even security personnel.
Workstation security to ensure that devices used to access ePHI are secured against unauthorized access. This can include locking screens when not in use and ensuring workstations are not accessible to unauthorized personnel.
Proper disposal of PHI and ePHI, ensuring that paper records are shredded and electronic data is securely deleted or degaussed.
4. Implement Technical Safeguards to Protect Access to ePHI
Technical safeguards are crucial for protecting ePHI from unauthorized access or breaches. These measures include:
Access controls such as unique user IDs and passwords to ensure that only authorized individuals can access ePHI.
Encryption of ePHI both at rest and in transit, to protect data from being accessed by unauthorized individuals if it is intercepted or stolen.
Audit controls that track access and activity related to ePHI, allowing you to monitor who accessed the data and when.
Automatic logoff mechanisms that terminate sessions after a period of inactivity, reducing the risk of unauthorized access.
5. Train Employees on HIPAA Procedures
Training your employees on HIPAA procedures is a fundamental part of achieving and maintaining compliance. Every employee who has access to PHI or ePHI should be regularly trained on HIPAA regulations and your organization’s specific policies.
Training should cover:
Understanding HIPAA rules including the Privacy, Security, and Breach Notification Rules.
Proper handling of PHI and ePHI, ensuring that employees know how to securely access, transmit, and dispose of this information.
Recognizing potential threats such as phishing emails, which could lead to a breach.
Reporting suspicious activity or potential breaches to the designated HIPAA officers.
6. Plan for Emergencies
Your HIPAA compliance strategy should include contingency planning to ensure that PHI and ePHI remain secure during emergencies, such as natural disasters, system failures, or cyberattacks.
An effective emergency plan includes:
Data backup procedures to ensure that all ePHI is regularly backed up and can be restored in the event of data loss.
Disaster recovery plans that outline how your organization will continue to operate and protect PHI and ePHI during and after an emergency.
Testing and revision of plans to ensure that they are effective and up to date with current threats and technologies.
7. Set Up Breach Notifications in Case Data is Lost
Under the Breach Notification Rule, covered entities and business associates must have procedures in place for notifying affected individuals, the HHS, and in some cases, the media, when a breach of unsecured PHI occurs.
Your breach notification procedures should include:
Immediate internal reporting of any potential breach to the designated HIPAA Security Officer.
Evaluation of the breach to determine its severity and the number of individuals affected.
Notification of affected individuals as soon as possible, but no later than 60 days after discovering the breach. Notifications should include a description of the breach, the type of information involved, and the steps affected individuals should take to protect themselves.
Reporting the breach to the HHS using the appropriate online portal. For breaches involving more than 500 individuals, the media must also be notified.
8. Document HIPAA Activity
Documentation is a critical part of HIPAA compliance, serving as evidence that your organization is meeting the requirements of the law.
Key areas to document include:
HIPAA policies and procedures that your organization has implemented.
Risk assessments conducted to identify and mitigate vulnerabilities.
Training records showing that employees have been educated on HIPAA compliance.
Incident reports detailing any breaches or potential breaches and the steps taken to address them.
9. Continually Monitor and Update Compliance Policies
HIPAA compliance is not a one-time effort but requires ongoing monitoring and updates as your organization grows and as new regulations or threats emerge.
Ongoing compliance efforts should include:
Regular audits of your HIPAA compliance program to identify areas that need improvement.
Updating policies and procedures in response to changes in your organization’s operations, the introduction of new technology, or updates to HIPAA regulations.
Continuous training for employees to ensure they are aware of any new procedures or risks.
Top Tips for HIPAA Compliance
HIPAA expert Raj Chaudhary, who leads the security and privacy teams at consultancy group Crowe Horwath, suggested these tips for more effective HIPAA compliance:
Keep data in the appropriate hands by strengthening security with logins. Ensure that only the people that need access to ePHI have a user ID or a user account, and policies are in place to change default passwords and increase password complexity.
Monitor controls and ensure logging is working correctly. A key aspect of complying with the HIPAA Security Rule is that you pay close attention to access to PHI. Simply put, you want to log everything. IT personnel should make sure that the logging feature is active within all systems around the clock. In addition to logging, you want to directly monitor via a system of rules, so you can examine your data accumulation process and be certain that everything is continually meeting your access controls.
Assess your access controls at all layers, including the network and your software. At the level of the network, you should have user IDs and strong passwords. This level of security is usually less problematic because it’s managed directly by IT. The other critical layer, though, is the software. You need to maintain control of that layer. Plus, although it’s annoying to users to get locked out of their accounts, Chaudhary noted that it’s a lesser evil to get hacked. “[A]s an example, if somebody externally breaks in through your firewall to get to your systems and is now trying to guess the password, you’ve got to make sure that you have some sort of a lock-out after a few of these attempts,” he said. “I typically recommend that after 10 failed attempts, one should be locked out.”
Pay careful attention to business associates who are handling any PHI, aka protected health information. Chaudhury recommended carefully reviewing your business associate agreement (BAA) that controls your data relationship with each vendor that is handling your data. Since the introduction of the Final Omnibus Rule, business associates are directly responsible for meeting the parameters of HIPAA compliance –in other words, you are now less exposed by the law since the vendors carry some of the burdens. Nonetheless, due diligence is still necessary.
See Additional Guides on Key Compliance Management Topics
Together with our content partners, we have authored in-depth guides on several other topics that can also be useful as you explore the world of compliance management.
HIPAA compliant hosting
How to Make a HIPAA-Compliant Website in 2024
HIPAA Compliant Server for a Client Portal Solution
Best Practice for Creating a HIPAA-Compliant WordPress Site
PCI compliant hosting
What is PCI Compliance in 2024?
PCI DSS Cybersecurity Requirements: A Practical Guide
Small Business PCI Compliance Guide
HIPAA IT compliance
HIPPA or HIPAA? HIPAA vs. HIPPA – What’s the Difference?
Best HIPAA-Compliant Fax Services in 2024
Best HIPAA-Compliant Email Service in 2024
HIPAA Compliant Hosting
Are you in need of an infrastructure that can protect the health data of your organization? At Atlantic.Net, whatever your technical requirements, we can offer a top-grade HIPAA-Compliant Web Hosting solution. Get a HIPAA-Compliant Server Cost from one of our experts.
Get a free consultation today!
Read More About HIPAA Compliance
How to Become HIPAA Compliant
What Is the HIPAA Security Rule?
Top Considerations for HIPAA File Storage
HIPAA Data Storage Requirements
Protecting e-PHI in the Cloud
What Is HIPAA Cloud Computing?
What Is Healthcare Hosting?
What Is PHI?
This article was updated with the latest information on February 26, 2025.
### Simplify Linux Permissions with the getfacl Command
File permissions in Linux ensure that only authorized users can access or modify files. The traditional permission model uses rwx (read, write, execute) for the user, group, and others. But what if you need more fine-grained control? That’s where Access Control Lists (ACLs) come in. ACLs allow you to set specific permissions for individual users or groups. The getfacl command is a handy tool that lets you view these ACLs.
This guide will walk you through how to use getfacl with clear examples.
Introduction to the getfacl Command
The getfacl command is straightforward. It lets you view the ACLs of any file or directory. Here’s the basic syntax:
getfacl [OPTION] file_name
This command shows who has what permissions on a file or directory. Before you use ACLs, ensure your filesystem supports them. Most modern filesystems like ext4 and XFS do.
Let's dive into some practical examples to understand how getfacl works.
Example 1: Viewing the ACLs of a File
To see the ACLs of a file, use the following command:
getfacl myfile.txt
Here’s what the output might look like:
# file: myfile.txt
# owner: vyom
# group: vyom
user::rw-
group::rw-
other::r--
In this example:
user::rw- shows the owner’s permissions.
group::rw- shows the group’s permissions.
other::r-- shows permissions for all other users.
Example 2: Viewing the ACLs of a Directory
Directories can have default ACLs. These are inherited by new files created in the directory. To view the ACLs of a directory, run:
getfacl mydirectory
Output:
# file: mydirectory
# owner: vyom
# group: vyom
user::rwx
group::rwx
other::r-x
In this case, any new file in mydirectory will inherit the default ACLs, ensuring consistency.
If you want to list ACLs for all files in a directory, use the -R flag:
getfacl -R mydirectory
This command displays the ACLs of all files and subdirectories within mydirectory.
Example 3: Combining getfacl with Other Commands
You can combine getfacl with setfacl to manage and copy ACLs. For instance, if you want to copy ACLs from one file to another:
getfacl sourcefile | setfacl --set-file=- targetfile
This command ensures that targetfile has the same ACLs as sourcefile.
Conclusion
ACLs are a powerful tool in Linux for managing permissions beyond the traditional model. The getfacl command makes it easy to view and understand these permissions. Explore getfacl in your system, and see how it can simplify your permission management tasks on dedicated server hosting from Atlantic.Net!
### How to Remove the Password From Your SSL Key
A common security measure used to protect SSL certificates is encrypting your SSL certificate and key file with a password or new passphrase. An SSL certificate (or Self Signed Certificate) is used to authenticate a website's identity and enable encrypted connections, safeguarding all sensitive data transmitted between users and the server.
A crucial component of an SSL certificate is the private key, a cryptographic file that must be kept confidential. To enhance security, private keys are often protected with a password or pass phrase. However, certain scenarios, such as automated processes or specific configurations, might require removing this password.
In this guide, we'll explore the process of removing the password from your SSL key file using OpenSSL, a powerful command-line tool widely used for cryptographic operations.
Understanding the Importance of Private Keys
Before we demonstrate the process of removing the password, let's briefly explain the importance of private keys. In the SSL/TLS handshake, the private key is used to decrypt messages encrypted with the corresponding public key.
If your private key is compromised, an attacker could impersonate your website, intercept sensitive data, or even carry out man-in-the-middle attacks. Therefore, safeguarding your private keys must be a top priority.
How To Use OpenSSL Remove Password From Key
OpenSSL provides a straightforward way to remove passphrase from the SSL key. The command takes your password protected private key, and prompt you for the password, removes the password, then outputs a new key with no password and encrypted headers.
openssl rsa -in yourSSLkey.key -out yourSSLkeywithnopassword.key
Let's break down what's happening here:
openssl rsa: This invokes the OpenSLL utility.
-in yourSSLkey.key: Specifies the input file, which is your original SSL key file containing the password.
-out yourSSLkeywithnopassword.key: Specifies the output file, where the new key without a password will be stored to a new RSA private key.
When you run this command, you'll be prompted to enter the password for your original key. Once you provide the correct password, OpenSSL will create a new key file (yourSSLkeywithnopassword.key) that is identical to the original but without password protection.
Working with a Private Key File
Private key files typically have the .key extension and are stored in the Privacy-Enhanced Mail (PEM) format. A PEM file is a text files that contain Base64-encoded data, making them easy to share, manage or view in a text editor.
Important Considerations
Security: Removing the password from your SSL key reduces its security. Only do this if absolutely necessary and take steps to protect the unencrypted key file.
Backups: Always create a backup of your original key file before removing the password.
Alternative: If you need to use the key without a password temporarily, consider using openssl rsa -in yourSSLkey.key to decrypt it in memory rather than creating an unencrypted output file
Removing the password from your OpenSSL key can be useful in certain situations, but it's important to understand the security implications. By following the steps outlined in this guide and using OpenSSL's powerful capabilities, you can manage your SSL keys effectively while maintaining a balance between convenience and security.
### Managed VPS vs. Unmanaged VPS: What's the Difference?
A VPS is a high-performance server partitioned into multiple isolated virtual environments, each operating as a standalone server equipped with its dedicated operating system and resources. When choosing a VPS, you'll need to decide between an unmanaged or managed server.
Each service offering gives distinct advantages and disadvantages, and managed hosting can cater to the different levels of technical expertise and business needs that customers have. You choose to either include a wrap-around service (managed) where a team of experts look after the server 24x7, or you go it alone with unmanaged VPS hosting and handle everything yourself.
In this article, we'll explore and uncover the key differences between managed VPS servers and unmanaged VPS hosting. The aim is to provide you with enough information to make an informed decision about which hosting service is best for you.
Managed VPS Hosting
Managed VPS hosting is a popular choice for businesses that prefer a "hands-off, more control" approach to server management. In this model, the hosting provider takes care of the core technical aspects of the virtual server, including server management, security measures, and application management.
Some of the key features of Managed VPS hosting include:
#1: Server Setup and Configuration
The hosting provider takes care of the initial setup, installing the operating system, and configuring essential software components.
#2: Software Updates and Security Patches
The provider ensures that the server's operating system and software are kept up to date, minimizing the risk of security vulnerabilities and ensuring optimal performance.
#3: Dedicated Support Team
Managed VPS hosting typically includes access to a technical support team, ready to assist with any server-related issues you may encounter. You may also get access to a Network Operation Center that proactively monitors and maintains your servers.
#4: User-Friendly Control Panel
The Atlantic.Net managed VPS plans include a user-friendly control panel, making it easier to manage websites, databases, and email accounts without extensive technical knowledge. You get a detailed overview of your infrastructure and can look at performance logs, uptime, and events.
#5: Automatic Backups
Regular backups of your data are often included, protecting against data loss and enabling easy recovery in case of any unforeseen events.
Who is Managed VPS Hosting For?
Managed VPS hosting presents an ideal solution for individuals or businesses seeking the power and flexibility of a Virtual Private Server (VPS) without the complexities of server administration. It caters perfectly to website owners experiencing moderate to high traffic volumes, particularly those running dynamic platforms like a WordPress site or e-commerce stores.
For these users, reliable performance and minimal downtime are expected. Additionally, the assurance of automatic updates and a dedicated support team to swiftly address any technical issues offers invaluable peace of mind, allowing our customers to focus on their core business objectives.
Unmanaged VPS Hosting
Unmanaged VPS hosting offers greater control and flexibility but also requires more technical knowledge and responsibility. In this model, the hosting provider provides the virtual server and its underlying infrastructure but leaves the server management tasks to the user.
Essentially the user is left to their own devices, but with the added peace of mind that Atlantic.Net dedicated support teams are available 24x7 if any help is needed.
#1: Full Root Access and Full Control
Unmanaged VPS grants root access, allowing users complete control over the server's configuration, software installations, and customization. You control the operating system, the update frequency, the backup policy, and how to manage the applications.
#2: Customization Freedom
Users have the freedom to install and configure any software or applications they need, tailoring the server environment to their specific requirements. You control user access, server hardening, and security.
#3: Cost-Effectiveness
Unmanaged VPS hosting is generally more cost-effective than managed hosting, as users are not paying for additional server management services from hosting providers such as managed backup, server management, or anti-virus management.
Unmanaged VPS hosting is the ideal choice for technically inclined individuals and businesses who value autonomy and customization. It provides an unparalleled level of control, allowing you to craft the perfect virtual private server environment to meet your specific needs. While this model requires technical proficiency, the potential rewards in terms of performance, flexibility, and cost savings are substantial.
With great power comes great responsibility. Unmanaged VPS hosting demands a solid understanding of server administration and is typically used by established businesses. If you're not comfortable with these tasks, a managed VPS server and hosting might be a more suitable option. However, if you're ready to embrace the challenge and unleash your inner sysadmin, unmanaged VPS hosting offers a world of possibilities at your fingertips.
Unmanaged vs Managed VPS: Key Differences
When choosing between managed vs unmanaged VPS, understanding the core distinctions is vital. Let's discover the key differences that will help you make an informed decision.
Control: Unmanaged VPS hosting offers complete control over your server environment, allowing you to configure everything from the operating system to security measures. However, this level of control requires technical expertise to handle server management independently. On the other hand, managed VPS saves time and simplifies server management, taking care of technical tasks like updates and security configurations to protect against potential threats. While this offers convenience, you'll have less direct control over your hosting environment.
Cost Considerations: Generally, unmanaged VPS hosting is less expensive as you're essentially renting a virtual machine on a physical server. Managed VPS server hosting comes at a higher cost as it includes the expertise of the hosting provider to manage your server.
Technical Skills: Unmanaged VPS is best suited for individuals or businesses with the technical skills to manage a server. It's ideal if you enjoy the learning curve and want the freedom to customize your hosting experience. In contrast, managed hosting is perfect for those who prefer to focus on their website or business without worrying about server administration.
Factors to Consider When Choosing Between Managed and Unmanaged VPS
Unmanaged VPS offers an ideal solution for tech-savvy individuals and businesses who crave greater control and the ability to fine-tune their server resources for multiple websites or complex personal sites. This option lets users both handle server management independently and delve deep into the server's configuration options, optimizing performance and tailoring the hosting environment to their specific needs.
Managed VPS provides a hassle-free experience for those new to web hosting or those who simply prefer to focus their time and energy elsewhere. By entrusting server management to experts like Atlantic.Net, businesses and individuals alike can prioritize their core operations, confident that their own website will run smoothly and securely in the background. This hands-off approach is particularly beneficial for established businesses seeking to streamline their IT operations without sacrificing website performance.
To recap, remember these key points:
Technical Expertise: If you lack in-house technical skills, managed VPS is a safer and more convenient option.
Budget: Unmanaged VPS is generally more cost-effective, but consider the potential costs of hiring technical support, consultancy, or experiencing downtime due to misconfiguration.
Control and Flexibility: Unmanaged VPS offers greater control and customization freedom, while managed VPS prioritizes ease of use and convenience.
Business Needs: Consider the specific requirements of your website or application and choose the hosting solution that best aligns with your needs.
Managed and Unmanaged VPS: Finding the Middle Ground
Some hosting providers like Atlantic.Net offer a middle ground between fully managed and unmanaged VPS, providing managed support for specific tasks such as server setup, security, and backups, while leaving other aspects of server management to the user.
Atlantic.Net engineers will be involved as much or as little as you like. Everyone has access to our expert support teams around the clock - it doesn't matter if you are managed or using unmanaged hosting, Atlantic.Net is available 24x7x365.
Everyone gets out 100% Uptime SLA. This can be a good option for businesses seeking a balance between convenience and control.
Choosing the Right VPS Hosting for Your Success
Whether you opt for managed or unmanaged, VPS hosting, the key is to choose a reliable hosting provider with a strong reputation for performance, security, and customer support. Consider your technical expertise, budget, and business needs to make an informed decision that backs your online success.
If you have any further questions about managed hosting vs unmanaged hosting or VPS or need assistance choosing the right hosting solution for your business, feel free to reach out to our expert support team. We are always happy to help!
We hope you have found this article helpful, remember: Your hosting choice can significantly impact your website's performance, security, and overall user experience. Make sure to choose your web hosting providers wisely and invest in a hosting solution that supports your business growth and online success.
Atlantic.Net: Your Trusted Hosting Partner
At Atlantic.Net, we offer both managed and unmanaged VPS hosting options to cater to businesses of all sizes and technical expertise. Our cloud VPS hosting solutions provide dedicated servers with premium hardware resources, ensuring optimal performance and reliability for hosting your website or application.
We are committed to providing exceptional customer support and empowering businesses to focus on their core activities while we handle the technical complexities of shared hosting and server management. Contact us today to learn more about our VPS shared hosting services and how we can help you achieve your online goals.
### Using AI Coding Assistants in a HIPAA-Compliant Environment
What Are AI Coding Assistants?
AI coding assistants are software tools powered by artificial intelligence that help developers write code more efficiently and accurately. These assistants leverage machine learning algorithms, including large language models (LLMs) in advanced tools, to provide suggestions, detect errors, and automate repetitive coding tasks. By integrating into development environments, they shorten the coding lifecycle and improve the overall coding experience.
AI coding assistants have become indispensable tools for many developers, offering support for various programming languages and frameworks. Beyond simple syntax corrections, AI coding assistants can provide context-aware recommendations, write entire code snippets or functions, and refactor code to align with best practices.
How AI Coding Assistants Work
AI coding assistants use traditional natural language processing (NLP) algorithms and large language models to understand and generate code. They analyze the context of existing code and offer real-time suggestions that match the developer's intent. These models are trained on extensive datasets that include various coding languages, styles, and problem-solving approaches, enabling them to make intelligent recommendations.
The assistants operate within integrated development environments (IDEs), offering features like code completion, real-time error detection, and code refactoring. Some assistants also integrate with version control systems to suggest improvements based on past projects. The goal is to streamline the coding process, minimize errors, and ultimately increase development efficiency.
Benefits of AI Coding Assistants in HIPAA-Compliant Environments
AI coding assistants enhance code quality by identifying potential bugs, vulnerabilities, and logical errors during the development phase. They apply best practices and coding standards, ensuring that the generated code is both efficient and secure. This is critically important in HIPAA-compliant environments, where data security and integrity are paramount.
Additionally, some of these tools include features that assess the security implications of code changes, offering suggestions to mitigate risks. They help ensure that the software adheres to compliance requirements by integrating security checks into the development workflow.
Challenges of Using AI Coding Assistants in HIPAA-Compliant Environments
Data Privacy and Security Risks
While coding assistants can contribute to secure coding practices, integrating AI coding assistants in HIPAA-compliant environments can also create new data privacy and security risks. These tools need access to code repositories, some of which may contain sensitive patient information. If not properly managed, this access can lead to unauthorized data exposure. Ensuring that AI assistants adhere to strict data handling protocols is crucial to prevent security breaches.
Moreover, the AI models themselves require regular updates and maintenance, which can introduce vulnerabilities if not handled securely. Organizations must implement robust security measures, including encryption and secure access controls, to protect sensitive data from potential threats. Continuous monitoring and auditing of AI tools are essential to detect and mitigate any emerging risks promptly.
Model Training and Data Handling Concerns
AI coding assistants rely on large datasets for training, which may include proprietary or sensitive information. In HIPAA-compliant environments, this can be problematic due to strict data privacy regulations. Ensuring that the data used for training is anonymized and secure is essential to prevent any compliance violations. Organizations must also be cautious about using third-party AI models that might not meet HIPAA standards.
Furthermore, the data-handling practices of AI tool providers need thorough vetting to ensure compliance with HIPAA regulations. This includes understanding how data is collected, stored, processed, and shared. Any deviation from compliance can lead to significant legal and financial repercussions for the organization. Therefore, effective data governance and robust due diligence are essential when integrating AI coding assistants.
Lack of Clear Regulatory Guidelines
The rapid advancement of AI technology has outpaced the development of regulatory guidelines, leading to ambiguity in compliance requirements. HIPAA regulations were initially designed with traditional software development in mind and do not explicitly address the nuances of AI-assisted coding. This creates challenges for organizations trying to maintain compliance while leveraging the benefits of AI tools.
Organizations must navigate this uncertainty by implementing best practices informed by general compliance principles and seeking guidance from legal and compliance experts. Collaboration with regulatory bodies to develop more specific guidelines for AI in healthcare can also help bridge this gap. Until clearer regulations are established, a cautious and well-documented approach to adopting AI coding assistants is advisable.
Best Practices for Ensuring HIPAA Compliance with AI Coding Assistants
Selecting HIPAA-Compliant AI Tools
Choosing HIPAA-compliant AI coding assistants is the first step towards ensuring data privacy and security. Organizations should rigorously evaluate the compliance credentials of AI tool providers, including their adherence to data protection standards and audit practices. Contracts and service-level agreements (SLAs) should explicitly state the compliance obligations and responsibilities of both parties.
Additionally, selecting tools with built-in compliance features, such as automated data anonymization and secure access controls, can significantly reduce the risk of non-compliance. It's also beneficial to choose AI assistants that offer detailed logging and auditing capabilities, allowing for continuous monitoring and verification of compliance adherence.
Implementing Robust Access Controls
Implementing robust access controls is crucial to safeguard sensitive data when using AI coding assistants. Organizations should ensure that only authorized personnel have access to data and development environments. Role-based access controls (RBAC) can help restrict access based on job responsibilities and minimize the potential for data breaches.
Furthermore, employing multi-factor authentication (MFA) adds an additional layer of security, making it more challenging for unauthorized users to gain access. Regularly reviewing and updating access permissions ensures that access controls remain effective and aligned with organizational changes. Continuous monitoring of access logs can help detect and respond to any unauthorized access attempts promptly.
Data Anonymization and Encryption
Anonymizing and encrypting data are vital practices for maintaining HIPAA compliance when using AI coding assistants. Data anonymization removes personally identifiable information (PII), ensuring that any data used by AI tools cannot be traced back to individuals. Encryption, both in transit and at rest, ensures that data remains secure from potential breaches.
Organizations should implement strong encryption protocols and verify that AI tool providers adhere to these standards. Regular audits of encryption practices and anonymization processes are necessary to ensure ongoing compliance. By prioritizing data anonymization and encryption, organizations can significantly reduce the risk of data exposure and maintain the integrity of patient information.
Training and Awareness for Developers
Regular training and awareness programs for developers are essential to ensure HIPAA compliance when using AI coding assistants. Developers must understand the importance of data privacy and security and be well-versed in the compliance features and limitations of the AI tools they use. Ongoing education on regulatory updates and best practices ensures that developers remain compliant as they adapt to new technologies.
Moreover, fostering a culture of security and compliance within the development team can enhance vigilance and proactive risk management. Providing resources, guidelines, and support for developers helps them incorporate compliance considerations into their daily workflows.
Conclusion
AI coding assistants offer significant benefits by enhancing developer productivity, improving code quality, and embedding compliance into the development process. In HIPAA-compliant environments, they can streamline workflows and reduce the risks associated with manual coding errors. However, these benefits come with challenges, including data privacy risks, model training concerns, and a lack of clear regulatory guidelines.
To mitigate these challenges, organizations must adopt best practices such as selecting HIPAA-compliant tools, implementing robust access controls, and ensuring data anonymization and encryption. Ongoing training and awareness programs for developers are also essential. By taking these steps, organizations can leverage the advantages of AI coding assistants while maintaining stringent compliance with HIPAA regulations.
How Can Atlantic.Net Help?
Atlantic.Net’s HIPAA Hosting Solutions are especially ideal for companies in the healthcare vertical to help cope with rapidly increasing infrastructure needs.
Atlantic.Net has over thirty years of experience, with expert staff that are available to assist you and your company’s needs 24/7. Contact us today, and we will work with you to create a custom HIPAA Cloud Hosting Solution that is perfect for your business.
Author Bio: Gilad David Maayan
Gilad David Maayan is a technology writer who has worked with over 150 technology companies including SAP, Imperva, Samsung NEXT, NetApp and Check Point, producing technical and thought leadership content that elucidates technical solutions for developers and IT leadership. Today he heads Agile SEO, the leading marketing agency in the technology industry.
LinkedIn: LinkedIn
### How to Disable Weak SSH Ciphers
SSH (Secure Shell) is the backbone of secure remote connections to your servers. But did you know that using weak SSH ciphers can put your entire system at risk? Weak ciphers can be exploited by attackers, leaving your data exposed.
In this guide, we'll explore how to disable weak SSH ciphers and ensure your connections are as secure as possible.
Understanding SSH Ciphers
SSH ciphers are encryption algorithms that secure your SSH connections. They protect your data as it travels between your computer and the server. There are different types of SSH ciphers, including symmetric, asymmetric, and MACs (Message Authentication Codes).
Symmetric ciphers use the same key to encrypt and decrypt data. Examples include AES (Advanced Encryption Standard) and 3DES.
Asymmetric ciphers use a pair of keys: one to encrypt and another to decrypt. RSA (Rivest–Shamir–Adleman) is a common example.
Identifying Weak SSH Ciphers in Your System
Before disabling weak ciphers, you need to identify them. Here's how to do it:
1. List all available ciphers on your server with this command:
ssh -Q cipher
Output:
3des-cbc
aes128-cbc
aes192-cbc
aes256-cbc
aes128-ctr
aes192-ctr
aes256-ctr
aes128-gcm@openssh.com
aes256-gcm@openssh.com
chacha20-poly1305@openssh.com
The list above shows both strong and weak ciphers. Your job is to identify and disable the weak ones.
2. Check the currently enabled ciphers in your SSH configuration file:
nano /etc/ssh/sshd_config
Look for the line starting with Ciphers. If it’s not there, you’ll need to add it later.
3. Identify weak ciphers from the list. Common weak ciphers include:
3des-cbc
aes128-cbc
aes192-cbc
These ciphers are less secure and should be disabled.
Disabling Weak SSH Ciphers
Now that you know which ciphers to disable, let’s edit the SSH configuration file.
1. Open the SSH configuration file:
nano /etc/ssh/sshd_config
2. Add or update the Ciphers line to include only strong ciphers:
Ciphers aes256-ctr,aes192-ctr,aes128-ctr
This line ensures that only the strong ciphers are used. You’re telling SSH to ignore the weak ones.
3. Save and exit the file by pressing Ctrl + X, then Y, and Enter.
4. Restart the SSH service to apply the changes:
systemctl restart sshd
Testing the Configuration
After adding the new ciphers, you should test the configuration to make sure everything works correctly.
1. Try to connect to your server using SSH:
ssh -vvv user@your-server-ip
The -vvv option enables verbose mode, which shows detailed information about the connection, including which ciphers are being used.
Check the ciphers in use in the output. You should see something like this:
debug2: host key algorithms: rsa-sha2-512,rsa-sha2-256,ecdsa-sha2-nistp256,ssh-ed25519
debug2: ciphers ctos: aes256-ctr,aes192-ctr,aes128-ctr
debug2: ciphers stoc: aes256-ctr,aes192-ctr,aes128-ctr
The above output confirms that your server only uses strong ciphers.
2. Troubleshoot if necessary. If the SSH service fails to restart or if you can’t connect, check the sshd_config file for typos or errors.
Conclusion
Securing your SSH connections by disabling weak ciphers is essential for protecting your server. By following this guide, you’ve taken a significant step toward enhancing your system’s security. Remember to regularly review your settings and stay up-to-date with the latest security practices. Try to disable weak ciphers on dedicated server hosting from Atlantic.Net!
### How to Use lscpu Command to Display CPU Architecture
The lscpu command is a simple tool in Linux that gives you detailed information about your CPU. It shows you everything from the number of cores to the supported instruction sets. This command is compatible with most Linux distributions and is an easy way to gather CPU details.
This guide will show you how to use lscpu to get all the information you need.
Installing lscpu
Most Linux distributions come with lscpu pre-installed. If you find it missing, you can easily install it. Here’s how:
For Debian/Ubuntu-based systems:
apt-get install util-linux
For Red Hat/CentOS-based systems:
yum install util-linux
Basic Usage of lscpu Command
Using lscpu is straightforward. Just open your terminal and type:
lscpu
This command will give you a comprehensive overview of your CPU. Here’s an example output:
Architecture: x86_64
CPU op-mode(s): 32-bit, 64-bit
Address sizes: 39 bits physical, 48 bits virtual
Byte Order: Little Endian
CPU(s): 4
On-line CPU(s) list: 0-3
Vendor ID: GenuineIntel
Model name: 11th Gen Intel(R) Core(TM) i3-1115G4 @ 3.00GHz
CPU family: 6
Model: 140
Thread(s) per core: 2
Core(s) per socket: 2
Socket(s): 1
Stepping: 1
CPU max MHz: 4100.0000
CPU min MHz: 400.0000
BogoMIPS: 5990.40
Let’s break down what each part of the lscpu output means:
Architecture: The CPU is 64-bit, allowing it to handle 64-bit data and applications.
CPU op-mode(s): The CPU supports both 32-bit and 64-bit operations.
Address sizes: Can address up to 512 GB of physical memory and 256 TB of virtual memory.
Byte Order: Data is stored in Little Endian format, with the least significant byte first.
CPU(s): The system has 4 logical CPUs available.
On-line CPU(s) list: All 4 CPUs (0 to 3) are active and available for use.
Vendor ID: The CPU is manufactured by Intel.
Model name: It’s an 11th Gen Intel Core i3 processor running at 3.00 GHz.
CPU family: Identifies the CPU as part of Intel's Family 6, which includes most modern processors.
Model: A specific identifier for this CPU within its family.
Thread(s) per core: Each core can handle 2 threads, thanks to Hyper-Threading.
Core(s) per socket: The CPU has 2 physical cores.
Socket(s): There is one physical CPU socket on the motherboard.
Stepping: Indicates the revision level of the CPU.
CPU max MHz: The CPU can boost up to 4.1 GHz under load.
CPU min MHz: The CPU can lower its speed to 400 MHz to save power.
BogoMIPS: A rough measure of CPU speed, calculated during system boot.
Filtering and Customizing lscpu Output
Sometimes you need specific information. You can filter lscpu output using tools like grep. For example, to show only the CPU model:
lscpu | grep 'Model name'
This command will display:
Model name: 11th Gen Intel(R) Core(TM) i3-1115G4 @ 3.00GHz
If you want to see if your CPU supports virtualization:
lscpu | grep 'Virtualization'
Output:
Virtualization: VT-x
You can also format the output for better readability by using the -e flag:
lscpu -e
Output:
CPU NODE SOCKET CORE L1d:L1i:L2:L3 ONLINE MAXMHZ MINMHZ MHZ
0 0 0 0 0:0:0:0 yes 4100.0000 400.0000 1003.032
1 0 0 1 1:1:1:0 yes 4100.0000 400.0000 1010.179
2 0 0 0 0:0:0:0 yes 4100.0000 400.0000 1015.344
3 0 0 1 1:1:1:0 yes 4100.0000 400.0000 1020.013
Conclusion
The lscpu command is a powerful tool that gives you a quick and detailed look into your CPU's architecture. Whether you're a system admin, developer, or just curious, understanding your CPU is crucial. Try using lscpu today to explore what your CPU has to offer on dedicated server hosting from Atlantic.Net!
### Understanding CPU Usage Over 100% in top Command Output
When managing a Linux system, monitoring CPU usage is crucial. One of the most popular tools for this is the top command. However, you might have noticed something curious: sometimes, CPU usage can exceed 100%.
In this article, we’ll explore why this happens, how top calculates CPU usage, and what it means for your system.
What Is the top Command?
The top command is a real-time system monitor. It provides a dynamic view of the system’s processes, including memory and CPU usage. By default, top updates its output every few seconds, showing which processes consume the most resources.
To run top, simply open your terminal and type:
top
You’ll see a screen filled with information about your system’s current processes.
Tasks: 325 total, 1 running, 324 sleeping, 0 stopped, 0 zombie
%Cpu(s): 4.4 us, 0.0 sy, 0.0 ni, 95.6 id, 0.0 wa, 0.0 hi, 0.0 si, 0.0 st
MiB Mem : 7731.5 total, 570.3 free, 4209.5 used, 2951.7 buff/cache
MiB Swap: 2048.0 total, 347.3 free, 1700.7 used. 2155.8 avail Mem
PID USER PR NI VIRT RES SHR S %CPU %MEM TIME+ COMMAND
6634 vyom 20 0 567248 53416 40440 S 6.2 0.7 2:07.67 gnome-terminal-
108953 vyom 20 0 13344 4224 3328 R 6.2 0.1 0:00.02 top
1 root 20 0 168476 10476 6892 S 0.0 0.1 0:08.03 systemd
2 root 20 0 0 0 0 S 0.0 0.0 0:00.08 kthreadd
3 root 0 -20 0 0 0 I 0.0 0.0 0:00.00 rcu_gp
4 root 0 -20 0 0 0 I 0.0 0.0 0:00.00 rcu_par_gp
5 root 0 -20 0 0 0 I 0.0 0.0 0:00.00 slub_flushwq
6 root 0 -20 0 0 0 I 0.0 0.0 0:00.00 netns
8 root 0 -20 0 0 0 I 0.0 0.0 0:00.00 kworker/0:0H-events_highpri
11 root 0 -20 0 0 0 I 0.0 0.0 0:00.00 mm_percpu_wq
12 root 20 0 0 0 0 I 0.0 0.0 0:00.00 rcu_tasks_kthread
How CPU Usage is Calculated
In top, CPU usage is calculated as a percentage of the CPU’s capacity. This can be a bit tricky because modern CPUs have multiple cores. For a single-core CPU, 100% means full usage. But for a multi-core CPU, top can show usage that exceeds 100%.
Example of Single-Core vs. Multi-Core
Imagine your system has four cores. If one process uses 100% of one core, top shows 100% for that process. But if another process uses 100% of a second core, you could see 200% total CPU usage. This is because top sums the usage across all cores.
Here’s a simple way to understand this:
Single-core CPU: 100% means full usage.
Dual-core CPU: 200% is the maximum (100% per core).
Quad-core CPU: 400% is the maximum.
Why CPU Usage Can Exceed 100%
Seeing CPU usage over 100% is normal on multi-core systems. Each core can run at 100%, so on a quad-core CPU, you might see usage go up to 400%. This doesn’t mean your CPU is overworked; it just shows that multiple cores are being utilized.
Let’s look at an example. Run the following command to simulate high CPU load:
stress --cpu 4 --timeout 10
In the top output, you’ll notice that CPU usage can exceed 100%. If your system has four cores, it could reach 400%.
Tasks: 331 total, 5 running, 326 sleeping, 0 stopped, 0 zombie
%Cpu(s): 99.3 us, 0.7 sy, 0.0 ni, 0.0 id, 0.0 wa, 0.0 hi, 0.0 si, 0.0 st
MiB Mem : 7731.5 total, 399.0 free, 4205.2 used, 3127.3 buff/cache
MiB Swap: 2048.0 total, 348.2 free, 1699.7 used. 2190.8 avail Mem
PID USER PR NI VIRT RES SHR S %CPU %MEM TIME+ COMMAND
109280 vyom 20 0 3708 256 256 R 98.7 0.0 0:03.03 stress
109282 vyom 20 0 3708 256 256 R 98.3 0.0 0:03.04 stress
109283 vyom 20 0 3708 256 256 R 98.3 0.0 0:03.02 stress
109281 vyom 20 0 3708 256 256 R 97.0 0.0 0:02.99 stress
Here, each stress process uses nearly 100% of a core, totaling 400%.
Analyzing top Output
Understanding what top shows helps you manage your system better. If CPU usage regularly exceeds 100%, it might indicate that your system is under heavy load. But it could also mean that your system is efficiently using its resources.
To analyze CPU usage, focus on these key points:
%CPU Column: Shows the percentage of CPU used by each process.
Overall CPU Usage: Displayed at the top of the screen, showing the total usage across all cores.
Load Average: Indicates the system load over the last 1, 5, and 15 minutes. Values greater than the number of CPU cores suggest a heavily loaded system.
Conclusion
Seeing CPU usage over 100% in top is normal for multi-core systems. It shows that your system is using all available resources. By understanding how top calculates CPU usage and how to interpret the output, you can ensure your system runs smoothly. You can use the top command to view CPU usage when hosting your application on dedicated server hosting from Atlantic.Net!
### How to Use groupmod Command in Linux with Examples
Managing users and groups in Linux is essential. It helps keep your system organized and secure. The groupmod command is a powerful tool that allows you to modify existing groups.
This article will show you how to use groupmod with clear explanations and practical examples.
Basic Syntax of groupmod Command
Before diving into examples, let's look at the basic syntax:
groupmod [options] GROUP
Explanation:
[options]: Specifies what you want to change.
GROUP: The name of the group you want to modify.
Now, let’s explore some common use cases.
Example 1: Changing a Group Name
Sometimes, you may need to rename a group. The -n option in groupmod allows you to do this.
groupmod -n new_group_name old_group_name
Explanation:
-n new_group_name: The new name you want to assign.
old_group_name: The current name of the group.
After running the command, the group old_group_name will be renamed to new_group_name.
Example 2: Changing a Group ID (GID)
Each group in Linux has a unique Group ID (GID). Sometimes, you might need to change this ID.
groupmod -g 1001 group_name
Explanation:
-g 1001: The new GID you want to assign.
group_name: The name of the group whose GID you want to change.
The group group_name now has a GID of 1001. Be cautious, changing the GID can affect file ownership.
Example 3: Adding or Removing Users from a Group
To modify the users in a group, you usually use the usermod command. But you can still make changes using groupmod.
Adding Users:
You add users to a group using gpasswd instead.
gpasswd -a username group_name
Explanation:
-a username: Adds the user to the group.
group_name: The group you want to modify.
Removing Users:
gpasswd -d username group_name
Explanation:
-d username: Removes the user from the group.
The user username will be added to or removed from the group_name group.
Example 4: Locking a Group
Locking a group can prevent changes to its membership. This is useful in some security setups.
groupmod -L group_name
Explanation:
-L: Locks the group.
group_name: The name of the group you want to lock.
The group group_name is now locked, preventing any changes.
Conclusion
The groupmod command is a valuable tool in Linux administration. It allows you to make essential changes to your groups quickly. By practicing the examples provided, you can gain confidence and ensure your Linux system remains well-organized. You can now easily modify group attributes on dedicated server hosting from Atlantic.Net!
### Fix APT Update Post-Invoke-Success Script Execution Error
The APT package manager is a core part of Debian and Ubuntu-based systems. It handles the installation, updating, and removal of software packages. When you run apt-get update, APT not only updates the package lists but can also trigger custom scripts after a successful update. These scripts, called "Post-Invoke-Success" scripts.
However, sometimes you might see an error related to these Post-Invoke-Success scripts. This error can stop the update process and leave your system in a less-than-ideal state. In this article, we'll dive into what causes this error and how to fix it.
Understanding the Post-Invoke-Success Script Execution Error
This error occurs when APT tries to run a custom script after an update but fails. These scripts usually reside in /etc/apt/apt.conf.d/ and are often used for housekeeping tasks.
You might see an error message like this:
E: Problem executing scripts APT::Update::Post-Invoke-Success '/usr/local/bin/cleanup.sh'
E: Sub-process returned an error code
This message tells you that APT couldn't execute the script, likely due to an issue with the script itself or the environment it runs in.
Identifying the Root Cause
To fix the problem, we first need to identify the root cause. Here's how you can do it:
1. Check the APT logs: The logs can give you clues about what went wrong. You can find these logs in /var/log/apt/term.log.
less /var/log/apt/term.log
2. Inspect the script: The error might be in the script itself. Look at the script mentioned in the error message, and check for syntax errors, missing files, or other issues.
nano /usr/local/bin/cleanup.sh
3. Review file permissions: Sometimes, the issue is as simple as incorrect file permissions. Ensure that the script has the right permissions to execute.
ls -l /usr/local/bin/cleanup.sh
If the script isn't executable, you can fix it with:
chmod +x /usr/local/bin/cleanup.sh
Fixing Common Issues
Now that you've identified the problem, let's fix it. Here are some common issues and how to solve them:
1. Correcting Syntax Errors:
If the script has a syntax error, APT can't run it. Open the script and review it for mistakes. Here's an example of a bad line and how to fix it:
Incorrect:
if [ -f /tmp/file.txt then
echo "File exists"
fi
Corrected:
if [ -f /tmp/file.txt ]; then
echo "File exists"
fi
Save your changes and exit the editor.
2. Adjusting File Permissions:
The script needs the right permissions to run. Check the permissions using ls -l. If the script isn't executable, make it executable:
chmod +x /usr/local/bin/cleanup.sh
3. Resolving Conflicts:
Sometimes, another script or package might conflict with your Post-Invoke-Success script. If that's the case, you might need to adjust how your script runs or change its order in the APT process.
You can temporarily disable the script to test if it's causing the issue:
mv /usr/local/bin/cleanup.sh /usr/local/bin/cleanup.sh.disabled
Testing the Fix
After applying these fixes, it's time to test. Run the following command:
apt-get update
Watch for errors. If everything runs smoothly, you've fixed the issue. To be thorough, you can also add set -x at the top of your script to see detailed output during execution. This helps with debugging:
#!/bin/bash
set -x
# rest of the script
Conclusion
The APT Update Post-Invoke-Success script execution error can be frustrating, but it's usually straightforward to fix. By checking logs, reviewing scripts, and adjusting permissions, you can resolve the issue and ensure smooth updates in the future. Use this guide to to fix update errors on dedicated server hosting from Atlantic.Net!
### What Is an AI Server, and What Does It Do?
Over the last 18 months, AI has exploded into our everyday lives. It's on our phones, it's embedded in our search engines, social media, navigation systems, and even our healthcare and financial services. The rise has been meteoric, and it's showing no signs of slowing down.
But here's where it gets even more interesting: you don't have to be a passive consumer in this AI revolution. You can create your own AI server, and start developing your own AI applications, breaking free from the constraints of the big AI providers.
AI servers are a popular solution in the field of artificial intelligence (AI); AI servers are used to execute complex AI workloads, including training and inference of sophisticated AI models. This article will introduce you to the core concepts of AI servers, their architecture, and functionality.
Understanding AI Servers
An AI server is a powerful computing system purpose-built to handle the computational demands of artificial intelligence tasks. Unlike traditional servers designed for general-purpose computing, AI servers boast specialized hardware and software components optimized for AI computations.
While the hardware requirements for AI have historically been substantial, recent advancements have significantly lowered the barriers to entry, making AI capabilities accessible to a far broader audience.
Let's dive into what is needed for an AI server:
GPU Horsepower
Graphics cards are not just for gaming; they are proving hugely successful in powering AI. Specialized graphics processing units (GPUs) such as NVIDIA Tensor Core GPUs or AMD Instinct GPUs speed up AI processing capabilities substantially. A GPU accelerates the complex mathematical operations that form the foundation of AI and deep learning. This translates to faster training of AI models and quicker real-time inference, enabling advancements in various fields like natural language processing, computer vision, and more.
High-Performance Processors
AI models work best on servers with good processing power. A high clock speed and a large number of processing cores benefit performance greatly. Consumer-grade AI servers typically use high-performance central processing units (CPUs) like the Intel Xeon Scalable processor or AMD EPYC processors. While a powerful GPU is usually the star of the show in AI acceleration, a strong CPU acts as a vital supporting member that ensures the entire AI workload runs smoothly and efficiently.
Expansive High-Speed Memory
AI models and datasets can be enormous. Consequently, AI servers typically possess substantial amounts of high-bandwidth memory, often in the various form factors of DDR5/6 or HBM (High Bandwidth Memory). The more memory available to the AI workload, the larger AI model can be used, resulting in more detailed and typically more accurate results.
Fast SSD and NVMe Storage
AI training often needs rapid access to data and frequently utilizes high-performance storage like NVMe (Non-Volatile Memory Express) solid-state drives (SSDs) to enable efficient data movement. A fast disk file system is essential to keep up with the CPU and GPU performance and to avoid the risk of having any potential bottlenecks.
High-Speed Networking:
In distributed AI environments, seamless communication between the AI server stack is critical. AI servers typically feature high-speed networking capabilities such as InfiniBand or 2.5, 5, or 10 Gigabit Ethernet to ensure efficient data transfer between the nodes and the storage layer system.
The Role of AI Servers in Generative AI
Generative AI is a subfield of AI that focuses on creating content like images, text, and music and has experienced remarkable growth in recent years. 18 months ago, few knew of the three big players in AI: ChatGPT, Gemini, and CoPilot, each of which have now become household names. Businesses are investing huge resources in AI and machine learning, with many banking on the success of AI to give their business a competitive advantage.
This growth has been fueled by the advancement of AI servers capable of handling the computational demands of training and deploying large language models (LLMs) and other generative AI models. Generative AI training often involves processing large datasets and executing complex algorithms, making the capabilities of AI servers pivotal to their success.
Traditionally, users would pay a subscription to an LLM provider like ChatGPT, and then consume the service directly on their platform using prompts and API integration. This is already starting to change as businesses and users get smart to the idea that it's relatively easy to do it yourself.
The open-source community has been pushing free-to-use LLMs for the consumer market, and big corporations like Meta (Facebook) are investing billions of dollars in their development. Some popular open-source models include Llama, StableLM, Dolly, Bloom, and OpenAssistant.
AI Workloads and Data Centers
It's now much easier to run AI computations in the data center. Atlantic.Net is fully committed to providing AI-ready services to our customers from all of our data center locations. You can create an AI-ready VPS in a few clicks from our Atlantic.Net control panel in any of our data centers across our VPS regions. We have locations in the United States, Canada, Europe and Asia.
Atlantic.net offers a range of VPS options that can effectively handle AI-driven processes. We have recently partnered with NVIDIA to offer optional GPU configurations (region-specific) for unparalleled performance.
Enhance your experience by pairing this new service with our extensive VPS catalog, offering plans tailored for everything from general use to specialized storage, memory, or compute needs.
Here is a summary of the type of plans we have available.
General Purpose & Compute Optimized:
Our general purpose and compute-optimized VPS instances provide a good starting point for various AI-driven processes. The higher-tier options within these categories, like G3.96GB, G3.128GB, C2.32GB, and C2.64GB, offer substantial RAM and support the vCPU counts that are crucial for handling the computational demands of AI.
Integrating GPUs with these instances can supercharge their AI capabilities, particularly for tasks like deep learning and complex model training. Combining the latest gen Intel Xeon scalable CPUs from Intel Corporation, ample RAM, and a powerful GPU creates a highly performant environment for tackling demanding AI projects.
Dedicated Hosts:
Dedicated servers deliver unparalleled performance for resource-intensive AI tasks with their dedicated resources and isolation. When coupled with high-end NVIDIA GPUs like the H100 NVL or H200, these servers become powerhouses capable of easily handling the most demanding AI models running at scale.
GPU-Specific Considerations:
Choose the GPU model based on your AI tasks. The H100 NVL excels at large-scale AI models, while the L40S balances performance and cost-effectiveness for a broader range of AI applications. Engage with our sales team to discuss your AI workload requirements and identify the most suitable GPU configuration.
These configurations, combining powerful CPUs, ample RAM, and cutting-edge GPUs, unlock the full potential of AI, enabling faster training, more complex model handling, and superior performance overall.
Tips for Choosing and Deploying AI Servers
Are you ready to start your AI server journey? Do you need a server that can handle diverse AI applications in operation, from training large language models to running inference workloads for various industries?
Here are some of our top tips to get you started.
Assess Your AI Workload Requirements
Identify Your AI Tasks:
Pinpoint the specific AI applications you'll be running, such as deep learning, natural language processing, computer vision, or generative AI. Each task has different computational and memory requirements, pick an AI application and understand the recommended system requirements for the task at hand, this will help you identify the right hardware and software mix to achieve AI success.
Different AI solutions have distinct system requirements. Deep learning relies heavily on GPUs for matrix operations, while Natural Language Processing (NLP) works best on powerful CPUs for text processing. Computer vision requires high-performance GPUs for image/video analysis, while generative AI needs both strong GPUs and CPUs for handling large models and generating complex outputs. All AI tasks benefit from ample high-speed memory and fast storage.
Estimate and Test Resource Needs:
Evaluate the size of your datasets, the complexity of your AI models, and the expected inference and AI training workload. Consider the scale of your ambitions – are you dealing with large models or aiming for large-scale deployments? This will help you determine the necessary GPU horsepower (potentially leveraging technologies like NVIDIA® NVLink™ for multi-GPU setups), the number of gen Intel Xeon Scalable processors or AMD EPYC cores needed, the optimal GPU memory capacity, and the storage performance required to keep your data flowing smoothly.
Choose the Right Deployment Model
Remember, you can host your AI deployment pretty much anywhere. If you have the capital, it's possible to purchase or lease your own server. However, the costs can be very high for the top-of-the-line systems, which is why many users opt for a pay-as-you-go cloud model or a 1 to 3 year fixed term contracts.
On-Premises:
For organizations with compliance data control requirements or those in sectors like scientific research where data sovereignty is necessary, on-premises deployment might be the preferred choice. High-Performance Computing (HPC) workloads, which demand high-end computing power, often fall into this category. Remember, on-premises solutions require significant upfront investment and ongoing maintenance. Consider factors like space, power consumption, and cooling solutions – liquid cooling might be necessary for high-density deployments.
Cloud:
Cloud-based AI servers offer flexibility, scalability, and full support, plus you get pay-as-you-go pricing. They can be an excellent choice for handling fluctuating workloads and avoiding upfront infrastructure costs, you can also dip in and out when you need it.
Hybrid:
A hybrid approach, where some cognitive computing jobs run on-premises and others in the cloud, combines the benefits of both models, allowing you to leverage their strengths based on your specific business needs, and when needed offload AI computing power to the cloud.
Optimize AI Server Performance
Software Optimization:
There are lots of paid and open-source AI-specific software frameworks and libraries available. To streamline development and maximize performance, look for mature and optimized code sets and software that works well within specific resource allocations. Also, look into vector database hosting for backend optimizations.
Hardware Acceleration:
We have already discussed the importance of GPU acceleration in AI Inference. Picking a powerful VPS host is also essential.
Load Balancing:
Use application load balancers to distribute AI workloads across multiple servers and ensure optimal resource utilization. Advanced AI solutions can require a cluster of nodes to ensure peak performance and avoid performance bottlenecks.
Monitoring and Management:
Take the time to implement monitoring and management tools to track the AI server performance. The overhead on these tools is now quite affordable, but the insights you can gain to improve performance and optimize your applications can be a lifesaver when helping to identify potential issues, and proactively address them.
Plan for Scalability
Choose a Scalable Architecture:
Design your AI infrastructure with scalability in mind, allowing you to add more servers or GPUs as your AI workloads grow, ensuring your AI solutions can keep pace with the evolving demands of your business. This can involve horizontal and vertical scaling, using clustered nodes and application load balancing.
Leverage Cloud Elasticity:
If using cloud-based AI servers, take advantage of the elasticity of the cloud to scale resources up as needed, providing the agility to respond to changing AI workload demands efficiently.
Atlantic.Net AI Server Hosting
Our commitment to AI excellence is evident in our partnerships with industry leaders like NVIDIA and our continuous investment in AI-ready infrastructure. Our range of VPS options, dedicated hosts, and GPU configurations ensures that you have the flexibility to tailor your AI environment to your specific workload requirements.
Why Choose Atlantic.Net for AI Server Hosting?
Unparalleled Performance: The latest generation Intel Xeon Scalable processors, high-bandwidth memory, fast NVMe storage, and cutting-edge NVIDIA GPUs to achieve optimal AI performance.
Expert Support: Our dedicated team of experts is available to guide you through every step of your AI journey, from choosing the right configuration to optimizing your deployment for maximum efficiency.
Cost-Effectiveness: Our transparent pricing models ensure that you only pay for the resources you need, making AI server hosting accessible to businesses of all sizes.
Take the Next Step in Your AI Journey
Don't let infrastructure limitations hold back your AI ambitions. Contact Atlantic.Net today to discuss your AI server hosting needs and discover how we can help you unlock the full potential of AI.
### How to Use the passwd Command in Linux with Examples
Managing user accounts is essential in Linux systems. One of the most critical tasks is managing passwords. The passwd command in Linux is used to update a user's authentication token or password. It’s a simple but powerful tool. You can use it to change your own password or manage other users’ passwords if you have the necessary permissions.
This guide will show you how to use the passwd command in various scenarios. You'll learn how to change passwords, force password updates, lock accounts, and more.
Basic Syntax of the passwd Command
Here’s the basic syntax for the passwd command:
passwd [OPTIONS] [USERNAME]
USERNAME: The user whose password you want to change. If you omit this, the command will change the password of the user who runs it.
OPTIONS: Various options to modify the behavior of the command (we’ll cover these later).
Changing Your Own Password
Changing your password is straightforward. Just type passwd in the terminal and follow the prompts.
passwd
After entering your current password, you’ll be prompted to enter a new one twice. If the passwords match, your password is updated.
Changing password for user your_username.
Current password:
New password:
Retype new password:
passwd: all authentication tokens updated successfully.
Changing Another User's Password as Root
As a system administrator, you may need to change another user’s password. You must have root privileges to do this.
passwd username
Output:
Enter new UNIX password:
Retype new UNIX password:
passwd: password updated successfully.
Replace username with the actual username. The system will prompt you to enter the new password for the user.
Forcing Users to Change Password on Next Login
Sometimes, you need to ensure a user updates their password the next time they log in. Use the -e option to force this.
passwd -e username
This command expires the user’s password immediately. The user must change their password at the next login.
Locking and Unlocking User Accounts
Locking a user account prevents the user from logging in. This is useful if you need to temporarily disable a user’s access.
Locking an account:
passwd -l username
Unlocking an account:
passwd -u username
When you lock an account, an exclamation mark (!) is added in front of the encrypted password in /etc/shadow. Unlocking removes this mark.
Setting Password Expiration and Policies
You can enforce password expiration policies using the passwd command. For example, to set a password to expire after 30 days:
passwd -x 30 username
You can also set the minimum number of days between password changes:
passwd -n 7 username
This command ensures the user cannot change their password more than once in seven days.
Disabling Password for a User Account
In some cases, you may want to allow a user to log in without a password. You can disable the password like this:
passwd -d username
This command removes the password, allowing the user to log in without one. Be cautious with this, as it reduces security.
Conclusion
The passwd command is a vital tool for managing user accounts in Linux. I hope you should now have a solid understanding of how to use the passwd command effectively. Keep your system secure by managing passwords wisely. You can now easy set or reset password on dedicated server hosting from Atlantic.Net!
### How to Remove Metadata from Files in Linux
Metadata is data that describes other data. This hidden data can include sensitive information like your location, device details, and more. If you care about privacy, it’s essential to know how to remove metadata from your files before sharing them.
In this guide, we'll explore how to remove metadata from different file types in Linux.
Removing Metadata from Image Files
Let’s start with images, as they often carry a lot of metadata.
ExifTool is one of the most powerful tools for removing metadata from images. Here’s how to use it:
1. Install ExifTool:
apt-get install libimage-exiftool-perl
2. Remove Metadata:
exiftool -all= image.jpg
This command strips all metadata from image.jpg.
3. Verify Removal:
exiftool image.jpg
After running this command, the output should show no metadata.
4. If you have multiple files, you can remove metadata from all images using the following command.
exiftool -all= *.jpg
This command removes metadata from all .jpg files in the directory.
Removing Metadata from Document Files
Documents, especially PDFs, can also contain metadata. Here’s how to clean them up.
For PDFs, qpdf is a great tool to remove metadata.
1. Install qpdf:
apt-get install qpdf
2. Remove Metadata:
qpdf --linearize input.pdf output.pdf
This command rewrites the PDF without the metadata.
3. Verify Removal:
pdfinfo output.pdf
The output should show minimal or no metadata.
Automating Metadata Removal with Scripts
To make things easier, you can automate the process with a simple Bash script.
Here’s a basic script to remove metadata from all .jpg and .pdf files in a directory:
#!/bin/bash
for file in *.jpg *.pdf; do
if [[ $file == *.jpg ]]; then
exiftool -all= "$file"
elif [[ $file == *.pdf ]]; then
qpdf --linearize "$file" "${file%.pdf}_clean.pdf"
fi
done
This script checks the file type and removes the metadata accordingly.
Conclusion
Removing metadata from your files is a crucial step in protecting your privacy. Whether you’re sharing photos, documents, or any other files, make sure to strip out the metadata first. Now, you can easily remove metadata from your files in Linux. Remember to always verify that the metadata has been removed to ensure your privacy is protected. You can follow this guide to remove metadata of any file on dedicated server hosting from Atlantic.Net!
### How to Create a Database in MongoDB
MongoDB is a popular NoSQL database known for its flexibility, scalability, and ease of use. Unlike traditional relational databases, MongoDB stores data in a schema-less format, using documents in a JSON-like structure called BSON (Binary JSON). This allows for rapid development and iteration, making it an ideal choice for modern applications that require agility and scalability.
In this tutorial, we will explore how to create a database in MongoDB.
Step 1 - Verify the MongoDB Installation
Before starting, it is essential to check whether MongoDB is installed on your system. You can check it using the following command.
mongo --version
You should see the information for the MongoDB version.
MongoDB shell version v4.4.29
Build Info: {
"version": "4.4.29",
"gitVersion": "f4dda329a99811c707eb06d05ad023599f9be263",
"openSSLVersion": "OpenSSL 1.1.0g 2 Nov 2017",
"modules": [],
"allocator": "tcmalloc",
"environment": {
"distmod": "ubuntu2004",
"distarch": "x86_64",
"target_arch": "x86_64"
}
}
Note: If you get an error, it means MongoDB isn't installed or isn't in your system's PATH.
Step 2 - Connecting to MongoDB
After verifying the MongoDB installation, you can connect using the Mongo shell. Open your terminal or command prompt and type:
mongo
This command connects you to the MongoDB server and opens an interactive Mongo shell. You should see a prompt that looks like this:
>
Step 3 - Creating a Database
In MongoDB, you don't need to create a database explicitly. Instead, you can switch to a non-existent database, and MongoDB will create it for you when you insert the first document. Let's create a database named mydatabase.
use mydatabase
Output.
switched to db mydatabase
Initially, the database will not be visible in the list of databases because it doesn't contain any data. To see the list of databases, use the command:
show dbs
Output:
admin 0.000GB
config 0.000GB
local 0.000GB
Let's insert a sample document into a collection called mycollection within the mydatabase:
db.mycollection.insertOne({ name: "John Doe", age: 30, profession: "Developer" })
Output:
{
"acknowledged" : true,
"insertedId" : ObjectId("60c5dbd4f5d1dc8f459f2a27")
}
Now, if you run the show dbs command again, you'll see mydatabase listed:
show dbs
Output:
admin 0.000GB
config 0.000GB
local 0.000GB
mydatabase 0.000GB
Step 4 - Basic Database Operations
You can create collections within a database to store your data. To create a new collection, use the createCollection method:
db.createCollection("mynewcollection")
Output:
{ "ok" : 1 }
To see all the collections in your current database, use the show collections command:
show collections
Output:
mycollection
mynewcollection
You can insert documents into a collection using the insertOne or insertMany methods:
db.mynewcollection.insertOne({ title: "MongoDB Guide", author: "Jane Doe" })
Output:
{
"acknowledged" : true,
"insertedId" : ObjectId("60c5dbf2f5d1dc8f459f2a28")
}
To retrieve documents from a collection, use the find method:
db.mynewcollection.find()
Output:
{ "_id" : ObjectId("60c5dbf2f5d1dc8f459f2a28"), "title" : "MongoDB Guide", "author" : "Jane Doe" }
To update documents, use the updateOne or updateMany methods. Let's update the document we just inserted:
db.mynewcollection.updateOne({ title: "MongoDB Guide" }, { $set: { author: "John Smith" } })
Output:
{ "acknowledged" : true, "matchedCount" : 1, "modifiedCount" : 1 }
To delete documents, use the deleteOne or deleteMany methods. Let's delete the document we just updated:
db.mynewcollection.deleteOne({ title: "MongoDB Guide" })
Output.
{ "acknowledged" : true, "deletedCount" : 1 }
Conclusion
In this article, we have covered the essential steps to create and manage a database in MongoDB. We started with connecting to the MongoDB server, and created a new database by simply switching to it. We then explored basic database operations such as creating collections, inserting, querying, updating, and deleting documents. You can now easily create a MongoDB database on dedicated server hosting from Atlantic.Net!
### How to Install MongoDB on Ubuntu 22.04
MongoDB, a powerful and versatile NoSQL database, is widely used for its ability to handle large volumes of diverse data types with ease. Whether you are developing a web application, managing big data, or leveraging real-time analytics, MongoDB offers the flexibility and scalability required for modern data-driven applications. However, to fully utilize MongoDB's capabilities, it is crucial to install it correctly and ensure that it is securely configured.
This guide will walk you through the process of installing and securing MongoDB on Ubuntu 22.04.
Step 1 - Update System Packages
First, update your system packages to ensure you have the latest updates and security patches.
apt update && apt upgrade -y
This command will update the package list and upgrade all the installed packages to their latest versions.
Next, you will also need to install libssl to your server. You can download and install it using the following commands:
wget http://archive.ubuntu.com/ubuntu/pool/main/o/openssl/libssl1.1_1.1.0g-2ubuntu4_amd64.deb
dpkg -i libssl1.1_1.1.0g-2ubuntu4_amd64.deb
Step 2 - Import the MongoDB GPG Key
MongoDB provides a GPG key to ensure the integrity of the packages. Import this key using the following command:
curl -fsSL https://www.mongodb.org/static/pgp/server-4.4.asc | gpg -o /usr/share/keyrings/mongodb-server-4.4.gpg --dearmor
You should see an output saying OK, indicating the key has been successfully added.
Step 3 - Add MongoDB Repository
Next, add the MongoDB repository to your system’s sources list.
echo "deb [ arch=amd64,arm64 signed-by=/usr/share/keyrings/mongodb-server-4.4.gpg ] https://repo.mongodb.org/apt/ubuntu focal/mongodb-org/4.4 multiverse" | tee /etc/apt/sources.list.d/mongodb-org-4.0.list
This command will add the MongoDB repository to your sources list, making MongoDB packages available for installation.
Step 4 - Install MongoDB
Now, install MongoDB using the following command:
apt update
apt install mongodb-org
This will install the latest version of MongoDB along with all necessary dependencies.
Now, verify the MongoDB installation using the following command:
mongo --version
Output:
MongoDB shell version v4.4.29
Build Info: {
"version": "4.4.29",
"gitVersion": "f4dda329a99811c707eb06d05ad023599f9be263",
"openSSLVersion": "OpenSSL 1.1.0g 2 Nov 2017",
"modules": [],
"allocator": "tcmalloc",
"environment": {
"distmod": "ubuntu2004",
"distarch": "x86_64",
"target_arch": "x86_64"
}
}
Step 5 - Start and Enable MongoDB Service
After the installation, start the MongoDB service and enable it to start on boot.
systemctl start mongod
systemctl enable mongod
To verify that MongoDB is running, use the command:
systemctl status mongod
You should see output indicating that the MongoDB service is active and running.
● mongod.service - MongoDB Database Server
Loaded: loaded (/lib/systemd/system/mongod.service; disabled; vendor preset: enabled)
Active: active (running) since Mon 2024-07-15 11:33:18 UTC; 5s ago
Docs: https://docs.mongodb.org/manual
Main PID: 7581 (mongod)
Memory: 64.7M
CPU: 788ms
CGroup: /system.slice/mongod.service
└─7581 /usr/bin/mongod --config /etc/mongod.conf
Step 6 - Secure MongoDB
By default, MongoDB does not enforce authentication. To secure your database, you need to enable authentication.
Open the MongoDB configuration file:
nano /etc/mongod.conf
Find the security section and add the following lines:
security:
authorization: "enabled"
Save and close the file, then restart MongoDB:
systemctl restart mongod
Access the MongoDB shell:
mongo
Switch to the admin database:
use admin
Create the administrative user:
db.createUser({
user: "admin",
pwd: "strongpassword",
roles: [{ role: "userAdminAnyDatabase", db: "admin" }]
})
Replace "strongpassword" with a strong password of your choice. After creating the user, exit the MongoDB shell:
exit
Step 7 - Verify MongoDB Connectivity
After configuring SSL/TLS for MongoDB, it's important to verify that the authentication is working as expected. We will do this by connecting to the MongoDB instance using the mongosh shell.
If you haven't already installed the MongoDB shell, you can do so with the following command:
apt install mongodb-mongosh
Use the mongosh shell to connect to your MongoDB instance with authentication.
mongosh --host localhost --port 27017 -u admin -p --authenticationDatabase admin
Replace your_mongodb_server_ip with the IP address of your MongoDB server. You will be prompted to enter the password for the admin user. If the connection is successful, you should see the MongoDB shell prompt:
Enter password: **************
Current Mongosh Log ID: 6695102f9cd95f2e6b482f8a
Connecting to: mongodb://@localhost:27017/?directConnection=true&serverSelectionTimeoutMS=2000&authSource=admin&appName=mongosh+2.2.12
Using MongoDB: 4.4.29
Using Mongosh: 2.2.12
For mongosh info see: https://docs.mongodb.com/mongodb-shell/
To help improve our products, anonymous usage data is collected and sent to MongoDB periodically (https://www.mongodb.com/legal/privacy-policy).
You can opt-out by running the disableTelemetry() command.
Warning: Found ~/.mongorc.js, but not ~/.mongoshrc.js. ~/.mongorc.js will not be loaded.
You may want to copy or rename ~/.mongorc.js to ~/.mongoshrc.js.
test>
Conclusion
In this article, we covered the installation and security setup for MongoDB on Ubuntu 22.04. You learned how to install MongoDB, enable authentication, create an administrative user, and verify the secure connection. By following these steps, you have ensured that your MongoDB instance is both operational and secure. You can deploy the MongoDB database server on dedicated server hosting from Atlantic.Net!
### How to Create and Manage Docker Volumes with Practical Example
Docker volumes are a crucial feature for managing data in containerized applications. They provide a way to persist data generated by Docker containers, ensuring that data remains intact even after the container is deleted.
In this guide, we will explore how to create and manage Docker volumes with practical examples.
Types of Docker Volumes
Named Volumes: Named volumes are explicitly created and can be referenced by a specific name. They are useful when you want to share data between multiple containers or need to persist data beyond the lifecycle of a single container.
Anonymous Volumes: Anonymous volumes are created implicitly when a container is started and a volume is not specified. They are used when data persistence is needed, but the specific volume name is not important.
Host Volumes: Host volumes are created by mounting a directory from the host system into the container. This allows for direct access to host files and directories from within the container.
Creating a Named Volume
To create a named volume, use the docker volume create command:
docker volume create my_named_volume
This command creates a volume named my_named_volume. You can verify its creation by listing all volumes:
docker volume ls
Output:
DRIVER VOLUME NAME
local my_named_volume
Creating an Anonymous Volume
Anonymous volumes are automatically created when a container is started with a mount point, but no specific volume name is provided:
docker run -d --name my_container -v /data busybox
In this example, an anonymous volume is created and mounted to /data in the container.
Mounting a Named Volume
You can mount a named volume into a container using the -v flag:
docker run -d --name my_new_container -v my_named_volume:/app busybox
Here, the named volume my_named_volume is mounted to /app in the container.
Mounting a Host Volume
To mount a host directory as a volume, use the following syntax:
docker run -d --name my_host_container -v /mnt:/app busybox
This command mounts the host directory /mnt to /app in the container.
Inspecting Docker Volumes
To inspect the details of a Docker volume, use the docker volume inspect command:
docker volume inspect my_named_volume
This command provides information about the volume, including its mount point and usage details.
[
{
"CreatedAt": "2024-07-25T09:41:19Z",
"Driver": "local",
"Labels": null,
"Mountpoint": "/var/lib/docker/volumes/my_named_volume/_data",
"Name": "my_named_volume",
"Options": null,
"Scope": "local"
}
]
Removing Docker Volumes
Docker volumes can be removed using the docker volume rm command. Be cautious, as this action deletes the data stored in the volume.
To remove a named volume:
docker volume rm my_named_volume
To remove all volumes not currently in use by containers, use:
docker volume prune
Output.
WARNING! This will remove anonymous local volumes not used by at least one container.
Are you sure you want to continue? [y/N] y
Total reclaimed space: 0B
Conclusion
Docker volumes are a powerful tool for managing data in containerized environments. By understanding how to create and manage volumes, you can ensure data persistence, share data between containers, and manage application state effectively. Try to create and manage Docker volumes on VPS hosting from Atlantic.Net!
### How To Remove Docker Images, Containers and Volumes
Docker is a powerful platform that enables developers to automate the deployment of applications inside lightweight, portable containers. Over time, as you build, run, and test applications, you may accumulate many Docker images and containers. These can consume significant disk space and clutter your environment, making it harder to manage and maintain your system. Knowing how to efficiently remove Docker images and containers is essential for keeping your Docker environment clean and optimized.
In this guide, we will explore the steps to remove Docker images and containers.
Removing Docker Containers
1. List Containers.
To list all containers, both running and stopped, use the following command:
docker ps -a
This will display a list of all containers with their status.
CONTAINER ID IMAGE COMMAND CREATED STATUS PORTS NAMES
7d8db99f64e9 nginx "/docker-entrypoint.…" 6 seconds ago Up 5 seconds 80/tcp elated_diffie
a7dfbcd76554 busybox "sh" 2 minutes ago Exited (0) 2 minutes ago my_container
2. Stop a Running Container.
Before removing a running container, you need to stop it. Use the following command:
docker stop
Replace with the ID or name of the container.
docker stop 7d8db99f64e9
This will stop the Nginx container.
3. Remove a Container.
To remove a container, use the following command:
docker rm
Replace with the ID or name of the container.
docker rm 7d8db99f64e9
This will remove the Nginx container.
You can remove multiple containers at once by specifying multiple container IDs separated by a space.
4. Force Remove a Running Container.
You can also forcefully stop and remove a running container with:
docker rm -f
5. Remove All Stopped Containers.
To remove all stopped containers, use:
docker container prune
You will be prompted to confirm the action.
Removing Docker Images
1. List Docker Images.
To list all Docker images, use:
docker images
Output:
REPOSITORY TAG IMAGE ID CREATED SIZE
nginx latest a72860cb95fd 4 weeks ago 188MB
ubuntu latest 35a88802559d 6 weeks ago 78.1MB
busybox latest 65ad0d468eb1 14 months ago 4.26MB
2. Remove a Specific Image.
To remove a specific image, use:
docker rmi
Replace with the ID of the image you want to remove.
docker rmi a72860cb95fd
This will remove the Nginx image.
3. Remove Multiple Images.
You can remove multiple images by specifying multiple image IDs.
docker rmi
4. Force Remove an Image.
If an image is associated with a container, you can forcefully remove it with:
docker rmi -f
5. Remove Dangling Images.
Dangling images are layers not associated with any tagged images. To remove them, use:
docker image prune
6. Remove All Unused Images.
To remove all images not associated with a container, use:
docker image prune -a
Cleaning Up Volumes and Networks
1. Remove Unused Volumes.
Volumes can also consume disk space. To remove unused volumes, use:
docker volume prune
2. Remove Unused Networks.
To remove unused networks, use:
docker network prune
Conclusion
Managing Docker containers and images is essential for maintaining a clean and efficient Docker environment. By regularly removing unused containers, images, volumes, and networks, you can free up valuable disk space and improve the performance of your Docker system. The commands provided in this guide give you the tools needed to list, stop, and remove containers and images effectively. You can now easily remove Docker images and containers from VPS hosting from Atlantic.Net!
### How to Deploy Laravel with Docker and Docker Compose
Deploying applications with Docker has revolutionized the way developers build, ship, and run software. Laravel, a popular PHP framework known for its elegant syntax and powerful features, pairs exceptionally well with Docker to create a consistent and scalable development and production environment. By leveraging Docker and Docker Compose, you can streamline the deployment process, ensuring that your Laravel application runs smoothly across different environments.
In this guide, we will walk you through the process of deploying a Laravel application using Docker and Docker Compose.
Prerequisites
A server running Ubuntu with Docker and Docker Compose installed.
A root user or a user with sudo privileges.
Step 1 - Set Up Your Laravel Project
Install PHP and other required packages.
apt install composer php php-cli php-xml php-curl php-intl -y
Stop the Apache service.
systemctl stop apache2
If you don't have a Laravel project yet, you can create one using Composer:
composer create-project --prefer-dist laravel/laravel laravel-docker
Navigate to the project directory
cd laravel-docker
Step 2 - Create a Dockerfile
Create a Dockerfile in the root of your Laravel project. This file defines the image configuration for your Laravel application.
nano Dockerfile
Add the following lines:
# Use the official PHP image as a base image
FROM php:8.1-fpm
# Set working directory
WORKDIR /var/www
# Install system dependencies
RUN apt-get update && apt-get install -y \
build-essential \
libpng-dev \
libjpeg-dev \
libfreetype6-dev \
locales \
zip \
jpegoptim optipng pngquant gifsicle \
vim \
unzip \
git \
curl \
libzip-dev \
libpq-dev \
libonig-dev \
&& docker-php-ext-configure gd --with-freetype --with-jpeg \
&& docker-php-ext-install -j$(nproc) gd
# Install PHP extensions
RUN docker-php-ext-install pdo pdo_mysql pdo_pgsql mbstring zip exif pcntl
# Clear cache
RUN apt-get clean && rm -rf /var/lib/apt/lists/*
# Install Composer
COPY --from=composer:latest /usr/bin/composer /usr/bin/composer
# Copy the existing application directory contents to the working directory
COPY . /var/www
# Copy the existing application directory permissions to the working directory
COPY --chown=www-data:www-data . /var/www
# Change current user to www
USER www-data
# Expose port 9000 and start php-fpm server
EXPOSE 9000
CMD ["php-fpm"]
Save and close the file.
Step 3 - Create a Docker Compose File
Create a docker-compose.yml file in the root of your project. This file defines the services (containers) to be run.
nano docker-compose.yml
Add the following configuration:
version: '3.8'
services:
app:
build:
context: .
dockerfile: Dockerfile
image: laravel-app
container_name: laravel-app
restart: unless-stopped
tty: true
environment:
SERVICE_NAME: app
SERVICE_TAGS: dev
working_dir: /var/www
volumes:
- .:/var/www
- ./docker-compose/php/local.ini:/usr/local/etc/php/conf.d/local.ini
networks:
- app-network
webserver:
image: nginx:alpine
container_name: nginx-webserver
restart: unless-stopped
ports:
- "8080:80"
volumes:
- .:/var/www
- ./docker-compose/nginx:/etc/nginx/conf.d/
networks:
- app-network
db:
image: mysql:5.7
container_name: mysql
restart: unless-stopped
environment:
MYSQL_DATABASE: laravel
MYSQL_ROOT_PASSWORD: root
MYSQL_PASSWORD: root
MYSQL_USER: root
ports:
- "3306:3306"
volumes:
- dbdata:/var/lib/mysql
networks:
- app-network
networks:
app-network:
driver: bridge
volumes:
dbdata:
driver: local
Save and close the file.
Step 4 - Configure Nginx
Create a directory named docker-compose/nginx and add a configuration file named default.conf inside it.
mkdir -p docker-compose/nginx
nano docker-compose/nginx/default.conf
Add the following configuration.
server {
listen 80;
index index.php index.html;
server_name localhost;
root /var/www/public;
location / {
try_files $uri $uri/ /index.php?$query_string;
}
location ~ \.php$ {
fastcgi_pass app:9000;
fastcgi_index index.php;
fastcgi_param SCRIPT_FILENAME $realpath_root$fastcgi_script_name;
include fastcgi_params;
}
location ~ /\.ht {
deny all;
}
}
Save the file.
Step 5 - Environment Variables
Ensure you have a .env file set up in your Laravel project with appropriate configurations. For instance, set the database host to db (the name of the MySQL service in docker-compose.yml):
nano .env
Modify the following content:
DB_CONNECTION=mysql
DB_HOST=db
DB_PORT=3306
DB_DATABASE=laravel
DB_USERNAME=laravel
DB_PASSWORD=root
Step 6 - Build and Run the Containers
Build and start the Docker containers using Docker Compose:
docker-compose up -d
This command will build the Docker images defined in the Dockerfile and docker-compose.yml, and then start the containers in detached mode.
Verify the running containers.
docker-compose ps
Output.
Name Command State Ports
----------------------------------------------------------------------------------------------------
laravel-app docker-php-entrypoint php-fpm Up 9000/tcp
mysql docker-entrypoint.sh mysqld Restarting
nginx-webserver /docker-entrypoint.sh ngin ... Up 0.0.0.0:8080->80/tcp,:::8080->80/tcp
Step 7 - Access the Application
Your Laravel application should now be accessible at http://your-server-ip:8080.
Step 8 - Stop the Containers
To stop the Docker containers, you can use:
docker-compose down
This will stop and remove the containers but preserve the data stored in the volumes.
Conclusion
You've now set up a Laravel application with Docker and Docker Compose. This setup helps isolate the application and its dependencies, making it easier to manage and deploy. You can customize the configuration files further to suit your needs, such as adding more services, adjusting the Nginx configuration, or modifying the PHP environment settings. Try deploying a Laravel app with Docker on dedicated server hosting from Atlantic.Net!
### Dockerizing a Java Application
In modern software development, containerization has become a crucial practice for packaging and deploying applications. Docker, a leading containerization platform, allows developers to create isolated environments to run applications consistently across different systems. Java, a widely-used programming language, can greatly benefit from Docker's capabilities by packaging Java applications into containers, simplifying deployment and scaling.
This guide walks you through the process of creating a JAR file for your Java application and then Dockerizing it.
Prerequisites
A server running Ubuntu with Docker installed.
A root user or a user with sudo privileges.
Step 1 - Create a JAR File
To package a Java application into a JAR file, you need to follow these steps:
1. Create your Java application. For example, let's say you have a simple application with a main class HelloDocker.java:
nano HelloDocker.java
Add the following code.
package com.example;
public class HelloDocker {
public static void main(String[] args) {
System.out.println("Hello, Docker!");
}
}
2. Create a manifest file to specify the main class of the application.
nano MANIFEST.MF
Add the following lines:
Manifest-Version: 1.0
Main-Class: com.example.HelloDocker
3. Compile your Java application using the javac command. This will generate .class files in the out directory.
javac -d out HelloDocker.java
4. Use the jar command to package the compiled classes into a JAR file. For example, to create a JAR file named app.jar:
jar cfm app.jar MANIFEST.MF -C out/ .
This command creates a JAR file app.jar containing all the classes in the out directory.
Step 2 - Dockerizing the Java Application
To Dockerize the Java application, you'll need to create a Dockerfile, build a Docker image, and run a container.
1. Create a Dockerfile in the same directory as your JAR file. This file defines the environment and the commands to run your Java application in a Docker container.
nano Dockerfile
Add the following configuration.
# Use a base image with Java installed
FROM openjdk:11-jre-slim
# Set the working directory
WORKDIR /app
# Copy the JAR file into the container
COPY app.jar app.jar
# Command to run the application
ENTRYPOINT ["java", "-jar", "app.jar"]
2. Build the Docker image using the docker build command. Run this command in the directory containing your Dockerfile:
docker build -t my-java-app .
This command builds a Docker image named my-java-app. You can verify it using the following command.
docker images
Output.
REPOSITORY TAG IMAGE ID CREATED SIZE
my-java-app latest e4d514a07674 14 seconds ago 223MB
openjdk 11-jre-slim 764a04af3eff 24 months ago 223MB
3. Run the Docker container using the docker run command:
docker run -d --name my-running-app -p 8080:8080 my-java-app
To view the logs generated by your Java application, you can use the docker logs command.
docker logs -f my-running-app
You can see the "Hello, Docker!" message.
Hello, Docker!
Conclusion
Dockerizing a Java application provides a streamlined and efficient way to deploy and manage software in various environments. By encapsulating the application, its dependencies, and runtime configurations into a Docker container, you achieve a consistent and portable deployment process. Try to create your own Java application with Docker on dedicated server hosting from Atlantic.Net!
### Docker Run Command with Examples
The Docker platform enables developers to build, deploy, and manage containerized applications. The docker run command is used to create and start a new container from a Docker image. It combines several functions in one command, such as creating a writable container layer over the specified image, configuring the container, and executing a specified command.
In this guide, we'll explore the docker run command in-depth, covering its options and providing practical examples to help you get started.
Prerequisites
A server running Ubuntu with Docker installed.
A root user or a user with sudo privileges.
Basic Syntax
The basic syntax of the docker run command is:
docker run [OPTIONS] IMAGE [COMMAND] [ARG...]
Explanation:
OPTIONS: Various flags to modify the behavior of the container.
IMAGE: The name of the Docker image you want to use.
COMMAND: The command to run inside the container (optional).
ARG...: Arguments to the command (optional).
1. Running a Container Interactively
To run a container interactively, you can use the -it options. The -i flag keeps the container's STDIN open, and the -t flag allocates a pseudo-TTY. This is useful for debugging or running shell sessions.
docker run -it ubuntu /bin/bash
This command starts an interactive bash shell in an Ubuntu container.
2. Running a Container in the Background
To run a container in the background (detached mode), use the -d option. This is useful for running services or applications.
docker run -d nginx
This command starts an Nginx web server container in the background. You can verify it using the following command:
docker ps
Output:
CONTAINER ID IMAGE COMMAND CREATED STATUS PORTS NAMES
c187638e79a3 nginx "/docker-entrypoint.…" 10 seconds ago Up 9 seconds 80/tcp priceless_bardeen
3. Exposing Ports
To access the services running inside a container, you can expose ports using the -p option.
docker run -d -p 8080:80 nginx
This command maps port 80 inside the container to port 8080 on the host machine.
4. Mounting Volumes
Volumes allow you to persist data outside the container's filesystem. You can use the -v option to mount a volume.
docker run -d -v /mnt:/opt nginx
This command mounts the /mnt directory on the host to the /opt directory inside the container.
5. Setting Environment Variables
You can set environment variables inside a container using the -e option.
docker run -d -e "ENV_VAR=value" nginx
This command sets the ENV_VAR environment variable to a value inside the container.
6. Naming a Container
By default, Docker assigns a random name to each container. You can specify a custom name using the --name option.
docker run -d --name my-nginx nginx
This command starts an Nginx container with the name my-nginx.
7. Removing Containers Automatically
To automatically remove a container when it exits, you can use the --rm option.
docker run --rm ubuntu /bin/echo "Hello, world!"
This command removes the container after it prints "Hello, world!" and exits.
8. Passing Commands to Containers
You can pass commands to a container at runtime. This is useful for running scripts or commands inside the container.
docker run ubuntu /bin/echo "Hello, Docker!"
This command runs the echo command inside an Ubuntu container.
9. Limiting Resource Usage
To limit the CPU and memory usage of a container, you can use the --cpus and --memory options.
docker run -d --cpus="1.0" --memory="512m" nginx
This command limits the container to use at most one CPU core and 512 MB of memory.
Conclusion
The docker run command is versatile and essential for managing Docker containers. Understanding its various options and flags is crucial for effectively deploying and managing containers. The examples provided here are just a starting point; the command can be customized further based on specific needs and use cases. You can now manage and run a Docker container on VPS hosting from Atlantic.Net!
### How to Create a Docker Container
Docker containers are lightweight, portable, and self-sufficient units that include everything needed to run a piece of software, including code, runtime, system tools, libraries, and settings. Containers are based on images, which are read-only templates specifying how the container should behave.
In this tutorial, we will show you how to create a Docker container.
Prerequisites
A server running Ubuntu with Docker installed.
A root user or a user with sudo privileges.
Step 1 - Pulling a Docker Image
To create a Docker container, start with a Docker image. You can either pull an existing image from Docker Hub or create your own. Let's start by pulling an image.
Let's pull the Ubuntu image.
docker pull ubuntu
This will download the Ubuntu image from the Docker Hub registry.
Step 2 - Running a Docker Container
Next, create and start a container from the pulled image.
docker run -it --name my_ubuntu_container ubuntu
This command creates a container named my_ubuntu_container from the Ubuntu image and opens an interactive shell.
root@68cf357568f9:/#
Explanation:
-it: Interactive terminal.
--name: Name of the container.
ubuntu: The Docker image to use.
Step 3 - Interacting with a Docker Container
Once inside the container, you can interact with it as you would with any other terminal. For example:
apt update -y
This will update the package index in the Ubuntu container.
To exit from the container, run:
exit
Step 4 - Managing Docker Containers
List all running containers:
docker ps
List all containers including both start and stopped containers.
docker ps -a
Stop a running container.
docker stop my_ubuntu_container
Remove a stopped container.
docker rm my_ubuntu_container
Conclusion
Creating Docker containers is straightforward and highly beneficial for consistent application deployment. By following this guide, you now have the skills to create, manage, and customize Docker containers. Explore more by experimenting with different images and building your own to suit specific needs. Try to create a Docker container on dedicated server hosting from Atlantic.Net!
### How to Create a PostgreSQL Docker Container
Docker containers provide a convenient way to manage and deploy applications. PostgreSQL, a powerful open-source relational database system, can be run in a Docker container for easy development, testing, and deployment. This guide will show you how to set up and run a PostgreSQL Docker container.
In this guide, we'll walk through the steps to create a PostgreSQL Docker container.
Prerequisites
Before we begin, ensure you have the following:
Docker installed on your machine.
Basic knowledge of Docker commands and PostgreSQL.
Step 1 - Pulling the PostgreSQL Docker Image
First, let's pull the official PostgreSQL Docker image from Docker Hub. Open your terminal and run the following command:
docker pull postgres
This command will download the latest PostgreSQL image. If you need a specific version, you can specify it like this:
docker pull postgres:
For example, to pull PostgreSQL 13, you would run:
docker pull postgres:13
Step 2 - Running a PostgreSQL Container
Now that we have the PostgreSQL image, let's run a container. We'll run the container with some basic configurations such as setting the PostgreSQL password and mapping a port.
docker run --name my_postgres -e POSTGRES_PASSWORD=mysecretpassword -d -p 5432:5432 postgres
Explanation:
--name my_postgres: Names the container my_postgres.
-e POSTGRES_PASSWORD=mysecretpassword: Sets the PostgreSQL password to mysecretpassword.
-d: Runs the container in detached mode.
-p 5432:5432: Maps port 5432 of the host to port 5432 of the container.
postgres: Uses the postgres image.
To verify that the container is running, use:
docker ps
Output:
CONTAINER ID IMAGE COMMAND CREATED STATUS PORTS NAMES
f690208d6e8a postgres "docker-entrypoint.s…" 6 seconds ago Up 6 seconds 0.0.0.0:5432->5432/tcp, :::5432->5432/tcp my_postgres
Step 3 - Connecting to the PostgreSQL Container
You can connect to the PostgreSQL database using the psql command-line tool or any PostgreSQL client like pgAdmin. For this example, we'll use psql.
First, enter the running container:
docker exec -it my_postgres bash
Once inside the container, connect to PostgreSQL using:
psql -U postgres
Once connected, you will see the following output:
psql (16.3 (Debian 16.3-1.pgdg120+1))
Type "help" for help.
postgres=#
To exit from the Postgres shell, run:
exit
To exit from the container, run:
exit
Step 4 - Managing the PostgreSQL Container
To stop the PostgreSQL container, run:
docker stop my_postgres
To start the PostgreSQL container again, run:
docker start my_postgres
To remove the container, first stop it (if it's running), and then remove it:
docker rm my_postgres
Step 4 - Data Persistence
By default, data inside a Docker container is ephemeral, meaning it will be lost when the container is removed. To persist data, you can use Docker volumes.
Create a volume:
docker volume create pgdata
Run the PostgreSQL container with the volume:
docker run --name mynew_postgres -e POSTGRES_PASSWORD=mysecretpassword -d -p 5432:5432 -v pgdata:/var/lib/postgresql/data postgres
The -v pgdata:/var/lib/postgresql/data option mounts the volume to the PostgreSQL data directory.
Conclusion
In this guide, we've covered how to create and manage a PostgreSQL Docker container. We've walked through pulling the PostgreSQL image, running a container, connecting to it, and ensuring data persistence. Using Docker for PostgreSQL provides a flexible and efficient way to manage your databases, especially in development and testing environments. Let's create a PostgreSQL docker container on dedicated server hosting from Atlantic.Net!
### How To Run MongoDB as a Docker Container
Docker is a popular containerization tool that simplifies managing applications and their dependencies. MongoDB is a widely used NoSQL database known for its flexibility and scalability. Combining Docker and MongoDB allows developers to set up and manage MongoDB instances in isolated environments quickly.
This guide will walk you through creating a MongoDB Docker container, covering everything from pulling the MongoDB image to running the container and connecting to it. We'll also provide practical examples to help you understand each step.
Prerequisites
Before we begin, ensure you have the following installed on your system:
Docker is installed and running on your server
Basic knowledge of Docker commands
Step 1 - Pulling the MongoDB Docker Image
The first step is to pull the official MongoDB image from Docker Hub. Open your terminal and run the following command:
docker pull mongo:4.4
This command downloads the latest MongoDB image. You can verify the MongoDB docker image using the following command.
docker images
Output:
REPOSITORY TAG IMAGE ID CREATED SIZE
mongo 4.4 d896c071ac69 4 months ago 427MB
Step 2 - Running a MongoDB Container
Once the image is downloaded, you can create and run a MongoDB container. Use the following command:
docker run --name mongodb -d mongo:4.4
Here's a breakdown of the command:
docker run: Command to create and start a container.
--name mongodb: Names the container "MongoDB".
-d: Runs the container in detached mode.
mongo:4.4: Specifies the image to use.
You can verify that the container is running by using:
docker ps
Output:
CONTAINER ID IMAGE COMMAND CREATED STATUS PORTS NAMES
3dc272f119f5 mongo:4.4 "docker-entrypoint.s…" 3 seconds ago Up 2 seconds 27017/tcp mongodb
Step 3 - Connecting to the MongoDB Container
You need to use a MongoDB client to connect to the MongoDB instance running in your Docker container. The MongoDB CLI client is included in the container, so you can connect using the following command:
docker exec -it mongodb /bin/bash
This command opens an interactive MongoDB shell inside the running container.
root@3dc272f119f5:/#
Run the following command to exit from the Mongodb container.
exit
Step 4 - Persisting Data with Volumes
By default, data stored in a Docker container is ephemeral. To persist data, you need to use Docker volumes. Create a directory on your host machine to store MongoDB data, then run the container with a volume:
mkdir -p ~/mongo-data
docker run --name mongodb-volume -v ~/mongo-data:/data/db -d mongo:4.4
This command mounts the host directory ~/mongo-data to the container's /data/db directory, ensuring data persistence.
Step 5 - Configuring MongoDB with Environment Variables
You can configure MongoDB using environment variables. For example, to set a root username and password, use the following command:
docker run --name mongodb-env -e MONGO_INITDB_ROOT_USERNAME=admin -e MONGO_INITDB_ROOT_PASSWORD=secret -d mongo:4.4
This command sets the root username to admin and the password to secret.
Step 6 - Managing MongoDB Containers
You can start, stop, and remove MongoDB containers using Docker commands:
Stop the container:
docker stop mongodb
Start the container:
docker start mongodb
Remove the container:
docker rm mongodb
Step 7 - Practical Example
Let's go through a practical example where we create a MongoDB container with data persistence and authentication. Before getting started, all existing MongoDB containers must be deleted.
1. Create a directory for MongoDB data and give proper permissions:
mkdir -p ~/mongodb-data
chmod -R 777 ~/mongodb-data
2. Run the MongoDB container with volume and authentication:
docker run --name mongodb-data -v ~/mongodb-data:/data/db -e MONGO_INITDB_ROOT_USERNAME=admin -e MONGO_INITDB_ROOT_PASSWORD=secret -d mongo:4.4
3. Connect to the MongoDB container:
docker exec -it mongodb-data mongo -u admin -p secret --authenticationDatabase admin
This command connects to the MongoDB instance using the specified username and password.
MongoDB shell version v4.4.29
connecting to: mongodb://127.0.0.1:27017/?authSource=admin&compressors=disabled&gssapiServiceName=mongodb
Implicit session: session { "id" : UUID("b59b44c8-a977-4770-9b1e-0abfd0ce5c16") }
MongoDB server version: 4.4.29
Welcome to the MongoDB shell.
For interactive help, type "help".
For more comprehensive documentation, see
https://docs.mongodb.com/
Questions? Try the MongoDB Developer Community Forums
https://community.mongodb.com
---
The server generated these startup warnings when booting:
2024-07-15T15:26:54.439+00:00: Using the XFS filesystem is strongly recommended with the WiredTiger storage engine. See http://dochub.mongodb.org/core/prodnotes-filesystem
---
>
4. Create a new database and collection:
use mydatabase
db.createCollection("mycollection")
5. Insert a document:
db.mycollection.insert({ name: "example", type: "demo" })
6. Exit from the container:
exit
7. Stop and remove the container:
docker stop mongodb-data
docker rm mongodb-data
8. Run the container again:
docker run --name mongodb-data -v ~/mongodb-data:/data/db -e MONGO_INITDB_ROOT_USERNAME=admin -e MONGO_INITDB_ROOT_PASSWORD=secret -d mongo:4.4
9. Connect and verify the data:
docker exec -it mongodb-data mongo -u admin -p secret --authenticationDatabase admin
use mydatabase
db.mycollection.find()
You should see the document you inserted earlier, confirming that data persistence is working.
> db.mycollection.find()
{ "_id" : ObjectId("6695471d6ae167ad03dcadfd"), "name" : "example", "type" : "demo" }
Conclusion
Creating a MongoDB Docker container is a straightforward process that provides a flexible and isolated environment for your database. By following this guide, you can set up a MongoDB container with data persistence and authentication, ensuring your data is secure and persistent across container restarts. You can now create a MongoDB docker container on dedicated server hosting from Atlantic.Net!
### How to Create a Table/Collections in MongoDB
Before diving into creating tables, it's essential to understand what a collection is in MongoDB. A collection is a group of MongoDB documents, similar to a table in a relational database. Documents within a collection can have different fields, but typically, they share a similar purpose or structure. Collections do not enforce a schema, meaning each document can contain different fields and data types.
In this tutorial, we'll learn how to create a table in MongoDB.
Step 1 - Connecting to MongoDB
First, we need to connect to the MongoDB server. Open your terminal or command prompt and start the MongoDB shell by typing:
mongo
You should see an output indicating that you are connected to the MongoDB server.
>
Step 2 - Creating a Database
Before creating a collection, we need a database. In MongoDB, databases are created dynamically. You can switch to a new or existing database using the use command. For this tutorial, we'll create a new database called tutorialDB.
use tutorialDB
The output will be:
switched to db tutorialDB
Step 3 - Creating a Collection
In MongoDB, collections are created implicitly when you insert data into them. However, you can also create a collection explicitly using the createCollection command.
Let's create a collection named users by inserting a document into it:
db.users.insertOne({
name: "John Doe",
email: "john.doe@example.com",
age: 29
})
This command creates a collection named users and inserts a document with the specified fields.
{
"acknowledged" : true,
"insertedId" : ObjectId("669514de0bc92b8bfdbe553d")
}
Alternatively, you can explicitly create a collection using the createCollection command:
db.createCollection("products")
This command creates an empty collection named products.
{ "ok" : 1 }
Step 4 - Inserting Documents into a Collection
Now that we have our collections, let's insert more documents into them.
To insert multiple documents into the users collection, use the insertMany command:
db.users.insertMany([
{ name: "Alice Smith", email: "alice.smith@example.com", age: 24 },
{ name: "Bob Johnson", email: "bob.johnson@example.com", age: 35 },
{ name: "Charlie Brown", email: "charlie.brown@example.com", age: 28 }
])
Output.
{
"acknowledged" : true,
"insertedIds" : [
ObjectId("669515120bc92b8bfdbe553e"),
ObjectId("669515120bc92b8bfdbe553f"),
ObjectId("669515120bc92b8bfdbe5540")
]
}
To insert a single document into the products collection, use the insertOne command:
db.products.insertOne({
productName: "Laptop",
brand: "BrandX",
price: 799
})
The output will be:
{
"acknowledged" : true,
"insertedId" : ObjectId("669515310bc92b8bfdbe5541")
}
Step 5 - Querying Collections
Once we have data in our collections, we can query it. Here are a few basic queries to get you started.
To find all documents in a collection, use the find command:
db.users.find().pretty()
Output:
{
"_id" : ObjectId("669514de0bc92b8bfdbe553d"),
"name" : "John Doe",
"email" : "john.doe@example.com",
"age" : 29
}
{
"_id" : ObjectId("669515120bc92b8bfdbe553e"),
"name" : "Alice Smith",
"email" : "alice.smith@example.com",
"age" : 24
}
{
"_id" : ObjectId("669515120bc92b8bfdbe553f"),
"name" : "Bob Johnson",
"email" : "bob.johnson@example.com",
"age" : 35
}
{
"_id" : ObjectId("669515120bc92b8bfdbe5540"),
"name" : "Charlie Brown",
"email" : "charlie.brown@example.com",
"age" : 28
}
The pretty method formats the output for readability.
To find specific documents, pass a query document to the find command. For example, to find users who are 29 years old:
db.users.find({ age: 29 }).pretty()
The output will be:
{
"_id" : ObjectId("669514de0bc92b8bfdbe553d"),
"name" : "John Doe",
"email" : "john.doe@example.com",
"age" : 29
}
Step 6 - Updating Documents
Updating documents in MongoDB is straightforward. Let's see how to update a document's field.
To update a single document, use the updateOne command. For example, to update John Doe's age:
db.users.updateOne(
{ name: "John Doe" },
{ $set: { age: 30 } }
)
To update multiple documents, use the updateMany command. For example, to set the verified field to true for all users:
db.users.updateMany(
{},
{ $set: { verified: true } }
)
Step 7 - Deleting Documents
You can also delete documents from a collection.
To delete a single document, use the deleteOne command. For example, to delete Bob Johnson's document:
db.users.deleteOne({ name: "Bob Johnson" })
To delete multiple documents, use the deleteMany command. For example, to delete all users who are younger than 30:
db.users.deleteMany({ age: { $lt: 30 } })
Conclusion
In this article, we covered the basics of creating and managing collections (tables) in MongoDB. We learned how to connect to MongoDB, create a database, create collections implicitly and explicitly, insert documents, query data, update documents, and delete documents. Try to create a MongoDB table on dedicated server hosting from Atlantic.Net!
### How to Delete a User and Database in MongoDB
Managing users and databases within MongoDB is critical to maintaining an organized and secure database environment. While adding users and creating databases are fundamental operations, there are times when you need to delete a user or an entire database.
In this tutorial, we will walk through the steps to delete a user and a database in MongoDB.
Deleting a User in MongoDB
First, you need to connect to the MongoDB shell. Open your terminal or command prompt and type the following command:
mongo
To manage users, you must switch to the admin database. The admin database is the default database for administrative tasks in MongoDB. Use the following command:
use admin
If your MongoDB instance is running with authentication, you must authenticate as a user with administrative privileges. Run the following command, replacing and with your admin user's credentials:
db.auth('admin-user', 'password')
To delete a user, you can use the db.dropUser() method. Let's say you want to delete a user named testUser. Use the following command:
db.dropUser('testUser')
If the user is successfully deleted, you will see:
{ "ok" : 1 }
Deleting a Database in MongoDB
If you have not already connected to MongoDB, open your terminal or command prompt and type:
mongo
Before deleting a database, it's a good idea to list all the databases to ensure you are deleting the correct one. Use the following command:
show dbs
This command will list all databases:
admin 0.000GB
config 0.000GB
local 0.000GB
tutorialDB 0.000GB
Let's say you want to delete a database named tutorialDB. Switch to the tutorialDB database using the following command:
use tutorialDB
To delete the tutorialDB database, use the db.dropDatabase() method:
db.dropDatabase()
If the database is successfully deleted, you will see:
{ "dropped" : "tutorialDB", "ok" : 1 }
Conclusion
In this article, we covered how to delete a user and a database in MongoDB. We started by explaining how to connect to the MongoDB shell and switch to the admin database. Then, we demonstrated how to delete a user using the db.dropUser() method. Finally, we walked through the process of deleting a database with the db.dropDatabase() method. You can follow this guide to delete a MongoDB database and user on VPS hosting from Atlantic.Net!
### How to Back Up and Restore a Database in MongoDB
Backing up your database is essential to protect against data loss and ensure data integrity. Restoring a database from a backup allows you to recover your data in case of accidental deletion, corruption, or hardware failure.
In this tutorial, we will cover how to back up and restore a MongoDB database.
Backing Up a MongoDB Database
The mongodump command is a utility provided by MongoDB that creates a database backup. It exports data from your MongoDB database into BSON files, which can be restored later.
To perform a basic backup of your MongoDB database, open your terminal and run the following command:
mongodump --db your_database_name --out /path/to/backup/directory
Here’s a breakdown of the command:
--db your_database_name: Specifies the name of the database you want to back up.
--out /path/to/backup/directory: Specifies the directory where the backup files will be stored.
For example, to backup a database named tutorialDB to /tmp directory, run:
mongodump --db tutorialDB --out /tmp/tutorialDB_backup
Output:
2024-07-15T12:29:20.438+0000 writing tutorialDB.products to /tmp/tutorialDB_backup/tutorialDB/products.bson
2024-07-15T12:29:20.439+0000 done dumping tutorialDB.products (1 document)
2024-07-15T12:29:20.442+0000 writing tutorialDB.users to /tmp/tutorialDB_backup/tutorialDB/users.bson
2024-07-15T12:29:20.443+0000 done dumping tutorialDB.users (1 document)
If your MongoDB instance is running on a non-default host or port, you can specify these using the --host and --port options:
mongodump --host your_host --port your_port --db your_database_name --out /path/to/backup/directory
Example:
mongodump --host localhost --port 27017 --db tutorialDB --out /tmp/tutorialDB_backup
If your MongoDB instance requires authentication, you can include the --username and --password options:
mongodump --username your_username --password your_password --authenticationDatabase admin --db your_database_name --out /path/to/backup/directory
Example:
mongodump --username admin --password secret --authenticationDatabase admin --db tutorialDB --out /tmp/tutorialDB_backup
Restoring a MongoDB Database
The mongorestore command is a utility for restoring a MongoDB database from BSON files created by mongodump.
To restore a MongoDB database, open your terminal and run the following command:
mongorestore --db your_database_name /path/to/backup/directory/your_database_name
Here’s a breakdown of the command:
--db your_database_name: Specifies the database name to which you want to restore.
/path/to/backup/directory/your_database_name: Specifies the directory where the backup files are located.
Example:
mongorestore --db tutorialDB /tmp/tutorialDB_backup/tutorialDB
Output:
2024-07-15T12:35:23.456+0000 restoring tutorialDB.collection1 from /tmp/tutorialDB_backup/tutorialDB/collection1.bson
2024-07-15T12:35:23.456+0000 restoring tutorialDB.collection2 from /tmp/tutorialDB_backup/tutorialDB/collection2.bson
Restore completed successfully.
If your MongoDB instance is running on a non-default host or port, you can specify these using the --host and --port options:
mongorestore --host your_host --port your_port --db your_database_name /path/to/backup/directory/your_database_name
Example:
mongorestore --host localhost --port 27017 --db tutorialDB /tmp/tutorialDB_backup/tutorialDB
If your MongoDB instance requires authentication, you can include the --username and --password options:
mongorestore --username your_username --password your_password --authenticationDatabase admin --db your_database_name /path/to/backup/directory/your_database_name
Example:
mongorestore --username admin --password secret --authenticationDatabase admin --db tutorialDB /tmp/tutorialDB_backup/tutorialDB
Conclusion
In this article, we have covered the essential steps for backing up and restoring a MongoDB database using the mongodump and mongorestore commands. Regular backups are crucial for data integrity and security while knowing how to restore data ensures you can recover from any unforeseen data loss. You can now perform a MongoDB back up and restoration on dedicated server hosting from Atlantic.Net!
### How to Create a User and Add a Role in MongoDB
MongoDB, a popular NoSQL database, offers robust user management and role-based access control (RBAC) features to secure your data. Creating users and assigning roles in MongoDB helps in maintaining a secure environment by ensuring that only authorized individuals can access and manipulate the data.
In this tutorial, we'll walk through the steps to create a new user and assign roles to them.
Step 1 - Connecting to MongoDB
First, let's connect to our MongoDB instance. Open your terminal and run the following command:
mongo
You should see an output similar to this:
>
Step 2 - Creating a New User
MongoDB user management is typically performed in the admin database. Switch to the admin database by executing:
use admin
Output:
switched to db admin
Now, let's create a new user. We'll create a user named testUser with the password password123. This user will be assigned the readWrite role on a database called mydatabase.
db.createUser({
user: "testUser",
pwd: "password123",
roles: [
{ role: "readWrite", db: "mydatabase" }
]
})
Output:
Successfully added user: {
"user" : "testUser",
"roles" : [
{
"role" : "readWrite",
"db" : "mydatabase"
}
]
}
Explanation:
user: The username for the new user.
pwd: The password for the new user.
roles: An array specifying the roles assigned to the user. Here, testUser is granted the readWrite role on the mydatabase database.
Step 3 - Adding Additional Roles to a User
If you need to add more roles to an existing user, you can use the updateUser command. Let's add the dbAdmin role to testUser on mydatabase.
db.updateUser("testUser", {
roles: [
{ role: "readWrite", db: "mydatabase" },
{ role: "dbAdmin", db: "mydatabase" }
]
})
Output:
Successfully updated user: {
"user" : "testUser",
"roles" : [
{
"role" : "readWrite",
"db" : "mydatabase"
},
{
"role" : "dbAdmin",
"db" : "mydatabase"
}
]
}
In the command above, we updated testUser to have both readWrite and dbAdmin roles on the mydatabase database.
Step 4 - Verifying User Roles
Let's verify the roles assigned to testUser. First, we need to authenticate as testUser.
db.auth("testUser", "password123")
Output:
1
A return value of 1 indicates successful authentication.
Now, let's check the roles assigned to testUser. Run the following command:
db.runCommand({ usersInfo: "testUser" })
Output.
{
"users" : [
{
"_id" : "admin.testUser",
"user" : "testUser",
"db" : "admin",
"roles" : [
{
"role" : "readWrite",
"db" : "mydatabase"
},
{
"role" : "dbAdmin",
"db" : "mydatabase"
}
]
}
],
"ok" : 1
}
The output shows the roles assigned to testUser, confirming that the user has both readWrite and dbAdmin roles on mydatabase.
Conclusion
In this article, we've walked through the steps to create a new user and assign roles in MongoDB. We started by connecting to the MongoDB instance, creating a user, and assigning initial roles. We then demonstrated how to update user roles and verify the roles assigned to the user. Try to deploy a MongoDB database and create a user on dedicated server hosting from Atlantic.Net!
### Using ChainML and Council-AI for Generative Applications
This guide streamlines the setup and usage of ChainML and Council-ai for developing generative AI applications. This procedure was tested on the Atlantic.Net Cloud Platform, using Ubuntu on a Cloud VPS with 32GB RAM.
Council-AI is an open-source platform designed to rapidly develop and deploy customized generative AI applications. It utilizes teams of agents built in Python to achieve this.
Council enhances AI development tools, providing greater control and management capabilities for AI agents. It allows users to build complex AI systems that behave consistently through its robust control features.
ChainML is a deep learning framework for building and training deep learning models. It is built on top of TensorFlow and provides a number of features that make it easier to build and train deep learning models, such as automatic differentiation, eager execution, and a high-level API.
In short, ChainML is a deep learning framework, while Council is an open-source platform for developing and deploying generative AI applications.
In this procedure, we will be focusing on using Council-AI to create Chains.
Create OpenAI API Key (Mandatory)
To use this procedure, you will need a paid license to interact with the OpenAI API. You can also use AzureLLM or GoogleLLM, but again, a paid license is needed.
If you already have your own Project API key you can skip this step. Otherwise, you must complete this step to integrate Council-AI with a Language Model.
Go to the OpenAI website and Create an Account (or log in if you already have one)
https://platform.openai.com/signup
Navigate to the Project API Keys Sections by clicking here:
https://platform.openai.com/api-keys
Click on Create New Secret Key
Follow the instructions and give your Key a Name and a Project. I will be using the default project in this example.
IMPORTANT: Make a note of your KEY. You will need it later. This is the only chance you get to save the key in its entirety. Click done when ready.
Part 1: Using Council-AI with Jupyter Notebooks on Ubuntu
Prerequisites
Ubuntu 22.04: I will be using Ubuntu 22.04 throughout this demo. You can install your Ubuntu server in under 30 seconds from the Atlantic.Net Cloud Platform Console.
Basic Python Knowledge: Familiarity with Python and virtual environments is helpful.
ChatGPT Pro Licence: Recent changes from OpenAI mean that you need to have a paid account to use the OpenAI API (OpenAILLM)
Step 1 – Install Python
Jupyter Lab requires Python. You can install it using the following commands:
apt install python3 python3-pip -y
Next, install the Python virtual environment package.
pip install -U virtualenv
Step 2 – Install Jupyter Lab
Now, install the Jupyter Lab using the pip command.
pip3 install jupyterlab
This command installs Jupyter Lab and its dependencies. Next, edit the .bashrc file.
nano ~/.bashrc
Define your Jupyter Lab path as shown below; simply add it to the bottom of the file:
export PATH=$PATH:~/.local/bin/
Reload the changes using the following command.
source ~/.bashrc
Next, test run the Jupyter Lab locally using the following command to make sure everything starts.
jupyter lab --allow-root --ip=0.0.0.0 --no-browser
Check the output to make sure there are no errors. Upon success you will see the following output:
[C 2023-12-05 15:09:31.378 ServerApp] To access the server, open this file in a browser:
http://ubuntu:8888/lab?token=aa67d76764b56c5558d876e56709be27446
http://127.0.0.1:8888/lab?token=aa67d76764b56c5558d876e56709be27446
Press the CTRL+C to stop the server.
Step 3 – Configure Jupyter Lab
By default, Jupyter Lab doesn’t require a password to access the web interface. To secure Jupyter Lab, generate the Jupyter Lab configuration using the following command.
jupyter-lab --generate-config
Output:
Writing default config to: /root/.jupyter/jupyter_lab_config.py
Next, set the Jupyter Lab password.
jupyter-lab password
Set your password as shown below:
Enter password:
Verify password:
[JupyterPasswordApp] Wrote hashed password to /root/.jupyter/jupyter_server_config.json
You can verify your hashed password using the following command.
cat /root/.jupyter/jupyter_server_config.json
Output:
{
"IdentityProvider": {
"hashed_password": "argon2:$argon2id$v=19$m=10240,t=10,p=8$zf0ZE2UkNLJK39l8dfdgHA$0qIAAnKiX1EgzFBbo4yp8TgX/G5GrEsV29yjHVUDHiQ"
}
}
Make a note of this information, as you will need to add it to your config.
Next, edit the Jupyter Lab configuration file.
nano /root/.jupyter/jupyter_lab_config.py
Define your server IP, hashed password, and other configurations as shown below:
c.ServerApp.ip = 'your-server-ip'
c.ServerApp.open_browser = False
c.ServerApp.password = 'argon2:$argon2id$v=19$m=10240,t=10,p=8$zf0ZE2UkNLJK39l8dfdgHA$0qIAAnKiX1EgzFBbo4yp8TgX/G5GrEsV29yjHVUDHiQ'
c.ServerApp.port = 8888
Make sure you format the file exactly as above. For example, the port number is not in brackets, and the False boolean must have a capital F.
Save and close the file when you are done.
Step 4 – Create a Systemctl Service File
Next, create a systemd service file to manage the Jupyter Lab.
nano /etc/systemd/system/jupyter-lab.service
Add the following configuration:
[Service]
Type=simple
PIDFile=/run/jupyter.pid
WorkingDirectory=/root/
ExecStart=/usr/local/bin/jupyter lab --config=/root/.jupyter/jupyter_lab_config.py --allow-root
User=root
Group=root
Restart=always
RestartSec=10
[Install]
WantedBy=multi-user.target
Save and close the file, then reload the systemd daemon.
systemctl daemon-reload
Next, start the Jupyter Lab service using the following command.
systemctl start jupyter-lab
You can now check the status of Jupyter Lab service using the following command.
systemctl status jupyter-lab
Jupyter Lab is now started and listening on port 8888. You can verify it with the following command.
ss -antpl | grep jupyter
Output:
LISTEN 0 128 104.219.55.40:8888 0.0.0.0:* users:(("jupyter-lab",pid=156299,fd=6))
Step 5 – Access Jupyter Lab
Now, open your web browser and access the Jupyter Lab web interface using the URL http://your-server-ip:8888. You will see the Jupyter Lab on the following screen.
Provide the password you set during the installation and click on Log in. You will see Jupyter Lab dashboard on the following screen:
Step 6 - Start the Python3 Notebook and Run the following Code
This part of the procedure uses examples provided by ChainML.
This guide aims to transform your social media presence with an AI-powered marketing assistant! Share your post idea, and this tool will identify the perfect platform and generate tailored content for maximum impact. Whether you're an influencer, marketer, or developer, this tutorial will showcase how Agents, Chains, and Skills can streamline your content creation process. using X (formerly Twitter), LinkedIn, or Discord.
Install Council-AI
!pip install council-ai
!pip install --upgrade jupyter ipywidgets
Import Modules
# Import required modules. This block imports all the required libraries for our project.
# Each one serves a specific function in creating our Council AI agent.
import dotenv
import os
import logging
from council.chains import Chain
from council.skills import LLMSkill
from council.filters import BasicFilter
from council.llm import OpenAILLM
from council.controllers import LLMController
from council.evaluators import LLMEvaluator
from council.agents import Agent
Set Your OpenAI API KEY
# Setup environment variables
dotenv.load_dotenv()
os.environ['OPENAI_API_KEY'] = 'sk-None-123456789-123456789-123456789'
os.environ['OPENAI_LLM_MODEL'] = 'gpt-3.5-turbo-0125'
os.environ['OPENAI_LLM_TIMEOUT'] = '90'
Initialize the LLM
# Initialize OpenAI LLM (Large Language Model)
# Here, we create an instance of OpenAILLM, which is a wrapper around the OpenAI language model,
# configured based on our environment variables.
openai_llm = OpenAILLM.from_env()
Create Your Chains
# Create the short content 'XorTwitter' Skill and Chain
prompt_XorTwitter = "You are a social media influencer with millions of followers on Twitter because of your short humorous social media posts that always use emojis and relevant hash tags."
XorTwitter_skill = LLMSkill(llm=openai_llm, system_prompt=prompt_XorTwitter)
XorTwitter_chain = Chain(name="XorTwitter", description="Responds to a prompt, which is a short sarcastic and humorous post idea.", runners=[XorTwitter_skill])
# Create a professional content 'LinkedIn' Skill and Chain
prompt_LinkedIn = "You are a social media influencer with millions of followers on LinkedIn because of your compelling short professional business posts that generate lots of engagement."
LinkedIn_skill = LLMSkill(llm=openai_llm, system_prompt=prompt_LinkedIn)
LinkedIn_chain = Chain(name="LinkedIn", description="Responds to a prompt, which is a post idea, written in formal businesss language using big words.", runners=[LinkedIn_skill])
# Create a longer 'Discord' Skill and Chain
prompt_Discord = "You are a social media influencer with millions of followers on Discord because of your compelling short social media posts."
Discord_skill = LLMSkill(llm=openai_llm, system_prompt=prompt_Discord)
Discord_chain = Chain(name="Discord", description="Responds to a prompt, which is a post idea, as an expert Discord influencer and generates a Discord post.", runners=[Discord_skill])
Create Controller & Evaluator
# Create Controller
controller = LLMController(chains=[XorTwitter_chain, LinkedIn_chain, Discord_chain], llm=openai_llm, response_threshold=5)
# Create Evaluator
evaluator = LLMEvaluator(llm=openai_llm)
# Create Filter
filter = BasicFilter()
Create the Agent
# Create Agent
agent = Agent(controller=controller, evaluator=evaluator, filter=filter)
Create a Context
result = agent.execute_from_user_message("Open Data Conference")
#for message in result.messages:
print("\n" + result.best_message.message)
#OpenAI models may time-out due to high traffic, retry this step immediately or try this step later
#for message in result.messages:
print("\n" + result.best_message.message)
Examples
Here are some example inputs to invoke the 3 different chains:
For the 'XorTwitter' Skill: Prompt: "What is the sum of two and three"
For the 'LinkedIn' Skill: Prompt: "Job Search"
For the 'Discord' Skill: Prompt: "Game Night Announcement"
Try the same questions in ChatGPT directly and note the different responses. Now try your own input text.
Part 2: Using Council-AI Direct From the Ubuntu Console
Prerequisites
Ubuntu 22.04: Ensure you have Ubuntu 22.04 installed. You can quickly set up an Ubuntu server using cloud platforms like Atlantic.Net.
Basic Python Knowledge: Familiarity with Python and virtual environments is helpful.
ChatGPT Pro Licence: Recent changes from OpenAI mean that you need to have a paid account to use the OpenAI API (OpenAILLM)
Step 1 Update OS and Install Pre-Requisites
I will be using Ubuntu 22.04 throughout this demo. You can install your Ubuntu server in under 30 seconds from the Atlantic.Net Cloud Platform Console.
Open a terminal and run:
apt-get update -y
apt-get install python3 python3-pip git python3.10-venv python3-dotenv
-y
Explanation:
This command updates package lists and installs Python (version 3), pip (package manager), Git (version control), Python virtual environment tools, and dotenv (for managing environment variables)
Step 2 - Create and Activate a Python Virtual Environment
Using a Python virtual environment to run Council AI (or any Python project, really) is highly recommended. Virtual environments help to:
Isolate Dependencies: Each project gets its own set of packages, avoiding conflicts between different projects that might require different versions of the same libraries.
Keep Your System Clean: You won't clutter your global Python installation with project-specific packages.
Make Sharing and Deployment Easier: Virtual environments create a self-contained setup for your project, making it easier to share with others or deploy.
python3 -m venv council-env
source council-env/bin/activate
Explanation:
The first command creates a virtual environment named "council-env".
The second command activates the virtual environment, isolating your project dependencies.
Step 3 - Install Council AI using PyPi
Install Council AI.
pip install council-ai
Wait for the installation to complete. Pip will download and install the Council AI package and its dependencies.
Validate the installation by typing:
pip show council-ai
Step 4 - Set Up Your Local .env File
Create a .env File:
In your project directory (or within your virtual environment), create a new file named .env.
Note: The .env file is a common way to store sensitive information like API keys. It is usually ignored by version control systems like Git to prevent accidental exposure.
nano .env
Add Your API Key:
Open the .env file in a text editor and add the following line, replacing your_actual_openai_api_key with your actual key:
OPENAI_API_KEY=your_actual_openai_api_key
Step 5 - Start Council AI and Run Your First Chain
All code must be executed inside a python script. If you run this against the shell it will simply error and not know what to do.
First, create a blank python script:
nano council_script.py
Add the following script block:
from council.chains import Chain
from council.skills import LLMSkill
from council.llm import OpenAILLM
import dotenv
import os
dotenv.load_dotenv()
print(os.getenv("OPENAI_API_KEY", None) is not None)
openai_llm = OpenAILLM.from_env()
prompt = "You are responding to every prompt with a short poem titled hello world"
hw_skill = LLMSkill(llm=openai_llm, system_prompt=prompt)
hw_chain = Chain(name="Hello World", description="Answers with a poem titled Hello World", runners=[hw_skill])
prompt = "You are responding to every prompt with an emoji that best addresses the question asked or statement made"
em_skill = LLMSkill(llm=openai_llm, system_prompt=prompt)
em_chain = Chain(name="Emoji Agent", description="Responds to every prompt with an emoji that best fits the prompt",
runners=[em_skill])
from council.controllers import LLMController
controller = LLMController(chains=[hw_chain, em_chain], llm=openai_llm, response_threshold=5)
from council.evaluators import LLMEvaluator
evaluator = LLMEvaluator(llm=openai_llm)
from council.filters import BasicFilter
from council.agents import Agent
agent = Agent(controller=controller, evaluator=evaluator, filter=BasicFilter())
result = agent.execute_from_user_message("hello world?!")
print(result.best_message.message)
result = agent.execute_from_user_message("Represent with emojis, council a multi-agent framework")
print(result.best_message.message)
### How to Become HIPAA-Compliant: Our 10-Step Guide
How to become HIPAA Compliant?
There are several aspects of the Health Insurance Portability and Accountability Act of 1996 (HIPAA), but as it pertains to health care IT and the focus of this article, HIPAA compliance comes from your company’s ability to adhere to the strict national standards regarding electronic health care transactions and identifying information for health care providers, employers, and health insurance plans.
As one might imagine with such a large piece of national legislation, there is a myriad of minimums that your company’s systems and operations must meet. And as one might also imagine, understanding and implementing exactly how said systems and operations must operate to be HIPAA compliant can quickly become quite a daunting task. Having a quick, clear, and easy 10-step HIPAA compliance checklist to run through can be a major help, which is what we are doing in this article. We will also take a look at a series of hosting questions asked by an Atlantic.Net healthcare client interested in learning more about the specifics of compliance.
Why is HIPAA Compliance required?
One of the problems with our increasingly technological world is that the speed at which our devices and services upgrade and make older versions obsolete can be dizzying. It feels like only an instant before the latest smartphone or flatscreen TV is being replaced with the bigger, better, faster model.
The same holds true in the world of HIPAA web hosting, data information, and server management. And while it can be tough to keep up for any type of business, it’s crucially important if your company is involved with health care IT and has to maintain HIPAA Compliance.
10-Step HIPAA Compliance Checklist
If you want to know how to become HIPAA compliant, there are specific standardized technologies that you should have in place to properly protect Personal Health Information or PHI, and avoid violations. We’ll dive more into the technological side in the spotlight section detailing a conversation with a client below.
In addition to those technical specifications, here are 10 additional actions you want to take as general HIPAA administrative safeguards. Although these tactics should not be considered exhaustive, each one will effectively reduce your liability and make it less likely that you will become a target of the Department of Health and Human Services (HHS):
Create a Security and Privacy Policy
Name a Privacy and Security Officer
Perform Periodic Vulnerability Reviews
Create a Specific Policy for Email
Create a Specific Mobile Policy
Train Your Staff
Develop a Privacy Notice
Solidify Business Associate Relationships
Establish a Protocol for Possible Breaches
Make Sure the Privacy and Security Policies are Followed
Step #1 – Create a Security and Privacy Policy
“Healthcare organizations must develop, adopt and implement privacy and security policies and procedures,” said Becker’s Hospital Review. “They must also make sure that they are documenting all their policies and procedures, including steps to take when a breach occurs.”
This is particularly important in today’s world, where cybercrime, in the form of brute force attacks, Distributed Denial of Service (DDoS) attacks, and other forms of hacking have resulted in some of the biggest data breaches in history. And with the recent gigantic Anthem data breach, having air-tight security safeguards in place is paramount, as are having the proper protocols in place in the unfortunate event of a hack or breach.
Step #2 – Name a Privacy and Security Officer
Name one or two people who are knowledgeable on HIPAA compliance requirements for these roles. One of the most crucial aspects of being HIPAA compliant is ensuring that your data remains safe, secure, and most importantly, confidential. It makes sense that the person, or people, in charge of that data is an expert in the field - a HIPAA privacy officer & security officer. They can also help you set up air-tight policies (as mentioned in step #1 above) and implement the best possible procedures in case of an attack or system error.
Step #3 – Perform Periodic Vulnerability Reviews
You want to check and test your exposure to risk on a regular basis. If you find anything amiss, of course, you need to correct it. Policies should be adjusted based on information from these assessments as well. After all, a chain is only as strong as its weakest link, so while even if the vast majority of your systems and are air-tight, it would only take one small mistake or oversight to cause massive problems. Hackers, cybercriminals, and even inadvertent employee mistakes could all spell major problems and possible violations if not shored up immediately.
Step #4 – Create a Specific Policy for Email
The HHS Office for Civil Rights, or OCR, has stated it wants to see user guidelines that are crafted to the particular situation, as exhibited by specific mobile and email policies. Interestingly enough, it does not state anywhere in the OCR regulations that PHI must only be sent and/or received via encrypted email, but it’s worth pointing out that your email system is HIPAA compliant and with the encryption of all messages. In addition, you can protect yourself from investigations with encrypted email. In today’s world, email encryption is a relatively fast, easy, and painless process to implement, and many providers will offer it free of charge. It’s very much the time to look into, but if you decide that email encryption is not right for you at this point in time, you must at the very least inform your patients that asking for records through email puts them at risk.
Step #5 – Create a Specific Mobile Policy
Mobile devices are everywhere, and they get more omnipresent each and every year. Every side of the health care world, between providers and patients, uses mobile devices to check email and log into profiles. As such, it will greatly benefit you to create a strong policy to safeguard health data on mobile devices, such as smartphones and laptops, which are particularly susceptible to physical theft. The policy should address also what happens when a new device is added to or removed from the network.
Step #6 – Train Your Staff
While not everyone on your team must be an industry-leading expert in the finer technicalities of HIPAA (save those hires for your Security and Privacy Officer positions, as mentioned in Step #2), it will behoove you if your staff is comfortably familiar with the basic parameters of HIPAA. It has been shown numerous times by numerous studies that employees are consistently one of the biggest risks to a company’s cybersecurity – usually through a lack of knowledge of the proper protocols. Nobody wants to be the cause of a HIPAA violation, so it’s in your best interest to provide training to any new people who join your staff and occasional reviews (some say every six months) for continuing employees.
Step #7 – Develop a Privacy Notice
Communication is key, and that goes double for privacy. Having a clear, concise privacy policy is important, as is getting that policy out there for all to see. Make sure that your privacy policy is posted on your website and is easy to find. The same policy should be handed out to patients, and they should sign that they’ve received it. Also, don’t be afraid to view your privacy policy as a living, breathing document – if certain events, either in your company or in the healthcare industry at large, necessitate the need for changes, update the policy. And when you do, get new signatures from your patients to ensure they understand what’s been updated.
Step #8 – Solidify Business Associate Relationships
Odds are your business isn’t an island – you have a team of business associates that you work with on a regular basis. Even though they aren’t full-time employees, you still need to make sure they adhere to any policies you’ve set forth. Harking back to the chain analogy used in Step #3, if your associates aren’t a strong link, it’s a problem. You need to make sure that a strong business associate agreement is signed with all relevant parties – including those that handle PHI, such as shredding companies.
Step #9 – Establish a Protocol for Possible Breaches
It’s critical to have a step-by-step system whenever you think a breach might have occurred. Even the most safeguarded and up-to-date systems are susceptible to breaches, so always view cybersecurity as two sides to the same coin – it’s important to invest and spend time on infrastructure and policies that will help prevent breaches and other forms of attacks, but the flip side is to always know that a breach is always a distinct possibility.
“The Risk of Harm Standard and the risk assessment test can be used to determine if a breach has occurred,” noted Becker’s. “If a breach has occurred, it is essential that the healthcare organization document the results of the investigation and notify the appropriate authorities.”
Step #10 – Make Sure the Privacy and Security Policies are Followed
Preparation is only half the battle – and important half to be sure, but what good is the best-laid plans if they aren’t followed? Ensuring that they are actively followed is critical. It needs to be a part of your company’s DNA and breathed into each and every operation your company undertakes. In addition to making sure the policies are well-known and followed by all your team members and all business associates, it should also be known that failure to adhere to said policies come with penalties. Make sure the consequences of failing to comply with your HIPAA compliance policies are both well-known and strict enough to ensure your staff does everything possible to follow them.
Spotlight: HIPAA Technology Provider Questions
This section spotlights a recent and actual question-and-answer exchange we had with a prospective healthcare client – we’ve of course anonymized and edited it for privacy. For brevity, we’ll skip the introductions and jump right into the Q&A. We hope this gives you some insight into some of the more technical aspects of HIPAA compliance, and how any company worth your time will have strong answers to each of these types of questions.
Healthcare Client:
Have you been independently audited against the OCR HIPAA Audit Protocol?
Hosting Consultant:
Yes, I have attached our HIPAA audit for your review.
Healthcare Client: What particular IT services meet HIPAA-compliant security standards for
protecting PHI?
Hosting Consultant: The following services fully meet HIPAA-compliant security standards with regards to Personal Health Information or PHI: Fully Managed Hardware Firewall; Encrypted VPN’s; Intrusion Detection System; Fully Managed Daily Encrypted Backup; Private Dedicated Server Environment with Self-Encrypted Storage (Virtualized or Non-Virtualized); and Anti-Virus Software.
Healthcare Client: Do you have documented policies and procedures?
Hosting Consultant: Yes, but the Policies and Procedures are Proprietary Information. We only release the HIPAA Audit, BAA, DR Document, and SSAE 16 (SOC 2, Type 1 & 2) audit. (All are attached.)
Healthcare Client: Are your employees trained?
Hosting Consultant: Of course.
Healthcare Client: Do you have a thorough BAA (Business Associate Agreement) with documented and communicated policies?
Hosting Consultant: Yes, and it is attached for your review.
Healthcare Client: What is the difference between regular server hosting and HIPAA-compliant server hosting (structure-wise)?
Hosting Consultant: The only fundamental difference is that HIPAA Compliant Hosting requires an Intrusion Detection System. It also requires all of the services listed above in the question regarding services meeting PHI protection protocols. HIPAA-compliant hosting can include a Virtualized Private Dedicated Server environment but it cannot include Public Cloud / Private Cloud hosting services.
Healthcare Client: Why is HIPAA-compliant server hosting more expensive than regular server hosting?
Hosting Consultant:
Because of the technologies listed above and because you cannot remove any of these items from the hosting platform as you can with a non-HIPAA compliant server hosting environment.
Conclusion
Every healthcare company must ask for advice when they work with IT providers since any issues with the provider would pose a risk to their patient's health information. After all, even going through a minor HIPAA violation can be disastrous to a healthcare IT organization.
Atlantic.Net is a trusted HIT provider. Our clients trust us because we are experts on the subject and are fully transparent in all communications, as evidenced by this customer testimonial below: “Atlantic.Net’s reputation for 100% up-time, their secure infrastructure, and expertise in Healthcare IT were key components in finalizing our partnership,” said Complete Healthcare Solutions Vice President Joseph Nompleggi.
Feel free to contact us today to see if we can help you meet your HIPAA compliance needs with any of our award-winning HIPAA-Compliant Hosting or Dedicated Hosting.
Read More About HIPAA Compliance
HIPAA Compliance Checklist
What Is the HIPAA Security Rule?
Top Considerations for HIPAA File Storage
HIPAA Data Storage Requirements
Protecting e-PHI in the Cloud
What Is HIPAA Cloud Computing?
What Is Healthcare Hosting?
What Is PHI?
This article updated with the latest information on July 30, 2024.
### Top 10 Considerations for a HIPAA-Compliant Database Complete HIPAA Compliant Database Guide
HIPAA Compliant Database Top Considerations
If you’ve been charged with implementing a HIPAA-compliant database and it’s your first time building a system that adheres to the healthcare law, you may feel overwhelmed and confused about where to start. The first step is to focus your efforts so you can move forward systematically in creating one. The below considerations will allow you to establish a database and protect it over time.
1 - Understand what HIPAA is.
The Health Insurance Portability and Accountability Act (HIPAA) is a law that was passed in 1996 by the United States Congress. This law is wide-ranging but is focused on:
allowing for US employees and their families to maintain their health insurance coverage if they leave jobs or change to new ones;
preventing abuse and fraud within the healthcare industry;
introducing standards for healthcare data that should be used with billing and in other contexts; and
mandating that data should be properly safeguarded and that its privacy should be maintained.
That fourth point is the key concern when protecting a database. (See the Privacy Rule and Security Rule of HIPAA’s Title II, particularly the latter.)
2 - Know core tools for protecting a HIPAA-compliant database.
Key tools you will use in order to protect your database include data encryption, firewalls, electronic auditing systems, and third-party audits. Data encryption is used to make certain that only the person or organization authorized to see the HIPAA data can see it. It protects healthcare information both when it is being stored and during its transmission. Firewalls are software programs that block illegitimate access to networks and prevent access by unauthorized individuals. Electronic auditing platforms necessitate that people must use login credentials for access and create a log of everything each individual does. Finally, third-party audits give you perspective by bringing in someone who focuses specifically on HIPAA compliance. By bringing in an outside auditing agency, you can reveal any weaknesses you might have so that you can make corrections right away.
3 - Train your staff.
You should maintain compliance not only through technology but through your staff as well. Healthcare is a field that is particularly susceptible to problems arising from human error and negligence. Any mistakes made by human beings could have extremely expensive outcomes, so that aspect of compliance cannot be forgotten. Training will allow any of your personnel who are handling protected health information to do so in a manner that is consistent with the law and that properly protects sensitive healthcare data.
4 - Examine your infrastructure for technical and physical safeguards.
When you set up a HIPAA compliant database, you may use your own data center or the facility of a HIPAA compliant server hosting provider. Either way, it is critical that technical and physical safeguards are in place (beyond the administrative safeguards that relate less directly to the technology).
Technical safeguards are designed to secure electronic data. The technical methods that you need in place to be HIPAA-compliant include integrity controls, audits, user identification, authentication, and encryption/decryption. These parameters will also help to define the steps that are taken for electronic health access when an emergency or natural disaster strikes.
Physical safeguards have to do with validation and access for in-person interaction with equipment that contains electronic PHI. These defenses control the people that are able to make any kind of contact with servers and computers on which electronic patient data is stored. The protections additionally contain standards for disaster recovery in the event of natural disasters or other extreme, unexpected events. They also include the manner in which electronic health records should be used and removed from the system. For instance, there should be a set of steps in place to dictate how malfunctioning hard drives are removed.
5 - Limit access to applications and data.
Another consideration is how you want to go about limiting access to healthcare applications and data within your environment. Access is a core consideration because you will improve security by limiting application and patient record access to those employees who need that access in order to complete tasks. When you restrict access, you will leverage user authentication, which will protect your patient information by verifying that all users who look at the data have been authorized. It is a very good idea to set up multi-factor authentication (MFA) to control access so that users will have to confirm their identity through multiple forms of validation.
6 - Set up data usage controls.
The data controls that you implement should be extensive, not just monitoring and limiting access, but checking proactively in order to block malicious efforts as they emerge. Data controls could be used to stop various types of actions related to ePHI, including printing, copying files onto external drives, email transmission without authorization, and online uploads. In order to know that proper identification and tagging of your ePHI can occur so that it can be safeguarded, use best practices for data discovery and classification.
7 - Encrypt your databases.
Encrypting your ePHI will convert your data into an encoded form. By encrypting, you make it only possible for someone to see the data if they have a decryption key or code. Encryption is a strong method that can be used to make sure that electronic health records are not compromised by nefarious third parties.
Encryption helps meet the parameters of the HIPAA Privacy and Security Rules but is especially a focus of the latter, which is centered on electronic protections. The Security Rule requires that covered entities under HIPAA protect all data they generate, send, store, or receive, and encryption is a standard way to shield the data from anyone who is not intended to view it.
8 - Monitor use of the database and create logs.
Setting up logs that record all access and applicable data makes it possible to know the locations and devices from which access is being obtained, as well as the times, applications, and specific data that is being accessed. You can benefit from logs during audits when you can bolster your defenses by looking at issues that have been exposed by the logs. When you experience a security event, you can find out the points of entry, why the intrusion occurred, and estimate the damages that you have sustained using an audit trail.
9 - Decide whether you want to use an outside party.
As indicated above, you can use your own data center or hosting service – cloud or otherwise – to establish your HIPAA-compliant database. It is certainly easy and convenient to be able to meet compliance standards when they are already built into a purpose-made hosting solution by an expert third party. In fact, choosing to work with a host is more compelling when you think beyond ease of management to physical security. It is easy to forget the physical as you deeply consider the technical considerations of a HIPAA-compliant system; physical security breaches are still a major threat. Not only could you have an intruder, but you could have devices or data stolen by disgruntled employees; and no matter whether the physical loss is due to an internal or external actor, it is one of the top data breach vulnerabilities.
10 - Choose a partner with niche HIPAA expertise.
If you are concerned about setting up a HIPAA database that will store electronic health data, using an outside host for your systems can be wise. There are many hosting plans from which to choose, some of which have more experience with HIPAA than others. At Atlantic.Net, healthcare is one of our primary points of focus and has been for years. HIPAA Compliant Database Hosting by Atlantic.Net is SSAE 18 SOC 1 & SOC 2 certified and HIPAA & HITECH audited, designed to secure and protect critical healthcare data and records. See our HIPAA-compliant hosting solutions.
Read More About HIPAA IT Compliance
HIPAA IT Compliance Guide
Best HIPAA Compliant Fax Service
Best HIPAA Compliant Email Service
Best HIPAA Compliant VOIP Service
What Is a BAA?
SSAE16, SAAE18, SOC1, SOC2 - Why You Should Care
Best Healthcare Software Development Companies
Best HIPAA Consulting Companies
Is It HIPPA or HIPAA?
### Top 10 Healthcare Software Development Companies
What are Healthcare Software Development Companies?
With the global digital health market estimated to be worth around $660 billion by 2025, more and more businesses and organizations are turning to leading healthcare software development companies to engineer quality software that will streamline the delivery of their services. Healthcare software development covers many sectors of the growing healthcare industry, including primary and secondary care, financing, data management, appointment scheduling, clinical research, and the manufacture and supply of medical equipment.
Whether you are part of a large healthcare organization seeking to design and implement a state-of-the-art healthcare app, or a small doctors’ practice looking to construct a simple billing and financing solution, there is a healthcare software development company to help you.
Top Healthcare Software Development Companies
Here, we collate the top 10 Healthcare Software Development Companies, considering their features, pricing structure, and experience in the industry.
1. ScienceSoft
In healthcare IT since 2005, ScienceSoft brings together time-proof reliability and innovation. Working with healthcare providers and medical software vendors around the globe, ScienceSoft offers medical software development services and has successfully completed over 100 projects.
ScienceSoft’s passionate teams successfully plan, build, and support award-winning medical solutions to help their customers meet their business goals and drive high ROI from their IT projects. Proficient in advanced techs like AI, ML, blockchain, and image analysis, ScienceSoft takes the lead both in innovative and process-oriented medical projects. Its customers point out that ScienceSoft’s teams are reliable, thorough, extremely good communicators, and very friendly.
2. Novelty Technology
Novelty Technology provides its clients with end-to-end software solutions, taking their ideas from the concept and design stage to implementation and ongoing support. In addition, they partner with a leading HIPAA-compliant hosting provider to ensure that the services they provide comply with the necessary healthcare regulations.
Novelty Technology employs a skilled and experienced team to offer its clients high-quality solutions, including web and mobile app development, UI and UX graphic design, cloud and API development, data analysis and reporting, and the modernization of legacy infrastructure. In addition, they strive to reduce costs and maximize ROI by eliminating corporate overheads and other unnecessary expenses.
3. ZDI
ZDI is a leading New York-based digital marketing company and a proud partner of Atlantic.Net. With strong ties to HIPAA-compliant organizations, ZDI designs and delivers powerful digital branding and marketing solutions to healthcare clients. The services offered by ZDI include comprehensive digital marketing consultation, strategy, & analysis, SEO, SEM, UI/UX design, web development, print & packaging, and original film, video & photo content. ZDI won the GDUSA Health + Wellness Design award in 2017 and has created some excellent web applications for our clients.
4. Let’s Talk Interactive
A leader within the telemedicine sector, Let’s Talk Interactive has delivered exciting solutions for healthcare businesses, both during and post-pandemic. With telehealth adoption soaring since the global pandemic limited face-to-face interactions, Let’s Talk Interactive is developing HIPAA-compliant, customized telehealth solutions to improve patient healthcare access. Their cutting-edge turnkey solutions include industry-leading virtual and walk-in clinic software, video conferencing & telemedicine software, live analytics, and HIPAA-compliant website development.
5. Arkenea
Arkenea is an award-winning healthcare software development company that was founded in 2011. Arkenea is the only software development company fully dedicated to the healthcare industry, boasting over ten years of experience in this field. The company has been ranked among the top software development companies in the world by the industry research report “Global Intelligent Apps Market – Industry Trends and Forecast to 2026.”
Arkenea helps healthcare companies to design and implement HIPAA- and HITRUST-compliant software solutions (both websites and mobile applications).
6. SNS System Inc.
SNS System is a leading global provider of business consulting and IT services. The company specializes in developing quality client-server applications with user-friendly interfaces and boasts expertise in a wide range of the newest programming language tools and platforms designed for client-server applications. SNS System comprises a team of experienced developers, system administrators, and IT managers and uses only the latest, proven technology.
7. Codal
With offices in the US, UK, and India, Codal is an award-winning and innovative company that delivers customized healthcare software solutions. Codal’s company approach is to provide innovative and modern solutions that can be continuously tested and improved until they are just right.
Codal’s notable awards include an UpCity Local Excellence Award 2022, Expertise.com’s 2022 Best Web Developers in Chicago, and BigCommerce’s 2021 Partner of the Year. Codal’s vast portfolio of clients includes Samsung, Pepsi, Baxter, and Charles Schwab.
8. IT Craft
With over 300 clients in 21 countries and over 20 years of experience, IT Craft is a trusted and valued healthcare software development company. Working with both big enterprises and small start-ups, IT Craft has had a successful role in helping businesses to grow and evolve. IT Craft builds web and mobile apps for doctors, patients, hospital administrations, and insurance companies alike.
While IT Craft services may be more costly than some of their competitors, their satisfied customer base proves they offer value for money.
9. Glorium Technologies
Glorium Technologies is an established company that delivers software development services worldwide. As a full-cycle app & software development company, they are ready to provide their customers across the EU and North America with on-demand teams of software engineers, project managers, QA specialists, and other tech workforce. Product design, growth on demand, and investment strategy guidance are also listed as their top-provided services. Most of their clients are funded startups that work in the healthcare or real estate industry, but the company is not limited to these domains and has plenty of experience in other industries, i.e. fintech and eCommerce.
Glorium Technologies has operated since 2010. The company has three ISO certificates: it is ISO-13485 certified for medical device development; has ISO-9001 certification for quality management; and ISO-27001 certification for information security standards. All the healthcare software is GDPR or HIPAA/HITRUST compliant (depending on the client's territorial disposition). Glorium Technologies’ headquarters is located in New Jersey, and development centers are in Kyiv, Krakow, and Paphos.
10. Appinventiv
As an award-winning healthcare solutions provider with 7+ years of industry experience, Appinventiv has been delivering exceptional healthcare software development services. The professionals of Appinventiv have created top-notch healthcare software solutions for the world's leading health and fitness brands. The company aims to enable a faster ecosystem with its advanced healthcare applications that aim to streamline healthcare operations.
From clinical management to effective patient treatment and diagnosis solutions, Appinventiv has worked with over 50 digital healthcare projects solving their greatest challenges. Their healthcare app development services digitize the current administrative processes that improve efficiency, thereby lowering the cost of healthcare.
Bonus:
RisingMax Inc.
As a top-rated IT consulting company in NYC, RisingMax Inc. has been delivering high-end healthcare software development services to clients worldwide. Their healthcare experts understand all the nitty gritty associated with healthcare solutions and continuously improve and test software to offer modern solutions. The company boasts its expertise in bleeding-edge technologies like AI, ML, IoT, and blockchain and integrates them to build custom healthcare solutions.
Their team has successfully built HIPAA-compliant healthcare solutions that include electronic health record (EHR) software, hospital asset tracking software, healthcare workforce management software, laboratory management system, and telehealth and telemedicine software. The team strives to build healthcare apps that streamline operations, automate processes, and reduce costs, overheads, and other unnecessary expenses. The combination of all the above-mentioned parameters makes them a trusted custom healthcare software development company and a worthy contender for our list.
FATbit Technologies
FATbit Technologies is a leading custom software development company that delivers agile software development services in the healthcare and eCommerce domains. The company has dedicated teams of product managers, developers, and quality testers to provide startups and established businesses with software that meets their requirements.
Apart from custom software development services, FATbit has in-house products that help businesses with online grocery marketplaces, food delivery, business consultation, equipment rental solutions, and so on. The products offered by the company are white-label and inclusive of payment gateway & popular marketing tool integrations.
Leeway Hertz
With over 14 years of experience in the industry, Leeway Hertz delivers customized digital software solutions to enterprises and startups globally. Based in the US, Leeway Hertz is an award-winning company that provides practical solutions to its clients, including telemedicine software, mobile health apps, patient engagement solutions, and remote patient monitoring software.
As Leeway Hertz development team is knowledgeable and skilled in using innovative technologies, such as blockchain, AI, and IoT, the company can deliver futuristic and cutting-edge software solutions to its healthcare clients.
Light-it
Light-it works with digital health startups, clinics, and MedTech companies to help create and develop transformative web and mobile applications. Over the past 14 years, Light-it has delivered over 500 custom solutions to companies worldwide, specializing in the digital health space. According to Clutch, Light-it is one of the top software development agencies. The company offers web & app development, road mapping, and UI/UX design and maintains HIPAA compliance, focusing on privacy, security, and scalability.
Matellio
Matellio is a leading software engineering studio offering end-to-end healthcare software development services to clients worldwide. With an experienced team and decade-long expertise in custom healthcare software development, the company has designed and delivered HIPAA-compliant healthcare solutions and mobile apps based on next-gen technologies like AI, ML, IoT, etc. Some of their cutting-edge healthcare solutions include telehealth apps, patient monitoring software, EHR software, remote patient monitoring solution, etc. Global Leaders like Clutch, App Futura, DesignRush, and Scrum Alliance, have acknowledged their abilities and knowledge.
How Can Atlantic.Net Help?
Spurred on by the global pandemic, healthcare businesses and organizations continue to embrace digital healthcare solutions. Healthcare companies must be supported by leading software development teams so that they can offer simple yet effective digital technologies to their employees and patients. Well-designed digital applications will help to streamline the delivery of healthcare services moving forwards.
Are you a healthcare provider searching for a healthcare software developer to design and implement your latest digital solution? We have shortlisted our top healthcare software development companies to help you along the way. No matter what software solution you purchase, you must partner with a fully HIPAA-compliant hosting platform that will prioritize security, privacy, and compliance to host your application. Atlantic.Net has over 30 years of experience providing HIPAA-compliant hosting services to companies and organizations within the healthcare industry. Atlantic.Net can offer you cloud hosting solutions that are fully scalable and customizable to meet the needs of your organization. Contact our sales team today to learn how Atlantic.Net can help your organization.
Read More About HIPAA IT Compliance
HIPAA IT Compliance Guide
Best HIPAA Compliant Fax Service
Best HIPAA Compliant Email Service
Best HIPAA Compliant VOIP Service
Top Considerations for a HIPAA-Compliant Database
What Is a BAA?
SSAE16, SAAE18, SOC1, SOC2 - Why You Should Care
Best HIPAA Consulting Companies
Is It HIPPA or HIPAA?
### What Is HIPAA Cloud?
What Is HIPAA-Compliant Cloud Computing?
HIPAA Compliant Cloud Computing requires that a set of data security standards and capabilities be met, but does not specify certain technical means to meeting them. According to the U.S. Department of Health & Human Services, provisions in a Service Level Agreement (SLA) between a covered entity and a HIPAA-compliant cloud provider may address HIPAA concerns, including system availability and reliability, back-up and data recovery, how data will be returned to the customer after the services are terminated, security responsibility, and limitations of data use, data retention, and disclosure.
Who Is Required to Be HIPAA Cloud Computing Compliant?
Businesses that handle sensitive data requiring regulatory compliance often have computing needs that make them ideal candidates to benefit from the cloud. Medical practitioners covered under the Health Insurance Portability and Accountability Act (HIPAA ) and the Health Information Technology for Economic and Clinical Health (HITECH) Act must have confidence in the availability and security of their IT systems not just because they are required to by law, but because their delivery of critical services depends on it.
Public or Private Cloud for HIPAA Compliance
In previously discussing private cloud and public cloud hosting solutions and services, we defined cloud computing roughly as the use and storage of data and programs over the internet, enabled by virtualization, as a scalable and elastic service. Atlantic.Net’s HIPAA-Compliant Cloud Hosting offering is an environment specifically engineered for HIPAA compliance within the Atlantic.Net Public or Private Cloud. It provides secure and compliant IT system access to internal, remote, and mobile employees to allow them to concentrate on the delivery of services.
HIPAA Compliance and Privacy Rule
HIPAA compliance is based on satisfying a set of requirements, including the Privacy Rule, the Breach Notification Rule, and the Security Rule. Healthcare companies will also be concerned with the Health Information Technology for Economic and Clinical Health (HITECH) Act, which regulates the electronic transmission of health information. HIPAA compliance failures can result in jail time, and more frequently, result in fines of thousands or even millions of dollars for a covered entity (CE), such as a health care provider, health plan, or health data clearinghouse.
Benefits of HIPAA Cloud Computing
The potential for multi-million dollar fines and jail time for not implementing HIPAA/HITECH compliance makes it essential for all covered entities. The global market for IT services in support of healthcare is expected to grow from $134 billion in 2016 to $280 billion in 2021, with the majority of revenue in North America, according to MarketsandMarkets research.
HIPAA Compliant Cloud Computing continues to be the top choice for healthcare providers. HIPAA compliance delivered through Atlantic.Net’s HIPAA Cloud solutions provides all the benefits of the cloud, including availability, scalability, cost savings, and access to expert engineers, along with strong added security or compliance benefits.
Atlantic.Net – Top Choice for HIPAA Compliant Cloud Computing and Storage
Major healthcare service providers Rely on Atlantic.Net for their HIPAA cloud computing and storage needs. As an Atlantic.Net HIPAA Cloud customer, ShareSafe Solutions provides software-as-a-service (SaaS) to healthcare companies for secure, HIPAA-compliant communication and information sharing. ShareSafe Solutions delivers integrated communication between office terminals and mobile devices through the cloud, protecting against breaches with biometric identity authentication and other technologies. The company required a robust cloud to maintain instant communication, without compromising on security. It chose Atlantic.Net for support from skilled engineers and was rewarded for that decision with swift mitigation of multiple DDoS attacks.
Enhanced Security Features and Services for HIPAA Compliance
What makes a solution HIPAA compliant is a series of plans, measures, and commitments underpinned by enhanced security features and services.
Cybersecurity for HIPAA Compliance
The main security features of Atlantic.Net HIPAA Cloud are its fully managed firewall solutions and advanced intrusion prevention service (IPS). An IPS provides real-time threat monitoring, based on a continually-revised threat database, which is used to identify threats within the system based on their patterns or “signatures.” The firewall controls and protects access to the perimeter of the cloud and tracks a variety of metrics, such as the response rate for network gateways. Network security professionals take care of the monitoring, updating, and other tasks necessary to the firewall and IPS’s management, removing a significant source of potential risk, frustration, and man-hours from healthcare organizations who engage our HIPAA web hosting services.
In addition to our fully managed firewall and IPS, Atlantic.Net also includes fully encrypted Virtual Private Network (VPN) access to all of a business’s hosted servers. This helps satisfy the requirement that all data transmitted to a server with Protected Health Information (PHI) is sent over a secure and encrypted network.
While Atlantic.Net manages the firewall and other elements that combine to provide HIPAA compliance, customers can choose to manage their own host servers, and retain full visibility into their system or have Atlantic.Net’s expert engineers manage their servers, freeing up internal company resources to focus on core business directives.
HIPAA-compliant, access-controlled hosting
Storing your files in a HIPAA-compliant manner requires careful consideration of the parameters of the law and the ways in which the organization is specifically adhering to its requirements for comprehensive safeguards. At Atlantic.Net, our infrastructure is fully audited and compliant with HIPAA and HITECH, as well as adherent with SSAE 18 (formerly SSAE 16) from the American Institute of Certified Public Accountants.
HIPAA Cloud Computing Storage Requirements – HHS bottom-line needs for HIPAA-compliant cloud computing storage
First, know that the Cloud Computing Guidelines from the HHS state explicitly that cloud computing can be used for HIPAA-compliant platforms: “[W]hile a covered entity or business associate may use cloud-based services of any configuration (public, hybrid, private, etc.), provided it enters into a BAA [(business associate agreement)] with the CSP [(cloud service provider)], the type of cloud configuration to be used may affect the risk analysis and risk management plans of all parties and the resultant provisions of the BAA.”
Along with its reference to the need for a prudent BAA, the HIPAA rules also point to the importance of the service level agreement (SLA) to focus on data backup and disaster recovery; reliability and availability; limitations related to use or disclosure; how data will be transferred back to the customer if they depart; and adherence to required security precautions. Guidelines for the last element are within the Security Rule (part of HIPAA Title II, the Administrative Simplification Provisions).
If you want to abide by the Security Rule and properly protect the data, the cloud platform you choose should encrypt data whether it is in-transit or at-rest.
HIPAA Compliant Encryption: Advanced Encryption Standard 256-bit (AES-256)
The HIPAA-compliant cloud storage service provider’s system should also encrypt all data for backup, both during transmission and once stored. Each HIPAA-compliant backup should be encrypted with yet another set of keys for the best possible compliance solution. The best HIPAA-compliant cloud storage specifically approaches encryption with a 512-bit key determined with a sha256 hash algorithm delivered in XTS-plain64 cipher mode that abides by the AES-256 standard. Related to the 512 bits, 256 of them (half) are used for each of the two keys (cipher and XTS).
Managing HIPAA data storage encryption keys
A key management service (KMS) should be used that utilizes peer-to-peer replication. The KMS is a chief issue because, at a large scale, it can become unmanageable to rapidly encrypt, store, and decrypt data. The KMS that is implemented for the best HIPAA-compliant cloud storage serves as a centralized access control while providing simple monitoring and logging. The key-encryption key should be changed routinely, every 3 months. Multiple sets of keys should be stored. The best HIPAA-compliant cloud storage uses an active KEK for encryption and formerly active KEK sets for decryption. Access to the KEK sets should be at the level of each individual key, via a control list. The ability to access keys should be limited to users and services that are authenticated. All requests should be logged.
What Makes Atlantic.Net HIPAA Online Cloud Computing Storage Your Top Choice?
Atlantic.Net is the top choice for HIPAA Compliant Cloud Computing. Whether you need HIPAA storage scalability, geographic redundancy, reliable backup/data mirroring, or deduplication services to reduce your data footprint and costs, Atlantic.Net delivers all this plus the stability and security of working with an expert provider able to deliver advanced HIPAA storage solutions.
We are audited and certified to be HIPAA and HITECH-compliant.
We sign Business Associate Agreements.
We ensure high availability, high performance, scalability, flexibility, and simplistic pricing.
We provide a full line of Managed Security Services.
We operate a world-class data center infrastructure.
We are tested and trusted since 1994.
We were named the Best HIPAA Platform Provider for four years in a row.
We were awarded the Best Patient Data Security Solution award in 2019.
For more information about our HIPAA-Compliant Cloud Hosting, please contact us today!
Read More About HIPAA Compliance
HIPAA Compliance Checklist
How to Become HIPAA Compliant
What Is the HIPAA Security Rule?
Top Considerations for HIPAA File Storage
HIPAA Data Storage Requirements
Protecting e-PHI in the Cloud
What Is Healthcare Hosting?
What Is PHI?
### HIPAA-Compliant Hosting Requirements 2025 Healthcare Hosting Guide
What should you look for in a good HIPAA-compliant hosting provider? Healthcare hosting providers must comply with HIPAA, the Health Insurance Portability and Accountability Act of 1996, which means they must protect and secure patient records. When you look at HIPAA-compliant hosting providers, you want to know how HIPAA audit-ready the healthcare host is.
HIPAA-Compliant Hosting Services Checklist
The first step to ensure HIPAA compliance from your web hosting service is reviewing HIPAA-compliant hosting requirements with this handy 16-piece HIPAA Server Hosting Checklist (which covers the basics but is obviously not substantive enough for a comprehensive HIPAA compliance evaluation):
Full data security, management, and training strategies, on file
“A system of developing unique user IDs and passwords and procedures for login, logout, decryption and emergencies” (Blankenspoor)
Policies developed to control access to physical buildings and electronic systems containing protected health information (PHI)
Guidelines for how healthcare data is stored, transferred, trashed, and reimplemented
Audits and logs of system use (SSAE 18 and SOC audited infrastructure)
Rules for hosted data transmission in all possible scenarios (email, cloud, etc.)
Quality control for all hosted data (destroyed, changed, backed-up, etc.)
Dynamic data availability
A distinction between web, database, and production hosting servers
Antivirus and Multifactor Authentication
Management of OS (operating system) patching
Private IP (internet protocol) addresses and private hosted environment
SSL certificate encryption of all PHI
Disaster recovery and backup plans (Offsite backup)
Encrypted VPNs and private firewalls
Business Associate’s Agreement
Click here to find out more information on HIPAA hosting.
First-Class Healthcare HIPAA Hosting vs. Standard Hosting: What’s the Difference?
A hard fact of the Internet is that you need machines to be part of it – either on your own or as a service. If you are in the healthcare field and don’t want to set up servers for your HIPAA-compliant website hosting or other services in your own data center, you need HIPAA web hosting.
All hosting is not created equal. Because there is a disparity between security and other checks and balances from one system to another, standards were created to guide oversight of infrastructure and maintain proper protection of patient data. Those standards were developed by the US Health and Human Services Department (HHS), as directed by the Health Insurance Portability and Accountability Act of 1996 (HIPAA). Hence, beyond simple web hosting, anyone who is aiming to secure healthcare records in a healthcare hosting environment needs HIPAA-compliant hosting, sometimes called simply HIPAA hosting.
“HIPAA recognizes all health care providers and their business associates as covered entities (CEs) and makes them responsible to safeguard the privacy and security of identifying information." "Some CEs, particularly smaller sized CEs, don’t have the resources necessary to implement a system to handle and safeguard health data on their own, so they rely upon the services of HIPAA hosting.”
Jacco Blankenspoor of HIPAA HQ[i]
Any hosting provider can offer HIPAA-compliant hosting services as determined by its own understanding of the healthcare law; in other words, there is no official federal certification process for these business associates. The vetting of the quality of HIPAA hosting infrastructure that backs any hosted services must be determined by the healthcare-covered entities that use their services - that is to say, healthcare organizations are responsible for verifying the HIPAA compliance of the hosting services they contract.
The government also doesn’t recognize any third-party certification bodies for HIPAA hosting providers. That allows free competition in developing credibility and proving it through legitimate independent parties. However, it also means it’s your responsibility to know the quality of the certification body and what exactly is included in their HIPAA compliance auditing process.
Responsibilities for Safeguarding Electronic Protected Health Information Are Defined by the HIPAA Final Rule
Given the surrounding lack of standards for what qualifies as "HIPAA-compliant hosting," there is a positive for covered entities: Business associates (BAs - this includes HIPAA-compliant web hosting providers) are now responsible for data in the same manner as covered entities (healthcare providers, plans, and data clearinghouses) are – after implementation of the Omnibus HIPAA Final Rule (often called just the Final Rule or Omnibus Rule; activated March 26, 2013).
Following passage of the rule, business associates “are liable for PHI uses and disclosures and HIPAA Security Rule compliance.” “Additionally, BAs with their subcontractors, while BAs – not covered entities – are also now responsible for responding to any noncompliant subcontractors.”
Elizabeth Snell of HealthIT Security[ii]
Health and Human Services additionally created a process through which randomly chosen covered entities would be audited for HIPAA compliance, including adherence to the all-important Security, Privacy, and Breach Notification Rules.
What Is HITECH?
HITECH (the Health Information Technology for Economic and Clinical Health Act of 2009) was an effort to keep the transition to digital health data as safe as possible. While HITECH describes how electronic health records can be shared, HIPAA assigns responsibility for data security to any organization or individual that accesses and uses electronic protected health information (ePHI).
Specific security methods are at your discretion, though, to an extent. “[T]he HHS allows entities to implement their own chosen methods,” said Blankenspoor. “However, there are best practices used in the industry that the HHS would expect entities to make use of, or show that they are able to implement a comparable or better system.”
What Are Examples of Covered Entities and Business Associates?
The term "covered entity" specifically includes all healthcare providers, plans, and data clearinghouses operating in the United States. Like their business associates – contracted through a business associate agreement, per HIPAA – covered entities have to independently meet all HIPAA compliance rules.
The business associate agreement outlines responsibilities for protecting patient data between the covered entity and the business associate, and a business associate agreement is a must when choosing a HIPAA hosting provider.
Essentially, the covered entities are healthcare organizations and agencies that are more directly healthcare-related - that is, their core operations require the handling of protected health information (PHI). What is a business associate? HIPAA-compliant hosting services providers are one example of a business associate under HIPAA. Others requiring a business associate agreement include medical billing services and shredding companies.
HIPAA Violations Can Result in Jail Time
Like anything in business, a company might look at HIPAA and decide they are not going to invest in meeting its guidelines. Within the law, that refusal to comply is called willful neglect. Fines for this violation are $10,000-$50,000. The total a single company can be fined per year is $1.5 million. It’s also possible to be sentenced to jail time for willful neglect of HIPAA that results in sensitive data being exposed.
Neglect isn’t always considered willful. It is sometimes categorized as a reasonable cause. In these situations, 500 or more individual pieces of medical data have become exposed – resulting in $100-$50,000 fines for each violation. Note that these types of violations are never accompanied by jail time.
Top 11 HIPAA Fines by Settlement 2014-2024
Sources: Compliancy Group and the HIPAA Journal.
Note that 6 of the 11 largest HIPAA fines occurred in 2018, 2020, 2021, or 2024 with the largest HIPAA fine yet in 2018: a $16,000,000 fine against Anthem for a massive HIPAA data breach.
The HHS Audit Program
The random audits began with a pilot program that included 113 companies and other organizations. This pilot process allowed Health and Human Services to better understand best practices both for compliance and for non-compliance (i.e. how they should respond to violations).
“[Atlantic.Net's] financial strength and proven track record are something we view with great confidence.”
Joseph Nompleggi, Vice President, Complete Healthcare Solutions
What Is the HIPAA Security Rule?
In a nutshell, the Privacy Rule safeguards electronic health records. The Security Rule, however, is the especially pertinent one to HIPAA hosting because it sets more specific expectations for health data storage and transmission – i.e., the realm of ePHI (electronic Protected Health Information).
The HIPAA Security Rule is sectioned into Administrative Safeguards, Physical Safeguards, and Technological Safeguards. It has gradually become more prominent because of adaptations in the digital world and the expansion of different, newer technological methods.
“The same standards for the privacy and confidentiality of healthcare data apply to PHI and ePHI,” advised Blankenspoor, “but the processes used to keep data private are much more complex and technical for electronic data files and ePHI than they are for paper files.”
"The Health Insurance Portability and Accountability Act of 1996 (HIPAA) required the Secretary of the U.S. Department of Health and Human Services (HHS) to develop regulations protecting the privacy and security of certain health information.1 To fulfill this requirement, HHS published what are commonly known as the HIPAA Privacy Rule and the HIPAA Security Rule. The Privacy Rule, or Standards for Privacy of Individually Identifiable Health Information, establishes national standards for the protection of certain health information. The Security Standards for the Protection of Electronic Protected Health Information (the Security Rule) establish a national set of security standards for protecting certain health information that is held or transferred in electronic form. The Security Rule operationalizes the protections contained in the Privacy Rule by addressing the technical and non-technical safeguards that organizations called “covered entities” must put in place to secure individuals’ “electronic protected health information” (e-PHI). Within HHS, the Office for Civil Rights (OCR) has responsibility for enforcing the Privacy and Security Rules with voluntary compliance activities and civil money penalties."[iii]
How Can You Get Healthcare Hosting That's HIPAA-Compliant Right Now?
Are you evaluating HIPAA-compliant cloud hosting and storage providers for your business, but not sure where to start? Atlantic.Net's HIPAA-compliant hosting is HIPAA-Audited, HITECH-Audited, and backed by SSAE 18 (formerly SSAE 16) SOC 1 Type II and SOC 2 Type I reports. We can assist from healthcare hosting design to deployment so that you can continue to focus on your core business. Contact us today for a free healthcare hosting consultation.
[i] HIPAA compliant hosting explained
[ii] http://healthitsecurity.com
[iii] laws regulations
This article was updated with the latest content on April 3, 2025.
### Top 10 Firewalls in 2025 Choosing the Best Firewall Solution
What Is a Firewall?
A network firewall is the first line of defense for your business; it's the frontline against the ever-present threat of cyberattacks. With the rise of remote work and the increasing sophistication of hackers, choosing the right firewall is more critical than ever.
In this article, we will introduce the top 10 firewall solutions available on the market, from industry leaders like Cisco and Fortinet to open-source options like pfSense. We'll also explore Atlantic.Net's robust Web Application Firewall and how it can seamlessly integrate with your chosen firewall for comprehensive protection. Whether you're securing a small business or a large enterprise, this guide will help you find the perfect firewall to safeguard your network.
Top Firewall Solutions
Choosing the best firewall solution for your business or organization’s HIPAA Hosting or PCI Compliant Hosting can prove difficult. In this article, we have compiled a list of the top 10 firewalls on the market to help make this choice easier for you.
1. Atlantic.Net Web Application Firewall (WAF)
Atlantic.Net offers a robust Web Application Firewall as part of our Network Edge protection. The WAF examines web traffic looking for suspicious activity; it then automatically filters out illegitimate traffic based on rulesets that Atlantic.Net applies for you or custom rulesets applied at your request.
The WAF looks at both GET and POST-based HTTP requests and applies a rule set, such as the ModSecurity core rule set covering the OWASP Top 10 vulnerabilities, to determine what traffic to block, challenge or let pass. The WAF is perfect for web servers. It features intelligent protection that can block zero-day exploits at the firewall layer, giving your system admins time to plan the fixes to the server infrastructure.
2. Cisco’s ASA and vASA
The Cisco Adaptive Security Appliance (ASA) is a common sight in the data center as it is a unified threat management device, combining several network security functions in one appliance. ASA and vASA boast firewall, antivirus, intrusion protection, and VPN capabilities. The appliance is user-friendly, powerful, and super reliable. The only negative is a high price tag for the appliances and licensing.
The ASA product line contains several models, each with a different capacity and price point. The ASA is managed by an easy-to-use Adaptive Security Device Manager (ASDM). One of the most popular features is the near real-time Syslog viewer.
3. Juniper SRX and vSRX
SRX is Juniper Networks’ latest generation services platform. The firewall combines the advanced Junos operating system with popular security offerings on a high-speed, feature-rich platform. The Series Services Gateways are high-performance network security solutions for enterprises and service providers that deliver security, routing, and networking capabilities. It is also available as a virtual appliance known as vSRX.
4. Fortinet Fortigate
Fortinet FortiGate firewalls enable security-driven networking capabilities that focus on security, specifically its intrusion prevention system (IPS), web filtering, secure sockets layer (SSL) inspection, and automated threat protection. FortiGate’s next-generation firewalls provide high-performance, multilayered security and end-to-end protection across the network.
5. SonicWall
SonicWall next-gen firewalls feature advanced threat protection at the heart of the design, and SonicWall offers a range that is suitable for all businesses. The SOHO series is great for SMBs and branch offices, the NSa firewalls are great for big business, and the NSsp range is designed for the big players such as cloud providers and large distributed enterprise organizations. The SonicWall key feature is Real-Time Deep Memory Inspection (RTDMI) that uses deep learning to intelligently protect against vulnerabilities and ransomware.
6. Untangle NG Firewall
The Next-Gen (NG) Firewall comes in a light-free version or a fully-featured paid edition. It has probably the best-looking user interface out there with a robust, information-rich dashboard. Features can be enabled and disabled on demand, but most are behind a paywall, requiring a subscription to untangle services.
NG Firewall’s main features focus on securing web applications, preventing malware, phishing, and more. It has great filtering capabilities and a feature-rich analytics engine that can display exactly what you need from the logs.
7. Checkpoint
Checkpoint is another very popular maker of firewalls, arguably those with the best user interface: simple to use, but extremely powerful. The Check Point Firewall is part of the Software Blade architecture that supplies "next-generation" firewall features, including VPN, Intrusion Prevention, and mobile device connectivity.
Checkpoint was the first company to use stateful inspection of packets (what comes in must go out), and its firewalls are hugely popular in cloud architecture.
8. WatchGuard Firebox
Designed in Seattle, WatchGuard Firebox Firewalls come in 4 form factors. All Fireboxes are suitable for small- and medium-sized businesses. They offer VPN connectivity and PoE for effortlessly expanding WIFI network and SD-WAN connectivity. Security is paramount on WatchGuard firewalls, and these devices are feature packed with strong network throughput and enterprise-grade security out-of-the-box.
9. PFSense
PFSense is a hugely popular open-source distribution. PFSense offers software appliances and also sells enterprise firewalls to businesses. It’s a completely customizable distribution of FreeBSD specifically tailored for use as a firewall and router.
PFSense is entirely managed via web interface and includes a fully featured firewall, router, and VPN solution for network edge protection and cloud secure networking. You get stateful packet inspection, GeoIP blocking, anti-spoofing, NAT Mapping, policy-based routing, IPV6 support, an IPS, Packet Analyser, VPN, IPSec, Dynamic DNS, and so much more… not bad for free!
10. OPNSense
Another open-source firewall is OPNSense, another FreeBSD distribution. It is a direct fork from PFSense, so it shares many of the same features. It is a web application firewall that focuses on intrusion protection, application control, web filtering, and antivirus. OPNSense is primarily used in virtual installations, it’s lightweight and very responsive.
You also get extra features such as support for multi-WAN, VPN, hardware failover, and two-factor authentication; it also offers free web filtering with Sunny Valley Networks, which is rare in a firewall solution.
How Can Atlantic.Net Help?
Are you looking for a leading hosting provider to host your firewall solution? Look no further than Atlantic.Net. With over 30 years of proven experience, our full suite of managed services and always available professional support team can build the perfect solution for your business or organization. You can find out more about our leading Web Application Firewall here.
Atlantic.Net stands ready to help you attain fast compliance with a range of certifications, such as SOC 2 and SOC 3, HIPAA, and HITECH, all with 24x7x365 support, monitoring, and world-class data center infrastructure. For faster application deployment, free IT architecture design, and assessment, visit us at www.atlantic.net, call 888-618-DATA (3282), or email us at sales@atlantic.net.
Read More About Firewalls
Managed Firewall Service from Atlantic.Net
What Is a WAF?
Cloud Data Breaches
### Guide: RDP Access to Atlantic.Net Windows Server
Important Note: Before proceeding, ensure your Windows Server on Atlantic.Net is configured with a static public IP address and has RDP (Remote Desktop Protocol) enabled. Also, security best practices like using strong passwords and enabling Network Level Authentication (NLA) for RDP should be considered.
Method 1: RDP over 3389 (Direct, Public Internet)
This is the most straightforward but least secure method, suitable for temporary use or on trusted networks. All Atlantic.Net Windows Servers running the desktop experience have RDP configured out of the box.
Windows Server 2022 Datacenter (Desktop Experience)
Windows Server 2019 Datacenter (Desktop Experience)
Windows Server 2016 Datacenter (Desktop Experience)
Windows Server 2012 R2 Datacenter (Desktop Experience)
Step 1 - Obtain Server IP
Log into your Atlantic.Net control panel and find your Windows Server's public IP address. You will also find this on the automated email sent from Atlantic.Net and on the provisioning screen immediately after deploying a Windows Server.
Step 2 - Open RDP Client
On your local Windows machine, press Win + R, type "mstsc", and press Enter.
If you are using Linux, we recommend using Remmina.
Step 3 - Enter IP Details
In the RDP client, enter your server's public IP and click "Connect".
Step 4 - Authenticate
Provide the username and password for a user account with RDP permissions on the server. Atlantic.Net provides this information in the deployment email you get when you first deploy your Windows Server.
Method 2: WinRM (Windows Remote Management)
WinRM offers a PowerShell-based way to manage your server remotely, similar to SSH. To configure this, you will need to RDP to the server first or manage it via the Atlantic.Net VNC console.
Step 1 - Enable WinRM
On the Windows Server, open an elevated PowerShell Windows and type:
winrm quickconfig
This enables WinRM with default settings.
Tip: To open an elevated Powershell window, right-click on the Powershell icon.
Once enabled, you will get the following output:
Step 2 - Create New Inbound & Outbound Firewall Rule
Ensure your Atlantic.net firewall settings allow inbound traffic on port 5985 (HTTP) or 5986 (HTTPS) for WinRM.
Inbound Rule
New-NetFirewallRule -DisplayName "WinRM-HTTP" -Direction Inbound -Action Allow -Protocol TCP -LocalPort 5985
Outbound Rule
New-NetFirewallRule -DisplayName "WinRM-HTTPS" -Direction Inbound -Action Allow -Protocol TCP -LocalPort 5986
You will get the following output:
New-NetFirewallRule -DisplayName "WinRM-HTTP" -Direction Inbound -Action Allow -Protocol TCP -LocalPort 5985
Name : {b985530a-910d-4243-b483-e23b81013076}
DisplayName : WinRM-HTTP
Description :
DisplayGroup :
Group :
Enabled : True
Profile : Any
Platform : {}
Direction : Inbound
Action : Allow
EdgeTraversalPolicy : Block
LooseSourceMapping : False
LocalOnlyMapping : False
Owner :
PrimaryStatus : OK
Status : The rule was parsed successfully from the store. (65536)
EnforcementStatus : NotApplicable
PolicyStoreSource : PersistentStore
PolicyStoreSourceType : Local
RemoteDynamicKeywordAddresses : {}
PolicyAppId :
PS C:\Users\Administrator> New-NetFirewallRule -DisplayName "WinRM-HTTPS" -Direction Inbound -Action Allow -Protocol TCP -LocalPort 5986
Name : {91d8d840-0d61-407b-bf1e-5186841bf683}
DisplayName : WinRM-HTTPS
Description :
DisplayGroup :
Group :
Enabled : True
Profile : Any
Platform : {}
Direction : Inbound
Action : Allow
EdgeTraversalPolicy : Block
LooseSourceMapping : False
LocalOnlyMapping : False
Owner :
PrimaryStatus : OK
Status : The rule was parsed successfully from the store. (65536)
EnforcementStatus : NotApplicable
PolicyStoreSource : PersistentStore
PolicyStoreSourceType : Local
RemoteDynamicKeywordAddresses : {}
PolicyAppId :
Step 3 - Create PSSession
From a local Windows desktop or laptop machine, open PowerShell as Administrator and type the following to connect to your remote server:
$cred = Get-Credential # Enter server credentials
$session = New-PSSession -ComputerName -Credential $cred
You will be prompted for your credentials.
Step 4 - Execute Remote Commands on your Remote Server
You can now manage your remote server from the current shell session.
To test it, try running:
Invoke-Command -Session $session -ScriptBlock { Get-Process }
Method 3: SSH Tunnel (Most Secure)
This method encrypts RDP traffic within an SSH tunnel, making it ideal for untrusted networks. You'll need SSH access to an intermediary server—typically a jump box (e.g., a Linux server) that can reach your Windows Server. Alternatively, if you have a Linux laptop or Raspberry Pi, you can tunnel directly from there.
Option 1 - Create SSH Tunnel Direct from a Linux Server
If you don't have OpenSSH installed on your Windows Server, follow these steps:
Step 1 - Install OpenSSH on the Remote Windows Server
By default, SSH is not enabled on Windows Server. To enable it Open PowerShell as an administrator and Run the following command to install OpenSSH:
Add-WindowsCapability -Online -Name OpenSSH.Server~~~~0.0.1.0
Step 2 - Start and Enable SSHD service
Start the SSHD service and configure it to start automatically:
Start-Service sshd
Set-Service -Name sshd -StartupType 'Automatic'
Step 3 - Allow SSH traffic through the Windows firewall
Run this command in PowerShell as an administrator:
New-NetFirewallRule -Name sshd -DisplayName 'OpenSSH Server (sshd)' -Enabled True -Direction Inbound -Protocol TCP -Action Allow -LocalPort 22
Once SSH is set up on your Windows server, follow these steps on your Ubuntu machine to create the tunnel:
Step 4 - Use Terminal to Establish the SSH Tunnel
Open a terminal session on your local Linux Machine.
Use the following command to create the tunnel:
ssh -L 5985:localhost:5985 administrator@my-ip-address
You should get the following output:
ssh -L 5985:localhost:5985 administrator@my-ip-address
The authenticity of host 'my-ip-address (my-ip-address)' can't be established.
ED25519 key fingerprint is SHA256:VM41PWh85b91ZVTgIot0mqn3hCUV0vgJ4Lsut6OCLtc.
This key is not known by any other names
Are you sure you want to continue connecting (yes/no/[fingerprint])? yes
Warning: Permanently added 'my-ip-address' (ED25519) to the list of known hosts.
administrator@my-ip-address's password:
Microsoft Windows [Version 10.0.20348.2527]
(c) Microsoft Corporation. All rights reserved.
administrator@CLOUD-H35V3SGG8 C:\Users\Administrator>hostname
CLOUD-H35V3SGG8
You can now manage the remote server directly from your local terminal.
Option 2 - Create an SSH Tunnel from a Windows Machine via SSH Jumpbox
Step 1 - Install an SSH Client and Configure
Use a client like PuTTY or OpenSSH.
SSH -> Tunnels:
Source Port: 33389
Destination: your_server_IP:3389
Click "Add"
Step 2 - Set Port Forwarding
In your SSH client's settings, configure a local port (e.g., 33389) to forward to your Windows Server's IP and port 3389.
Step 3 - Establish SSH Connection
Connect to your intermediary server via SSH.
Step 4 - RDP to Localhost
Open your RDP client and connect to localhost:33389. Traffic will be securely tunneled to your Windows Server.
Troubleshooting
Firewall: Double-check firewall rules on both the Windows Server and any intermediary server (SSH tunnel).
Network: Ensure network connectivity between your local machine, intermediary server (if using), and the Windows Server.
Authentication: Verify you are using the correct credentials.
### How to Deploy MinIO on Ubuntu 24.04 - An Open-Source Object Storage Application
Whether you're managing data for a small business, a large enterprise, or personal projects, a reliable object storage system is essential. MinIO, an open-source object storage server, provides a solution that is not only powerful but also easy to deploy and manage.
In this guide, we'll walk you through the process of installing MinIO on Ubuntu 24.04.
Step 1 - Install MinIO
First, visit the MinIO server download page and download the latest deb file.
https://min.io/download#/linux
wget https://dl.min.io/server/minio/release/linux-amd64/minio
Once the package is downloaded, copy the downloaded file to the system location.
mv minio /usr/local/bin/minio
Step 2 - Configure MinIO
Next, create a user and group for MinIO:
groupadd -r minio-user
useradd -M -r -g minio-user minio-user
Next, create a data directory for MinIO:
mkdir /mnt/data
Then, change the ownership of the data directory and Minio binary.
chmod u+rxw /mnt/ /usr/local/bin/minio
chown -R minio-user /mnt/ /usr/local/bin/minio
Step 3 - Create a Systemd Service File for Minio
Now, create a systemd file to manage the Minio service.
nano /etc/systemd/system/minio.service
Add the following lines:
[Unit]
Description=MinIO High Performance Object Storage
Documentation=https://docs.min.io
Wants=network-online.target
After=network-online.target
[Service]
User=minio-user
Group=minio-user
WorkingDirectory=/mnt/data
ExecStart=/usr/local/bin/minio server /mnt/data --console-address ":9001"
Restart=always
RestartSec=5
# Set environment variables
Environment=MINIO_ROOT_USER=admin
Environment=MINIO_ROOT_PASSWORD=password
# Allow MinIO to bind to low ports if needed
CapabilityBoundingSet=CAP_NET_BIND_SERVICE
AmbientCapabilities=CAP_NET_BIND_SERVICE
NoNewPrivileges=true
[Install]
WantedBy=multi-user.target
Next, reload the systemd daemon to apply the changes:
systemctl daemon-reload
Start and enable the Minio service.
systemctl start minio
systemctl enable minio
Check the status of Minio:
systemctl status minio
Output:
● minio.service - MinIO High Performance Object Storage
Loaded: loaded (/etc/systemd/system/minio.service; disabled; preset: enabled)
Active: active (running) since Mon 2025-05-19 04:25:59 UTC; 53s ago
Docs: https://docs.min.io
Main PID: 18513 (minio)
Tasks: 7 (limit: 4609)
Memory: 214.8M (peak: 215.0M)
CPU: 709ms
CGroup: /system.slice/minio.service
└─18513 /usr/local/bin/minio server /mnt/data --console-address :9001
May 19 04:25:59 ubuntu systemd[1]: Started minio.service - MinIO High Performance Object Storage.
May 19 04:25:59 ubuntu minio[18513]: INFO: Formatting 1st pool, 1 set(s), 1 drives per set.
May 19 04:25:59 ubuntu minio[18513]: INFO: WARNING: Host local has more than 0 drives of set. A host failure will result in data becoming unavailable.
May 19 04:25:59 ubuntu minio[18513]: MinIO Object Storage Server
May 19 04:25:59 ubuntu minio[18513]: Copyright: 2015-2025 MinIO, Inc.
May 19 04:25:59 ubuntu minio[18513]: License: GNU AGPLv3 - https://www.gnu.org/licenses/agpl-3.0.html
May 19 04:25:59 ubuntu minio[18513]: Version: RELEASE.2025-04-22T22-12-26Z (go1.24.2 linux/amd64)
May 19 04:25:59 ubuntu minio[18513]: API: http://69.28.88.17:9000 http://127.0.0.1:9000
May 19 04:25:59 ubuntu minio[18513]: WebUI: http://69.28.88.17:9001 http://127.0.0.1:9001
May 19 04:25:59 ubuntu minio[18513]: Docs: https://docs.min.io
Step 4 - Access MinIO Web UI
Now, open your web browser and access the MinIO web UI using the URL http://your-server-ip:9000. You will see the MinIO login page:
Provide your admin username and password and click on Login. You will see the following page:
Click on the Buckets in the left pane and click on Create a Bucket. You will see the following page:
Define your bucket name and click on Create Bucket. You will see your bucket on the following page.
Conclusion
By following the steps outlined in this guide, you can quickly deploy MinIO on your Ubuntu server and start reaping the benefits of a modern, flexible, and efficient object storage system. Whether you're building a cloud-native application, managing backups, or simply looking for a reliable storage solution, MinIO offers a versatile and scalable platform that can meet your requirements. With its easy installation process, robust features, and compatibility with the Amazon S3 API, MinIO empowers users to take control of their data without the complexity and cost associated with proprietary solutions. You can now deploy your own online storage using MinIO on dedicated server hosting from Atlantic.Net!
### How to Install Zen Cart on Ubuntu 22.04
Zen Cart is an open-source software program that allows you to set up and manage an online store. It's free to use and considered user-friendly, making it a popular choice for those starting out with e-commerce. Zen Cart is a solid option for those looking for a free and easy-to-use platform to set up a basic online store.
In this tutorial, we will show you how to install Zen Cart on Ubuntu 22.04.
Step 1 - Install LAMP Server
First, install the Apache, MariaDB, PHP and other required PHP extensions using the following command:
apt install -y apache2 mariadb-server php php-cli php-common libapache2-mod-php php-curl php-zip php-gd php-mysql php-xml php-mbstring php-json php-intl
Next, edit the PHP configuration file:
nano /etc/php/8.1/apache2/php.ini
Change the default values of the following settings:
memory_limit = 512M
post_max_size = 128M
upload_max_filesize = 128M
date.timezone = America/Chicago
Save the file, then restart the Apache service to implement the changes.
systemctl restart apache2
Step 2 - Create a Database and User
First, log in to your MariaDB shell:
mysql
After the successful connection, create a database and user for Zen Cart:
CREATE DATABASE zencart;
CREATE USER 'zencart'@'localhost' IDENTIFIED BY 'password';
Next, grant all the privileges to Zen Cart.
GRANT ALL PRIVILEGES ON zencart. * TO 'zencart'@'localhost';
Next, flush the privileges and exit from the MariaDB shell:
FLUSH PRIVILEGES;
EXIT;
Step 3 - Download Zen Cart
First, go to the Zen Cart official download page and download the latest Zen Cart archive.
wget https://github.com/zencart/zencart/archive/refs/tags/v2.0.0.zip --no-check-certificate
Then, unzip the downloaded archive:
unzip v2.0.0.zip
Next, move the extracted directory to the Apache web root:
mv zencart-2.0.0 /var/www/html/zencart
Next, copy the Zen Cart sample configuration file.
cp /var/www/html/zencart/includes/dist-configure.php /var/www/html/zencart/includes/configure.php
Next, change the ownership and permission of the Zen Cart directory.
chown -R www-data:www-data /var/www/html/zencart
find /var/www/html/zencart/ -type d -exec chmod 755 {} \;
find /var/www/html/zencart/ -type f -exec chmod 644 {} \;
Step 4 - Create an Apache Virtual Host
Next, you will need to create an Apache virtual host configuration file for Zen Cart.
nano /etc/apache2/sites-available/zencart.conf
Add the following content:
ServerAdmin admin@example.com
DocumentRoot /var/www/html/zencart/
ServerName zencart.example.com
Options FollowSymLinks
AllowOverride All
Order allow,deny
Allow from all
ErrorLog /var/log/apache2/example.com-error_log
CustomLog /var/log/apache2/example.com-access_log common
Save the file then activate the Zen Cart virtual host.
a2ensite zencart.conf
Finally, restart the Apache service to apply the changes.
systemctl restart apache2
Step 5 - Access Zen Cart Web Interface
Now, open your web browser and access the Zen Cart UI using the URL http://zencart.example.com. You will see the following page:
Click on CLICK HERE. You will see the system inspection page:
Click on Continue. You will see the License Agreement and settings page:
Accept the License Agreement, define other necessary settings, and click on Continue. You will see the database setup page:
Provide your database credentials and click on Continue. You will see the admin setup page:
Set your admin username, email, and password, and click on Continue. You will see the following page:
Now, delete the installation directory from your server using the following command.
rm -rf /var/www/html/zencart/zc_install
Next, click on the Admin Dashboard link. You will see the following page:
Provide your admin username and password and click on Submit. You will see the password reset page:
Change your admin password and click on Submit. You will see the Initial Setup page.
Provide your store information and click on Update. You will see the Zen Cart dashboard.
Conclusion
Zen Cart offers a powerful and flexible solution for e-commerce, and with this guide, you can confidently set it up on your Ubuntu 22.04 server. Whether you are setting up a new store or migrating an existing one, you now have the knowledge to manage your installation effectively. Enjoy the capabilities of Zen Cart and start building your online presence today! You can now host your own online store using Zen Cart on dedicated server hosting from Atlantic.Net!
### How to Install Textpattern on Ubuntu 22.04
Textpattern is a flexible, open-source content management system (CMS) designed for web developers, designers, and content creators. It is known for its simplicity, ease of use, and powerful features that enable users to manage content efficiently. Whether you are building a simple blog or a complex business website, Textpattern provides the tools and features to manage your content effectively.
In this tutorial, we will show you how to install Textpattern CMS on Ubuntu 22.04.
Step 1 - Install LEMP Stack
Textpattern requires a LEMP stack to be installed on your server. If not installed, you can install it using the following command.
apt install -y nginx mariadb-server php php-fpm php-xml php-mysql php-json php-mbstring php-zip unzip
Once the LEMP stack is installed, start and enable the Nginx and MariaDB services.
systemctl start mariadb nginx
systemctl enable mariadb nginx
Step 2 - Create a Database and User
Textpattern uses MariaDB/MySQL as a database backend. First, connect to the MariaDB console.
mysql
Once you are connected to the MariaDB shell, create a database and user for Textpattern.
CREATE DATABASE textpattern_db;
CREATE USER textpattern_user IDENTIFIED BY 'password';
Next, grant all the privileges to the Textpattern database.
GRANT ALL PRIVILEGES ON textpattern_db.* TO textpattern_user;
Next, flush the privileges and exit from the MariaDB console.
FLUSH PRIVILEGES;
EXIT;
Step 3 - Download Textpattern
Next, visit the Textpattern official website and download the latest version of Textpattern using the following command.
wget https://textpattern.com/file_download/118/textpattern-4.8.8.zip
Once Textpattern is downloaded, unzip it using the following command.
unzip textpattern-4.8.8.zip
Next, move the extracted directory to Nginx web root.
mv textpattern-4.8.8 /var/www/html/textpattern
Next, change the ownership of the Textpattern directory.
chown -R www-data:www-data /var/www/html/textpattern
Step 4 - Configure Nginx
To configure Nginx for Textpattern, you'll need to set up Nginx as your web server, create a new server block for your Textpattern site, and adjust the configuration to ensure it works correctly with Textpattern.
nano /etc/nginx/conf.d/textpattern.conf
Add the following configuration:
server {
listen 80;
server_name textpattern.example.com;
root /var/www/html/textpattern;
index index.php;
location ~* \.php$ {
fastcgi_pass unix:/run/php/php8.1-fpm.sock;
include fastcgi_params;
fastcgi_param SCRIPT_FILENAME $document_root$fastcgi_script_name;
fastcgi_param SCRIPT_NAME $fastcgi_script_name;
}
}
Save and close the file, then edit the Nginx main configuration file.
nano /etc/nginx/nginx.conf
Add the following line after the line http {:
server_names_hash_bucket_size 64;
Now, verify the Nginx for any syntax configuration error.
nginx -t
Output:
nginx: the configuration file /etc/nginx/nginx.conf syntax is ok
nginx: configuration file /etc/nginx/nginx.conf test is successful
Finally, restart the Nginx service to apply the changes.
systemctl restart nginx
Step 5 - Access Textpattern Web UI
Now, open your web browser and access the Textpattern web interface using the URL http://textpattern.example.com/textpattern/setup/. You will see the following page:
Select your language and click on Submit. You will see the database configuration page:
Define your database details and click on the Next. You will see the following page:
Now, copy the content from the above page, create a new configuration file at /var/www/html/textpattern/textpattern/config.php, and paste this content to this file.
Next, go back to your web browser and click on I did it. You will see the following page.
Set your admin username, email, and password, and click on Next. You will see the following page.
Click on Log in now. You will see the Textpattern login page.
Provide your admin username and password and click on Log in. You will see the following page:
Enter your blog title and description and click on the Publish button. Then, click on My Site to see your newly published blog post.
Conclusion
Textpattern is a powerful yet user-friendly CMS that caters to a wide range of website needs. Its flexibility, extensibility, and adherence to web standards make it a solid choice for developers and content creators looking for a robust content management solution. You can try Textpattern CMS on dedicated server hosting from Atlantic.Net!
### How to Install HAProxy on Ubuntu 24.04
HAProxy, which stands for High Availability Proxy, is a free, open-source software solution that provides a reliable, high-performance load balancer and proxy server for TCP and HTTP-based applications. It is commonly used to improve the performance and reliability of web applications by distributing incoming traffic across multiple servers.
In this tutorial, we will show you how to install HAProxy on Ubuntu 24.04.
Step 1 - Setting Up Backend Servers
Before starting, you will need to set up Apache on both backend servers.
Log in to both your servers and install the Apache package using the following command.
apt-get install apache2 -y
Once the Apache package is installed, create an index.html file on both web servers.
echo "
This is my first Apache Server
" | tee /var/www/html/index.html
echo "
This is my second Apache Server
" | tee /var/www/html/index.html
Step 2 - Install HAProxy
By default, the HAProxy package is included in the Ubuntu default repository. You can install it using the following command.
apt-get install haproxy -y
Next, check the installed version to verify that HAProxy is installed correctly.
haproxy -v
You should see an output showing the HAProxy version.
HAProxy version 2.8.5-1ubuntu3.3 2025/04/09 - https://haproxy.org/
Next, start and enable the HAProxy service.
systemctl start haproxy
systemctl enable haproxy
Step 3 - Configure HAProxy
Edit the HAProxy configuration file to set up a basic configuration. The default configuration file is located at /etc/haproxy/haproxy.cfg.
nano /etc/haproxy/haproxy.cfg
Add the following lines:
frontend haproxy-main
bind *:80
option forwardfor
default_backend apache_webservers
backend apache_webservers
balance roundrobin
server websvr1 192.168.1.10:80 check
server websvr2 192.168.1.11:80 check
The frontend section defines where HAProxy listens for incoming traffic (port 80 in this case).
The backend section specifies the servers that the traffic should be distributed to.
Note: Replaced 192.168.1.10 and 192.168.1.11 with the IP address of your backend Apache web servers.
Step 4 - Setup HAProxy Authentication
To configure authentication for the HAProxy statistics page on port 8800 and set up a backend for your Apache web servers, you can use the following configuration. This example includes the listen section for the stats page with basic authentication and a backend section for your Apache servers.
Edit the haproxy.cfg file.
nano /etc/haproxy/haproxy.cfg
Add the following lines:
listen stats
bind :8800
stats enable
stats uri /
stats hide-version
stats auth admin:password
default_backend apache_webservers
Save and close the file, then restart the HAProxy service to apply the changes.
systemctl restart haproxy
Now, verify the status of HAProxy using the command given below:
systemctl status haproxy
Output:
● haproxy.service - HAProxy Load Balancer
Loaded: loaded (/lib/systemd/system/haproxy.service; enabled; vendor preset: enabled)
Active: active (running) since Sat 2025-05-11 12:32:27 IST; 9s ago
Docs: man:haproxy(1)
file:/usr/share/doc/haproxy/configuration.txt.gz
Process: 44208 ExecStartPre=/usr/sbin/haproxy -Ws -f $CONFIG -c -q $EXTRAOPTS (code=exited, status=0/SUCCESS)
Main PID: 44210 (haproxy)
Tasks: 5 (limit: 9188)
Memory: 70.0M
CPU: 78ms
CGroup: /system.slice/haproxy.service
├─44210 /usr/sbin/haproxy -Ws -f /etc/haproxy/haproxy.cfg -p /run/haproxy.pid -S /run/haproxy-master.sock
└─44212 /usr/sbin/haproxy -Ws -f /etc/haproxy/haproxy.cfg -p /run/haproxy.pid -S /run/haproxy-master.sock
May 11 12:32:27 ubuntupc systemd[1]: Starting HAProxy Load Balancer...
May 11 12:32:27 ubuntupc haproxy[44210]: [NOTICE] (44210) : New worker #1 (44212) forked
May 11 12:32:27 ubuntupc systemd[1]: Started HAProxy Load Balancer.
Step 5 - Test HAProxy
Open a web browser and navigate to your server's IP address http://your-haproxy-ip. You should be able to see the Apache page if your backend servers are configured correctly.
To view HAProxy statistics, navigate to http://your_haproxy_ip:8080/ and log in with the credentials defined in the configuration file (admin:password in this example).
Conclusion
HAProxy is a powerful and flexible tool for load balancing and improving the availability and performance of web applications and services. Its wide range of features and configurations makes it suitable for various use cases, from simple load balancing to complex routing and traffic management tasks. You can now deploy HAProxy on dedicated server hosting from Atlantic.Net! to load balance your web server.
### How to Install Wiki.js on Ubuntu 24.04
Wiki.js is a powerful, flexible, and modern open-source wiki application designed to help you manage your documentation and knowledge base effectively. Built on Node.js, it offers a sleek user interface, extensive customization options, and seamless integration with various authentication systems and data sources.
This guide will walk you through the steps to install Wiki.js on Ubuntu 24.04.
Step 1 - Install Node.js
First, install the necessary dependencies using the following command.
apt-get install -y ca-certificates curl gnupg
Next, download the Node.js GPG key.
mkdir -p /etc/apt/keyrings
curl -fsSL https://deb.nodesource.com/gpgkey/nodesource-repo.gpg.key | gpg --dearmor -o /etc/apt/keyrings/nodesource.gpg
Next, add the NodeSource repo to the APT source list.
echo "deb [signed-by=/etc/apt/keyrings/nodesource.gpg] https://deb.nodesource.com/node_22.x nodistro main" | tee /etc/apt/sources.list.d/nodesource.list
Then, update the repository index and install Node.js with the following command.
apt update
apt-get install -y nodejs
Next, verify the Node.js version using the following command.
node -v
Output.
v22.15.1
Step 2 - Install and Configure MariaDB Database
Wiki.js uses MariaDB as its database. You can install the MariaDB server with the following commands:
apt install mariadb-server -y
Once the MariaDB is installed, connect to the MariaDB shell using the following command.
mysql
Next, create a database and user for Wiki.js.
CREATE DATABASE wikijs;
GRANT ALL on wikijs.* to wikijs@localhost identified by 'password';
Next, flush the privileges and exit from the MariaDB shell.
FLUSH PRIVILEGES;
EXIT;
Step 3 - Install Wiki.js
First, create a dedicated user for Wiki.js.
useradd -m -d /opt/wikijs -U -r -s /bin/bash wikijs
Log in to your wikijs user:
su - wikijs
Download the latest version of Wiki.js:
wget https://github.com/Requarks/wiki/releases/latest/download/wiki-js.tar.gz
Extract the downloaded file.
tar -xzvf wiki-js.tar.gz
Copy the sample configuration file.
cp -a config.sample.yml config.yml
Edit the sample configuration file.
nano config.yml
Define your database settings:
db:
type: mariadb
# PostgreSQL / MySQL / MariaDB / MS SQL Server only:
host: localhost
port: 3306
user: wikijs
pass: password
db: wikijs
Save and close the file then exit from the Wiki.js user.
exit
Step 4 - Create a Systemd Service
To ensure Wiki.js runs as a service and starts on boot, create a systemd service file:
nano /etc/systemd/system/wikijs.service
Add the following content to the file:
[Unit]
Description=Wiki.js
After=network.target
[Service]
Type=simple
ExecStart=/usr/bin/node server
Restart=always
User=wikijs
Environment=NODE_ENV=production
WorkingDirectory=/opt/wikijs
[Install]
WantedBy=multi-user.target
Reload the systemd daemon to apply the new service file:
systemctl daemon-reload
Enable and start the Wiki.js service:
systemctl enable --now wikijs
Step 4 - Configure Nginx as a Reverse Proxy
If you want to serve Wiki.js through a domain and use Nginx as a reverse proxy, install Nginx first:
apt install nginx
Create a new Nginx configuration file:
nano /etc/nginx/conf.d/wiki.conf
Add the following configuration:
server {
listen 80;
server_name wikijs.example.com;
root /opt/wikijs;
location / {
proxy_pass http://127.0.0.1:3000;
proxy_http_version 1.1;
proxy_set_header Upgrade $http_upgrade;
proxy_set_header Connection "upgrade";
proxy_set_header Host $host;
proxy_set_header X-Real-IP $remote_addr;
proxy_set_header X-Forwarded-For $proxy_add_x_forwarded_for;
proxy_set_header X-Forwarded-Proto $scheme;
}
}
Edit the Nginx main configuration file:
nano /etc/nginx/nginx.conf
Add the following lines after the line http {:
server_names_hash_bucket_size 64;
Save the file then restart the Nginx service to apply the changes.
systemctl restart nginx
Step 5 - Access Wiki.js
Open a web browser and navigate to http://wikijs.example.com. You will see the following page:
Set your email, password, and site URL, and click on INSTALL. You will be redirected to the Wiki.js login page:
Provide your email and password and click on Log in. You will see the following page:
Click on ADMINISTRATION. You will see the Wiki.js dashboard.
Conclusion
Installing Wiki.js on Ubuntu 24.04 is a comprehensive process that involves setting up the necessary software stack, configuring your environment, and deploying the application. By carefully following each step, from updating your system and installing Node.js, MariaDB, and other dependencies, to configuring Wiki.js and ensuring it runs as a service, you can achieve a smooth and efficient installation. With Wiki.js up and running, you now have a modern and feature-rich platform for managing your documentation and knowledge base. This setup not only enhances collaboration and information sharing but also provides a scalable solution that can grow with your needs. Let's deploy Wiki.js on dedicated server hosting from Atlantic.Net!
### How to Install Froxlor Server Management Panel on Ubuntu 22.04
Froxlor is an open-source server management panel that provides an intuitive and user-friendly web interface for managing various aspects of web hosting servers. It is designed to help system administrators and web hosting providers efficiently manage server configurations, domains, email accounts, databases, and other server-related tasks. Froxlor is free to use, which can significantly reduce the costs associated with server management. It provides a viable alternative to commercial server management panels without compromising on features and functionality.
In this tutorial, we will show you how to install Froxlor server management panel on Ubuntu 22.04.
Step 1 - Install Required Dependencies
First, install the necessary dependencies for Froxlor using the following command:
apt -y install gnupg2 apt-transport-https lsb-release curl ca-certificates apache2
Step 2 - Add Froxlor Repository
Download the Froxlor GPG key and add the Froxlor repository to your system:
curl -sSLo /usr/share/keyrings/deb.froxlor.org-froxlor.gpg https://deb.froxlor.org/froxlor.gpg
Add the repository to your sources list:
sh -c 'echo "deb [signed-by=/usr/share/keyrings/deb.froxlor.org-froxlor.gpg] https://deb.froxlor.org/ubuntu $(lsb_release -sc) main" > /etc/apt/sources.list.d/froxlor.list'
Step 3 - Install Froxlor
Update the package list and install Froxlor:
apt update
apt install froxlor -y
Step 4 - Configure MySQL
Froxlor requires a MySQL database. You will need to create a new user and database for Froxlor.
First, connect to MySQL.
mysql
Create a user and database for Froxlor:
CREATE USER 'froxroot'@'localhost' IDENTIFIED BY 'password';
GRANT ALL PRIVILEGES ON *.* TO 'froxroot'@'localhost' WITH GRANT OPTION;
Flush the privileges and exit from the MySQL shell:
FLUSH PRIVILEGES;
EXIT;
Step 5 - Install PHP GNUPG Extension
To ensure Froxlor operates correctly, install the PHP GNUPG extension:
apt install php-gnupg -y
Restart the Apache web server to apply the changes:
systemctl restart apache2
Check the status of the Apache service to ensure it is running:
systemctl status apache2
You should see an output indicating that the Apache service is active and running.
● apache2.service - The Apache HTTP Server
Loaded: loaded (/lib/systemd/system/apache2.service; enabled; vendor preset: enabled)
Active: active (running) since Wed 2024-06-05 12:14:57 UTC; 25s ago
Docs: https://httpd.apache.org/docs/2.4/
Process: 69486 ExecStart=/usr/sbin/apachectl start (code=exited, status=0/SUCCESS)
Main PID: 69490 (apache2)
Tasks: 6 (limit: 4579)
Memory: 14.9M
CPU: 55ms
CGroup: /system.slice/apache2.service
├─69490 /usr/sbin/apache2 -k start
├─69491 /usr/sbin/apache2 -k start
├─69492 /usr/sbin/apache2 -k start
├─69493 /usr/sbin/apache2 -k start
├─69494 /usr/sbin/apache2 -k start
└─69495 /usr/sbin/apache2 -k start
Step 6 - Access Froxlor Web Installer
Open your web browser and navigate to http://your-server-ip/froxlor to access the Froxlor web installer. You will see the following page:
Click on the Start install. You will see the system check page.
Click on Start installation. You will see the database setup page.
Define your database name and password and click on Next. You will see the admin setup page.
Set your admin user, password, and email and click on Next. You will see the server setup page.
Set your server IP, domain name, and enable SSL and click on Next. You will see the following page.
Copy the command from the above page and run it on your server console to finish the installation.
/var/www/html/froxlor/bin/froxlor-cli froxlor:install -c 'eyJteXNxbF9ob3N0IjoibG9jYWxob3N0IiwibXlzcWxfdW5wcml2aWxlZ2VkX3VzZXIiOiJmcm94bG9yIiwibXlzcWxfdW5wcml2aWxlZ2VkX3Bhc3MiOiJwYXNzd29yZCIsIm15c3FsX2RhdGFiYXNlIjoiZnJveHJvb3QiLCJteXNxbF9yb290X3VzZXIiOiJmcm94cm9vdCIsIm15c3FsX3Jvb3RfcGFzcyI6InBhc3N3b3JkIiwibXlzcWxfc3NsX2NhX2ZpbGUiOiIiLCJteXNxbF9zc2xfdmVyaWZ5X3NlcnZlcl9jZXJ0aWZpY2F0ZSI6IjEifQ=='
/var/www/html/froxlor/bin/froxlor-cli froxlor:config-services -a '{"distro":"jammy","dns":"x","http":"apache24","smtp":"postfix_dovecot","mail":"dovecot_postfix2","ftp":"proftpd","system":["cron","libnssextrausers","logrotate","goaccess","php-fpm"]}' --yes-to-all
Go back to your web browser, you will see the Froxlor login page.
Enter your Froxlor admin username and password and click on Login. You will see the Froxlor dashboard.
Conclusion
You have now successfully installed and configured the Froxlor server management panel on Ubuntu 22.04. This powerful tool will help you manage your server more efficiently through its user-friendly web interface. For more information and advanced configurations, refer to the Froxlor documentation. You can now host your own server management panel using Froxlor on dedicated server hosting from Atlantic.Net!
### How to Install CloudPanel on Ubuntu 22.04
Managing cloud servers efficiently can be a daunting task without the right tools. CloudPanel, a modern and user-friendly control panel, simplifies this process by offering a powerful interface to manage cloud infrastructure. Designed specifically for cloud environments, CloudPanel provides an array of features that streamline server administration, making it a popular choice for developers and system administrators alike.
This guide will walk you through the step-by-step process of installing CloudPanel on Ubuntu 22.04.
Step 1 - Install Necessary Dependencies
Before installing CloudPanel, you need to ensure that your server has all the necessary dependencies. These dependencies include gnupg2 and curl, which are essential for the installation process.
Open your terminal and execute the following command to install these dependencies:
apt install -y gnupg2 curl
Step 2 - Download and Execute the CloudPanel Installer
With the dependencies installed, the next step is to download and execute the CloudPanel installer script. This script will handle the entire installation process, setting up CloudPanel on your server.
First, use curl to download the installer script:
curl -sS https://installer.cloudpanel.io/ce/v2/install.sh -o install.sh
Once the script is downloaded, execute it using bash:
bash install.sh
After running the installer script, CloudPanel will be installed on your server. The installation process will take a few minutes as it sets up all the necessary components and configurations.
Once the installation is complete, you should see a message indicating that CloudPanel has been successfully installed. The message will also provide the URL to access CloudPanel.
~~~~~~~~~~~~~~~~~~~~~~~~~~~~~~~~~~~~~~~~~~~~~~~~~~~~~~~~~~~~
The installation of CloudPanel is complete!
CloudPanel can be accessed now: https://YOUR_SERVER_IP:8443
~~~~~~~~~~~~~~~~~~~~~~~~~~~~~~~~~~~~~~~~~~~~~~~~~~~~~~~~~~~~
Step 3 - Access CloudPanel
After successfully installing CloudPanel on your Ubuntu 22.04 server, the next step is to access the CloudPanel Web UI. This interface allows you to manage your cloud servers and services easily.
Open your web browser and access the CloudPanel web interface using the URL https://your-server-ip:8443. Since CloudPanel uses a self-signed SSL certificate by default, you might see a security warning in your browser indicating that the connection is not private. This is normal for self-signed certificates.
In Chrome, click on "Advanced" and then "Proceed to [your-server-ip] (unsafe)". You will be presented with the CloudPanel user creation screen.
Provide your name, username, password, and email and click on Create User. You will see the CloudPanel login screen.
Provide your admin credentials and click on Log In. You will see the CloudPanel Dashboard.
Click on ADD SITE to create a new site on CloudPanel. You will see the following screen.
Click on "Create a WordPress Site." You will see the following screen.
Provide your WordPress site details and click on Create. You will see the following screen.
Click on Back to Sites. You will see your newly added WordPress site.
Conclusion
Installing CloudPanel on Ubuntu 22.04 is a straightforward process that significantly enhances your ability to manage cloud servers. With just a few commands, you can set up a robust control panel that simplifies server administration and boosts productivity. Whether you are hosting websites, deploying applications, or managing various services, CloudPanel provides an intuitive interface that makes these tasks more manageable. By following the steps outlined in this guide, you now have CloudPanel installed and ready to use, allowing you to take full advantage of its powerful features and streamline your cloud server management. You can now host your own server panel on dedicated server hosting from Atlantic.Net!
### How to Install Uptime Kuma on Ubuntu 24.04
Uptime Kuma is a self-hosted, open-source monitoring tool that helps you keep track of the uptime and status of your websites, servers, and applications. It provides real-time status updates, notifications, and detailed reports on the availability and performance of your monitored services. Uptime Kuma is designed to be a modern and flexible alternative to other uptime monitoring solutions.
This guide will walk you through the process of installing Uptime Kuma on an Ubuntu 24.04 system.
Step 1 - Install Nodejs
Before starting, you will need to install Nodejs on your server. Follow the steps below to install the latest stable version of Node.js.
First, create a directory to store the Nodejs GPG key.
mkdir -p /etc/apt/keyrings
Download the Nodejs GPG key to the above directory.
curl -fsSL https://deb.nodesource.com/gpgkey/nodesource-repo.gpg.key | sudo gpg --dearmor -o /etc/apt/keyrings/nodesource.gpg
Add the Nodejs repository to the APT source file.
echo "deb [signed-by=/etc/apt/keyrings/nodesource.gpg] https://deb.nodesource.com/node_22.x nodistro main" | sudo tee /etc/apt/sources.list.d/nodesource.list
Update the repository index.
apt update
Finally, install the Nodejs using the following command:
apt install nodejs
After the installation, you can verify the Nodejs version using the following command:
node --version
Output:
v22.15.1
Step 2 - Install and Setup Uptime Kuma
First, clone the Uptime Kuma repository from GitHub.
git clone https://github.com/louislam/uptime-kuma.git
Navigate to the uptime-kuma directory and run the setup script using npm:
cd uptime-kuma
npm run setup
Step 3 - Install PM2 for Process Management
PM2 is a process manager for Node.js applications that allows you to keep your app running in the background and restart it if it crashes. Install PM2 globally:
npm install pm2 -g
Install the PM2 log rotation module to manage log files efficiently:
pm2 install pm2-logrotate
You should see output similar to this:
┌────┬──────────────────┬─────────────┬─────────┬─────────┬──────────┬────────┬──────┬───────────┬──────────┬──────────┬──────────┬──────────┐
│ id │ name │ namespace │ version │ mode │ pid │ uptime │ ↺ │ status │ cpu │ mem │ user │ watching │
└────┴──────────────────┴─────────────┴─────────┴─────────┴──────────┴────────┴──────┴───────────┴──────────┴──────────┴──────────┴──────────┘
Module
┌────┬──────────────────────────────┬───────────────┬──────────┬──────────┬──────┬──────────┬──────────┬──────────┐
│ id │ module │ version │ pid │ status │ ↺ │ cpu │ mem │ user │
├────┼──────────────────────────────┼───────────────┼──────────┼──────────┼──────┼──────────┼──────────┼──────────┤
│ 0 │ pm2-logrotate │ 2.7.0 │ 87179 │ online │ 0 │ 0% │ 11.0mb │ root │
└────┴──────────────────────────────┴───────────────┴──────────┴──────────┴──────┴──────────┴──────────┴──────────┘
Step 4 - Start Uptime Kuma with PM2
Start the Uptime Kuma server using PM2:
pm2 start server/server.js --name uptime-kuma
You should see output similar to this:
[PM2] Starting /root/uptime-kuma/server/server.js in fork_mode (1 instance)
[PM2] Done.
┌────┬──────────────────┬─────────────┬─────────┬─────────┬──────────┬────────┬──────┬───────────┬──────────┬──────────┬──────────┬──────────┐
│ id │ name │ namespace │ version │ mode │ pid │ uptime │ ↺ │ status │ cpu │ mem │ user │ watching │
├────┼──────────────────┼─────────────┼─────────┼─────────┼──────────┼────────┼──────┼───────────┼──────────┼──────────┼──────────┼──────────┤
│ 1 │ uptime-kuma │ default │ 1.23.13 │ fork │ 87203 │ 0s │ 0 │ online │ 0% │ 5.7mb │ root │ disabled │
└────┴──────────────────┴─────────────┴─────────┴─────────┴──────────┴────────┴──────┴───────────┴──────────┴──────────┴──────────┴──────────┘
Module
┌────┬──────────────────────────────┬───────────────┬──────────┬──────────┬──────┬──────────┬──────────┬──────────┐
│ id │ module │ version │ pid │ status │ ↺ │ cpu │ mem │ user │
├────┼──────────────────────────────┼───────────────┼──────────┼──────────┼──────┼──────────┼──────────┼──────────┤
│ 0 │ pm2-logrotate │ 2.7.0 │ 87179 │ online │ 0 │ 0% │ 52.3mb │ root │
└────┴──────────────────────────────┴───────────────┴──────────┴──────────┴──────┴──────────┴──────────┴──────────┘
Check the status of the process to ensure it's running correctly:
pm2 status
To ensure Uptime Kuma starts on system boot, configure PM2 with the following command:
pm2 startup
Step 5 - Install and Configure Nginx
To make Uptime Kuma accessible via a web domain, we will use Nginx as a reverse proxy. First, install Nginx:
apt install nginx -y
Create a new Nginx configuration file for Uptime Kuma:
nano /etc/nginx/conf.d/kuma.conf
Add the following configuration to the file:
server {
listen 80;
server_name kuma.example.com;
location / {
proxy_pass http://localhost:3001;
proxy_http_version 1.1;
proxy_set_header Upgrade $http_upgrade;
proxy_set_header Connection "upgrade";
proxy_set_header Host $host;
}
}
Edit the Nginx main configuration file and set max hash bucket size:
nano /etc/nginx/nginx.conf
Add the following line after http {:
server_names_hash_bucket_size 64;
Test the Nginx configuration for syntax errors:
nginx -t
You should see the following output if the configuration is correct:
nginx: the configuration file /etc/nginx/nginx.conf syntax is ok
nginx: configuration file /etc/nginx/nginx.conf test is successful
Restart Nginx to apply the changes:
systemctl restart nginx
Step 6 - Access Uptime Kuma
You can now access your Uptime Kuma instance through your web browser by navigating to http://kuma.example.com. You will see the account creation page.
Define your admin username, password and click on Create. You will see the Uptime Kuma dashboard.
Conclusion
Congratulations! You have successfully installed and configured Uptime Kuma on Ubuntu 24.04. Uptime Kuma is now running behind Nginx and can be accessed via your configured domain. This setup ensures that your monitoring tool is robust, easy to manage, and ready to alert you in case of any issues with your websites or servers. You can now monitor your application using Uptime Kuma on dedicated server hosting from Atlantic.Net!
### How to Install Ruby on Rails on Ubuntu 22.04
Ruby on Rails, commonly referred to as Rails, is a popular open-source web application framework written in Ruby, a dynamic, object-oriented programming language. Rails follows the Model-View-Controller (MVC) architectural pattern, which separates an application into three main logical components: models for handling data and business logic, views for rendering user interfaces, and controllers for handling user requests and coordinating interactions between the model and view.
In this tutorial, we will show you how to install Ruby on Rails on Ubuntu 22.04.
Step 1 - Install Required Dependencies
First, we need to install the necessary dependencies. Open your terminal and run the following command:
apt install -y git curl libssl-dev libreadline-dev zlib1g-dev autoconf bison build-essential libyaml-dev libreadline-dev libncurses5-dev libffi-dev libgdbm-dev
Step 2 - Install rbenv
Rbenv is a lightweight Ruby version management tool that allows you to easily install and switch between different versions of Ruby. Install rbenv by running the following command:
curl -fsSL https://github.com/rbenv/rbenv-installer/raw/HEAD/bin/rbenv-installer | bash
Next, add rbenv to your PATH and initialize it by adding the following lines to your ~/.bashrc file:
echo 'export PATH="$HOME/.rbenv/bin:$PATH"' >> ~/.bashrc
echo 'eval "$(rbenv init -)"' >> ~/.bashrc
source ~/.bashrc
Step 3 - Install Ruby
Now that rbenv is set up, we can install the desired version of Ruby. In this example, we'll install Ruby version 3.2.0:
rbenv install 3.2.0
Make Ruby available globally.
rbenv global 3.2.0
Verify that Ruby has been successfully installed by running:
ruby -v
You should see output similar to:
ruby 3.2.0 (2022-12-25 revision a528908271) [x86_64-linux]
Step 4 - Install Node.js
Rails requires a JavaScript runtime for compiling assets. Install Node.js using the following commands:
curl -fsSL https://deb.nodesource.com/setup_lts.x | sudo -E bash -
apt-get install -y nodejs
Step 5 - Update RubyGems
Ensure that RubyGems, the package manager for Ruby, is up to date:
gem update --system
Check the version of RubyGems:
gem -v
You should see the version number, for example:
3.5.11
Step 6 - Install Rails
Finally, let's install Ruby on Rails using the following command:
gem install rails -v 7.0.4
Verify that Rails has been installed correctly:
rails -v
You should see output similar to:
Rails 7.0.4
Step 7 - Create a New Rails Application
You're now ready to create your first Rails application. Navigate to the directory where you want to create the application and run:
rails new my_app
Replace my_app with the desired name for your application.
Navigate into your newly created Rails application directory:
cd my_app
Start the Rails server:
rails server --binding=0.0.0.0
You should see the following output indicating that the server is running:
=> Booting Puma
=> Rails 7.1.3.4 application starting in development
=> Run `bin/rails server --help` for more startup options
Puma starting in single mode...
* Puma version: 6.4.2 (ruby 3.2.0-p0) ("The Eagle of Durango")
* Min threads: 5
* Max threads: 5
* Environment: development
* PID: 50188
* Listening on http://0.0.0.0:3000
Use Ctrl-C to stop
Step 8 - Access Rails Application
Now, open your web browser and access your Rails application using the URL http://your-server-ip:3000.
Conclusion
In this guide, we've covered the step-by-step process of installing Ruby on Rails on Ubuntu 22.04. By following these instructions, you should now have a fully functional Rails development environment ready to use. Whether you're a beginner or an experienced developer, Rails offers a powerful and efficient framework for building modern web applications. Try to install Ruby on Rails on dedicated server hosting from Atlantic.Net!
### How to Install Bitwarden Password Manager on Ubuntu 24.04
Bitwarden is a secure, open-source password manager that helps individuals and organizations store, manage, and share their passwords and other sensitive information securely. It provides a centralized and encrypted repository for all your passwords, reducing the risk of security breaches due to weak or reused passwords.
In this article, we'll guide you through the process of installing Bitwarden on an Ubuntu 24.04 server.
Step 1 - Update and Upgrade Your System
First, ensure that your system is up-to-date. Open a terminal and run the following commands:
apt update
apt upgrade -y
Step 2 - Install Docker and Docker Compose
Bitwarden can be easily deployed using Docker. Install Docker and Docker Compose by following the below steps:
Install required dependencies.
apt install -y ca-certificates curl gnupg
Import the Docker GPG key.
install -m 0755 -d /etc/apt/keyrings
curl -fsSL https://download.docker.com/linux/ubuntu/gpg | gpg --dearmor -o /etc/apt/keyrings/docker.gpg
chmod a+r /etc/apt/keyrings/docker.gpg
Add the Docker CE official repository.
echo "deb [arch="$(dpkg --print-architecture)" signed-by=/etc/apt/keyrings/docker.gpg] https://download.docker.com/linux/ubuntu "$(. /etc/os-release && echo "$VERSION_CODENAME")" stable" | tee /etc/apt/sources.list.d/docker.list > /dev/null
Install Docker CE and Docker Compose.
apt install docker-ce docker-compose -y
Verify that the Docker service is running properly.
systemctl status docker
Output:
● docker.service - Docker Application Container Engine
Loaded: loaded (/usr/lib/systemd/system/docker.service; enabled; preset: enabled)
Active: active (running) since Sun 2025-05-25 06:02:40 UTC; 6s ago
TriggeredBy: ● docker.socket
Docs: https://docs.docker.com
Main PID: 17829 (dockerd)
Tasks: 9
Memory: 23.4M (peak: 88.8M)
CPU: 426ms
CGroup: /system.slice/docker.service
└─17829 /usr/bin/dockerd -H fd:// --containerd=/run/containerd/containerd.sock
Step 3 - Install Bitwarden
Create a user for Bitwarden and add it to the docker and sudo groups.
useradd -G docker,sudo -s /bin/bash -m -d /opt/bitwarden bitwarden
Log in as a Bitwarden user and download the Bitwarden installation script.
su - bitwarden
curl -Lso bitwarden.sh https://go.btwrdn.co/bw-sh
Make the script executable.
chmod +x bitwarden.sh
Run the installation script.
./bitwarden.sh install
During the installation process, you'll be prompted to configure Bitwarden.
_ _ _ _
| |__ (_) |___ ____ _ _ __ __| | ___ _ __
| '_ \| | __\ \ /\ / / _` | '__/ _` |/ _ \ '_ \
| |_) | | |_ \ V V / (_| | | | (_| | __/ | | |
|_.__/|_|\__| \_/\_/ \__,_|_| \__,_|\___|_| |_|
Open source password management solutions
Copyright 2015-2025, 8bit Solutions LLC
https://bitwarden.com, https://github.com/bitwarden
===================================================
bitwarden.sh version 2024.12.1
Docker version 28.1.1, build 4eba377
Docker Compose version v2.35.1
(!) Enter the domain name for your Bitwarden instance (ex. bitwarden.example.com): bitwarden.linuxbuz.com
(!) Do you want to use Let's Encrypt to generate a free SSL certificate? (y/n): y
(!) Enter your email address (Let's Encrypt will send you certificate expiration reminders): hitjethva@gmail.com
(!) Enter the database name for your Bitwarden instance (ex. vault): bitwarden
(!) Enter your installation id (get at https://bitwarden.com/host): 8cafef6e-6cce-433b-9807-b186005fa921
(!) Enter your installation key: UMpxaUNxwoIrC13c1bbf
(!) Enter your region (US/EU) [US]: US
After entering the required information, the installation script will download and configure Bitwarden.
./bitwarden.sh start
Bitwarden is up and running!
===================================================
visit https://bitwarden.linuxbuz.com
to update, run `./bitwarden.sh updateself` and then `./bitwarden.sh update`
Once the installation is complete, you can start Bitwarden using the following command:
./bitwarden.sh start
Step 4 - Access Bitwarden
Now that Bitwarden is running, you can access it via your web browser. Open your browser and navigate to https://bitwarden.linuxbuz.com. You should see the Bitwarden login page.
Provide your email, and click on Create account. You will be redirected to the Bitwarden account creation page.
Provide your name, username, email, and master password and click on Create Account. You will see the Bitwarden login page.
Provide your email and click on Continue. You will be asked for the master password.
Provide your master password and click on Log in with master password. You will see the Bitwarden dashboard.
Conclusion
You've successfully installed Bitwarden on Ubuntu 24.04! This setup provides you with a secure and efficient way to manage your passwords. Bitwarden offers a variety of features to help you manage your credentials, including secure sharing, password generation, and multi-factor authentication.
Keep your Bitwarden instance updated and backed up to ensure your data remains secure. If you encounter any issues or need further customization, refer to the official Bitwarden documentation for more information. You can now use Bitwarden to manage all your passwords on dedicated server hosting from Atlantic.Net.
### How to Install Tensorflow on Ubuntu 22.04
TensorFlow, developed by Google, is a powerful open-source platform for machine learning and artificial intelligence. It's used by researchers and developers worldwide to build and deploy machine learning models. Whether you're working on a small hobby project or a large-scale application, TensorFlow provides the tools you need.
In this article, we’ll walk you through each step of the installation process of TensorFlow on Ubuntu 22.04.
Step 1 - Update and Upgrade Your System
Before anything else, let's ensure your system is up to date. Open your terminal and run the following commands:
apt update -y
apt upgrade -y
Updating your system is crucial as it ensures you have the latest security patches and features, setting a strong foundation for TensorFlow installation.
Step 2 - Install Python
Next, you'll need Python, which is essential for running TensorFlow. To install Python, enter the command:
apt install python3 -y
You can verify the installation by checking the version:
python3 --version
You should see an output like Python 3.10.12. Great, Python is installed!
Python 3.10.12
Step 3 - Install Pip, Virtual Environment, and Development Tools
To manage your Python packages, you'll need Pip. Also, creating a virtual environment is a good practice to keep your TensorFlow installation isolated. Install Pip, the virtual environment module, and development tools with:
apt install python3-pip python3-venv python3-dev -y
Step 4 - Set Up Your Project Directory
Next, create a directory for your project and navigate to the directory:
mkdir project
cd project
Now you're in your project directory. Perfect!
Step 5 - Create and Activate a Virtual Environment
Creating a virtual environment is crucial to avoid conflicts with other Python packages. Create one with the following command:
python3 -m venv venv
Activate the virtual environment:
source venv/bin/activate
You'll notice your terminal prompt changes, indicating the virtual environment is active.
Step 6 - Install TensorFlow
With the virtual environment activated, you can now install TensorFlow. Use Pip to install the latest version:
pip3 install --upgrade TensorFlow
TensorFlow will be downloaded and installed in your virtual environment. This might take a few minutes, so grab a coffee while you wait!
Step 7 - Verify the Installation
To ensure TensorFlow is installed correctly, you can check the installation details. Run:
python3 -m pip show TensorFlow
You should see an output similar to this:
Name: tensorflow
Version: 2.16.1
Summary: TensorFlow is an open source machine learning framework for everyone.
Home-page: https://www.tensorflow.org/
Author: Google Inc.
Author-email: packages@tensorflow.org
License: Apache 2.0
Location: /root/project/venv/lib/python3.10/site-packages
Requires: absl-py, astunparse, flatbuffers, gast, google-pasta, grpcio, h5py, keras, libclang, ml-dtypes, numpy, opt-einsum, packaging, protobuf, requests, setuptools, six, tensorboard, tensorflow-io-gcs-filesystem, termcolor, typing-extensions, wrapt
Required-by:
This confirms that TensorFlow is installed and ready to use.
Once you're done, you can deactivate the virtual environment by simply running:
deactivate
This will return your terminal to its normal state.
Conclusion
In this article, we've walked through the steps to install TensorFlow on Ubuntu 22.04. We started by updating and upgrading the system, then installed Python and Pip. We set up a project directory, created a virtual environment, and installed TensorFlow. Finally, we verified the installation and deactivated the virtual environment. Try to install TensorFlow on dedicated server hosting from Atlantic.Net!
### How to Install Arkime Moloch Packet Capture Tool on Ubuntu 24.04
Arkime (formerly known as Moloch) is an open-source, large-scale, full packet capturing, indexing, and database system. It allows organizations to capture and index network traffic, providing a web-based interface for browsing, searching, and analyzing packet data. Arkime is highly scalable and can handle massive amounts of data, making it suitable for use in large networks or data centers.
This tutorial will guide you through the step-by-step process of installing Arkime on an Ubuntu 24.04 server.
Step 1 - Install Necessary Packages
First, we need to install some prerequisite packages. These packages ensure that your system has the necessary tools for downloading, managing, and verifying software from external sources. Open your terminal and run the following command:
apt install apt-transport-https ca-certificates curl gnupg2 software-properties-common -y
Step 2 - Add Elasticsearch GPG Key and Repository
Now, let’s add the GPG key for the Elasticsearch package to ensure the packages you download are authentic and haven’t been tampered with. Then, we’ll add the Elasticsearch repository.
First, add the GPG key:
wget -qO - https://artifacts.elastic.co/GPG-KEY-elasticsearch | gpg --dearmor -o /etc/apt/trusted.gpg.d/elastic.gpg
Then, add the repository:
echo "deb https://artifacts.elastic.co/packages/8.x/apt stable main" |tee /etc/apt/sources.list.d/elastic-8.x.list
Step 3 - Install Elasticsearch
Next, update your package list and install Elasticsearch. Elasticsearch is a powerful search engine based on the Lucene library, designed for horizontal scalability, reliability, and real-time search capabilities.
apt update
apt install elasticsearch
During the installation, a password for the elastic user is generated. Make sure to note this password because you’ll need it later. For example, the output might be:
The generated password for the elastic built-in superuser is : jUz*X+1f5gyw4Oz8OR2j
To make sure Elasticsearch runs continuously and starts automatically on boot, you need to start the service and enable it.
systemctl start elasticsearch
systemctl enable elasticsearch
Let’s check if Elasticsearch is running correctly. Use curl to verify the installation. The -k flag allows curl to perform insecure SSL connections and transfers.
curl https://localhost:9200 -k -u elastic -p
You will be prompted to enter the password for the elastic user. After entering the password, you should see a response confirming Elasticsearch is running, similar to this:
{
"name" : "ubuntu",
"cluster_name" : "elasticsearch",
"cluster_uuid" : "BviykehYSvig56i9fmShlw",
"version" : {
"number" : "8.18.1",
"build_flavor" : "default",
"build_type" : "deb",
"build_hash" : "df116ec6455476a07daafc3ded80e2bb1a3385ed",
"build_date" : "2025-04-30T10:07:44.026929518Z",
"build_snapshot" : false,
"lucene_version" : "9.12.1",
"minimum_wire_compatibility_version" : "7.17.0",
"minimum_index_compatibility_version" : "7.0.0"
},
"tagline" : "You Know, for Search"
}
Step 4 - Download and Install Arkime
It’s time to download the Arkime package specific to Ubuntu 22.04. Arkime provides tools to index and search captured packet data, integrating with Elasticsearch for data storage and retrieval.
First, use the wget command to download the latest Arkime package from its official website.
wget https://github.com/arkime/arkime/releases/download/v5.6.4/arkime_5.6.4-1.ubuntu2404_amd64.deb
Once the package is downloaded, install it using the following command.
apt install ./arkime_5.6.4-1.ubuntu2404_amd64.deb
Step 5 - Configure Arkime
Now, let’s configure Arkime by running the configuration script. This script will help you specify which network interfaces to monitor, the Elasticsearch server details, and other settings.
/opt/arkime/bin/Configure
You will be asked several questions as shown below:
Found interfaces: lo;eth0;eth1
Semicolon ';' seperated list of interfaces to monitor [eth1] eth0
Install Elasticsearch server locally for demo, must have at least 3G of memory, NOT recommended for production use (yes or no) [no]
OpenSearch/Elasticsearch server URL [https://localhost:9200]
OpenSearch/Elasticsearch user [empty is no user] elastic
OpenSearch/Elasticsearch password [empty is no password] jUz*X+1f5gyw4Oz8OR2j
Password to encrypt S2S and other things, don't use spaces [must create one] password
Arkime - Creating configuration files
Installing sample /opt/arkime/etc/config.ini
sed: can't read : No such file or directory
Arkime - Installing /etc/security/limits.d/99-arkime.conf to make core and memlock unlimited
Download GEO files? You'll need a MaxMind account https://arkime.com/faq#maxmind (yes or no) [yes] yes
Next, initialize the Arkime configuration in Elasticsearch. This step sets up the necessary indices and configurations in Elasticsearch for Arkime to function correctly.
/opt/arkime/db/db.pl --esuser elastic:'jUz*X+1f5gyw4Oz8OR2j' https://localhost:9200 init
Next, add an admin user for Arkime. This user will have administrative privileges and can manage other users and configurations.
/opt/arkime/bin/arkime_add_user.sh admin "Arkime SuperAdmin" password --admin
Step 6 - Start Arkime Services
To start capturing and analyzing network traffic, we need to enable and start the Arkime capture and viewer services. These services must be running for Arkime to function.
systemctl enable --now arkimecapture
systemctl enable --now arkimeviewer
Verify that both services are running:
systemctl status arkimecapture arkimeviewer
Output:
● arkimecapture.service - Arkime Capture
Loaded: loaded (/etc/systemd/system/arkimecapture.service; enabled; preset: enabled)
Active: active (running) since Tue 2025-05-27 05:41:26 UTC; 11s ago
Main PID: 4540 (sh)
Tasks: 7 (limit: 4609)
Memory: 320.9M (peak: 321.3M)
CPU: 446ms
CGroup: /system.slice/arkimecapture.service
├─4540 /bin/sh -c "/opt/arkime/bin/capture -c /opt/arkime/etc/config.ini >> /opt/arkime/logs/capture.log 2>&1"
└─4546 /opt/arkime/bin/capture -c /opt/arkime/etc/config.ini
May 27 05:41:25 ubuntu systemd[1]: Starting arkimecapture.service - Arkime Capture...
May 27 05:41:26 ubuntu systemd[1]: Started arkimecapture.service - Arkime Capture.
May 27 05:41:26 ubuntu (sh)[4540]: arkimecapture.service: Referenced but unset environment variable evaluates to an empty string: OPTIONS
● arkimeviewer.service - Arkime Viewer
Loaded: loaded (/etc/systemd/system/arkimeviewer.service; enabled; preset: enabled)
Active: active (running) since Tue 2025-05-27 05:41:30 UTC; 7s ago
Main PID: 4710 (sh)
Tasks: 12 (limit: 4609)
Memory: 99.5M (peak: 99.9M)
CPU: 1.459s
CGroup: /system.slice/arkimeviewer.service
├─4710 /bin/sh -c "/opt/arkime/bin/node viewer.js -c /opt/arkime/etc/config.ini >> /opt/arkime/logs/viewer.log 2>&1"
└─4711 /opt/arkime/bin/node viewer.js -c /opt/arkime/etc/config.ini
May 27 05:41:30 ubuntu systemd[1]: Started arkimeviewer.service - Arkime Viewer.
May 27 05:41:30 ubuntu (sh)[4710]: arkimeviewer.service: Referenced but unset environment variable evaluates to an empty string: OPTIONS
Step 7 - Access Arkime Web Interface
You can now access the Arkime web interface by navigating to http://your-server-ip:8005 in your web browser.
Use your admin credentials to log in.
It’s always a good idea to check the Arkime logs for any errors. This helps in troubleshooting any issues that might arise during the setup process.
tail -f /opt/arkime/logs/viewer.log
tail -f /opt/arkime/logs/capture.log
Conclusion
You have successfully installed Arkime on Ubuntu 24.04. You can now start capturing and analyzing network traffic using its powerful web interface. Arkime's capabilities enable you to monitor, search, and analyze network packets in real time, providing deep insights into your network's activity. This tool is invaluable for network administrators, security professionals, and anyone needing comprehensive network visibility. Try to install Arkime on dedicated server hosting from Atlantic.Net!
### How to Check Docker Container RAM and CPU Usage
Docker containers are a lightweight, portable, and self-sufficient unit of software that includes everything needed to run an application. Monitoring the resource usage of Docker containers, particularly RAM and CPU, is essential for maintaining performance, identifying bottlenecks, and ensuring that applications run smoothly.
In this tutorial, we will cover various methods to check the RAM and CPU usage of Docker containers. We'll use both Docker's built-in tools and external monitoring tools.
Prerequisites
Docker must be installed and running.
1. Using the docker stats Command
The docker stats command provides a live stream of real-time resource usage statistics for your Docker containers. It helps you monitor the performance and resource consumption of your containers, giving you insights into how much CPU, memory, network, and block I/O each container is using.
docker stats
This command outputs a table with the following columns:
CONTAINER ID: The unique identifier of the container.
NAME: The name of the container.
CPU %: The percentage of the host's CPU the container is using.
MEM USAGE / LIMIT: The memory usage of the container and the memory limit set for the container.
MEM %: The percentage of the container's memory usage relative to its limit.
NET I/O: The amount of network traffic (in/out).
BLOCK I/O: The amount of block I/O (read/write).
Additional Options for docker stats
--all, -a: Show all containers (default shows just running)
--format: Pretty-print images using a Go template
--no-stream: Disable streaming stats and only pull the first result
--no-trunc: Do not truncate output
Example using options:
docker stats --no-stream --format "table {{.Container}}\t{{.Name}}\t{{.CPUPerc}}\t{{.MemUsage}}"
This example displays a one-time snapshot of the stats in a table format, showing container ID, name, CPU percentage, and memory usage.
CONTAINER NAME CPU % MEM USAGE / LIMIT
b9bcf1921e95 xenodochial_jang 0.00% 856KiB / 3.834GiB
9c13fdf2fef9 dreamy_borg 0.00% 3.078MiB / 3.834GiB
2. Using the docker inspect Command
The docker inspect command retrieves detailed information about a container. To get the memory and CPU usage, you can inspect a running container and parse the JSON output.
docker inspect
You can filter the output using jq or similar tools to get specific information. For example, to get memory usage:
docker inspect --format='{{.State.Pid}}' | xargs -I {} cat /proc/{}/status | grep VmRSS
Output:
VmRSS: 3840 kB
3. Using cAdvisor
cAdvisor (Container Advisor) is an open-source project from Google that provides container users with an understanding of the resource usage and performance characteristics of their running containers. It collects, aggregates, processes, and exports information about running containers.
Run cAdvisor as a Docker container to start monitoring your other containers.
docker run --volume=/:/rootfs:ro --volume=/var/run:/var/run:ro --volume=/sys:/sys:ro --volume=/var/lib/docker/:/var/lib/docker:ro --publish=8080:8080 --detach=true --name=cadvisor gcr.io/cadvisor/cadvisor:latest
Navigate to http://your-server-ip:8080 in your web browser. You will see a dashboard displaying detailed metrics for all running containers, including CPU and memory usage.
4. Using Pseudofiles
Linux provides pseudofiles in the /proc and /sys/fs/cgroup directories, which contain information about system and process metrics. These can be used to monitor Docker container resource usage.
To check memory usage, you can use the cgroup pseudofiles. First, find the container's cgroup path:
docker inspect --format '{{.Id}}'
Output:
cadvisor 54310651ae8a769a782fea91c322c47a5dea14df6f359d6aa8f5a161121e0915
xenodochial_jang b9bcf1921e958824d15e686ab400d0d0834b6d0c321fcb75c897f2329616eb7a
dreamy_borg 9c13fdf2fef92a9fba52cb09a3fa5f313ebaa566692f8de702497aaf456b70e0
Use the container ID to navigate to its memory usage file:
cat /sys/fs/cgroup/system.slice/docker-9c13fdf2fef92a9fba52cb09a3fa5f313ebaa566692f8de702497aaf456b70e0.scope/memory.stat
Output:
anon 2506752
file 73728
kernel_stack 49152
pagetables 139264
percpu 72
sock 0
shmem 4096
file_mapped 4096
file_dirty 0
file_writeback 0
swapcached 0
anon_thp 0
file_thp 0
shmem_thp 0
inactive_anon 2498560
active_anon 12288
inactive_file 16384
active_file 53248
unevictable 0
slab_reclaimable 237840
slab_unreclaimable 157672
slab 395512
workingset_refault_anon 0
workingset_refault_file 0
workingset_activate_anon 0
workingset_activate_file 0
workingset_restore_anon 0
workingset_restore_file 0
workingset_nodereclaim 0
pgfault 4042
pgmajfault 0
pgrefill 0
pgscan 0
pgsteal 0
pgactivate 4
pgdeactivate 0
pglazyfree 0
pglazyfreed 0
thp_fault_alloc 0
thp_collapse_alloc 0
CPU usage can be monitored similarly:
cat /sys/fs/cgroup/system.slice/docker-9c13fdf2fef92a9fba52cb09a3fa5f313ebaa566692f8de702497aaf456b70e0.scope/cpu.stat
This file displays the total CPU time (in nanoseconds) consumed by the container.
usage_usec 120676
user_usec 52454
system_usec 68221
nr_periods 0
nr_throttled 0
throttled_usec 0
Conclusion
Monitoring Docker container resource usage is essential for maintaining application performance and stability. The methods covered in this tutorial offer different levels of detail and flexibility. Use Docker stats and inspect for quick checks, cAdvisor for comprehensive overviews, and pseudofiles for low-level metrics. You can now easily check CPU and Memory usage on dedicated server hosting from Atlantic.Net!
### How to Remote Desktop to Server: Windows Hosting Remote Desktop Protocol (RDP) Tutorial
Verified and Tested 07/01/2024
In this how-to, we will walk you through how to use Remote Desktop to access your Windows Server.
What Is RDP?
Remote Desktop Protocol (RDP) is a proprietary protocol developed by Microsoft, which provides a user with a graphical interface to connect to another computer over a network connection. The user employs RDP client software for this purpose while the other computer must run RDP server software.
Prerequisites
– A Server with Windows Server. If you do not have a server already, you can visit our VPS hosting page and spin one up in under 30 seconds.
How to Remote Desktop to a Server
All Windows computers come pre-installed with Remote Desktop Connection. You can find this by going to Start and typing "Remote Desktop Connection" or "mstsc." Once you see Remote Desktop Connection, click on it to open.
Remote desktop Connection
When you have opened Remote Desktop Connection, you must enter the computer name or IP address of the computer/server. Once you have entered either one, then click Connect.
Once you have clicked on Connect, you will be prompted if you trust this connection. If you do and do not want to see this message again, check the box beside "Don't ask me again for connections to this computer." Also, if you would like to connect your local drives, printers, or clipboard, click on the Show Details at the bottom left.
Details
After clicking on Show Details, you will be able to check the boxes of which ones you would like connected as well.
Details
After you are done choosing which options you would like, click on Connect. You will then be prompted for the Username and password to log in to your remote computer/server.
Windows security
Once you have entered the Username and Password, you can check the box next to "Remember my credentials" if you want to. Once you are ready, then click on OK.
Now you should be connected to the remote server.
Remote Desktop Protocol Tips
As you can see, RDP as a basic tool is straightforward. To connect to your server remotely using Remote Desktop Connection on a Windows computer, type “remote” into the search box of your start menu. Once the program is opened, type in the machine you want to access and hit “Connect.” That is all.
However, entering the Options menu – accessible through the main window – allows you to control additional features. Ryan Dube of MakeUseOf assessed a few of those options so that you can understand the fuller potential of the Windows software.
Changing the display
Frequently RDP defaults to a window that does not take up the entire screen. Especially on big monitors, this aspect can be annoying. You want a full visual of the environment, and all you get is a window that fills 50% of your screen, if that. It’s challenging to work with that small viewing space to have several windows open simultaneously.
How to solve the size problem? Before connecting through RDP, access the Display menu (within Options) and slide the setting to the right-hand side. Once you have done that, you should see the words “Full Screen” appear within the window. Additionally, if you have multiple monitors connected, you now have the option to utilize all of them for the remote session.
Using local resources
Another potential element of frustration when using a Remote Desktop connection is that some Windows shortcuts don’t work. For example, control-alt-delete (to end processes, log off, etc.) and alt-tab (to switch between windows) are nonfunctional. However, this issue can be resolved as well.
Enter the Local Resources menu. Under the Keyboard heading, you will see the option to use Windows key combinations when the display is set in particular ways.
Accessing additional devices
You also have the ability to use thumb drives or other media while connected remotely. Within Local Resources, you will see a Local Devices heading. Click “More.” Now you will see various options for media that can be accessed during RDP.
Finding a Helpful Windows RDP Hosting Provider
The remote desktop protocol is just one of the many tools and features useful to you within a cloud environment. Your Windows Cloud Server Hosting solutions, like any cloud computing situation, will rely in part on the quality of your Cloud Servers. If you ever have any questions at any time related to your cloud hosting or other hosting-related tools, such as our VPS hosting solutions, Atlantic.Net’s consultants are here to assist you 24/7.
### How to Install Miniconda on Ubuntu 24.04
Miniconda is a minimal, lightweight version of Anaconda that includes only the essential packages and the Conda package manager. This makes it an excellent choice for those who want a lean Python environment without the extra bulk of a full Anaconda installation. Miniconda allows you to create isolated environments with specific Python versions and packages, making it easier to manage dependencies and avoid conflicts.
This guide will walk you through the steps to install Miniconda on Ubuntu 24.04.
Step 1 - Update the System
Before installing any new software, it's good practice to update the package list and upgrade the installed packages to their latest versions. Open a terminal and run the following commands:
apt update -y
apt upgrade -y
Step 2 - Download the Miniconda Installer
Next, download the Miniconda installer script. You can find the latest version of Miniconda on the official Miniconda website. Use wget to download the installer:
wget https://repo.anaconda.com/miniconda/Miniconda3-latest-Linux-x86_64.sh
Step 3 - Run the Installer
Once you have verified the integrity of the installer, you can run the installer script:
bash Miniconda3-latest-Linux-x86_64.sh
The installer will guide you through the installation process.
Do you accept the license terms? [yes|no]
>>> yes
Miniconda3 will now be installed into this location:
/root/miniconda3
- Press ENTER to confirm the location
- Press CTRL-C to abort the installation
- Or specify a different location below
[/root/miniconda3] >>>
You can undo this by running `conda init --reverse $SHELL`? [yes|no]
[no] >>>
You have chosen to not have conda modify your shell scripts at all.
To activate conda's base environment in your current shell session:
eval "$(/root/miniconda3/bin/conda shell.YOUR_SHELL_NAME hook)"
To install conda's shell functions for easier access, first activate, then:
conda init
Thank you for installing Miniconda3!
Step 4 - Initialize Conda
After completing the installation, you need to initialize Conda. This sets up the necessary shell configuration. Run the following commands:
source ~/miniconda3/bin/activate
conda init
source ~/miniconda3/bin/activate: Activates the Conda environment.
conda init: Configures your shell to use Conda.
Step 5 - Test the Installation
Close and reopen your terminal, or source your shell configuration file to apply the changes:
source ~/.bashrc
To verify the installation, run:
conda --version
This command should display the installed Conda version, confirming that the installation was successful.
conda 25.3.1
You can also check the Conda configuration details with:
conda info
Output:
active environment : base
active env location : /root/miniconda3
shell level : 1
user config file : /root/.condarc
populated config files : /root/miniconda3/.condarc
conda version : 25.3.1
conda-build version : not installed
python version : 3.13.2.final.0
solver : libmamba (default)
virtual packages : __archspec=1=x86_64
__conda=25.3.1=0
__glibc=2.39=0
__linux=6.8.0=0
__unix=0=0
base environment : /root/miniconda3 (writable)
conda av data dir : /root/miniconda3/etc/conda
conda av metadata url : None
channel URLs : https://repo.anaconda.com/pkgs/main/linux-64
https://repo.anaconda.com/pkgs/main/noarch
https://repo.anaconda.com/pkgs/r/linux-64
https://repo.anaconda.com/pkgs/r/noarch
package cache : /root/miniconda3/pkgs
/root/.conda/pkgs
envs directories : /root/miniconda3/envs
/root/.conda/envs
platform : linux-64
user-agent : conda/25.3.1 requests/2.32.3 CPython/3.13.2 Linux/6.8.0-54-generic ubuntu/24.04.2 glibc/2.39 solver/libmamba conda-libmamba-solver/25.4.0 libmambapy/2.0.5 aau/0.7.0 c/. s/. e/.
UID:GID : 0:0
netrc file : None
offline mode : False
Step 7 - Update Conda
To ensure you have the latest packages and features, update Conda:
conda update --all
Step 8 - Install Packages with Conda
With Conda installed, you can now install packages easily via conda command. For example, to install pandas, use:
conda install pandas
You can list all installed packages in your Conda environment with:
conda list
When you're done, you can deactivate the Conda environment with:
conda deactivate
Conclusion
You have successfully installed Miniconda on Ubuntu 24.04. You can now use Conda to manage your Python environments and packages. This lightweight setup is perfect for creating isolated environments for your projects without the overhead of the full Anaconda distribution. Feel free to explore Conda's documentation to learn more about managing environments and packages. You can now use Miniconda to manage your Python project on dedicated server hosting from Atlantic.Net!
### How to Install and Use bmon Real Time Bandwidth Monitor in Ubuntu 22.04
Monitoring network bandwidth is crucial for maintaining a well-functioning and efficient system. Whether you're a system administrator overseeing multiple servers or an individual managing your home network, understanding the network usage can help you identify bottlenecks, optimize performance, and detect potential issues early.
bmon (Bandwidth Monitor) is a powerful, real-time bandwidth monitoring tool designed for Unix-like operating systems, including Ubuntu. It provides detailed information about your network bandwidth usage, presenting data in a user-friendly, graphical interface.
This tutorial will guide you through the installation and usage of bmon on Ubuntu 22.04.
Step 1 - Installing bmon
First, you need to install bmon. It is available in the default Ubuntu repositories, so you can install it using the apt package manager.
Update the package list:
apt update -y
After updating the apt cache, install bmon using the following command:
apt install bmon -y
Step 2 - How to Use bmon
Once installed, you can start using bmon to monitor your network bandwidth in real time.
bmon
By default, bmon will start displaying the bandwidth usage of all available network interfaces.
When you run bmon, you will see several sections and columns on the screen. Here’s a breakdown of what each part represents:
Interfaces Section: This section lists all detected network interfaces along with their current bandwidth usage statistics.
Statistics Section: Displays detailed statistics for the selected interface, such as:
RX: Received bytes/packets.
TX: Transmitted bytes/packets.
Errors: Number of errors.
Dropped: Number of dropped packets.
Overruns: Number of overruns.
Frame: Frame errors.
Rate Graph: A graphical representation of the bandwidth usage over time for the selected interface.
Step 3 - Command-Line Options and Key Bindings
bmon supports several command-line options to customize its behavior. Some of the most useful options include:
Use the -p flag to specify which network interfaces to monitor. For example:
bmon -p eth0
Use the -o flag to set the output module. bmon supports several output modules, such as ASCII and curses. By default, curses is used. For example:
bmon -p eth0 -o ascii
Output:
Interfaces RX bps pps % TX bps pps %
eth0 0 0 0 0
Interfaces RX bps pps % TX bps pps %
eth0 885B 0 293B 0
Interfaces RX bps pps % TX bps pps %
eth0 2.15KiB 0 293B 0
Interfaces RX bps pps % TX bps pps %
eth0 2.77KiB 0 334B 1
Interfaces RX bps pps % TX bps pps %
eth0 2.82KiB 0 303B 1
Use the -r option to set the read interval in seconds. This determines how frequently bmon will update the statistics. For example, to update every 2 seconds:
bmon -p eth0 -r 2
You can use the -s option to set the storage module, which determines where the data is read from. For example:
bmon -p eth0 -s netlink
Key Bindings
While running bmon, you can use the following keys to navigate and customize the display:
Left/Right Arrow Keys: Switch between different network interfaces.
Up/Down Arrow Keys: Scroll through the statistics of the selected interface.
Tab: Switch between different sections (interfaces, statistics, graph).
g: Toggle the graph display.
d: Toggle detailed interface statistics.
q: Quit bmon.
Conclusion
bmon is a powerful tool for monitoring network bandwidth usage in real time on Ubuntu 22.04. By understanding its command-line options and interface, you can effectively track and debug network performance issues. Try to install bmon on dedicated server hosting from Atlantic.Net!
### How to Monitor Ubuntu Server Security with Osquery
Osquery is an open-source, cross-platform tool that allows you to query your operating system as if it were a relational database. Using SQL-based queries, Osquery provides insights into your system's configuration, status, and activities, making it an invaluable tool for system monitoring, security auditing, and incident response.
In this tutorial, we'll cover how to install, configure, and use Osquery to monitor the security of an Ubuntu 22.04 server.
Step 1 - Update the System
Keeping your system updated is crucial for security. Regular updates provide the latest security patches and software enhancements.
Ensure your system is up to date:
apt update -y
apt upgrade -y
Step 2 - Install Osquery
Osquery is not available in the default Ubuntu repositories, so you need to add its repository.
Download and add the repository GPG key:
export OSQUERY_KEY=1484120AC4E9F8A1A577AEEE97A80C63C9D8B80B
apt-key adv --keyserver hkp://keyserver.ubuntu.com:80 --recv-keys $OSQUERY_KEY
This command ensures the authenticity of the packages from the Osquery repository. GPG keys help verify that the software you're installing is legitimate and hasn't been tampered with.
add-apt-repository 'deb [arch=amd64] https://pkg.osquery.io/deb deb main'
This command adds the Osquery repository to your system. Adding the repository ensures you get the latest version of Osquery directly from the source.
Now, install Osquery using the apt command:
apt install osquery -y
Step 3 - Configure Osquery
Creating a configuration file is the first step in customizing Osquery's behavior. Let's create a new configuration file:
mkdir -p /etc/osquery
nano /etc/osquery/osquery.conf
Add the following content:
{
"options": {
"config_plugin": "filesystem",
"logger_plugin": "filesystem",
"logger_path": "/var/log/osquery",
"disable_logging": "false",
"log_result_events": "true",
"schedule_splay_percent": "10",
"worker_threads": "2",
"enable_monitor": "true"
},
"schedule": {
"system_info": {
"query": "SELECT hostname, cpu_brand, physical_memory FROM system_info;",
"interval": 3600
},
"processes": {
"query": "SELECT * FROM processes WHERE on_disk = 0;",
"interval": 300
}
},
"packs": {
"osquery-monitoring": "/usr/share/osquery/packs/osquery-monitoring.conf"
}
}
This configuration sets Osquery to log its results and run scheduled queries. The options section configures logging and performance, while the schedule section defines periodic queries.
Create log directory and set permissions:
mkdir -p /var/log/osquery
chown -R syslog:adm /var/log/osquery
Step 4 - Start and Enable Osquery
Enable and start the Osquery daemon:
systemctl enable osqueryd
systemctl start osqueryd
Check the service status:
systemctl status osqueryd
The status command provides information about the service's current state.
● osqueryd.service - The osquery Daemon
Loaded: loaded (/lib/systemd/system/osqueryd.service; disabled; vendor preset: enabled)
Active: active (running) since Fri 2024-06-21 03:33:42 UTC; 4s ago
Process: 4492 ExecStartPre=/bin/sh -c if [ ! -f $FLAG_FILE ]; then touch $FLAG_FILE; fi (code=exited, status=0/SUCCESS)
Process: 4494 ExecStartPre=/bin/sh -c if [ -f $LOCAL_PIDFILE ]; then mv $LOCAL_PIDFILE $PIDFILE; fi (code=exited, status=0/SUCCESS)
Main PID: 4495 (osqueryd)
Tasks: 14 (limit: 4579)
Memory: 14.0M
CPU: 110ms
CGroup: /system.slice/osqueryd.service
├─4495 /opt/osquery/bin/osqueryd --flagfile /etc/osquery/osquery.flags --config_path /etc/osquery/osquery.conf
└─4497 /opt/osquery/bin/osqueryd "" "" "" "" "" "" "" "" "" "" "" "" "" "" "" "" "" "" "" "" "" "" "" "" "" "" "" "" "" "" "" "" "" "" "" "" "" "" "" "" ">
Step 5 - Querying with Osquery
You can use Osquery's interactive shell to run queries and explore your system.
Let's launch the Osquery interactive shell:
osqueryi
The interactive shell allows you to run ad-hoc queries and inspect your system in real-time. It's a powerful tool for on-the-fly analysis.
osquery>
Run a query to list all users:
SELECT username, description FROM users;
This query lists all users on the system. It's useful for auditing user accounts and their descriptions.
+------------------+------------------------------------+
| username | description |
+------------------+------------------------------------+
| root | root |
| daemon | daemon |
| bin | bin |
| sys | sys |
| sync | sync |
| games | games |
| man | man |
| lp | lp |
| mail | mail |
| news | news |
| uucp | uucp |
| proxy | proxy |
| www-data | www-data |
| backup | backup |
| list | Mailing List Manager |
| irc | ircd |
| gnats | Gnats Bug-Reporting System (admin) |
| nobody | nobody |
| _apt | |
| systemd-network | systemd Network Management,,, |
| systemd-resolve | systemd Resolver,,, |
| messagebus | |
| systemd-timesync | systemd Time Synchronization,,, |
| pollinate | |
| sshd | |
| syslog | |
| uuidd | |
| tcpdump | |
| tss | TPM software stack,,, |
| landscape | |
| usbmux | usbmux daemon,,, |
| lxd | |
| ntp | |
+------------------+------------------------------------+
Run a query to check for listening ports:
SELECT * FROM listening_ports;
This query shows all open network ports.
+------+------+----------+--------+-------------------------+-----+--------+--------------------------------------------+---------------+
| pid | port | protocol | family | address | fd | socket | path | net_namespace |
+------+------+----------+--------+-------------------------+-----+--------+--------------------------------------------+---------------+
| 584 | 53 | 6 | 2 | 127.0.0.53 | 14 | 19806 | | 4026531992 |
| 1101 | 22 | 6 | 2 | 0.0.0.0 | 3 | 22415 | | 4026531992 |
| 1101 | 22 | 6 | 10 | :: | 4 | 22417 | | 4026531992 |
| 584 | 53 | 17 | 2 | 127.0.0.53 | 13 | 19805 | | 4026531992 |
| 745 | 123 | 17 | 2 | 209.23.8.109 | 19 | 20237 | | 4026531992 |
| 745 | 123 | 17 | 2 | 127.0.0.1 | 18 | 20235 | | 4026531992 |
| 745 | 123 | 17 | 2 | 0.0.0.0 | 17 | 20231 | | 4026531992 |
Exit the Osquery shell:
.exit
Step 6 - Automating Security Monitoring
To automate and extend your security monitoring, consider using additional query packs and integrating Osquery with centralized logging and alerting systems like ELK Stack or Splunk.
Download and install additional query packs:
wget -P /usr/share/osquery/packs/ https://raw.githubusercontent.com/osquery/osquery/master/packs/osquery-monitoring.conf
Query packs contain predefined queries for specific monitoring tasks. They simplify setting up comprehensive security checks.
Update the packs section in /etc/osquery/osquery.conf to include the new packs:
"packs": {
"osquery-monitoring": "/usr/share/osquery/packs/osquery-monitoring.conf",
"incident-response": "/usr/share/osquery/packs/incident-response.conf"
}
Conclusion
You now have Osquery installed and configured on your Ubuntu 22.04 server. By using Osquery, you can monitor various aspects of your system in real-time, aiding in security and compliance efforts. Customize your queries and schedules to fit your specific needs, and integrate Osquery with other tools for enhanced monitoring and alerting. You can now use Osquery for security auditing on dedicated server hosting from Atlantic.Net!
### HIPAA Compliant Remote Desktop: How to Set Up a HIPAA-Compliant RDP Server
Can Remote Desktop Protocol (RDP) Be Made HIPAA-Compliant?
Remote desktop protocol (RDP) can be made HIPAA compliant (HIPAA Compliant RDP Server Hosting) with the help of a HIPAA-compliant hosting company. Healthcare security and HIPAA compliance are points of focus for us at Atlantic.Net. Here is a sample chat with a prospective client interested in setting up nationwide access to a compliant system via remote desktop protocol (RDP).
What is Remote Desktop Protocol (RDP)?
Remote Desktop Protocol (RDP) is a proprietary protocol developed by Microsoft which provides a user with a graphical interface to connect to another computer over a network connection. The user employs RDP client software to remotely access the other computer, while the other computer must run RDP server software for the user to access it remotely.
Here is a sample use-case with a prospective client interested in setting up nationwide access to a HIPAA compliant remote desktop protocol (RDP).
Healthcare Hosting Scenario Client Needs a System for Nationwide Remote Desktop
Healthcare Client:
I have an application I’d like to have hosted with a HIPAA Compliant Hosting Server. My users will access the program from various locations throughout the U.S. via Remote Desktop.
Hosting Consultant:
Thank you for contacting Atlantic.Net. A few questions:
How many internal users do you have? (Each internal user will need an “Encrypted” VPN to connect to the platform.)
What is your total storage requirement?
Are you “encrypting” the data before storing it on the HIPAA hosting platform?
Is there a high amount of Read/Writes daily on the database side?
Do you require any database software (we can only provide MySQL and MSSQL)?
Do you have both a Web and Database front end?
Attached are the BAA and the HIPAA certification.
Healthcare Client:
A “group” is considered from 2-100 individuals working for the same medical practice. They can be at several different physical locations, sharing the same databases. There will be a few groups to start, with a steady increase.
30 MB per group.
A typical user will log in first thing in the morning and access the program 10-30 times a day. Very low bandwidth per group.
Users will access the server/application via Remote Desktop. I am assuming the application and the databases will be separated.
Hosting Consultant:
OK, thank you for your responses.
Attached is the formal HIPAA-compliant pricing proposal. The smallest amount of Storage Space we can provide is 500 GB. The most cost-effective way to give Application and Database servers (to meet HIPAA requirements) is by using a dedicated server and creating two Virtual Machines inside the server. The dedicated server comes with ( 2 ) RDP licenses; they are $ XXX per month per RDP license if you need extra ones. We include ( 5 ) Encrypted VPNs with our proposal; if you need additional VPNs, they are $ XXX per month per VPN.
We require all of the services listed on the proposal to provide you with the business associate agreement. Below is a list of the supporting documents we provide for your review.
Fully Managed Hardware Firewall
Encrypted VPNs
Intrusion Detection System
Fully Managed Daily Backup
Healthcare Client:
Thanks for your quick reply. Please let me digest this information - I’m sure I’ll have some questions for you afterward.
Hosting Consultant:
Are you still looking for HIPAA Compliant Hosting services?
Healthcare Client:
I am still considering this. The project timing is not 100% defined. Do you have a few references who are current users that I can contact? Thank you.
Hosting Consultant:
We have many HIPAA hosting customers, but all customers have NDAs. We have some customers who have provided us with permission to use them as a reference, and you can contact these customers anytime.
Please see the attached list.
The Perspective of Complete Healthcare Solutions
One of our most vocal supporters is Complete Healthcare Solutions.
“Atlantic.Net’s reputation for 100% up-time, their secure infrastructure, and expertise in Healthcare IT were key components in finalizing our partnership,” said the firm’s VP of product development, Joseph Nompleggi.
Security Increasingly Critical in Healthcare
To understand data breaches, follow the money. Hackers can now sell your healthcare records for ten times what they can get for your credit card. As medical records increase in value, more hackers set their sights on medical companies; their efforts are often successful since many firms use outdated equipment and don’t invest substantially in security.
“As attackers discover new methods to make money, the healthcare industry is becoming a much riper target because of the ability to sell large batches of personal data for profit,” explained TrustedSEC CEO Dave Kennedy, adding that the information is typically used to conduct medical fraud.
Hackers have disproportionately targeted healthcare companies for years, but their efforts are accelerating. In 2009, 20% of HIPAA “covered entities” reported an attack in a survey by the Ponemon Institute. By 2013, 40% of companies said they had experienced a breach.
Larry Ponemon, the institute’s founder, commented that 2014 was even more devastating for healthcare security: there were more successful assaults and more data exfiltrated per assault.
Intermountain Healthcare CIO Mark Probst noted that his hospital chain defends against thousands of cyberattacks every week.
Furthermore, Ponemon revealed that 9 out of every ten healthcare firms had patient records compromised or stolen in 2012 or 2013.
Currently, healthcare experiences more attacks than both finance and military organizations combined. Here are some essential resources that could assist you with setting up your RDP server, but to ensure HIPAA compliance, you need to add a comprehensive security apparatus around your RDP servers.
How to Configure Windows RDP Server
Remote Desktop Scenario using a Cloud VPS
How to Remote Desktop into Your Windows Server
*** Note that various details are changed for privacy, clarity, etc. ***
Check out our full range of VPS Hosting Solutions today.
### Atlantic.Net Offers Free 4GB Cloud Server Tier for One Year
As we celebrate 30 years of success, we are pleased to announce a major upgrade to our Free Tier. New customers can now take advantage of a powerful free 4GB server, a 50% increase in resources, at no additional cost. This enhanced plan is available across Atlantic.Net's eight global data centers, providing businesses worldwide with the performance and reliability they need to thrive.
All new customers receive a free cloud server for a year, which includes:
4GB RAM
2 vCPU
80 GB SSD storage
5TB monthly data transfer
In addition to the free G3.4GB Cloud VPS server, the Free Tier also includes 50 GB of Free Block Storage and Snapshots for one full year and comes with all the benefits of the Atlantic.Net Cloud Platform:
Fault-tolerant, ultra-fast performance: Engineered for maximum uptime and speed.
Award-winning Cloud Servers: Backed by a proven track record of excellence.
Secure Block Storage: Safeguard your critical data with robust security measures.
One-Click Applications, DNS, Private Networking, RESTful API: Streamline your workflow and development processes.
Optional Data Backup & Managed Services: Tailor your solution to your needs.
24/7 U.S.-Based Expert Support: Get the help you need whenever needed.
With this promotion, developers, startups, and small-to-mid-sized businesses will get more for less, making it easy to start projects with no up-front capital.
This offering builds on Atlantic.Net's previous initiatives, such as expanding the G3.2GB server promotion to all eight global data center regions, including New York, Toronto, San Francisco, Dallas, London, Orlando, Ashburn, and Singapore.
### Virtual Private Cloud Server: Clearing the Confusion
The term Virtual Private Cloud Server is sometimes used interchangeably with Virtual Private Cloud or Virtual Private Server, causing significant confusion for those new to cloud computing. The issue stems from the fact that the term itself is a misnomer, attempting to combine two distinct concepts that serve different functions within cloud infrastructure resources.
You can break these concepts into VPC and VPS; let's clear up this confusion once and for all by clearly defining what exactly each technology is:
Virtual Private Cloud (VPC):
A Virtual Private Cloud (VPC) is a secure and isolated private network within a public cloud. It provides users with complete control over their virtual network environment, including IP address range, subnets, and security settings.
Virtual Private Server (VPS):
A Virtual Private Server (VPS) is a virtualized server environment within a physical server, providing dedicated resources and greater control than shared hosting while being more affordable than a dedicated server.
The conflation of these terms leads to misunderstandings about Virtual Private Clouds and how they differ from VPSes or VPCs. Some cloud providers might even use these terms to refer to a specific type of VPS product, further muddying the waters.
This article aims to resolve this confusion by clearly exploring VPC and VPS solutions. Our goal is to simplify the concepts to help you choose the right solution for your needs.
What Is a Virtual Private Cloud (VPC)?
A Virtual Private Cloud (VPC) is a secure, isolated virtual network established within a public cloud infrastructure. A popular analogy is to think of it as renting an apartment in a multi-tenant building. You have exclusive access to your apartment, the ability to control who comes and goes, and the freedom to customize the layout and use of the space. The isolation enhances security and privacy, as your resources are segregated from other tenants on different floors.
Within your VPC, you can create and manage multiple resources like virtual machines (VMs), databases, storage, and virtual networks. These resources can communicate securely within your dedicated floor and with your company's headquarters (your on-premises network) if necessary.
Key Benefits of VPCs:
Enhanced Security:
VPCs offer an additional layer of security within a public cloud provider's environment. Unlike resources deployed in shared public cloud infrastructure, VPCs provide a private space where you can control access to all resources. Logical isolation safeguards your valuable data and applications from unauthorized access by other public cloud tenants on the same infrastructure. A VPC creates enhanced security for businesses handling sensitive information and those subject to strict compliance.
Isolated Environment Customization:
VPCs are highly customizable, offering options to configure network access control lists (ACLs) and security groups to restrict access based on IP addresses or protocols. Administrators can define custom IP ranges to create a logically isolated network within the cloud provider's data center. This level of customization allows you to mirror your on-premises network architecture in the cloud or create entirely new configurations. Best of all, you can integrate your services with public cloud resources.
Scalability:
VPCs are inherently scalable, enabling you to adapt to changing workloads. You can deploy dynamically provisioned virtual servers across multiple availability zones within a VPC. Such scalability ensures that your applications can handle spikes in traffic or resource demands without impacting performance. You can also integrate machine learning models for predictive scaling, further optimizing resource utilization.
Cost Efficiency:
By giving you granular control over your resources, you can optimize your cloud deployment to avoid overprovisioning. You only pay for the resources you actually use, which can lead to significant savings compared to traditional data centers, where you might need to maintain excess capacity for peak loads.
What Is the Difference between a Virtual Private Server (VPS) and a Virtual Private Cloud (VPC)?
A Virtual Private Server (VPS) is a virtualized instance of a physical server hosted on a cloud platform, typically within a private cloud infrastructure. A single physical server is divided into multiple VPSes, each acting as an independent server with its own operating system, resources, and dedicated storage.
The crucial distinction is that a VPC is an entire virtual network, while a VPS is a single virtual machine (or server) residing within that network. You can have multiple VPSes running within a VPC, each serving different purposes, such as web hosting, application hosting, or database management.
Key benefits of VPSes:
Virtual Private Servers (VPSes) provide a powerful and flexible solution for hosting websites and applications. They offer a middle ground between shared hosting and dedicated servers, making them ideal for businesses and individuals seeking a balance of affordability, performance, and control.
Here's a closer look at the key benefits of VPSes, with a focus on their use in cloud environments:
Cost-Effective Cloud Hosting:
VPSes offer a cost-effective alternative to dedicated servers, particularly when hosted on a public cloud platform like Google Cloud Platform (GCP). Businesses can choose from various cloud providers and pricing models, paying only for the resources they use and avoiding the upfront costs of purchasing and maintaining physical servers.
Root Access and Customization:
Just like traditional dedicated servers, cloud-hosted VPSes provide root access, giving users complete control over their virtual server environment. This allows businesses and IT teams to install custom software, configure settings to their exact specifications, and tailor the environment to their specific needs.
Isolation and Security:
VPSs are logically isolated networks, ensuring that each VPS operates independently within the cloud environment. This isolation protects against the "noisy neighbor" effect, where one VPS's excessive resource usage could impact others sharing the same physical server. Additionally, cloud providers often implement robust security measures to protect VPSes and their customer's data.
Scalability and Flexibility:
Cloud VPSes can be deployed dynamically and scaled up or down easily to accommodate changing needs. This flexibility is a major advantage for businesses experiencing growth or seasonal fluctuations in traffic. Public cloud providers offer a range of VPS configurations, allowing businesses to choose the right resources to optimize performance and cost.
High Availability and Reliability:
Public cloud offerings typically include built-in redundancy and failover mechanisms to minimize downtime. If a physical server fails, the VPS can be quickly migrated to another server, ensuring that websites and applications remain accessible.
Private Cloud Options:
While public cloud providers like Google Cloud are popular choices, some organizations opt for private cloud-hosted VPS solutions like Atlantic.Net. Private clouds offer greater control and customization but may require more in-house IT expertise. Hybrid cloud deployments, combining public and private clouds, offer another option for businesses seeking flexibility and control over their data.
Whether you choose a public cloud provider, a private cloud-hosted solution, or a hybrid approach, VPSes in the cloud environment offer a powerful and flexible way to host your applications and websites.
What Is the Difference between VPC and VPN?
Another term that is often confused with VPC is a Virtual Private Network (VPN), a technology that creates a secure, encrypted tunnel over a public network (like the Internet) to connect remote users or locations to a private network. It acts like a secure bridge, allowing you to access private resources remotely as if you were physically present on the network.
The primary difference between a VPC and a VPN is their scope. A VPC is a private virtual network, while a VPN is a tool to securely access a private network (which could be a VPC). You can use a VPN to securely connect to your VPC from any location with an internet connection.
What Are VPC Servers Used for?
While "VPC server" isn't a standalone concept, understanding the distinct use cases for Virtual Private Servers (VPSes) and Virtual Private Clouds (VPCs) is crucial when choosing the right hosting solution from Atlantic.Net.
Atlantic.Net VPS Use Cases:
Web Hosting: Launch and manage websites and web applications with dedicated resources and root access.
Application Hosting: Run resource-intensive software applications requiring isolated environments.
Development and Testing Environments: Create customizable sandboxes for software development and testing processes.
Atlantic.Net VPC Use Cases:
Enterprise Applications: Host mission-critical business applications demanding high security, compliance, and customization.
Complex Environments: Manage intricate multi-tier applications or multiple virtual servers within a secure, isolated network.
Hybrid Cloud Environments: Seamlessly connect on-premises infrastructure to Atlantic.Net's cloud resources for enhanced scalability and flexibility.
Choosing the Right Atlantic.Net Solution for Your Needs
The decision between a VPS and a VPC from Atlantic.Net depends on your specific requirements:
Atlantic.Net VPS: Ideal if you need a single, cost-effective virtual server with full control (root access) and dedicated resources.
Atlantic.Net VPC: The optimal choice for complex projects, multiple virtual servers, enhanced security, compliance requirements (like HIPAA), and complete customization of your virtual network environment.
If you're still unsure, Atlantic.Net's team of experts can help you assess your needs and recommend the best solution for your specific use case. Don't hesitate to contact us for personalized guidance.
### How to Install Mosquitto MQTT Server on Ubuntu 24.04
Mosquitto MQTT is an open-source message broker that implements the MQTT protocol. It is a lightweight, publish-subscribe network protocol designed for low-bandwidth, high-latency networks. It facilitates efficient communication between devices, making it ideal for Internet of Things (IoT) applications and other scenarios requiring reliable message delivery with minimal overhead. Mosquitto supports various security features, such as TLS encryption and authentication, ensuring secure data transmission. Its ability to handle thousands of concurrent connections makes it suitable for large-scale deployments.
In this tutorial, we will walk you through the process of installing the Mosquitto MQTT Server on Ubuntu 24.04.
Step 1 - Installing Required Packages
First, we need to update our package list and install some essential packages required for the installation process. Open your terminal and run the following command to make sure the packages you need are available - please note, most of these may already be installed by default:
apt-get update
apt-get install curl gnupg2 wget git apt-transport-https ca-certificates -y
Step 2 - Adding the Mosquitto PPA
Next, we need to add the Mosquitto PPA (Personal Package Archive) to our system. The PPA provides the latest version of Mosquitto. Run the following command:
add-apt-repository ppa:mosquitto-dev/mosquitto-ppa -y
This command adds the Mosquitto PPA to your system's software sources.
Step 3 - Installing Mosquitto and Mosquitto Clients
Now that the PPA has been added, we can install Mosquitto and its clients. Execute the following command:
apt install mosquitto mosquitto-clients -y
This command installs the Mosquitto server and the Mosquitto client utilities (mosquitto_sub and mosquitto_pub).
To verify that Mosquitto has been installed correctly and is running, use the systemctl command to check its status:
systemctl status mosquitto
You should see an output similar to this:
● mosquitto.service - Mosquitto MQTT Broker
Loaded: loaded (/usr/lib/systemd/system/mosquitto.service; enabled; preset: enabled)
Active: active (running) since Mon 2025-05-12 06:23:36 UTC; 9s ago
Docs: man:mosquitto.conf(5)
man:mosquitto(8)
Process: 49200 ExecStartPre=/bin/mkdir -m 740 -p /var/log/mosquitto (code=exited, status=0/SUCCESS)
Process: 49202 ExecStartPre=/bin/chown mosquitto:mosquitto /var/log/mosquitto (code=exited, status=0/SUCCESS)
Process: 49204 ExecStartPre=/bin/mkdir -m 740 -p /run/mosquitto (code=exited, status=0/SUCCESS)
Process: 49206 ExecStartPre=/bin/chown mosquitto:mosquitto /run/mosquitto (code=exited, status=0/SUCCESS)
Main PID: 49208 (mosquitto)
Tasks: 1 (limit: 4609)
Memory: 1.0M (peak: 1.5M)
CPU: 25ms
CGroup: /system.slice/mosquitto.service
└─49208 /usr/sbin/mosquitto -c /etc/mosquitto/mosquitto.conf
May 12 06:23:36 ubuntu systemd[1]: Starting mosquitto.service - Mosquitto MQTT Broker...
May 12 06:23:36 ubuntu systemd[1]: Started mosquitto.service - Mosquitto MQTT Broker.
The output indicates that the Mosquitto service is active and running.
Step 4 - Configuring Mosquitto
By default, Mosquitto is configured to allow anonymous connections. For security reasons, it is recommended to set up a password for your Mosquitto broker.
Run the following command to create a password file and add a user:
mosquitto_passwd -c /etc/mosquitto/passwd hjethva
You will be prompted to enter and confirm a password for the user you just created (hjethva).
Password:
Reenter password:
Set the correct ownership for the password file:
chown mosquitto:mosquitto /etc/mosquitto/passwd
Next, create a configuration file to specify the listener and password file. Open the configuration file with nano:
nano /etc/mosquitto/conf.d/default.conf
Add the following lines:
listener 1883
password_file /etc/mosquitto/passwd
These lines configure Mosquitto to listen on port 1883 and use the specified password file for authentication.
After making these changes, restart the Mosquitto service to apply the new configuration:
systemctl restart mosquitto
Step 5 - Testing Mosquitto
To ensure everything is working correctly, we will test Mosquitto using the mosquitto_pub and mosquitto_sub commands.
Open a terminal window and subscribe to a topic - remember to change the YOUR_PASSWORD value.
mosquitto_sub -u hjethva -P YOUR_PASSWORD -v -t "hello/topic"
In another terminal window, publish a message on the same topic - - remember to change the YOUR_PASSWORD value.
mosquitto_pub -u hjethva -P YOUR_PASSWORD -t 'hello/topic' -m 'hello MQTT'
You should see the following output in the subscriber terminal:
hello/topic hello MQTT
This confirms that the Mosquitto server is working correctly.
Conclusion
In this tutorial, we have covered the installation and configuration of the Mosquitto MQTT server on Ubuntu 24.04. We also demonstrated how to secure the server with a password and tested the setup using Mosquitto client tools. Mosquitto is a powerful and lightweight MQTT broker that is widely used in IoT and messaging applications. With this setup, you can now start building your own MQTT-based solutions. You can try deploying Mosquitto MQTT on dedicated server hosting from Atlantic.Net!
### How to Install ClickHouse OLAP Database System Ubuntu 22.04
ClickHouse is an open-source columnar database management system designed for online analytical processing (OLAP). It was developed by Yandex, a Russian multinational corporation specializing in Internet-related products and services. ClickHouse is known for its high performance in handling large volumes of data and its ability to execute complex queries in real-time, making it an ideal solution for data analytics and big data applications.
This tutorial will guide you through the process of installing ClickHouse on an Ubuntu 22.04 system, configuring it, and performing basic operations.
Step 1 - Install Required Dependencies
ClickHouse requires certain dependencies to be installed on your system. Install these dependencies using the following command:
apt install apt-transport-https ca-certificates dirmngr
Step 2 - Add ClickHouse Repository and GPG Key
Next, we need to add the ClickHouse repository to our system's package sources list and import the GPG key to ensure the packages' authenticity.
apt-key adv --keyserver hkp://keyserver.ubuntu.com:80 --recv 8919F6BD2B48D754
echo "deb https://packages.clickhouse.com/deb stable main" | tee /etc/apt/sources.list.d/clickhouse.list
After adding the ClickHouse repository, update your package list to include the new repository:
apt update
Step 3 - Install ClickHouse
Now, install the ClickHouse server and client using the following command:
apt install clickhouse-server clickhouse-client
You will be asked to set a password for the default user.
Enter password for the default user:
Password for the default user is saved in file /etc/clickhouse-server/users.d/default-password.xml.
You can also access the /etc/clickhouse-server/users.d/default-password.xml file to retrieve or change the password as needed.
Step 4 - Start and Enable ClickHouse Service
To start the ClickHouse server and enable it to start on boot, use the following commands:
systemctl start clickhouse-server
systemctl enable clickhouse-server
Verify that the ClickHouse server is running:
systemctl status clickhouse-server
You should see output similar to the following, indicating that the service is active and running:
● clickhouse-server.service - ClickHouse Server (analytic DBMS for big data)
Loaded: loaded (/lib/systemd/system/clickhouse-server.service; enabled; vendor preset: enabled)
Active: active (running) since Wed 2024-06-26 11:27:31 UTC; 3s ago
Main PID: 43570 (clickhouse-serv)
Tasks: 666 (limit: 4579)
Memory: 133.7M
CPU: 1.065s
CGroup: /system.slice/clickhouse-server.service
├─43569 clickhouse-watchdog "" "" "" "" "" "" "" --config=/etc/clickhouse-server/config.xml --pid-file=/run/clickhouse-server/clickhouse-server.pid
└─43570 /usr/bin/clickhouse-server --config=/etc/clickhouse-server/config.xml --pid-file=/run/clickhouse-server/clickhouse-server.pid
Jun 26 11:27:30 ubuntu systemd[1]: Starting ClickHouse Server (analytic DBMS for big data)...
Jun 26 11:27:30 ubuntu clickhouse-server[43569]: Processing configuration file '/etc/clickhouse-server/config.xml'.
Jun 26 11:27:30 ubuntu clickhouse-server[43569]: Logging trace to /var/log/clickhouse-server/clickhouse-server.log
Jun 26 11:27:30 ubuntu clickhouse-server[43569]: Logging errors to /var/log/clickhouse-server/clickhouse-server.err.log
Step 5 - Access ClickHouse Client
To interact with the ClickHouse server, use the ClickHouse client. Open the client and log in using the default user:
clickhouse-client --user default --password
Enter the password when prompted. You should see a prompt similar to this:
ClickHouse client version 24.5.3.5 (official build).
Password for user (default):
Connecting to localhost:9000 as user default.
Connected to ClickHouse server version 24.5.3.
Warnings:
* Delay accounting is not enabled, OSIOWaitMicroseconds will not be gathered. You can enable it using `echo 1 > /proc/sys/kernel/task_delayacct` or by using sysctl.
* Maximum number of threads is lower than 30000. There could be problems with handling a lot of simultaneous queries.
ubuntu :)
Step 6 - Basic Operations in ClickHouse
Now that ClickHouse is installed and running, let's perform some basic operations to familiarize ourselves with the database system.
Create a new database named db1:
CREATE DATABASE db1;
USE db1;
Create a table named users with some sample columns:
CREATE TABLE users (id UInt64, name String, jobs String, last_login DateTime) ENGINE=MergeTree() PRIMARY KEY id ORDER BY id;
Insert some sample data into the user's table:
INSERT INTO users VALUES (1, 'jay', 'admin', '2024-06-10 00:10:10');
INSERT INTO users VALUES (2, 'hit', 'Manager', '2024-06-05 01:19:10');
Query the data from the user's table:
SELECT * FROM users;
The output should be:
Query id: 9ff7c880-b63b-4762-b90e-f32f0020564f
┌─id─┬─name─┬─jobs────┬──────────last_login─┐
1. │ 2 │ hit │ Manager │ 2024-06-05 01:19:10 │
└────┴──────┴─────────┴─────────────────────┘
┌─id─┬─name─┬─jobs──┬──────────last_login─┐
2. │ 1 │ jay │ admin │ 2024-06-10 00:10:10 │
└────┴──────┴───────┴─────────────────────┘
Update a record in the user table:
ALTER TABLE users UPDATE jobs = 'Administrator' WHERE name = 'hit';
Verify the update by querying the data again:
SELECT * FROM users;
The output should show the updated data:
┌─id─┬─name─┬─jobs──────────┬──────────last_login─┐
1. │ 2 │ hit │ Administrator │ 2024-06-05 01:19:10 │
└────┴──────┴───────────────┴─────────────────────┘
┌─id─┬─name─┬─jobs──┬──────────last_login─┐
2. │ 1 │ jay │ admin │ 2024-06-10 00:10:10 │
└────┴──────┴───────┴─────────────────────┘
Finally, drop the table and database:
DROP TABLE users;
DROP DATABASE db1;
List all databases to ensure db1 has been dropped:
SHOW DATABASES;
You should see the following databases:
┌─name───────────────┐
1. │ INFORMATION_SCHEMA │
2. │ default │
3. │ information_schema │
4. │ system │
└────────────────────┘
Conclusion
In this tutorial, we covered the installation of ClickHouse on an Ubuntu 22.04 system, starting and enabling the ClickHouse service, and performing basic database operations. ClickHouse is a robust tool for OLAP applications, offering high performance for real-time analytics. By following these steps, you should have a fully functional ClickHouse setup ready for your data analytics needs. applications. With this setup, you can now start building your own MQTT-based solutions. You can use Mosquitto MQTT as a database on dedicated server hosting from Atlantic.Net!
### How to Install CrowdSec IDS on Ubuntu 22.04
Intrusion Detection Systems (IDS) play a crucial role in safeguarding your network by monitoring and analyzing traffic for suspicious activities and potential threats. CrowdSec is an open-source, collaborative security platform leveraging community-driven threat intelligence's power to provide robust protection. It offers an efficient and scalable way to detect and mitigate a wide range of security threats, from brute force attacks to more sophisticated exploits.
In this guide, we will walk you through the process of installing CrowdSec IDS on Ubuntu 22.04.
Step 1 - Install CrowdSec
First, you need to add the CrowdSec repository to install CrowdSec.
curl -s https://packagecloud.io/install/repositories/crowdsec/crowdsec/script.deb.sh | bash
This command downloads and runs a script to add the CrowdSec repository to your system.
Next, install CrowdSec.
apt install crowdsec
You will be asked to select the service that you want to monitor.
Select any service and click on Continue. You will see the following page.
Select any service from the above list or click on Cancel to finish the installation.
Step 2 - Install Firewall Bouncer
Next, install the CrowdSec Firewall Bouncer for IPTables. This will enable CrowdSec to interact with your firewall to block malicious IPs.
apt install -y crowdsec-firewall-bouncer-iptables
Step 3 - Verify Installation
To verify that CrowdSec is installed and running correctly, use the following command:
cscli collections list
This will display a list of installed collections:
COLLECTIONS
─────────────────────────────────────────────────────────────────────────────────────────────────────────────
Name 📦 Status Version Local Path
─────────────────────────────────────────────────────────────────────────────────────────────────────────────
crowdsecurity/apache2 ✔️ enabled 0.1 /etc/crowdsec/collections/apache2.yaml
crowdsecurity/base-http-scenarios ✔️ enabled 1.0 /etc/crowdsec/collections/base-http-scenarios.yaml
crowdsecurity/http-cve ✔️ enabled 2.6 /etc/crowdsec/collections/http-cve.yaml
crowdsecurity/linux ✔️ enabled 0.2 /etc/crowdsec/collections/linux.yaml
crowdsecurity/sshd ✔️ enabled 0.3 /etc/crowdsec/collections/sshd.yaml
─────────────────────────────────────────────────────────────────────────────────────────────────────────────
Step 4 - Set Up Dashboard
To set up the CrowdSec dashboard, you will need Docker. First, install Docker:
apt install -y docker.io
Then, set up the CrowdSec dashboard:
cscli dashboard setup
You will be prompted to accept the security responsibility for the Metabase instance and to add a new group called 'crowdsec'. Accept these prompts by typing Yes. The setup process will pull the necessary Docker image and start the Metabase container. Once it's ready, you will see the following information:
? CrowdSec takes no responsibility for the security of your metabase instance. Do you accept these responsibilities ? Yes
? For metabase docker to be able to access SQLite file we need to add a new group called 'crowdsec' to the system, is it ok for you ? Yes
INFO Pulling docker image metabase/metabase:v0.46.6.1
INFO creating container 'crowdsec-metabase'
INFO waiting for metabase to be up (can take up to a minute)
............
INFO Metabase is ready
URL : 'http://127.0.0.1:3000'
username : 'crowdsec@crowdsec.net'
password : 'cmC3d6ynmhKqopnY'
Note down the username and password from the above output.
Step 5 - Accessing the Dashboard
By default, the CrowdSec dashboard can be accessed only from the local host. To access the dashboard from a remote machine, you need to forward the local port 3000 to the CrowdSec server's port 3000 using SSH:
ssh -L 3000:127.0.0.1:3000 your_username@remote_server_ip
Replace your_username with your actual username on the remote server and remote_server_ip with the IP address or hostname of the remote server.
Open your web browser and navigate to http://127.0.0.1:3000. This will forward your local port 3000 to port 3000 on the remote server, allowing you to access the remote web application as if it were running locally.
Provide your CrowdSec credential and click on Sign In. The CrowdSec dashboard will appear on the following page.
Step 5 - Enable and Disable Scenarios
You can enable or disable specific scenarios using the cscli command. For example, to enable the SSH brute-force scenario in simulation mode:
cscli simulation enable crowdsecurity/ssh-bf
systemctl reload crowdsec
To disable the SSH brute-force scenario:
cscli simulation disable crowdsecurity/ssh-bf
systemctl reload crowdsec
Conclusion
Congratulations! You have successfully installed and configured CrowdSec IDS on Ubuntu 22.04. With CrowdSec, you now have a powerful tool to protect your server from various cyber threats. The dashboard provides an intuitive interface for monitoring and managing security incidents. Regularly check for updates and new scenarios to keep your system secure. You can start deploying CrowdSec IDS on dedicated server hosting from Atlantic.Net!
### How to Install SolidInvoice on Ubuntu 22.04
SolidInvoice is an open-source invoicing application designed for small to medium-sized businesses. It is a robust invoicing application that helps businesses streamline their invoicing and billing processes. It offers features such as client management, quote creation, payment tracking, and more, making it an ideal choice for businesses looking to improve their financial management.
In this tutorial, we will explain how to install and configure SolidInvoice on Ubuntu 22.04.
Step 1 - Install LAMP Server
SolidInvoice requires a web server, a database server, and PHP with various extensions. We'll use Apache as our web server and MariaDB as our database server.
Install Apache, MariaDB, PHP, and the necessary PHP extensions with the following command:
apt install apache2 mariadb-server mariadb-client php php-curl php-common php-mbstring php-json php-mysql php-opcache php-bcmath php-intl php-gd php-xml php-soap php-zip php-apcu unzip
Verify the PHP installation:
php -v
You should see output similar to this:
PHP 8.1.2-1ubuntu2.18 (cli) (built: Jun 14 2024 15:52:55) (NTS)
Copyright (c) The PHP Group
Zend Engine v4.1.2, Copyright (c) Zend Technologies
with Zend OPcache v8.1.2-1ubuntu2.18, Copyright (c), by Zend Technologies
Open the PHP configuration file for Apache:
nano /etc/php/8.1/apache2/php.ini
Modify the following settings:
date.timezone = UTC
memory_limit=512M
upload_max_filesize=64M
post_max_size=120M
max_execution_time=120
Save and close the file, then restart Apache to apply the changes:
systemctl restart apache2
Step 2 - Configure MariaDB Database
Log in to the MariaDB shell.
mysql
Create a database and user for SolidInvoice:
CREATE DATABASE solidinvoice;
CREATE USER solidinvoice@localhost IDENTIFIED BY 'securepassword';
Grant all the privileges to the SolidInvoice database.
GRANT ALL PRIVILEGES ON solidinvoice.* TO solidinvoice@localhost;
Flush the privileges and exit from the MariaDB shell.
FLUSH PRIVILEGES;
EXIT;
Step 3 - Download and Install SolidInvoice
Download the latest version of SolidInvoice from the Sourceforge website.
wget https://master.dl.sourceforge.net/project/solidinvoice.mirror/2.2.6/SolidInvoice-2.2.6.zip
Unzip the downloaded file to the web root directory:
unzip SolidInvoice-2.2.6.zip -d /var/www/html/solidinvoice
Set the appropriate permissions:
chown -R www-data:www-data /var/www/html/solidinvoice
chmod -R 775 /var/www/html/solidinvoice
Step 4 - Configure Apache
Create a new virtual host configuration for SolidInvoice:
nano /etc/apache2/sites-available/solidinvoice.conf
Add the following content:
ServerName invoice.example.com
DocumentRoot /var/www/html/solidinvoice/public
AllowOverride All
Order allow,deny
Allow from All
ErrorLog /var/log/apache2/solidinvoice.error.log
CustomLog /var/log/apache2/solidinvoice.access.log combined
Save and close the file, then activate the new virtual host and enable the Apache rewrite module.
a2ensite solidinvoice.conf
a2enmod rewrite
Restart Apache to apply the changes:
systemctl restart apache2
Step 5 - Set Up Cron Job
SolidInvoice requires a cron job to handle background tasks. Open the crontab file:
nano /etc/crontab
Add the following line:
* * * * * php /var/www/html/solidinvoice/bin/console cron:run -e prod -n
This cron job runs every minute and executes SolidInvoice's background tasks.
Step 6 - Complete the Installation Through the Web Interface
Open your web browser and navigate to http://invoice.example.com. You should see the SolidInvoice PHP requirement page.
Make sure all dependencies are installed, then click on Next. You will see the database setup page.
Define your database and click on Next. You will see the following page.
Click on Next. You will see the system settings page.
Define your admin user and password and click on Next. You will see the following page.
Click on Log in now. You will see the Solidinvoice login page.
Provide your admin credential and click on Login. You will see the following page.
Define your company name and click on Create. You will see the Solidinvoice dashboard.
Conclusion
Congratulations! You have successfully installed SolidInvoice on your Ubuntu 22.04 server. With SolidInvoice, you can efficiently manage your invoicing and billing processes, helping you to keep track of clients, quotes, and payments seamlessly. This installation provides a solid foundation for your business operations, ensuring you have a reliable and efficient system in place. Let's try to deploy SolidInvoice on dedicated server hosting from Atlantic.Net!
### How to Back Up and Restore a MySQL Database
Backing up your database is essential for preventing data loss and ensuring you can recover from system failures or accidental deletions. Restoring a database is equally important, allowing you to recover data from backups and maintain business continuity.
In this tutorial, we will guide you through the process of backing up and restoring a MySQL database.
Introduction to MySQL Backups
MySQL backups are crucial for data protection. A good backup strategy ensures that you can recover from data loss, corruption, or other disasters. There are different types of backups: full backups, incremental backups, and differential backups.
Full Backup: This involves creating a complete copy of the database. It is the most comprehensive type but can be time-consuming and resource-intensive.
Incremental Backup: This captures only the changes made since the last backup. It is quicker and uses fewer resources but requires more effort during restoration.
Differential Backup: This captures all changes made since the last full backup. It is a balance between full and incremental backups.
Basic Syntax for Backing Up and Restoring Databases
Before diving into detailed methods and examples, it's important to understand the basic syntax for backing up and restoring MySQL databases using the command line.
Basic Syntax for Backing Up
To back up a MySQL database, you can use the mysqldump command. The basic syntax is:
mysqldump -u [username] -p [database_name] > [backup_file.sql]
-u [username]: Specifies the MySQL username.
-p: Prompts for the MySQL password.
[database_name]: Name of the database you want to back up.
> [backup_file.sql]: Redirects the output to a SQL file.
Basic Syntax for Restoring
To restore a MySQL database from a backup file, you can use the mysql command. The basic syntax is:
mysql -u [username] -p [database_name] < [backup_file.sql]
-u [username]: Specifies the MySQL username.
-p: Prompts for the MySQL password.
[database_name]: Name of the database you want to restore.
< [backup_file.sql]: Redirects the input from a SQL file.
Backup a MySQL Database
To back up a single database named exampledb, run:
mysqldump -u root -p exampledb > exampledb_backup.sql
When prompted, enter your MySQL password. This command creates a file named exampledb_backup.sql containing the SQL statements needed to recreate the database.
To backup multiple databases, run:
mysqldump -u root -p --databases db1 db2 db3 > multiple_dbs_backup.sql
This command creates a backup file named multiple_dbs_backup.sql that contains the SQL statements for db1, db2, and db3.
To backup all databases, run:
mysqldump -u root -p --all-databases > all_dbs_backup.sql
This command creates a backup file named all_dbs_backup.sql containing the SQL statements for all databases on the server.
Restore a MySQL Database
Restoring a MySQL database can be done using the mysql command-line utility. The mysql utility allows you to execute SQL statements stored in a file. This is useful for restoring backups created with mysqldump.
To restore a single database from a backup file named exampledb_backup.sql, run:
mysql -u root -p exampledb < exampledb_backup.sql
When prompted, enter your MySQL password. This command restores the exampledb database from the exampledb_backup.sql file.
To restore multiple databases from a backup file named multiple_dbs_backup.sql, run:
mysql -u root -p < multiple_dbs_backup.sql
This command restores the databases db1, db2, and db3 from the multiple_dbs_backup.sql file.
To restore all databases from a backup file named all_dbs_backup.sql, run:
mysql -u root -p < all_dbs_backup.sql
This command restores all databases from the all_dbs_backup.sql file.
Conclusion
In this article, we explored the importance of backing up and restoring MySQL databases. We discussed different types of backups and demonstrated how to back up and restore databases using mysqldump. We covered how to back up and restore single databases, multiple databases, and all databases. Backing up your data is essential for preventing data loss, and knowing how to restore it ensures that you can recover quickly from any issues. You can now perform MySQL backup operations on dedicated server hosting from Atlantic.Net!
### How to Create and Delete a Postgres Database
Managing databases is a fundamental skill for any database administrator or developer. This tutorial will guide you through the steps to create and delete databases in PostgreSQL. We'll start by setting up the necessary environment and ensuring you have the required permissions. Then, we'll dive into the commands needed to create and delete databases.
Prerequisites
Before we begin, make sure you have:
PostgreSQL is installed on your system.
Access to the psql command-line tool.
Superuser privileges or appropriate permissions to create and delete databases.
Step 1 - Connecting to PostgreSQL
First, let's connect to the PostgreSQL server using the psql command-line tool. Open your terminal and run:
sudo -u postgres psql
You'll be prompted to enter your password. After successfully logging in, you'll see the psql prompt:
postgres=#
Step 2 - Creating a PostgreSQL Database
To create a new PostgreSQL database, use the CREATE DATABASE command followed by the name of the database you want to create. Let's create a database named mydatabase:
CREATE DATABASE mydatabase;
After running this command, you should see a confirmation message:
CREATE DATABASE
To verify that the database has been created, list all databases:
\l
You should see mydatabase in the list:
List of databases
Name | Owner | Encoding | Collate | Ctype | Access privileges
------------+----------+----------+-------------+-------------+-----------------------
mydatabase | postgres | UTF8 | en_US.UTF-8 | en_US.UTF-8 |
postgres | postgres | UTF8 | en_US.UTF-8 | en_US.UTF-8 |
template0 | postgres | UTF8 | en_US.UTF-8 | en_US.UTF-8 | =c/postgres +
| | | | | postgres=CTc/postgres
template1 | postgres | UTF8 | en_US.UTF-8 | en_US.UTF-8 | =c/postgres +
| | | | | postgres=CTc/postgres
(4 rows)
Step 3 - Connecting to the New Database
Once the database is created, you can connect to it using the \c command followed by the database name:
\c mydatabase
You should see a message confirming the connection:
You are now connected to database "mydatabase" as user "postgres".
mydatabase=#
Step 4 - Deleting a PostgreSQL Database
To delete a PostgreSQL database, use the DROP DATABASE command followed by the name of the database. Be cautious with this command as it permanently deletes all data in the database. Let's delete mydatabase:
First, disconnect from the database (if you are currently connected to it):
\c postgres
Then, run the DROP DATABASE command:
DROP DATABASE mydatabase;
You should see a confirmation message:
DROP DATABASE
To verify that the database has been deleted, list all databases again:
\l
You should no longer see mydatabase in the list.
Conclusion
In this article, we covered how to create and delete a PostgreSQL database. We started by connecting to the PostgreSQL server, then we created a new database and verified its creation. Finally, we demonstrated how to delete the database and verify its deletion. You can now manage your PostgreSQL server on dedicated server hosting from Atlantic.Net!
### How to List All Databases in PostgreSQL
PostgreSQL is a powerful, open-source relational database management system used widely by developers and database administrators. Understanding how to list all databases in your PostgreSQL instance is crucial for database management and administration.
In this tutorial, we will walk you through various methods to view all databases present in a PostgreSQL instance.
Prerequisites
Before we dive into the details, make sure you have the following:
PostgreSQL is installed on your system.
Access to the PostgreSQL command line.
1. Using the psql Command Line Interface
The psql command line interface is a powerful tool to interact with your PostgreSQL database. Here’s how you can list all databases using psql.
1. First, you need to access the psql command line. Open your terminal and connect to your PostgreSQL server by running:
sudo -u postgres psql
Replace postgres with your PostgreSQL username. You will be prompted to enter your password.
2. Once you are logged in, you can list all databases by using the following command:
\l
Alternatively, you can use:
\list
Output:
List of databases
Name | Owner | Encoding | Collate | Ctype | Access privileges
------------+----------+----------+-------------+-------------+-----------------------
mydatabase | postgres | UTF8 | en_US.UTF-8 | en_US.UTF-8 |
postgres | postgres | UTF8 | en_US.UTF-8 | en_US.UTF-8 |
template0 | postgres | UTF8 | en_US.UTF-8 | en_US.UTF-8 | =c/postgres +
| | | | | postgres=CTc/postgres
template1 | postgres | UTF8 | en_US.UTF-8 | en_US.UTF-8 | =c/postgres +
| | | | | postgres=CTc/postgres
This output lists all databases along with their owners, encoding, collation, ctype, and access privileges.
2. Using SQL Queries
You can also use a SQL query to list all databases. This method can be handy if you prefer to use SQL commands directly.
1. Connect to your PostgreSQL server using the psql command line as described earlier.
2. Run the following SQL query to list all databases:
SELECT datname FROM pg_database;
Output:
datname
------------
postgres
mydatabase
template1
template0
(4 rows)
This query retrieves the names of all databases from the pg_database system catalog.
Conclusion
In this article, we explored several methods for listing all databases in PostgreSQL. We covered how to use the psql command line interface and execute SQL queries to view all databases. Each method offers a different approach, allowing you to choose the one that best suits your workflow. You can now test this tutorial on dedicated server hosting from Atlantic.Net!
### How to Create and Delete a Postgres User
Managing users in PostgreSQL is a crucial aspect of database administration. Whether you're setting up a new database or maintaining an existing one, knowing how to create and delete users efficiently is essential. In this tutorial, we'll walk you through the entire process step-by-step, ensuring that even if you're new to PostgreSQL, you'll find it easy to follow.
Prerequisites
Before we begin, ensure you have:
PostgreSQL installed on your system
Access to a PostgreSQL database as a superuser or a user with sufficient privileges
Basic knowledge of SQL commands and PostgreSQL
Step 1 - Connecting to PostgreSQL
To manage users, you first need to connect to your PostgreSQL database. Use the psql command-line tool for this purpose.
sudo -u postgres psql
This command connects you to the PostgreSQL server using the default postgres user. If you have set up a different superuser, replace postgres with that username.
psql (13.3)
Type "help" for help.
postgres=#
You're now connected to the PostgreSQL database and ready to create a new user.
Step 2 - Creating a New User
Creating a new user in PostgreSQL is straightforward. Use the CREATE USER command followed by the username and any optional parameters like password and privileges.
CREATE USER new_user WITH PASSWORD 'password123';
Output:
CREATE ROLE
The command above creates a new user named new_user with the password password123. By default, this user has no privileges beyond connecting to the database.
Step 3 - Granting Privileges to the User
To make the new user more useful, you'll likely want to grant some privileges. For instance, you might want the user to have the ability to create databases.
ALTER USER new_user CREATEDB;
Output:
ALTER ROLE
The ALTER USER command above grants the CREATEDB privilege to new_user, allowing them to create new databases.
Step 4 - Deleting a User
If you no longer need a user, you can remove them using the DROP USER command. Be careful with this operation as it cannot be undone.
DROP USER new_user;
Output.
DROP ROLE
The command above deletes the user new_user from the PostgreSQL database.
Conclusion
In this article, we covered the essential steps to create and delete a PostgreSQL user. You learned how to connect to your PostgreSQL database, create a new user, grant privileges, and finally, delete the user when they are no longer needed. These tasks are fundamental for PostgreSQL database administration and ensure that you can manage user access and permissions effectively. Try to create a user on PostgreSQL hosted on a dedicated server hosting from Atlantic.Net!
### How to Connect to MySQL through SSH Tunnel
SSH tunneling provides a secure way to connect to your MySQL database over an encrypted SSH connection, protecting your data from being intercepted during transmission. This is especially useful when accessing a remote MySQL server that isn't exposed to the public internet.
In this tutorial, we will learn how to connect to a MySQL database using an SSH tunnel securely.
Prerequisites
Before we get started, make sure you have the following:
Access to a remote server with SSH enabled.
MySQL server installed and running on the remote server.
SSH client installed on your local machine.
MySQL client installed on your local machine.
Step 1 - Open SSH Tunnel Using Command Line
To create an SSH tunnel, you can use the ssh command from your local machine. The basic syntax is as follows:
ssh -L local_port:remote_host:remote_port user@ssh_server -N
Here’s what each part means:
-L local_port:remote_host:remote_port: This specifies the local port, remote host, and remote port for the tunnel.
user@ssh_server: Your SSH username and the server you are connecting to.
-N: This tells SSH not to execute a remote command (just create the tunnel).
For example, to forward your local port 3306 to the remote MySQL server's port 3306 through an SSH server, you would use:
ssh -L 3306:localhost:3306 root@mysql-server-ip -N
Step 2 - Verify the SSH Tunnel
After running the command, your terminal will wait and not show any output, indicating that the tunnel is active. You can verify this by opening a new terminal window and checking the SSH connection:
netstat -plant | grep 3306
If the SSH tunnel is working, you should see output similar to this:
tcp 0 0 127.0.0.1:3306 0.0.0.0:* LISTEN 1234/ssh
Step 3 - Connecting to MySQL Through the SSH Tunnel
With the SSH tunnel set up, you can connect to the MySQL server using the mysql command:
mysql -h 127.0.0.1 -P 3306 -u your_mysql_user -p
You will be prompted to enter your MySQL password. Once authenticated, you can run your MySQL commands as if connected directly to the remote server.
Conclusion
In this article, we demonstrated how to connect to a MySQL database securely using an SSH tunnel. We covered setting up the SSH tunnel from the command line, verifying the tunnel, and connecting to MySQL using the command line. SSH tunneling ensures your database connections are secure, protecting sensitive data from potential interception. You can now access your MySQL hosted on dedicated server hosting from Atlantic.Net!
### List (Show) Tables in a MySQL Database
In this tutorial, you will learn how to connect to your MySQL server, select a database, and list all tables within that database. We will explore various commands such as SHOW TABLES, SHOW FULL TABLES, and queries on INFORMATION_SCHEMA. Additionally, we'll look at how to describe a specific table and list tables using MySQL Workbench.
Prerequisites
Before we start, ensure you have the following:
MySQL installed on your system.
Access to a MySQL database (you should have login credentials).
Basic understanding of MySQL commands.
Step 1- Connecting to MySQL
To begin, you need to connect to your MySQL server. Open your terminal or command prompt and use the following command:
mysql -u root -p
After entering your password, you'll be connected to the MySQL shell. If you see the mysql> prompt, you're good to go.
Step 2 - Selecting the Database
Once connected, select the database you want to work with. Use the USE command followed by the database name:
USE your_database_name;
For example, if your database is named test_db, the command would be:
USE test_db;
After executing this command, you should see the message "Database changed."
Step 3 - Listing Tables with SHOW TABLES
The simplest way to list all tables in your selected database is by using the SHOW TABLES command. Execute the following:
SHOW TABLES;
This will display all the tables in the current database. Here’s what the output might look like:
+-------------------+
| Tables_in_test_db |
+-------------------+
| departments |
| employees |
| salaries |
+-------------------+
3 rows in set (0.01 sec)
As you can see, the SHOW TABLES command is straightforward and provides a quick overview of all tables in the database.
Step 4 - Listing Tables with SHOW FULL TABLES
To get more detailed information about the tables, including whether they are base tables or views, use the SHOW FULL TABLES command:
SHOW FULL TABLES;
This command will show the table type along with the table names:
+-------------------+------------+
| Tables_in_test_db | Table_type |
+-------------------+------------+
| departments | BASE TABLE |
| employees | BASE TABLE |
| salaries | BASE TABLE |
+-------------------+------------+
3 rows in set (0.00 sec)
Step 4 - Describing a Specific Table
If you want more details about a specific table, you can use the DESCRIBE command. For instance, to describe the employees table, use:
DESCRIBE employees;
This command will output the structure of the employees table, including column names, data types, and other attributes:
+------------+---------------+------+-----+---------+-------+
| Field | Type | Null | Key | Default | Extra |
+------------+---------------+------+-----+---------+-------+
| emp_no | int | NO | PRI | NULL | |
| birth_date | date | NO | | NULL | |
| first_name | varchar(14) | NO | | NULL | |
| last_name | varchar(16) | NO | | NULL | |
| gender | enum('M','F') | NO | | NULL | |
| hire_date | date | NO | | NULL | |
+------------+---------------+------+-----+---------+-------+
6 rows in set (0.01 sec)
Step 5 - Using INFORMATION_SCHEMA to List Tables
Another way to list tables is by querying the INFORMATION_SCHEMA database, which stores metadata about all your databases. Here’s how to retrieve table names from INFORMATION_SCHEMA:
SELECT table_name
FROM INFORMATION_SCHEMA.TABLES
WHERE table_schema = 'test_db';
Replace your_database_name with the name of your database. This query provides the same result as SHOW TABLES but can be more flexible for complex queries.
Here’s an example output:
+-------------+
| TABLE_NAME |
+-------------+
| departments |
| employees |
| salaries |
+-------------+
3 rows in set (0.01 sec)
Step 6 - Show MySQL Tables from the Command Line
For users who prefer command-line interfaces, you can also list MySQL tables directly from the command line without entering the MySQL shell.
For example, if your username is root and your database is test_db, the command would be:
mysql -u root -p -e 'SHOW TABLES;' test_db
After entering your password, the tables in the specified database will be listed directly in your terminal.
+-------------------+
| Tables_in_test_db |
+-------------------+
| departments |
| employees |
| salaries |
+-------------------+
Conclusion
In this article, we explored various methods to list tables in a MySQL database. We covered the SHOW TABLES command for a quick overview, the SHOW FULL TABLES command for detailed table types, and the DESCRIBE command for table details. Additionally, we learned how to use INFORMATION_SCHEMA for more advanced queries. You can try to use MySQL on dedicated server hosting from Atlantic.Net!
### How to Show/List Users in MySQL
Managing users is a fundamental aspect of database administration. In this tutorial, we'll cover the steps necessary to display all users within a MySQL database. This includes using SQL queries to fetch user details, filtering users based on specific criteria, and understanding user privileges. Additionally, we will explore how to list MySQL users using the mysqladmin command-line tool.
Prerequisites
Before we dive into listing users, make sure you have the following prerequisites:
MySQL installed on your system
Access to MySQL with administrative privileges
Basic understanding of MySQL commands and SQL syntax
Step 1 - Connecting to MySQL
First, let's connect to the MySQL server. Open your terminal or command prompt and enter the following command:
mysql -u root -p
You will be prompted to enter the root user's password. After entering the password, you'll be logged into the MySQL shell.
Step 2 - Using the SELECT Statement
In MySQL, user information is stored in a table called mysql.user. To list all users, you need to query this table.
To display all users, execute the following SQL command:
SELECT User, Host FROM mysql.user;
This command will list all users along with the hosts from which they can connect.
+------------------+-----------+
| User | Host |
+------------------+-----------+
| debian-sys-maint | localhost |
| mysql.infoschema | localhost |
| mysql.session | localhost |
| mysql.sys | localhost |
| root | localhost |
| user1 | localhost |
+------------------+-----------+
6 rows in set (0.00 sec)
Step 3 - Detailed User Information
If you need more details about each user, you can expand the query to include additional columns:
SELECT User, Host, authentication_string, plugin, password_expired FROM mysql.user;
Output:
+------------------+-----------+------------------------------------------------------------------------+-----------------------+------------------+
| User | Host | authentication_string | plugin | password_expired |
+------------------+-----------+------------------------------------------------------------------------+-----------------------+------------------+
| debian-sys-maint | localhost | $A$005$@Wdglgbtv|9j(cxJW68OpLkbqlxBgsfH0qsLhyC94qbAMa6zgVhVZA88 | caching_sha2_password | N |
| mysql.infoschema | localhost | $A$005$THISISACOMBINATIONOFINVALIDSALTANDPASSWORDTHATMUSTNEVERBRBEUSED | caching_sha2_password | N |
| mysql.session | localhost | $A$005$THISISACOMBINATIONOFINVALIDSALTANDPASSWORDTHATMUSTNEVERBRBEUSED | caching_sha2_password | N |
| mysql.sys | localhost | $A$005$THISISACOMBINATIONOFINVALIDSALTANDPASSWORDTHATMUSTNEVERBRBEUSED | caching_sha2_password | N |
| root | localhost | | auth_socket | N |
| user1 | localhost | $A$005$M)n~_ELK>wrj;@NL&wGXK82ttCQPwQelqbl8dDn6W1FQB6A21SIJozFOJsrA | caching_sha2_password | N |
+------------------+-----------+------------------------------------------------------------------------+-----------------------+------------------+
6 rows in set (0.00 sec)
In this output, you can see the authentication method, whether the password is expired, and other useful information.
Step 4 - Filtering Users
Sometimes, you might want to list users based on specific criteria. For example, to list only users that can connect from any host (%), use the following command.
SELECT User, Host FROM mysql.user WHERE Host = '%';
Output:
+-------+------+
| User | Host |
+-------+------+
| user1 | % |
+-------+------+
Step 5 - Managing User Privileges
Understanding user privileges is crucial for database security. To list the privileges of a specific user, use the SHOW GRANTS command. For example, to display the privileges of user1:
SHOW GRANTS FOR 'user1'@'%';
Output:
+-----------------------------------------------------------------+
| Grants for user1@% |
+-----------------------------------------------------------------+
| GRANT USAGE ON *.* TO `user1`@`%` |
| GRANT SELECT, INSERT ON `database1`.* TO `user1`@`%` |
+-----------------------------------------------------------------+
Step 6 - List MySQL Users Using mysqladmin
Another way to list MySQL users is by using the mysqladmin command-line tool. This tool provides a quick way to perform various administrative tasks, including listing users.
To see the general status of the MySQL server, including user information, use the following command:
mysqladmin -u root -p extended-status
After entering the root password, you will see an extended status output. However, this command doesn't directly list users but provides a comprehensive server status, which includes various metrics.
To see the currently active MySQL users, you can use the processlist command:
mysqladmin -u root -p processlist
Output:
+----+------+-----------+-----------+---------+------+-------+------------------+
| Id | User | Host | db | Command | Time | State | Info |
+----+------+-----------+-----------+---------+------+-------+------------------+
| 2 | root | localhost | mydb | Query | 0 | init | show processlist |
| 3 | user1| localhost | database1 | Sleep | 5 | | |
+----+------+-----------+-----------+---------+------+-------+------------------+
This output shows the currently active users and their corresponding processes.
Conclusion
In this article, we covered how to show or list users in MySQL. You learned how to connect to MySQL, list all users, retrieve detailed user information, filter users based on specific criteria, and display user privileges. Additionally, we explored how to use the mysqladmin tool to view user information. You can now test MySQL on dedicated server hosting from Atlantic.Net!
### How to Create and Select MySQL Databases
Databases are the backbone of any application, enabling you to store, manage, and retrieve data efficiently. Whether you are setting up a new project or managing an existing one, understanding how to create and select databases is crucial.
In this tutorial, we will walk you through the essential steps of creating and selecting MySQL databases.
Prerequisites
Before we begin, ensure you have MySQL installed on your system. You should also have access to the MySQL command line.
Step 1 - Creating a MySQL Database
1. First, open your terminal or command prompt. If you have MySQL installed, you can access the MySQL command line by typing:
mysql -u root -p
Press Enter and provide your MySQL root password when prompted. You will see the MySQL prompt:
mysql>
2. Use the CREATE DATABASE command followed by the name of the database to create a database. For example, to create a database named test_db, you would type:
CREATE DATABASE test_db;
You should see a message confirming the database has been created:
Query OK, 1 row affected (0.00 sec)
3. To verify that your new database has been created, you can list all databases using the SHOW DATABASES command:
SHOW DATABASES;
The output will include your newly created database:
+--------------------+
| Database |
+--------------------+
| information_schema |
| mysql |
| performance_schema |
| sys |
| test_db |
+--------------------+
5 rows in set (0.00 sec)
Step 2 - Selecting a MySQL Database
1. Once you have created your database, you need to select it before performing any operations like creating tables or inserting data. To select a database, use the USE command followed by the database name. For example, to select the test_db database, you would type:
USE test_db;
You should see a confirmation message:
Database changed
2. To confirm which database is currently selected, you can use the SELECT DATABASE() function:
SELECT DATABASE();
The output will show the name of the selected database:
+------------+
| DATABASE() |
+------------+
| test_db |
+------------+
1 row in set (0.00 sec)
Conclusion
In this article, we covered the fundamental steps for creating and selecting MySQL databases. You learned how to access the MySQL command line, create a new database, verify its creation, and select it for use. These basic operations are essential for managing your data effectively in MySQL. Try to use MySQL on dedicated server hosting from Atlantic.Net!
### Server Management Windows
Microsoft has tried to make all flavors of Windows and Windows Server as user-friendly as possible, and it has included several excellent server management tools in the Operating System.
Thanks to this attention to usability, Windows and Windows Server users can experience quality and proven server management tools out-of-the-box - tools that are easy to use and learn, not to mention that Microsoft applications always have great online documentation if users get stuck.
A wide selection of propriety-licensed products and third-party management tools are also available, most of which are free-to-use. This article will discuss the Windows Server Management Tools that will make your life easier.
What Is Windows Server Management?
Windows Server Management includes all the activities sysadmins perform to keep Windows server instances running smoothly, securely, and efficiently. Typically, the tasks center around the installation, configuration, monitoring, troubleshooting, updating, and security hardening of Windows.
Users who implement effective server management tasks benefit from better overall performance and stronger data integrity features with tools like BitLocker and typically achieve better uptime results.
What types of tools are available in Windows Server for Server Management?
Thousands of server management tools are available to manage Windows Server. We have focused on the more popular first-party and third-party tools that are favored by system administrators.
Remote Server Administration Tools
RSAT allows administrators to manage Windows Servers remotely from their Windows laptops or workstations. It's a vital tool for server administration and is particularly useful for managing multiple servers and remote servers. RSAT includes tools like Server Manager, Microsoft Management Console (MMC) snap-ins, and PowerShell cmdlets.
The RSAT snap-ins help admins manage Active Directory (ADUC, ADAC), Group Policy (GPMC), DNS, DHCP, devices, events, performance, and services. You install it locally and connect directly to the target server using remote access.
Manage Windows Server with Admin Center
Windows Admin Center (WAC) is a browser-based management experience that controls access to advanced server/computer configuration options, performance monitoring, event management, and role/feature installation.
WAC can manage both on-premises and cloud-based Windows Servers. It integrates with Microsoft Defender and is one of the management solutions that works perfectly via CLI/PowerShell.
System Center
System Center is an enterprise-grade suite of management tools designed for larger, complex IT environments on a corporate network. It offers sysadmins the ability to manage at scale - perfect for configuration management, monitoring, automation, and security.
System Center components like Configuration Manager (SCCM) and Operations Manager (SCOM) are commonly used for managing Windows Servers and other virtual machines.
Beyond Microsoft's native tools for managing servers, IT professionals turn to a wide array of third-party solutions for Windows Server management. For server roles like automated patch management, NinjaOne, and PDQ Deploy are popular choices.
Veeam Backup & Replication and Acronis Cyber Protect provide robust backup and recovery capabilities, and tools like Rapid7 InsightVM and Tenable Nessus can achieve deep security insights and hardening.
What Are the Most Important Tasks in Managing a Windows Server?
Asking this question to different system administrators would give you a different answer every time! The most important tasks for a server manager depend on the server's role and the business's goals.
According to Atlantic.Net engineers, there are 8 key areas to that are very important to consider:
Installation and Configuration: Ensuring correct installation of the operating system and roles/features, configuring network settings, storage, and security.
Patch Management: Keeping the operating system and applications up-to-date with the latest security patches and updates.
Performance Monitoring: Monitoring server performance metrics (CPU, memory, disk, network) to identify and resolve bottlenecks or issues.
Security Hardening: Implementing security best practices to protect the server from unauthorized access, malware, and other threats.
Backup and Recovery: Regularly backing up server data and configurations to ensure that they can be restored in the event of a disaster or data loss.
Log Management: Collecting and analyzing server logs to identify errors, security incidents, and performance issues.
Capacity Planning: Proactively monitoring resource usage and planning for future capacity needs to avoid performance degradation.
User Management: Managing user accounts, permissions, and access to ensure that only authorized users can access server resources.
Should I Choose an MSP to Help with Windows Server Management?
Choosing a Managed Service Provider (MSP) like Atlantic.Net for Windows Server management can be a strategic decision that allows your business to free up resources to focus on day-to-day business operations.
MSPs can offer around-the-clock expertise, 24/7 monitoring, proactive maintenance, and rapid response and resolution to complex issues. Managed services like server management ensure that your remote Windows servers are well-maintained, secure, and compliant.
If you have a large or complex environment, if your internal IT team is limited, or if you need email server support, load balancing, VPN support, Database Support, OnWatch Platinum monitoring, or vulnerability scanning, Atlantic.Net can fill the gaps and ensure that your servers receive adequate attention.
Atlantic.Net Server Management Managed Services
Don't let Windows server management become a headache. Simplify your IT operations and ensure peak performance of your Windows servers with Atlantic.Net's expert Managed Services.
From 24/7 monitoring and proactive maintenance to advanced security and robust backup solutions, we cover all your Windows Server management needs.
Ready to offload the burden of server management?
Contact Atlantic.Net today for a free consultation and discover how our Managed Services can streamline your IT infrastructure.
### Atlantic.Net Launches One-Click HIPAA-Compliant Cloud Hosting
We are pleased to announce a one-click deployment of our HIPAA-compliant cloud services, a web hosting solution that meets and exceeds the required administrative, physical, and technical safeguards mandated by the Health Insurance Portability and Accountability Act. The new offering allows faster deployment with instant access to resources and quicker compliance in minutes, not days! Atlantic.Net’s HIPAA One-Click Cloud Hosting solution is now available through instant sign-up.
Our HIPAA Platform includes everything you need to be HIPAA compliant and more!
Plans start from only $148.99 per month which includes:
Cloud Server
Fully Managed Firewall
Daily Onsite Backup
Business Associate Agreement
Optional Managed Services
In addition to our basic HIPAA-compliant hosting, we also offer a full range of managed services to go above and beyond compliance requirements:
Server Management
Vulnerability Scans
Migration Service
Intrusion Prevention Service
Multi-Factor Authentication
Off-Site Backup
TrendMicro Security Suite
Network Edge Protection
Load Balancing
New HIPAA Hosting One-Click Pricing Plans
The ongoing monthly cost greatly depends upon variables like security services, and server specifications. Here are a few standard HIPAA hosting pricing plans and packages:
These plans can be easily upgraded to fit power users as well – Atlantic.Net offers more robust resources that can play a vital role in the infrastructure needed to meet the growing demands of AI while maintaining compliance needs, such as those associated with HIPAA.
More About HIPAA-Compliant Hosting
Start your HIPAA-compliant hosting trial today risk-free! Atlantic.Net meets and surpasses HIPAA compliance requirements for both physical security and security configuration, with built-in extensibility for additional software, services, and features. If you are not satisfied with our solution for any reason, you can cancel anytime within the first 30 days.
### What Is a Bare Metal Server? Benefits, Use Cases, and Best Practices
A bare metal server is a physical server dedicated to a single tenant. Unlike virtual servers, which are partitioned into multiple, virtualized servers on a single physical machine, a bare metal server offers the entire server's resources without any overhead from virtualization. This setup allows for higher performance and stability, as the user has direct access to the physical hardware without any intermediaries.
Bare metal servers are typically used in scenarios where performance and control over the environment are critical. They provide users with the flexibility to customize the hardware to meet specific application or workload requirements. This direct access to hardware resources makes bare metal servers ideal for demanding applications that require consistent high performance.
Benefits of Bare Metal Servers
Enhanced Physical Isolation
Bare metal servers offer enhanced physical isolation compared to virtualized environments. This isolation is critical for businesses that handle sensitive data and are subject to strict regulatory requirements. By eliminating the "noisy neighbor" effect common in shared environments, bare metal servers ensure that a tenant's resources are not impacted by the activities of others, enhancing security and performance.
The physical isolation of bare metal servers also simplifies compliance with data protection regulations. Organizations can easily demonstrate that their data is stored and processed in a dedicated environment, which can be crucial for meeting the requirements of GDPR, HIPAA, and other regulatory standards.
Greater Processing Power
Bare metal servers provide greater processing power by offering dedicated access to all of a server's computational resources. This setup eliminates the overhead introduced by virtualization, allowing applications to run more efficiently and with higher performance. For workloads that demand intensive CPU or GPU usage, such as video rendering or scientific simulations, bare metal servers offer the necessary horsepower to complete tasks quickly.
The absence of virtualization overhead also means that bare metal servers can better handle peak loads. Users can leverage the full potential of the server's hardware capabilities without worrying about throttling or resource contention, ensuring consistent performance even under heavy demand.
Complete Control of the Software Stack
Bare metal servers offer users complete control over their software stack. Tenants have the freedom to configure the operating system, applications, and the environment to their exact specifications. This level of control is particularly beneficial for organizations with specialized software requirements or those looking to optimize their software for specific hardware features.
This control extends to security configurations, allowing users to implement bespoke security measures tailored to their organization's needs. From custom firewall rules to specific encryption standards, bare metal servers offer the flexibility to secure data and applications according to the highest industry or internal standards.
Bare Metal Servers vs. Virtual Servers vs. Shared Cloud Resources
Bare metal servers, virtual servers, and regular cloud resources each serve different needs in the IT landscape:
Bare metal servers provide dedicated physical resources, offering the highest performance and control.
Virtual servers partition physical servers into multiple, smaller virtual servers, trading off some performance for greater flexibility and scalability.
Shared cloud resources, such as SaaS applications and cloud storage services, offer a scalable and cost-effective solution for a range of computing tasks, but they do not provide the same level of control as virtual servers or bare metal servers.
Choosing between these options depends on the specific requirements of the application or workload:
Performance: Bare metal servers are ideal for high-performance, resource-intensive tasks, while virtual servers and cloud resources are better suited for applications that need to scale quickly or that do not require the full resources of a dedicated server.
Cost: Bare metal servers tend to be more expensive than virtual servers or shared cloud resources.
Related content: Read the detailed guide to cloud cost management
Use Cases for Bare Metal Servers
Private Cloud
Bare metal servers are ideal for building private clouds. They provide the infrastructure necessary for organizations to create a cloud environment that is fully under their control. This setup allows for the customization of storage, networking, and compute resources to meet specific organizational needs, offering a combination of cloud flexibility and the performance benefits of dedicated hardware.
Private clouds on bare metal also offer enhanced security and privacy, as the organization can fully control access to data and resources. This is particularly valuable for businesses with stringent data sovereignty or compliance requirements, as it ensures data is stored and processed in a secure, dedicated environment.
High-Performance Computing (HPC)
HPC is another area where bare metal servers excel. HPC tasks, such as scientific simulations, financial modeling, and big data analytics, require extensive computational power and fast data processing capabilities. Bare metal servers, with their dedicated resources and the absence of virtualization overhead, provide the raw performance necessary to run these complex calculations efficiently.
The ability to customize hardware configurations on bare metal servers also allows organizations to tailor their HPC environments to the specific needs of their applications, optimizing performance and ensuring that computational tasks are completed within required timeframes.
Data Processing and Analytics
Bare metal servers are well-suited for data processing and analytics workloads. They offer the processing power and memory capacity needed to quickly analyze large datasets and execute complex algorithms. Organizations dealing with big data can leverage bare metal servers to run their analytics and business intelligence applications without the performance limitations of virtualized environments.
The direct control over hardware also means that organizations can optimize their servers for specific types of data processing tasks, such as in-memory databases or machine learning models, further enhancing the efficiency and speed of data analytics operations.
Strict Security Requirements
For applications and data subject to strict security requirements, bare metal servers provide an ideal environment. The physical isolation and dedicated resources of bare metal servers minimize the risk of unauthorized access and data breaches. Organizations can implement custom security measures, including advanced firewalls, intrusion detection systems, and encryption protocols, tailored to the specific security needs of their applications and data.
This level of control and security is essential for organizations in industries like finance, healthcare, and government, where protecting sensitive information is paramount and compliance with regulatory standards is mandatory.
Best Practices for Managing Bare Metal Servers
Maintain and Upgrade Hardware
Regular maintenance and timely upgrades of hardware are crucial for ensuring the performance and reliability of bare metal servers. Organizations should implement a routine schedule for checking and replacing components that are prone to wear and tear, such as hard drives and cooling systems. Upgrading processors, memory, and storage can also help to keep servers running efficiently and capable of handling increasing workloads.
Staying current with hardware developments ensures that bare metal servers continue to provide the high performance and stability that critical applications require. Regular maintenance and upgrades also help to prevent hardware failures that could lead to downtime and data loss.
Optimize Security Measures
Optimizing security measures is essential for protecting data and applications on bare metal servers. Organizations should employ a layered security approach that includes physical security, network security, application security, and data security.
Regularly updating the operating system and applications to patch vulnerabilities, implementing strong access controls, and using encryption to protect data at rest and in transit are key strategies. Additionally, deploying intrusion detection and prevention systems can help to identify and mitigate threats before they cause damage. Regular security audits and compliance checks ensure that security measures are effective and meet regulatory requirements.
Manage Network Configurations and Traffic
Effective management of network configurations and traffic is vital for maintaining the performance and security of bare metal servers. Organizations should design their network architecture to optimize speed and minimize latency, implementing techniques such as load balancing and traffic shaping to distribute workloads evenly and prioritize critical data flows.
Securing the network perimeter with firewalls and segregating network segments can enhance security and prevent unauthorized access. Monitoring network traffic patterns can also help to identify and address performance bottlenecks or detect suspicious activities.
Monitor Performance for Optimization Opportunities
Continuous monitoring of server performance is crucial for identifying optimization opportunities. Utilizing tools that provide real-time insights into CPU, memory, and disk usage can help to pinpoint inefficiencies and areas for improvement. Analyzing performance trends over time assists in forecasting future needs and planning for capacity expansion.
Performance monitoring also plays a key role in ensuring that applications meet their service level agreements (SLAs) by quickly identifying and resolving issues that could affect user experience or application availability.
Ensure Compliance and Auditing
Compliance and auditing are critical components of managing bare metal servers, especially for organizations that handle sensitive data or are subject to regulatory oversight. Implementing policies and procedures that ensure data is processed, stored, and transmitted in compliance with relevant laws and standards is essential.
Regular audits of server configurations, access logs, and security measures help to verify compliance and identify areas for improvement. Keeping detailed records of compliance efforts and audit results is also important for demonstrating adherence to regulatory requirements and addressing any compliance issues that may arise.
Atlantic.Net Bare Metal Dedicated Server Hosting
Atlantic.Net provides high-performance Dedicated Bare Metal Servers, designed for full control and efficiency. These servers are single-tenant physical hardware, ensuring exclusive use without sharing resources, which eliminates the "noisy neighbor" syndrome and guarantees consistent performance levels. Clients have the liberty to choose the operating system and applications, tailoring the server to their specific requirements.
Offering a range of customizable options, Atlantic.Net's Bare Metal Dedicated Server Hosting plans cater to various needs. Starting with three base configurations, clients can select from 64GB to 4TB of RAM, 12 to 104 vCPUs, and a choice between SATA SSD, NVME SSD, and Spinning HDD for storage. The flexibility extends to network and data storage, with servers set up in redundant configurations using RAID 1 or RAID 10 storage solutions, based on the server's configuration and deployment requirements.
With competitive pricing and generous discounts for longer contractual terms, Atlantic.Net is a popular choice for businesses looking for dedicated server solutions in strategic global locations, including the United States, Canada, and Europe.
Learn more about Atlantic.net bare metal dedicated hosting
Advantages of Bare Metal Hosting
In addition to the benefits already mentioned, bare metal hosting offers a range of advantages that make it an attractive choice for businesses and individuals seeking high performance, robust security, and control over their IT infrastructure.
Here is how bare metal servers compare:
Unmatched Performance
Dedicated Resources: Bare metal servers provide exclusive access to all physical resources, including CPU cores, RAM, and storage. You are guaranteed maximum performance with exclusive hardware access. With bare metal, you have the peace of mind that your applications will always have the resources they need to run smoothly, ensuring optimal performance even for high-traffic websites and resource-intensive applications.
Optimal for Resource-Intensive Workloads: The dedicated resources and raw processing power of bare metal make it ideal for handling resource-intensive applications like high-performance computing (HPC), big data analytics, machine learning, artificial intelligence, and gaming servers. These workloads demand consistent and predictable performance, which bare metal delivers reliably.
Enhanced Security and Control
Physical Isolation: Bare metal servers offer complete physical isolation from other users, minimizing the risk of data breaches and unauthorized access. This makes them a preferred choice for businesses handling sensitive data or subject to strict compliance regulations.
Full Root Access: You have complete administrative control over your bare metal server, including the choice of operating system, software installations, and security configurations. This level of control allows you to tailor the environment to your specific security needs and implement robust security measures.
Data Integrity: With full control over your server environment, you can implement data backup and recovery strategies that ensure data integrity and minimize the risk of data loss.
Cost-Effectiveness
Predictable Costs: Bare metal hosting typically involves fixed monthly fees, making it easier to budget and forecast IT expenses. Having this predictability is especially valuable for businesses with stable workloads that don't experience significant fluctuations in resource usage.
Long-Term Savings: While the upfront cost of bare metal may be higher than cloud servers, it can be more cost-effective in the long run, especially for businesses with consistent high-performance requirements. You can avoid the variable costs associated with cloud computing, such as pay-per-use pricing, which can escalate quickly with increased usage.
Flexibility and Customization
Tailored to Your Needs: Bare metal servers offer the best flexibility options, allowing you to customize every aspect of your server environment, from the hardware configuration to the software stack. This ensures that your infrastructure is optimized for your specific workloads and applications, maximizing efficiency and performance.
Legacy Application Support: If you're running legacy applications that may not be compatible with virtualized cloud environments, bare metal provides a reliable platform to ensure their continued operation without compromising performance or security.
Use Cases for Bare Metal Hosting
High-Performance Computing (HPC): Bare metal's dedicated resources and powerful hardware make it the go-to choice for HPC applications like scientific simulations, financial modeling, and weather forecasting, which require massive computational capabilities. HPC users need to ensure optimal performance with a physical server dedicated to them.
Gaming Servers: The low latency and consistent performance of bare metal are critical for delivering a smooth and lag-free gaming experience. The servers are so powerful you can host multiple users' games concurrently guaranteeing better performance and network quality than that from cloud service providers.
Big Data Analytics: Bare metal can handle the immense data volumes and complex processing demands of big data analytics, enabling businesses to gain valuable insights from their data. Dedicated servers can handle the workload demands of these platforms easily.
Private Cloud Hosts: Bare Metal Servers are a popular choice for private cloud solutions. With a managed hosting provider it's easier to lease 3 or 4 bare metal servers and deploy them as virtualization hosts running Hyper-V or VMware ESXi. Within a few hours, you can deploy your very own private cloud.
Bare Metal FAQ
What operating system can I load on my Bare Metal Server?
Atlantic.Net does not restrict the operating systems you install on your servers. While sometimes software and hardware limitations can favor the use of Dedicated Servers over Bare Metal Servers or vice versa, these are rare occurrences, and in general, you will be able to choose the operating systems you want to use in your hosting environment.
Can I connect my Bare Metal server to my cloud environment?
Yes, you can interconnect your Bare Metal servers with your Atlantic.Net Cloud environment. Some options like ACP Onsite and Offsite Backups are not compatible with Bare Metal Servers.
Request more information here: Get in Touch!
Can you help me decide which is a better fit for me - Bare Metal Servers, Dedicated Servers, or something else?
Yes! We have Sales Engineers for just this reason. They have years of experience with issues our customers commonly face, and along with this experience comes the knowledge of the best way to solve those issues. We are ready and standing by to provide the guidance you are looking for. Get in Touch!
How does Bare-Metal differ from Dedicated Hosts?
Dedicated Hosts are pre-installed with the Atlantic.Net Cloud Platform to do server administration and enable instant plug-and-play with ACP. Bare Metal Servers are for anyone who wants to install their operating system, virtualization, or for any applications to run in a non-virtualized environment.
Why Go For Bare Metal Server?
In general, if you only need a few VPS servers and don't see your workload continuing to grow, a bare metal Cloud VPS server is a great, and cost-effective solution that will most likely meet your needs. Bare Metal Servers are designed for a customer with a high technical ability to manage their environment.
Bare Metal Servers also come in handy when a virtualization layer is not desirable due to compatibility or performance reasons. Most clients that do not have a dedicated IT team to control these types of functions will opt for a Dedicated Host, but Bare Metal is perfect for those who require extreme flexibility and choice.
Are Bare Metal Servers Customizable?
Yes, All Atlantic.Net Bare Metal Servers are fully customizable. For convenience, we offer several set plans that you can deploy on the ACP control panel. If you cannot find a suitable server, contact the team here and we will create a bare metal server per your specific needs. You get full control over the server hardware, software, and operating system, giving you the flexibility to configure the server to meet your specific needs.
Is It More Expensive to Deploy a Bare Metal Server Compared to a Cloud Server?
The cost of deploying a bare metal server can be more expensive than deploying a cloud server. However, with the choice of a traditional bare metal server and plans, we are confident you will find a bare metal server that suits your budget. This is because you are responsible for the upfront cost of the hardware. However, bare metal servers can be more cost-effective in the long run, as you do not have to pay for ongoing monthly fees.
How to Choose the Best Bare Metal Hosting Provider?
When choosing a bare metal hosting provider, it is important to consider your specific needs and requirements. Location is one of the most important considerations. You may want to be geographically local to your server investment. Other factors may include the provider's reputation, pricing, customer support, and network performance. You should also consider the provider's experience with bare metal hosting.
See Additional Guides on Key Hybrid Cloud Topics
Together with our content partners, we have authored in-depth guides on several other topics that can also be useful as you explore the world of hybrid cloud.
Cloud Migration
Authored by Faddom
[Guide] Data Center Migration: Complete Guide 2025
[Guide] Cloud Migration to AWS: 3 Phases, 7 Rs and 5 Free Tools to Get You Started
[Blog] How Secure is the Cloud?
[product] Faddom | Instant Application Dependency Mapping Tool
Nutanix
Authored by Faddom
[Guide] Nutanix: History, Products, and Top 5 Alternatives -
[Guide] Nutanix vs. VMware: 5 Key Differences and How to Choose
[product] Faddom | Instant Application Dependency Mapping Tool
Colocation Hosting
Authored by Atlantic.Net
[Guide] What is Colocation Hosting in 2025? Benefits of Colocation Hosting
[Guide] Finding the Best Colocation Facility: What to Consider
[Blog] How to Secure SSH Server on Arch Linux
[Product] Atlantic.Net Cloud Platform | Scalable, Secure Cloud Solutions
### Bare Metal Kubernetes: Pros, Cons, and Best Practices
What Is Bare Metal?
Bare metal refers to physical computer server hardware without any installed operating systems or virtualization layers. It represents the most direct access to the server's physical resources, such as CPU, memory, and storage, enabling users to maximize performance and efficiency for their specific applications. Bare metal environments are characterized by their lack of overhead that comes with hypervisors or virtual machines, offering dedicated resources for high-demand applications.
Deploying applications directly onto bare metal servers can significantly enhance their performance and reliability. This approach is particularly beneficial for resource-intensive applications that require direct access to hardware features, allowing them to run more efficiently than in virtualized environments. Bare metal setups are favored in scenarios where control and optimization of the hardware environment are crucial for application performance.
Pros of Kubernetes on Bare Metal
Enhanced Control
Running Kubernetes on bare metal provides enhanced control over the infrastructure, allowing organizations to tailor their environment specifically to their application needs. This direct control enables finer optimization of resources, ensuring that Kubernetes clusters are tuned for maximum efficiency and performance. Administrators can make specific hardware adjustments and configurations that directly benefit their workloads, something not as easily achievable in virtualized or cloud environments.
This level of control also extends to the network configuration, storage options, and security settings, allowing for a highly customized Kubernetes environment. Enhanced control means that organizations can optimize their deployments for specific performance characteristics or compliance requirements, ensuring that their applications run as efficiently as possible.
Cost Savings
Deploying Kubernetes on bare metal can lead to significant cost savings, particularly for organizations with stable, predictable workloads that can fully utilize the capacity of their servers. Without the need to pay for virtualization layers and the overhead they create, organizations can reduce operational costs while still benefiting from the scalability and automation that Kubernetes provides.
Moreover, the efficient use of resources in a bare metal setup reduces the need for overprovisioning, allowing organizations to invest in exactly what they need without unnecessary extras. This direct and efficient use of hardware translates into lower operational costs.
Improved Cluster Security and Control
Running Kubernetes on bare metal enhances cluster security by providing complete control over the physical infrastructure. This control allows organizations to implement security measures at every layer of their infrastructure, from the physical access to servers to the network configurations and data storage. The absence of a hypervisor reduces the attack surface, and the ability to directly manage hardware resources can lead to a more secure environment.
This direct control also means that organizations can enforce compliance standards more easily, tailoring their security posture to meet specific regulatory requirements without the constraints imposed by cloud providers or virtualization platforms. Enhanced security and control make Kubernetes on bare metal an appealing option for sensitive or critical applications.
Cons of Deploying Kubernetes on Bare Metal
Hardware Management
Managing hardware in a bare metal Kubernetes environment presents unique challenges. Organizations must handle the physical aspects of their servers, including provisioning, maintenance, and upgrades, tasks that are typically abstracted away in cloud or virtualized environments. This direct management requires a higher level of operational expertise and can introduce complexity in terms of hardware compatibility and performance optimization.
Additionally, the lack of immediate scalability compared to ordinary cloud environments means that organizations must plan for capacity more carefully, ensuring they have the hardware resources available to scale up as needed.
Networking Complexity
Networking in a bare metal Kubernetes environment provides more flexibility but can be more complex than in virtualized or cloud settings. Configuring network topologies that support high availability, security, and performance requires a deep understanding of both Kubernetes networking and the underlying physical network infrastructure. Challenges include implementing network policies, managing ingress and egress traffic, and ensuring low-latency communication between nodes.
Organizations must also deal with the physical network hardware and configurations, from switches to routers, which can add another layer of complexity to the deployment. This complexity necessitates a strong networking knowledge base and may require specialized tools or software to manage effectively.
Cluster Bootstrapping and Updates
Bootstrapping and updating Kubernetes clusters on bare metal can be more challenging than in cloud environments. The initial setup requires careful planning and configuration of the hardware, networking, and software components to ensure a successful deployment. This process often involves manual steps, making it more labor-intensive and prone to errors.
Updates and upgrades also pose challenges, as they must be carefully managed to avoid disrupting operations. Unlike cloud services that offer managed Kubernetes solutions, updates on bare metal must be performed manually, requiring a robust strategy for testing and rolling out updates without impacting the production environment.
Best Practices for Running Kubernetes on Bare Metal
Here are a few best practices that will help you run Kubernetes more effectively on bare metal servers.
1. Choose Smaller Nodes
Opting for smaller nodes can enhance the resilience and flexibility of a Kubernetes cluster on bare metal. Smaller nodes allow for a more granular scaling of resources, enabling precise adjustments to the cluster based on current workload requirements. This approach reduces the risk of resource wastage and can improve overall cluster efficiency by distributing workloads more evenly across the available infrastructure.
2. Choose Standardized Hardware
Standardizing hardware in a bare metal Kubernetes environment simplifies management and reduces operational complexity. Using a consistent set of hardware specifications for servers, storage, and networking equipment makes it easier to automate provisioning, monitoring, and management tasks. This consistency can also improve performance predictability, as the cluster's behavior is more uniform.
3. Master kubectl Commands for Efficient Cluster Management
Efficient management of a Kubernetes cluster on bare metal requires mastering kubectl commands. kubectl is the command-line tool for interacting with the Kubernetes API, allowing administrators to deploy applications, inspect and manage cluster resources, and view logs. Proficiency with kubectl enables administrators to perform special tasks that might be required in a bare metal environment, such as debugging pods or rolling out updates.
Learn more in the detailed guide to kubectl
4. Keep the Operating System Consistent
Maintaining a consistent operating system (OS) across all nodes in a Kubernetes cluster on bare metal is crucial for stability and security. Consistency in the OS ensures that applications perform predictably across the cluster and simplifies the management of updates and patches. It reduces the risk of compatibility issues that can arise from differences in OS configurations or versions, which can lead to unexpected behavior or security vulnerabilities.
5. Use a Bare-Metal Management Tool
Leveraging a bare-metal management tool can streamline the deployment and operation of Kubernetes on bare metal. These tools facilitate tasks such as provisioning, monitoring, and managing physical servers, automating many of the manual processes involved in running bare metal infrastructure.
Running Docker on Bare Metal Servers with Atlantic.Net
Running Docker containers on bare metal servers offers an efficient and scalable way to deploy and manage containerized applications. Atlantic.Net is responding to the growing demand for flexible container orchestration by developing a container orchestration and deployment platform.
The Atlantic.Net Container Engine caters to a wide range of container deployment needs. Whether users are interested in utilizing libraries of pre-built, vendor-approved containers or deploying their own custom application containers, the engine is engineered to offer the necessary support and functionality.
With Atlantic.Net's new capabilities, developers and IT professionals can look forward to a more streamlined and efficient container management experience, leveraging the power of Docker on bare metal servers for optimal performance and scalability.
Learn more about the Atlantic.Net Container Engine
### Top 10 Server Management Software Solutions
What is Server management Software?
Server management software is a crucial tool designed to help businesses efficiently and effectively manage their IT infrastructure. The aim is to offer a software solution with numerous tools and features that simplify complex tasks related to server administration.
What Is the Purpose of a Server Management Solution?
Server management software makes it easier to manage complex IT platforms, including Windows servers, Linux servers, and everything else associated with supporting an IT environment. The goal is to reduce downtime by identifying server issues and resolving them promptly and proactively through advanced automation. This, in turn, improves overall network performance by optimizing resource usage and configuration settings.
Business leaders gain visibility into their IT operations with server management software that often includes security solutions designed to enhance security, automate system updates, and streamline security policy handling. Each leading unified solution typically automates routine management tasks and gives IT departments a centralized platform to manage complex server infrastructure, including SQL servers and vSphere environments.
Server Management Software Automation
Server management software solves many IT problems. Many feature enhanced server monitoring and continuously tracking server health, performance metrics, and resource utilization (CPU, memory, disk space). Alerts are automated when they detect anomalies or critical situations, such as server crashes, high resource usage, or security breaches.
Configuration management tools help system administrators automate and standardize server configurations and reduce errors and inconsistencies across large server environments. Backup and Recovery tools offer the ability to protect data remotely. Advanced reporting and even an analytics platform that leverages machine learning to identify issues across an entire data center are becoming more popular in Server Management software.
Types of Server Management Software
Various types of server management software are available, with each catering to different needs and budgets served by multiple pricing options. Some are cloud-based, offering managed servers, while others are installed on-premises. Choosing the right software depends on the specific requirements of your organization and the complexity of your server infrastructure.
Top 10 Server Management Solutions
Here is our top 10 list of server management software companies that can help you achieve complete visibility and full control over your IT operations.
#10 CheckMK
Why CheckMK Stands Out
CheckMK is an open-source IT monitoring solution that provides comprehensive and scalable tools for the entire data center, from servers and networks to cloud environments and applications. It's a popular agent-based server monitoring tool that uses automated discovery to deploy at scale. It monitors key values such as availability, performance, and capacity and includes key features such as log management, event correlation, and reporting.
Who Can Benefit from CheckMK
Sysadmins use CheckMK to monitor the health and performance of several servers in their infrastructure, ensuring uptime and identifying potential issues. It also has many key features for developers and engineering teams. MSPs use Checkmk to monitor their clients' infrastructures, providing value-added services and ensuring the smooth operation of their clients' systems.
Pros
Robust and Feature-Rich: Offers extensive observability out of the box.
Easy to Install and Configure: User-friendly interface and automatic discovery simplify setup.
Large Community and Support: Active user community and comprehensive documentation.
Cost-Effective: The open-source model reduces licensing costs.
Cons
Learning Curve: Some advanced key features may require time to master.
Resource Intensive: Can consume significant resources in large environments.
Limited Out-of-the-Box Reporting: Customization may be needed for complex reports.
#9 Nagios XI
Why Nagios XI Stands Out
Nagios is a powerful and widely used open-source monitoring software for IT infrastructures. It helps organizations identify and resolve IT infrastructure problems before they affect critical business processes. It's great as a mission-critical monitor server for applications, services, operating systems, network protocols, systems metrics, and network infrastructure. It provides a central view of your entire data center, IT operations network, and business processes.
Who Can Benefit from Nagios XI
Nagios XI helps IT teams proactively monitor and manage their IT infrastructure, reducing downtime and improving service availability. From small businesses to large enterprises and hosting providers, Nagios XI can be tailored to fit the specific monitoring needs of any organization.
Pros
Powerful and Flexible: Offers a wide range of monitoring capabilities and customization options.
Scalable: Can easily grow with your organization's needs.
Mature and Reliable: Proven track record with a large user community.
Cost-Effective: Open-source core with affordable commercial add-ons.
Cons
Learning Curve: It can be complex to set up and configure, especially for beginners.
Resource Intensive: Requires dedicated resources for optimal performance.
Limited Out-of-the-Box Features: To get the most out of Nagios requires additional plugins and customization for specific needs.
#8 Zabbix
Why Zabbix Stands Out
Zabbix is a software company with an open-source enterprise-class monitoring solution designed for real-time monitoring of millions of metrics collected from tens of thousands of servers, virtual machines, and network devices. It offers a comprehensive monitoring solution for various IT infrastructure components, including networks, servers, applications,
Who Can Benefit from Zabbix
Everyone can benefit from Zabbix because it is free to use, but also a complete and highly customizable tool. Therefore, any business that relies on IT infrastructure for its day-to-day operations can benefit from Zabbix's comprehensive monitoring and alerting capabilities.
Pros
Highly Customizable: Can be tailored to meet specific monitoring needs.
Scalable: Handles large environments with thousands of devices.
Cost-Effective: The open-source model eliminates licensing costs.
Large and Active Community: Provides extensive support and resources.
Cons
Learning Curve: May require some time to master its advanced key features and configuration.
Resource Intensive: Can consume significant resources in large environments.
Complex Setup: Initial setup and configuration is complex for beginners
#7 Dynatrace
Why Dynatrace Stands Out
Dynatrace is an all-in-one software intelligence platform designed to provide full-stack monitoring and observability for complex enterprise cloud environments. It's good at alerting on application usage and is a great tool for developers looking for deep insights into how their applications are performing. AI is cleverly integrated too, it can automatically identify the root cause of problems, allowing you to resolve issues faster and prevent them from happening again.
Who Can Benefit from Dynatrace
Dynatrace targets medium and large enterprises mainly because it's considered a premium product. It's expensive, but it's also very good, and many users find the value it provides justifies the cost.
Pros
Powerful AI Capabilities: Automates many monitoring tasks and provides valuable insights.
Comprehensive Monitoring: Covers the entire technology stack, providing a holistic view of your environment.
Ease of Use: Intuitive interface and automated workflows reduce manual effort and simplify monitoring.
Scalability: Handles large and complex environments with ease.
Excellent Support: Offers comprehensive documentation and responsive customer support.
Cons
Cost: This can be expensive compared to other monitoring solutions.
Complexity: Some advanced features may require expertise to configure and utilize effectively.
Learning Curve: Initial setup and configuration may take some time to master.
#6 New Relic
Why New Relic Stands Out
New Relic is a comprehensive observability platform designed to help organizations monitor, troubleshoot, and optimize their entire technology stack. It provides full-stack visibility from infrastructure web servers to applications to user experience, allowing teams to proactively identify and resolve performance issues before they impact customers.
Who Can Benefit From New Relic
New Relic is ideal for organizations of all sizes that want to gain a deeper understanding of their technology stack and improve its performance. Its UI is really good, it's easy to use, and it features everything you need to get started. New Relics offers a free tier, as well as standard, pro, and enterprise editions - there is something out there for everyone.
Pros
AI-Powered Insights: Automates many monitoring tasks and delivers actionable insights.
Open and Extensible: Easily integrates with your existing tools and workflows.
Scalability: Handles large and complex environments.
Strong Community: Active user community and extensive documentation.
Cons
Cost: Very expensive, especially for large-scale deployments.
Complexity: Some features can be complex to configure and use effectively.
Learning Curve: Initial setup and configuration may require some time and effort.
#5 SolarWinds SAM
Why SolarWinds Stands Out
SolarWinds SAM is designed to monitor the performance and health of applications, servers, and infrastructure components. The App Insight tool is great at identifying application bugs and issues, and the reporting features are also very good. If you are already invested in SolarWinds, SAM seamlessly integrates with Network Performance Monitor (NPM) and Log Analyzer.
Who Can Benefit from SolarWinds
SolarWinds SAM is used by a variety of organizations, including NASA, which uses it to monitor its mission-critical systems. Solarwinds licensing is very expensive, so their target audience is large and enterprise-scale businesses.
Pros
Comprehensive Monitoring: Offers deep visibility into application and server performance.
User-Friendly Interface: Intuitive and easy-to-use interface for monitoring and troubleshooting.
Extensive Template Library: Out-of-the-box templates for a wide range of applications and systems.
Customizable Monitoring: Allows for the creation of custom templates and monitors.
Integration with the Orion Platform: Seamlessly integrates with other SolarWinds products.
Cons
Cost: Can be expensive, especially for larger environments.
Complexity: May require some training and expertise to fully utilize all key features.
Resource Intensive: Can consume significant resources in large environments.
Security Concerns: Management software company SolarWinds has experienced a high-profile security breach in the past, raising concerns about the security of its products.
#4 Datadog
Why Datadog Stands Out
Datadog is a cloud-based monitoring and observability service platform for cloud applications. It brings together data from servers, databases, tools, and services to present a unified view of an organization's data center and entire technology stack. This allows teams to monitor infrastructure health and application performance.
Who Can Benefit from Datadog
Datadog also targets medium, large, and enterprise-scale businesses. Tech companies like Twilio, Peloton, and Zoom rely on Datadog to monitor their complex cloud-based applications and infrastructure.
Pros
Scalability: Easily adapts to growing infrastructure and data volumes.
AI-Powered Insights: Automates anomaly detection and root cause analysis.
Extensive Integrations: Works seamlessly with popular tools and services.
User-Friendly Interface: Offers intuitive dashboards and customizable visualizations.
Cons
Cost: Can be expensive, especially for large-scale deployments and with additional features.
Complexity: Some advanced features may require expertise to set up and manage effectively.
Learning Curve: Initial onboarding and configuration can be time-consuming.
Data Retention: Limited data retention periods in lower-tier plans.
#3 ManageEngine OpManager
Why ManageEngine Stands Out
At number 3 is ManageEngine OpManager. Another monitoring tool but this one stands out for its performance. It's fast! It can easily monitor the health of network devices, servers, and virtual machines. It has many key features including application performance monitoring, bandwidth monitoring, firewall log analysis, IP address management, fault detection, and workflow automation. Its interface is superb and very intuitive.
Who Can Benefit from ManageEngine
ManageEngine targets Small and Medium-sized businesses and startups. It is also popular in the healthcare, education, and government industries. It's affordable to offer free versions, essential "lite" editions, plus professional and enterprise editions.
Pros
Ease of Use: User-friendly interface and automated discovery.
Real-Time Alerts: Sends instant notifications for timely response.
Network Mapping: Automatically generates visual network maps.
Workflow Automation: Automates routine tasks for improved efficiency.
Cons
Scalability: May face challenges scaling to very large networks.
Reporting: Some users find the reporting features limited.
Cost: Can be expensive for smaller organizations with limited budgets.
#2 NinjaOne
Why NinjaOne Stands Outs
At number two is NinjaOne, a popular cloud-based IT operations platform designed to simplify endpoint management for managed service providers (MSPs) and internal IT teams. It offers a comprehensive suite of server management tools, for remote monitoring and management (RMM), patch management, service desk, backup, and an endpoint security solution
Who Can Benfit from NinjaOne
NinjaOne consistently receives high ratings from users for its ease of use, functionality, and customer support. It has a wonderful UI that is so simple to navigate, it's a pleasure. They primarily target Managed Service Providers with the aim to simplify MSPs' need to manage huge estates of infrastructure. NinjaOne is a very cost-effective solution (with a free tier available) and you get a lot of features for your money.
Pros
User-Friendly Interface: Easy to navigate and use, even for those with limited technical expertise.
Robust Feature Set: This product offers a wide range of capabilities, including RMM, patch management, service desk, backup, and automation.
Strong Security Focus: Prioritizes endpoint security with features like patching, antivirus, and backup.
Scalable and Flexible: Adapts to the needs of organizations of various sizes and supports different deployment options.
Affordable Pricing: Offers competitive pricing plans that are accessible to businesses of all sizes.
Cons
Limited Reporting: Reporting capabilities may be less extensive compared to some other IT management platforms.
Steeper Learning Curve for Advanced Features: While basic features are easy to use, mastering advanced functionality may require some time and effort.
#1 Atera
Why Atera Stands Out
At number one is Atera, an amazing cloud-based all-in-one IT management software. It's a top server management software that combines Remote Monitoring and Management (RMM), Professional Services Automation (PSA), and remote access tools into a single solution. It can handle most any task, the reporting is probably the best available, and there is lots of scope for scripting and automation, making it a very effective tool to customize and integrate in-house.
Who Can Benefit From Atera
Atera targets MSPs and companies with in-house IT departments. It's designed to manage large enterprise-scale businesses. The pricing starts at $79 per technician per month for the Pro plan and $99 per technician per month for the Growth plan. They also offer a free trial for new users.
Pros
User-Friendly: Intuitive interface and easy navigation.
All-in-One Solution: Consolidates RMM, PSA, and remote access tools.
Scalable: Adapts to the needs of growing businesses.
Automation: Streamlines repetitive tasks with powerful automation capabilities.
Cost-Effective: Pay-per-technician pricing model.
Cons
Limited Third-Party Integrations: Compared to some other platforms, Atera may have fewer integrations with third-party tools.
Learning Curve for Advanced Features: While basic features are easy to use, mastering advanced functionality may require some time and effort.
Let Atlantic.Net Host Your Next Server Management Software
We know that server management software costs are high, but your hosting providers' costs don't have to be. Atlantic.Net has been providing cloud hosting and managed services for 30 years. We are based in Orlando, Florida. We have data centers located throughout the United States, Canada, Europe, and Asia, and our award-winning cloud platform is always available, featuring our industry-leading 100% Service Level Agreements.
Don't let hosting costs hold you back from optimizing your server management.
Contact Atlantic.Net today and experience the difference of a reliable, high-performance hosting solution.
### Virtual Private Cloud vs. Private Cloud
What Is a Virtual Private Cloud (VPC)?
A Virtual Private Cloud (VPC) is a secure, isolated segment of a public cloud infrastructure that provides a dedicated environment for a single organization. The VPC segregates a traditional private network within a shared public cloud, allowing organizations to control their entire virtual networking environment, including configuring IP addresses, subnets, and security groups. VPCs balance the cost-effectiveness and scalability of public clouds with the security and control of private infrastructure.
A virtual private cloud, often referred to as a VPC, is a type of private cloud hosted within a public cloud environment. It provides a logically isolated section of the public cloud dedicated to a single organization. VPCs offer many of the same benefits as a private cloud, such as security and customization, but they are typically more affordable, easier to scale, and entirely virtualized.
What Is a Private Cloud?
A Private Cloud is a dedicated cloud computing environment solely owned and operated by a single organization. All the infrastructure, hardware, and software resources within a private cloud are exclusively accessible to that organization. Private clouds are typically located on-premises within the organization's data center or hosted externally by a third-party provider. They provide a high level of security, control, and customization but often require significant capital expenditure and ongoing IT management compared to an on-demand public cloud provider.
Briefly, a private cloud is a cloud computing environment typically dedicated to a single organization or customer. It can be located on-premises (in the organization’s own data center) or hosted by a third-party provider like Atlantic.Net. A private cloud offers a single tenant greater control, security, and customization option than public clouds, but they can also be more expensive and complex to manage.
What Is the Difference Between a Virtual Private Cloud and a Private Cloud?
Despite their similar names, a Virtual Private Cloud and a Private Cloud are completely different technologies. Each offers a vastly different user experience with contrasting feature sets and varied cloud capabilities. In this guide, we’ll break down the many key features and distinctions between the two and answer some challenging questions to help you make an informed decision.
Definition of the Two Types of Private Cloud
Now, let's explore each type of cloud computing infrastructure in detail.
Private Cloud
A private cloud is a cloud computing model where the entire infrastructure is dedicated exclusively to a single organization. It can be located on-premises within the organization's own data center or hosted by a third-party service provider off-site. A private cloud can be a cluster of physical infrastructure, servers, storage, and networking, or it can be a virtualized cluster such as a VMWare vSphere Environment, an OpenStack Cluster, or perhaps a Hyper-V stack.
Summary of a Private Cloud Infrastructure
Location: Hosted either on-premises or by a third-party provider.
Ownership: Often owned and operated by the organization, but large-scale clusters are typically leased from Managed Service Providers.
Control: Full control over server, storage, and networking resources and infrastructure. Everyday management tasks may be outsourced to a Managed Services provider.
Security: High level of security bespoke to your exact requirements. Often customized to meet specific requirements such as legislation or compliance.
Customization: This option offers a high degree of flexibility to tailor the environment to specific needs. It is ideal if the customer needs specific hardware resources.
Cost: Typically higher upfront purchasing and ongoing costs, especially licensing and maintenance.
Scalability: Less scalable than public cloud options, but new servers and resources can be added to racks as needed. Requires considerable planning, budget considerations, and waiting on lead times.
Ease of management: Due to increased control and customization, it can be more complex to manage. If not outsourced, it requires virtualization experts to complete day-to-day management tasks.
Key Characteristics of Private Cloud:
What do you get when you sign up for a Private Cloud Environment? And is it the best choice for you?
Exclusive Access: The resources (servers, storage, networking) are not shared with other organizations, providing complete isolation and control.
Enhanced Security: Due to their isolated nature, a private cloud often has stronger security measures, making them ideal for sensitive data and regulated industries.
Customization: Organizations can configure the infrastructure, applications, and security policies to their specific needs and workflows.
Performance: Private clouds can offer higher performance due to dedicated resources and no contention with other users.
Compliance: Private Clouds are often preferred for meeting strict regulatory requirements as the organization has full control over data and security measures. This is why most Government industries are managed in-house on a private cloud model.
Higher Costs: Building and maintaining a private cloud involves significant upfront investment in hardware, software, and skilled personnel. You may have to factor in the costs of running a data center, power, cooling, disaster recovery, and so on.
Virtual Private Cloud (VPC)
A Virtual Private Cloud (VPC) is a subset of a public cloud that simulates a private cloud environment. The key difference is that it uses virtualization technology to create a logically isolated section within a public cloud provider's infrastructure—an environment dedicated to a single organization.
The major cloud providers integrate VPCs into customer accounts, allowing users to configure a software-defined VPC that isolates networking, resources, and security groups into the same isolated environment. VPCs are highly flexible; they can be shared across regions and availability zones and span multiple customers and user accounts if needed.
Summary of Virtual Private Cloud Infrastructure
Location: Hosted within a public cloud provider's infrastructure
Ownership: Resources are typically provided on-demand by a public cloud provider
Control: It depends on the cloud provider; typically, there is less direct control compared to a private cloud, but it still offers excellent isolation, security, and segregation.
Security: There is a High level of security, often available on demand from the provider and leveraging the provider's built-in measures. Reputable providers will also offer managed security services, which can be included in your service.
Customization: A good level of customization within the defined parameters of your account and virtualized organization.
Cost: Generally much more affordable than private cloud due to shared resources and out-of-the-box configuration.
Scalability: Highly scalable, leveraging the public cloud's infrastructure
Ease of management: Easier to manage due to the provider handling underlying infrastructure
Key Characteristics of Virtual Private Cloud (VPC)
What do you get when you sign up for a Virtual Private Cloud Environment? And is a VPC the best choice for you?
Shared Infrastructure: The underlying physical resources (servers, storage) are shared with other users of the public cloud. There are rarely contention issues, but remember that you are reliant on your provider's uptime capabilities. In all circumstances, the VPC provides a secure and isolated virtual environment.
Security: VPCs leverage the public cloud provider's robust security measures and offer additional isolation mechanisms, such as virtual firewalls, security groups, and permission-based access.
Scalability: VPCs are highly scalable as they can easily tap into the vast resources of the public cloud. VPCs are easy to manage by code, making them superb for automated configuration by your developers.
Flexibility: They offer a good degree of customization, allowing organizations to choose the type and size of virtual resources they need.
Cost-Effective: VPCs are more cost-effective than private clouds as organizations only pay for the resources they use and don't need to invest in hardware or maintenance.
Less Control: Organizations have less control over the underlying infrastructure compared to a private cloud, however, you do have full control over the virtualized abstraction layer.
What Is the Difference Between Virtualization and Private Cloud?
We have already discussed what a private cloud is a little earlier in this article, so instead, let's focus on what Virtualization offers for cloud adoption. Virtualization and private cloud are both important concepts in cloud computing, but they are fundamentally different things.
Virtualization
Virtualization is a reliable and proven technology that allows you to build multiple virtual environments on physical infrastructure. It requires virtualization software called a hypervisor that sits on top of powerful dedicated physical hardware. The hypervisor effectively divides the existing hardware resources into multiple virtual resources, typically virtual machines (VMs). Each VM acts like an independent computer with its own operating system and applications.
Hypervisors allow multiple operating systems to run on a single physical host computer. Some of the most popular include VMware, Hyper-V, KVM, Citrix, and Nutanix.
Benefits of Virtualization
Virtualization offers numerous advantages that enhance the efficiency and flexibility of IT infrastructure. One key benefit is resource efficiency. By running multiple virtual machines (VMs) on a single physical or virtual server, organizations can maximize the utilization of their existing hardware. This not only reduces the need for additional physical servers but also cuts down on energy consumption and overall costs.
Another significant advantage is the isolation provided by virtualization. Each virtual machine operates independently from the others, ensuring that any issues or security breaches in one VM do not affect the others. This isolation enhances the overall security and stability of the IT environment, making it a reliable choice for businesses that handle sensitive data or require robust security measures.
Virtualization also offers remarkable flexibility. Virtual machines can be easily moved, cloned, and backed up, simplifying management and increasing operational agility. This flexibility is particularly beneficial in disaster recovery scenarios and for scaling operations up or down as needed.
Lastly, virtualization is invaluable for testing and development environments. It allows for the rapid creation and destruction of virtual machines, enabling developers to test new software or configurations without the need for additional physical hardware. This accelerates the development cycle and fosters innovation, as teams can experiment and iterate quickly and efficiently using virtual networks.
What Are the Disadvantages of Virtual Private Clouds?
While Virtual Private Clouds (VPCs) offer numerous benefits, they also come with potential drawbacks that organizations should consider. One significant disadvantage is the limited control over the underlying infrastructure. Unlike private cloud environments, VPC users rely on public cloud providers such as Atlantic.Net, Google Cloud Platform, or Microsoft Azure to manage and maintain the cloud infrastructure, such as the computing hardware, the core network infrastructure, and other essential hardware and software components used to interlink cloud resources.
This dependency can be problematic for businesses requiring granular control over their IT resources. It also means that you are at the mercy of the provider's Service Level Agreements, so make sure you choose a service provider that has excellent service level guarantees.
Another concern is the potential security risks associated with VPCs. Despite robust security measures, VPCs are still part of the shared public cloud infrastructure, which means there is a risk if the provider's overall security is compromised. For companies handling highly sensitive data, this shared environment might pose unacceptable risks compared to the isolation offered by a private cloud setting. However, potentially, an ever-great risk exists regarding you, the customer, misconfiguring the security features of the VPC!
Setting up and managing a VPC is complex, particularly for organizations lacking extensive cloud expertise. Configuring network settings, security features like security groups and network access control lists (NACLs), and managing access controls require specialized knowledge and experience. VPCs are hard to configure correctly and require lots of testing to make sure the security does exactly as expected.
While the costs associated with VPCs are generally lower than those of private clouds, they can potentially spiral out of control if you do not plan your architecture correctly. VPCs still charge for storage resources, data transfer (in particular degree traffic), and additional services provided by different cloud providers and service providers, such as backups. When you add all this together, costs can rise quickly.
Vendor lock-in is another potential challenge; while most businesses and startups don't care about lock-in, choosing a VPC from a specific cloud service provider can lead to difficulties and high costs when attempting to migrate data and applications to another provider. This situation can be exacerbated by the need for specialized management software and tools unique to each provider.
Performance variability is also a concern, as the performance of a VPC can be influenced by the activities of other customers sharing the same infrastructure. Although reputable public cloud providers implement measures to mitigate this impact, it remains a consideration. Additionally, the limited customization options in VPCs compared to private cloud environments can restrict businesses to the configurations and services offered by the provider, potentially limiting flexibility and innovation.
The VPCs and other customers' computing resources on the server also depend on a stable internet connection. Any disruptions in connectivity can affect access to virtual servers and other cloud resources. This reliance on the public internet can be a critical issue for businesses requiring uninterrupted access to their IT infrastructure.
Despite these disadvantages, VPCs can still be a viable option for many organizations. They offer cost-effectiveness, scalability, and ease of management. However, it is crucial to weigh these benefits against the potential drawbacks and consider factors like security needs, control requirements, and future flexibility before opting for a VPC. For some businesses, a hybrid cloud approach, combining the benefits of both public and private clouds, might offer the optimal balance of cost, control, and performance.
What Is the Difference Between a Virtual Cloud and a Public Cloud?
Firstly, it's important to mention that Virtual Cloud is just another way of saying Virtual Private Cloud (VPC). When choosing between a virtual cloud and a public cloud for your cloud deployment needs, understanding the differences in infrastructure, management, and use cases is crucial. Both options utilize cloud services but cater to very distinct requirements.
Virtual Cloud
A virtual cloud, often referred to as a Virtual Private Cloud (VPC), operates within a shared public cloud infrastructure but provides businesses with a private network environment. This setup allows companies to manage computing resources and cloud services in a secure and isolated manner, leveraging the scalability and flexibility of cloud and computing services.
In a virtual cloud, businesses create a virtual private network (VPN) within the public cloud infrastructure. This virtual network itself is equipped with private IP addresses and network access controls, offering a level of security and isolation similar to that found in on-premises data centers. Users have control over network configurations, including IP address ranges and routing tables, through self-service portals provided by the cloud provider. This setup enables businesses to integrate their cloud resources with existing on-premises infrastructure or other private environments seamlessly.
Virtual clouds are particularly suited for organizations that prioritize enhanced security and isolation for sensitive data or workloads. They provide customers with the computing resources and flexibility needed to customize network settings and security parameters, making them an ideal choice for businesses with specific compliance or regulatory requirements.
Public Cloud
In contrast to private infrastructure, a public cloud relies on a shared infrastructure provided by a third-party cloud provider over the public internet. This environment is shared among multiple customers, with the cloud provider managing hardware maintenance, software updates, and overall security.
In a public cloud setup, users manage their applications and data within the cloud provider's environment, benefiting from the provider's scalability and quick provisioning capabilities. This allows businesses to access a wide range of computing resources on demand without the need for large capital expenditures. Public clouds are well-suited for startups, small businesses, and enterprises looking for cost-effective and scalable solutions to accommodate varying workloads and applications.
Atlantic.Net Cloud Hosting and Managed Services
Atlantic.Net has been in business for 30 years and provides IT services to customers throughout the United States, Europe, and Asia. We have 8 data center locations around the globe that our customers can leverage for a wide range of hosting solutions, managed services, and compliance services, including our award-winning HIPAA-Complaint Managed Services.
Atlantic.Net’s Virtual Private Cloud (VPC) offers businesses a secure and scalable cloud solution. Each VPC system seamlessly integrates with the Atlantic.Net Cloud and features the robust security and logical network segmentation needed to meet and exceed diverse compliance requirements, including HIPAA, PCI-DSS, and HITECH.
With the added advantage of a fully managed service, Atlantic.Net’s dedicated team ensures a customized network solution that aligns with organizational goals. Add features like the Managed Firewall and VPN to enhance security and connectivity. Atlantic.Net’s VPC combines security, performance, and scalability, making us a great choice for businesses of all sizes.
Step into the future with Atlantic.Net’s Virtual Private Cloud (VPC). Imagine the security of a physical data center network but with the flexibility of the cloud. Our VPC offers complete logical isolation, ensuring unparalleled security and compliance, all while residing on Atlantic.Net’s trusted Cloud services.
Reach out to the team today to learn more.
### Understanding Network Edge Computing Devices
What Is Network Edge Computing?
Distributed cloud computing at the edge, or network edge computing, is when service providers use distributed computation and data storage closer to the data source, typically the user. In edge computing, data processing takes place nearer to the user on devices like smartphones, IoT sensors, or edge servers - unlike cloud computing, where processing primarily takes place in the data center. Decentralized computing reduces latency, optimizes bandwidth usage, improves reliability, and enhances the network's security and privacy.
Consider your favorite streaming services, such as Netflix or Disney Plus. These companies have powerful servers located all over the world. Before edge computing systems, when you pressed play on a movie, the request traveled halfway across the globe to a data center. The data center finds the video, processes it, and sends it back to you. When many people are watching and the data center gets overwhelmed, your video might buffer or lag.
If you remember RealPlayer in the 1990s, you'd load a media file from storage or download it from the Internet, then process and play it on your local machine. When you stream a video on your device today, companies like Netflix use local edge computing nodes to support streaming. In this model, when you click play, your request goes to a nearby server that already has a copy of the video stored, so it starts playing instantly. Even if several people are simultaneously watching, the load gets spread out among many servers, resulting in zero lag or buffering.
The Rise of Edge Computing
Data at the edge is not a new concept. Edge computing environments have been built over many years as the Internet has grown, and there has been a greater demand for reliable network performance.
There has been a proliferation of IoT devices, industrial sensors, and other connected technologies that generate unprecedented amounts of data. Sending all this data to a central data center is becoming increasingly impractical due to bandwidth limitations, latency concerns, and cloud provider egress costs.
Many emerging technologies and data-intensive applications, such as self-driving cars, augmented reality, and remote enterprise applications, require near real-time data processing and adequate network bandwidth to function effectively. One of the benefits of edge computing is that it enables these applications to respond instantly to events without the delays caused by sending data over long distances.
A single centralized data center exacerbates bandwidth constraints and bottlenecks, causing complications. Networks struggle to cope with the ever-increasing volumes of data. Edge computing alternatively reduces the amount of data transmitted over a wide area network, easing congestion and saving bandwidth and computing resources.
Sending sensitive data over long distances can also increase the risk of security exposure. Edge computing improves operational efficiency and addresses these concerns by processing and storing data locally, minimizing the risk of interception or unauthorized access. Perhaps you have a fleet of medical devices bound by HIPAA compliance—when using an edge deployment, having a point of presence geographically near the source reduces risk and satisfies compliance.
Remember, edge services can reduce the cost of transmission, computation, and data storage by processing data locally and only sending relevant insights or aggregated data to a central data center. This can create serious cost savings, especially when handling large egress data volumes.
The Architecture of Edge Computing
Edge computing is not a single technology but rather a distributed computing architecture that manages connected devices within a software-defined networking architecture. It protects client devices from threats based on the global internet.
Let's take a moment to understand what components make up the edge computing environment of local cloud data centers.
An Edge Device is the source of data generation. It can be anything that can process data, from simple sensors to complex medical equipment. It can be smart devices, cell phones, edge nodes, or an entire edge data center. IoT devices are most commonly found on the network edge. There is an estimated 15 billion IoT devices globally.
The volume of raw data such devices produce is difficult to comprehend, but it is easy to see how network congestion occurs and how system performance is impacted. Edge devices typically have limited processing power and storage capacity, so keeping all that data on Edge Nodes makes sense.
Another critical component of the edge network is Edge Gateways. These more powerful devices aggregate data from multiple edge devices, perform some initial processing, and filter or preprocess data before sending it to an edge server or a central data center.
Edge gateways play a crucial role on the edge "backbone." They serve as the primary pathway for information between edge computing systems and a user's computer. Gateways can decide how data processing flows, including filtering and prioritization. They also decide how to send the data: over the Internet or a 5G cell network infrastructure.
The next critical infrastructure of an edge strategy is Edge Servers. These are powerful servers located physically close to the data sources. They handle the bulk of data processing and storage at the edge. Edge computing nodes can be located in local data centers, on-premise data centers, or even in protected enclosures for harsh environments, such as research centers in Antarctica.
The Importance of 5G
So far, we have discussed the importance of the network edge, network capacity, and network connectivity. Alongside traditional networking concepts, the recent introduction of 5G networks has been a significant development. 5G edge computing offers a super-fast digital network that provides the necessary infrastructure and capabilities to support the growing demand for low latency and high bandwidth.
5G is important because it enables significantly higher speeds and lower latency than previous generations. 5G supports a massive number of connected devices simultaneously, which is ideal for IoT devices and helps applications that demand near real-time data processing and super-fast responsiveness.
5G also allows the creation of virtualized, independent networks (slices) within the same physical infrastructure; this optimizes performance and security, helping to meet the diverse requirements of different edge workloads.
Examples of Network Edges
Edge computing is already significantly impacting our lives across various industries. It is a transformative technology that aims to make our lives easier, safer, and more efficient.
Impact on Our Daily Lives
There is a good chance that the benefits of edge computing are already intertwined with your daily routine. Lots of people already have smart devices in their homes. Thermostats, security cameras, and voice assistants use edge computing to process data locally for faster response times and improved security.
Do you have a smart speaker like an Alexa? It is also considered a network-edge device! Newer Echo devices use the AZ1 Neural Edge processor, designed to speed up machine learning tasks on the device itself, including speech recognition and natural language processing.
Home security devices like Ring cameras process video footage locally to detect motion, recognize faces, or identify specific events. Using data at the edge allows for faster alerts and reduces the amount of data sent to the cloud, enhancing privacy.
Modern home appliances like refrigerators, washing machines, and ovens often have built-in sensors and processing capabilities. They can optimize energy usage, predict maintenance needs, and even suggest recipes based on available ingredients.
Edge computing plays a vital role in healthcare by enabling real-time analysis of medical data from wearable devices such as fitness trackers and heart rate monitors. Implanted sensors and hospital equipment within the local network often bypass the need for an on-premise data center.
Near real-time data processing can lead to faster diagnoses, personalized treatment plans, and improved patient outcomes. Edge computing also supports remote patient monitoring and telemedicine applications while ensuring data security.
Edge computing work enhances the efficiency and reliability of our energy production and power grids by enabling real-time monitoring and control of power generation, distribution, and consumption. Helping energy companies integrate renewable energy sources, demand response programs, and smart grid technologies while reducing the strain on centralized data centers.
Impact on How We Live
Have you heard of the term "Smart Cities?" Edge computing collects and analyzes data generated from various sources, such as traffic cameras, environmental sensors, and utility meters. If you travel on the highway, you may see this in action when traveling on smart motorways as signage reacts to adjust speed limits to help optimize traffic flow.
Enterprise-generated data at the edge is transforming our retail experience. Shops use real-time inventory management, personalized recommendations, and targeted advertising to drive sales and improve customer service.
You can now shop in stores that use "Just Walk Out" technology. This technology allows shoppers to enter the store using their smartphone, select their items, and simply walk out. The technology automatically tracks the items they take and charges their bank account. This technology would not work without edge network infrastructure, cloud computing, and centralized servers.
Edge computing, often using fog computing at the network edge, is transforming agriculture by enabling precision farming techniques. Sensors deployed in fields collect data on soil conditions, weather patterns, and crop health. Edge computing analyzes this data in real-time, providing farmers with actionable insights for optimizing irrigation, fertilization, pest control, and, importantly, the best time to harvest their crops.
Elsewhere, the transportation and logistics industry enables real-time tracking of vehicles and shipments, optimizing routes, and improving fleet management—all thanks to edge computing. Some logistics companies are investing in autonomous vehicles that need sensor data to make real-time decisions about navigation and safety.
What Is the Difference Between Network Edge Devices and the Cloud?
Network edge devices and the cloud are two core components of modern IT infrastructure, each offering distinct advantages. Edge computing handles local data processing and storage close to end-users or data sources. These devices, like routers, switches, firewalls, and IoT gateways, excel at reducing latency by processing data right where it is generated. This is crucial for applications that need real-time data analysis. It minimizes the distance data travels to ensure faster response times and an enhanced user experience.
On the other hand, the cloud consists of remote servers and resources accessible over the internet, provided by cloud service providers like Atlantic.Net. Cloud computing is highly scalable and flexible, offering virtually limitless resources that can be scaled up or down based on demand—making it ideal for applications requiring extensive storage and processing power, such as big data analytics, machine learning, and enterprise resource planning. While on-premise data centers have been the traditional choice for many businesses, the cloud’s pay-as-you-go model lowers upfront costs and provides robust tools for resource management, though it can introduce latency due to the physical distance from end-users.
Integrating edge devices with the cloud creates a hybrid approach that leverages the strengths of both. Edge computing focuses on handling immediate data processing, ensuring low latency and real-time responsiveness, while the cloud takes care of complex computations and long-term storage. This synergy, a key part of modern edge strategies, allows businesses to optimize performance, manage costs, and maintain flexibility. We will discuss how Atlantic.Net does this a little later in this article.
Edge Servers and Computing Examples
Now, let's dig deeper and look at real-world examples involving the use of edge servers, which are transforming various industries by enabling real-time data processing and reducing latency.
Healthcare
Remote Patient Monitoring
Hospitals and healthcare practices heavily use remote patient monitoring tools. Edge medical devices store and process information locally, and the information is then synced to a centralized data center if needed. Patients wearing biosensors like smartwatches, fitness trackers, and specialized medical wearables can continuously monitor vital signs such as heart rate, blood pressure, oxygen saturation, movement, and even biomarkers in sweat.
Local edge servers allow doctors and physicians to analyze this data in real time, which improves patient care because the appropriate physicians can be immediately alerted and intervene if abnormal conditions are detected.
Medical Imaging
Edge computing processes large volumes of imaging data (like X-rays, CT scans, and MRIs) locally, speeding up analysis and diagnosis. The goal is to reduce the time patients wait for results and enable quicker treatment decisions.
Edge computing helps in four key ways:
Automating Tasks: Such as simultaneous large-scale image processing
Detecting Abnormalities: thousands of images can be scanned simultaneously, and when using AI, computers can identify medical images that deviate from "normal."
Personalized Treatment: treatment options can be recommended based on the patient's personal medical imaging data.
Clinical Decision Support: Edge computers can help make diagnoses. For example, radiologists can gain additional insights using X-ray image analysis data.
You may have seen portable ultrasound devices parked outside your nearest hospital. Edge computing enables real-time image analysis and guidance during ultrasound procedures, even in remote or resource-constrained settings.
Elsewhere, specialized ambulances equipped with CT scanners use edge computing to quickly diagnose strokes and initiate treatment en route to the hospital. Healthcare is a significant area that makes edge computing important!
Manufacturing
Predictive Maintenance
Manufacturing plants use edge servers to monitor machinery and robotic equipment in real time, and numerous sensors make this possible.
Computer Vision - Thermal sensors can identify temperature anomalies that could indicate unsafe or abnormal conditions.
Sound - Sonic and ultrasonic technology can listen and identify whether machinery is operating outside of the norm.
Touch - Specifically vibration - machinery that is developing faults will often abnormally vibrate; delicate sensors can identify even minute vibrations.
Smell - Total Volatile Organic Compounds (TVOC) sensors can detect chemical leaks such as gas.
All Data - Edge computers can fuse all sensor information together to get an overall picture of the machinery.
By analyzing sensor data, these systems can predict when maintenance is needed, preventing costly downtime and improving operational efficiency.
Quality Control
Edge computing enhances quality control by processing data from cameras and sensors on the production line. This allows for immediate detection of defects, ensuring high standards and reducing waste.
Car manufacturers such as Audi use edge computing to analyze images from cameras on their production lines in real-time. This enables them to quickly identify defects and take corrective action, ensuring the highest quality standards for their vehicles.
Atlantic.Net and Network Edge Computing
We hope you have enjoyed reading about edge computing. The technology has taken off in recent years, and its success is a testament to its integration into our lives. It's so seamless that many people have not even noticed. However, if the edge did not exist, you would certainly feel the impact in your daily life.
Atlantic.Net is celebrating its 30th year in business. We provide cloud computing and hosting solutions for businesses around the globe and offer a selection of network-edge solutions.
Atlantic.Net's Network Edge Protection Services help safeguard your important data and keep your business running smoothly.
What we offer:
DDoS Protection: Our advanced system shields your website or online service from cyberattacks that aim to disrupt it. We block even the most sophisticated attacks to keep your business online.
Web Application Firewall: This acts as a smart filter for your website's traffic, blocking malicious activity like hacking attempts and spam. You get solid protection without needing to change your website's code.
Website Optimization: We make your website load faster on any device, improving user experience and helping you rank better in search engines.
Content Delivery Network (CDN): Our global network ensures your website's content reaches your audience quickly and reliably, wherever they are in the world.
Why choose us:
Expertise: We're experts in network security and web performance.
Flexibility: Our services can be tailored to your specific needs.
Scalability: Our solutions can grow with your business.
Reliability: We're committed to providing the highest level of service.
Focus on your business, and we'll handle the tech. Contact us to learn more about how our Network Edge Protection Services can benefit your business.
### Network Edge
What Is the Network Edge?
The network edge is the connection point between your private network and the Internet, strategically placed to minimize user wait times when accessing cloud-based network resources. It is a connection or interface made between geographically disparate devices. It is used to reduce latency and improve efficiency by presenting interfaces at locations typically closer to the user.
Latency on the Web
If you are unfamiliar with IT and the cloud, it can be challenging to understand the concept of the Network Edge. Remember that edge networking will determine your applications' overall performance, which impacts the user experience.
For example, if a user is based in South America and consumes an application hosted on servers in Europe, the geographical location of the provider and the user would introduce a certain amount of latency. When the user sends a request to the application, that request travels 6000 miles to the European servers, which then responds with an answer that has to travel 6000 miles back to the user. This happens thousands of times per second, so you can see how this can introduce lag or latency.
How Does Network Edge Infrastructure Help?
Network edge infrastructure introduces a cached copy of the application at another edge computing location, also based in South America. Now, the user's requests only have to travel a short distance to content delivery networks located close by. Creating this physically distributed computing paradigm introduces lots of extra benefits, such as cost savings, such as allowing the provider to configure robust security, and it saves the end user money on expensive egress network costs.
What other benefits are introduced by processing data at the network edge?
#1: Reduced Latency:
By processing data locally across more devices, the network edge minimizes the distance information needs to travel, resulting in lower latency and faster response times. This is crucial for real-time data analysis in applications like IoT devices, autonomous vehicles, or industrial automation.
#2: Enhanced Security:
Less data travels across the network, minimizing the vulnerability to breaches during data transmission itself. Additionally, security measures like encryption can be implemented directly on edge devices to improve data protection. Edge computing can also give you more granular control allowing improved data privacy and security policies for different devices and locations.
#3: Improved Reliability:
Edge computing lessens dependence on constant cloud connectivity for data generation. Local processing ensures operations continue even if there's a wider network disruption.
#4: Cost-Effectiveness:
Localized data processing, often enabled by network functions virtualization, reduces reliance on expensive, dedicated hardware, potentially leading to even lower operational costs. Processing data with edge computing will help you save on your egress traffic costs simply because the network traffic is processed locally and stays on the local network.
#5: Better Performance:
Instead of overloading the network by sending massive amounts of raw data to the cloud, edge devices can pre-process and filter process data, reducing latency by transmitting only the most important requests. This reduces bandwidth requirements and costs. A good example is having a database read replica at an edge location; local users read directly from that database instead of querying the master database.
The network edge is a designated area of a broader core network closer to your customers or employees. When using a core network-to-edge network design, the world gets much smaller. Users experience faster speeds, services are highly secured, and even the costs are lower!
What Is the Difference Between Network Edge and Perimeter?
The terms network edge and network perimeter are often used interchangeably, and despite sharing many similar traits, they are very different concepts. We already know that the network edge is where individual devices, users, and applications directly connect to the Internet or a distributed network. Alternatively, the network perimeter is a defined line of separation between an organization's private, internal network and the uncontrolled, public Internet.
Key Differences
Network Perimeter
Single, well-defined boundary
Protects the internal network
Centralized security model, defended by firewalls
Works well with traditional cloud computing
Network Edge
Vast, ever-changing environment
Designed to protect devices, users, and data
Decentralized, device-level security
Great for IoT devices
What Is the Difference Between the Edge and the Core in an Access Network?
An access network is the part of the telecommunications network that bridges the gap between end-users physical devices (homes, businesses, data centers, mobile devices) and a service provider's core network. It's the connection that gets internet traffic to and from your devices. Your ISP is an access network.
The Edge (Front Line)
The edge of the access network is the point where end-user devices physically connect to other devices and networks. Customer premises equipment (CPE) includes routers, modems, and optical network terminals (ONTs) in your home, as well as cell phones and business connections.
The purpose of the edge is to collect traffic from individual users and devices. It is a centralized data center that aggregates the data (clusters the data together) and sends it to its destination. IoT devices use the edge to send data to a target.
The edge can handle routing, quality of service (QoS), and security functions.
The Core (Backbone)
The core is centralized within the service provider's network, away from the user. It acts as the high-speed backbone or virtual network that carries large volumes of aggregated traffic from the data center to multiple edge locations. The network core uses powerful routers and switches to manage significant volumes of data.
The network core directs traffic to a provider's edge networks and broader network infrastructure, ultimately connecting it to the Internet or other destinations. Its purpose is to transmit data at scale, from any edge location. The network core handles complex routing and can enforce advanced security policies. Essentially, the network core's purpose is to connect the edge networks and wider Internet to other service provider networks and enterprise applications.
In summary, the edge acts as the entry point for user traffic, while the network core provides the powerful infrastructure that carries and directs that traffic to its final destination.
Is a Smartphone an Edge Computing Device?
Yes, a smartphone can be called a network edge device. This is because all smartphones connect directly to the Internet and cellular networks. Logically, the cell phone is often the outermost point of an edge network, making cell phones edge devices as far as network infrastructure is concerned.
Another reason is that smartphones crunch data. They generate and consume significant amounts of data, which originates and terminates at the smartphone, making it an edge device.
Modern smartphones are substantially more powerful than their predecessors of 5 or 10 years ago. They have significant processing capabilities that can analyze data and perform image recognition; the latest generation devices even have AI built into the handset, making edge computing one of the most important functions of a smartphone.
Do I Need Network Edge Protection?
The network edge is everywhere. You probably use edge devices daily without even considering that you are using them. Whether you need the network edge for your business requires a more detailed answer. It depends on various factors such as the size of your business network, whether or not you handle sensitive data, and also your risk tolerance.
Before we discuss why you may need Network Edge protection, let's consider who needs it. Edge protection is suitable for literally all types of businesses, from small businesses to large enterprises. Everyone needs to face up to the risk of cyberattacks. The size of your organization's network doesn't determine your vulnerability.
The number of people working remotely is still high, even after the Covid-19 pandemic has subsided. Since the rise of remote working, the network edge has expanded significantly. Protecting remote connections is crucial to preventing unauthorized access to corporate networks.
Also, if you rely on cloud services, your data already travels through the network edge. Ensuring its security is paramount. This is even more important if your IoT devices are often connected at the edge, making them potential entry points for attacks. Protecting them is essential for overall network security.
Now, lets consider the crucial reasons why you may need Network Edge Protection:
An Ever-Changing Threat Landscape: Cyberattacks are increasingly sophisticated and frequent. The network edge, being the most exposed part, is a prime target. Protecting it is essential to safeguard your entire network.
Data Protection: Most organizations have valuable data that needs protecting, whether it's customer information, healthcare data, intellectual property, or financial records. A breach at the edge can compromise this data, leading to significant financial and reputational damage.
Business Continuity: Disruptions or attacks at the edge can severely impact business operations, leading to downtime, lost productivity, and customer dissatisfaction. Edge protection helps ensure business continuity.
Compliance: Many industries have regulatory requirements, such as HIPAA or PCI-DSS, regarding data protection and network security. Edge protection is often a mandatory requirement needed to meet compliant status.
Finally, let's consider the most common types of network edge protection available. The front line of defense is the network Firewall. These are used across the network to filter incoming and outgoing traffic based on predetermined rules. They are either hardware appliances or software-based web application firewalls (WAF). Both are proven technologies that filter out unwanted and malicious traffic.
Next, Intrusion Detection/Prevention Systems (IDS/IPS) monitor network traffic for suspicious activity and automatically block potential threats. An IPS is an intelligent application that first creates a baseline security profile, which determines your security stance. Any deviations from normal activity are reported. Offenses are classified, and alerts are created that are either automatically fixed or logged for manual triage.
Another popular tool is Secure Web Gateways (SWG). These control web access and protect against web-based threats. The secure web gateway sits between users and the Internet to filter traffic and enforce acceptable use and security policies.
Living on the Edge with Atlantic.Net
Atlantic.Net is a cloud hosting and managed service provider with an expansive cloud platform with points of presence throughout the United States, Canada, Europe, and the Far East. Atlantic.Net offers a suite of managed services designed to protect and further optimize traffic at the network edge.
Network Edge/DDoS Protection: This service safeguards against distributed denial-of-service (DDoS) attacks, which can overwhelm your network and disrupt operations. It helps ensure your network remains available and responsive, even under attack.
Firewall: Atlantic.Net offers managed web application firewall services to filter traffic and protect your network from unauthorized access and malicious activity.
Intrusion Prevention System (IPS): Our IPS service actively monitors network traffic for signs of intrusion and takes action to prevent or block attacks.
Looking to boost your network's speed, security, and cost-efficiency? The network edge is the key. By bringing your applications and data closer to your users, you can reduce latency, enhance security, and even lower your bandwidth costs.
Contact Atlantic.Net today to learn how our managed services can help you secure and optimize your network edge.
### Atlantic.Net Joins Forces with NVIDIA
Affordable GPU Cloud Servers
In a move set to shake up the AI industry, Atlantic.Net has joined forces with NVIDIA as an NVIDIA Partner Network Cloud Partner (NCP) to bring the power of GPU processing to on-demand cloud computing. This collaboration will simplify access to cutting-edge Artificial Intelligence (AI) solutions.
With straightforward, on-demand payment options, you can leverage powerful dedicated servers, each with a powerful CPU, super-fast NVME storage, large-capacity RAM, and now an enterprise-grade NVIDIA GPU.
We have two types of GPU available, with more to be added soon:
NVIDIA L40S GPU - For general AI tasks, Machine Learning, and Deep Learning.
NVIDIA H100 NVL - For more demanding workloads, such as advanced AI and Deep Learning.
The Advantages of GPU Cloud Computing from Atlantic.Net
With Atlantic.Net's powerful GPU cloud computing solutions, businesses can expect lots of benefits, including:
Accelerated AI Development: GPUs significantly reduce training times for deep learning models, enabling businesses to bring AI applications to market faster.
Cost Reduction: GPU cloud servers eliminate the need for costly upfront investments in hardware and maintenance, making AI accessible to organizations of all sizes.
Effortless Scaling: Atlantic.Net's scalable cloud infrastructure allows businesses to easily adjust their GPU resources to meet evolving needs.
Expert Support: Atlantic.Net provides comprehensive, around-the-clock support for dedicated GPU cloud servers, ensuring businesses can maximize their investment in AI and receive assistance whenever needed
Unlock the Power of AI with Atlantic.Net
So what exactly can you do with Atlantic.Net's GPU cloud servers? GPU Servers are perfect for a wide range of applications. Here are the top 10 uses of dedicated GPU cloud servers:
Deep Learning: Atlantic.Net's GPU cloud servers are ideal for deep learning, enabling the training and deployment of complex neural networks. These networks excel in tasks such as image recognition, natural language processing, and a variety of other AI applications, providing businesses with the tools they need to advance their AI capabilities.
Inference: Inference tasks benefit immensely from Atlantic.Net's GPU cloud servers, allowing AI models to run in real-time and make swift predictions and decisions. This capability is perfect for applications like chatbots or hosting your own GPT solution, ensuring responsive and efficient performance for end-users.
High-Performance Computing: Accelerate scientific simulations, financial modeling, and other computationally intensive workloads. This increased speed and efficiency help empower your business to tackle complex tasks more effectively, leading to faster results and deeper insights.
Video Editing and Rendering: GPUs are still superb at rendering graphics. Dramatically speed up video processing tasks like rendering, encoding, and effects application. The superior graphics processing capabilities make them indispensable for media professionals who need to deliver high-quality video content efficiently and quickly.
3D Animation, Modeling, and Graphic Design: Animators can accelerate queued rendering times for complex 3D scenes and models, enabling faster iterations and higher-quality output.
Computer-Aided Design (CAD) and Computer-Aided Engineering (CAE): Enhance performance and rendering in CAD applications. Preview faster simulations and design iterations, even in real-time. Accelerate complex engineering simulations and analyses, reducing time to market for new products.
Product Visualization: Generate high-quality, photorealistic product renders and simulations for marketing and sales purposes. Create visually stunning and accurate representations of your product, enhancing promotional efforts and customer engagement.
Medical Imaging: Accelerate processing of medical images like CT scans and MRIs, enabling faster diagnosis and treatment planning. Combined with Atlantic.Net's HIPAA-Compliant Hosting, you can rest easy that your business operations remain secure and protected.
Drug Discovery and Genomics: Big Pharma experts can speed up medical simulations of molecular interactions and drug-target binding, aiding in the development of new therapeutics and predictions. Accelerate analysis of large genomic datasets to help identify disease-causing genes and potential treatments.
Risk Modeling and Fraud Detection: Perform complex financial simulations and risk analyses in real-time, informing investment decisions and risk management strategies. Analyze massive amounts of financial data to identify patterns and anomalies indicative of fraudulent activity.
We have just scratched the surface of what Atlantic.Net GPU cloud servers are capable of doing. Our customers are finding innovative and unique ways to make use of the raw power being made available thanks to NVIDIA GPUs.
Atlantic.Net GPU Server Hosting
If you're looking for a GPU server hosting provider that can deliver the performance, reliability, and support you need to succeed, look no further than Atlantic.Net. Our GPU cloud servers are an ideal platform for businesses looking to harness the power of AI to help drive innovation and growth.
If you're seeking a GPU server hosting provider that delivers performance, reliability, and exceptional support, look no further than Atlantic.Net. Don't wait—rent a GPU server from Atlantic.Net today and experience the transformative power of GPU cloud computing.
### How to Install Nextcloud AIO on Ubuntu 22.04
Nextcloud All-In-One (AIO) is a comprehensive solution that integrates various components into a single package, including the Nextcloud file hosting service, a web server, a database, and other necessary dependencies. Nextcloud AIO lets you set up a self-hosted cloud storage and collaboration platform quickly and efficiently. With Nextcloud AIO, you can store, sync, and share files securely, collaborate on documents in real-time, and access your data from anywhere, using any device.
This post will show you how to install Nextcloud AIO on Ubuntu 22.04.
Step 1 - Install Docker CE
By default, the latest Docker version is unavailable in the Ubuntu default repo, so,you will need to install it from their official repo.
First, install all the necessary dependencies:
apt update -y
apt install ca-certificates curl gnupg lsb-release -y
Next, create a directory to store the Docker GPG key.
mkdir -p /etc/apt/keyrings
Next, download the GPG key:
curl -fsSL https://download.docker.com/linux/ubuntu/gpg | gpg --dearmor -o /etc/apt/keyrings/docker.gpg
Next, add the Docker repository to the APT source file.
echo "deb [arch=$(dpkg --print-architecture) signed-by=/etc/apt/keyrings/docker.gpg] https://download.docker.com/linux/ubuntu $(lsb_release -cs) stable" | tee /etc/apt/sources.list.d/docker.list > /dev/null
Next, update the repository cache:
apt update
Finally, install the Docker CE and other required tools using the following command:
apt install docker-ce docker-ce-cli containerd.io docker-compose-plugin -y
You can verify the status of the Docker service using the following command:
systemctl status docker
Output:
● docker.service - Docker Application Container Engine
Loaded: loaded (/lib/systemd/system/docker.service; enabled; vendor preset: enabled)
Active: active (running) since Fri 2024-02-09 07:48:16 UTC; 1h 4min ago
TriggeredBy: ● docker.socket
Docs: https://docs.docker.com
Main PID: 27927 (dockerd)
Tasks: 84
Memory: 263.4M
CPU: 1min 40.313s
CGroup: /system.slice/docker.service
├─27927 /usr/bin/dockerd -H fd:// --containerd=/run/containerd/containerd.sock
├─34566 /usr/bin/docker-proxy -proto tcp -host-ip 0.0.0.0 -host-port 3478 -container-ip 172.21.0.4 -container-port 3478
├─34572 /usr/bin/docker-proxy -proto tcp -host-ip :: -host-port 3478 -container-ip 172.21.0.4 -container-port 3478
├─34586 /usr/bin/docker-proxy -proto udp -host-ip 0.0.0.0 -host-port 3478 -container-ip 172.21.0.4 -container-port 3478
├─34591 /usr/bin/docker-proxy -proto udp -host-ip :: -host-port 3478 -container-ip 172.21.0.4 -container-port 3478
├─35803 /usr/bin/docker-proxy -proto tcp -host-ip 0.0.0.0 -host-port 443 -container-ip 172.21.0.10 -container-port 443
├─35809 /usr/bin/docker-proxy -proto tcp -host-ip :: -host-port 443 -container-ip 172.21.0.10 -container-port 443
├─35825 /usr/bin/docker-proxy -proto udp -host-ip 0.0.0.0 -host-port 443 -container-ip 172.21.0.10 -container-port 443
└─35833 /usr/bin/docker-proxy -proto udp -host-ip :: -host-port 443 -container-ip 172.21.0.10 -container-port 443
Step 2 - Install Nextcloud AIO
First, create a directory to store all configuration files.
mkdir nextcloud
Next, change the directory to the Nextcloud and create a Docker Compose file for Nextcloud AIO.
cd nextcloud
nano docker-compose.yml
Add the following configurations:
version: "3.8"
volumes:
nextcloud_aio_mastercontainer:
name: nextcloud_aio_mastercontainer # This line is not allowed to be changed
services:
nextcloud:
image: nextcloud/all-in-one:latest # Must be changed to 'nextcloud/all-in-one:latest-arm64' when used with an arm64 CPU
restart: always
container_name: nextcloud-aio-mastercontainer
volumes:
- nextcloud_aio_mastercontainer:/mnt/docker-aio-config # This line is not allowed to be changed
- /var/run/docker.sock:/var/run/docker.sock:ro
ports:
- 80:80
- 8080:8080
- 8443:8443
Save and close the file, then launch the Nextcloud AIO container using the following command:
docker compose up -d
You can verify the status of all running containers using the following command:
docker compose ps
Output:
NAME IMAGE COMMAND SERVICE CREATED STATUS PORTS
nextcloud-aio-mastercontainer nextcloud/all-in-one:latest "/start.sh" nextcloud 8 seconds ago Up 7 seconds (health: starting) 0.0.0.0:80->80/tcp, :::80->80/tcp, 0.0.0.0:8080->8080/tcp, :::8080->8080/tcp, 0.0.0.0:8443->8443/tcp, :::8443->8443/tcp, 9000/tcp
Step 3 - Access Nextcloud AIO
At this point, Nextcloud AIO is installed inside the Docker container. You can now access it using the URL http://nextcloud.example.com:8080. You will see the Nextcloud AIO setup page:
Note: You can also use http://your_server_ip/settings/admin/overview
Copy the password from the above screen and click on Open Nextcloud AIO Login. You will see the following screen.
Paste your password and click on Log in. You will see the following page:
Provide your domain name and click on Submit domain. You will see the following page:
Click on Download and start containers. Once all the containers are started, you will see the following screen.
Copy the Nextcloud initial admin username and password and click on the Open your Nextcloud. You will see the following screen.
Provide your admin username and password and click on Log in. You will see the Nextcloud dashboard on the following screen.
Conclusion
In conclusion, installing Nextcloud All-In-One (AIO) on Ubuntu 22.04 provides a powerful and versatile platform for hosting your cloud storage and collaboration environment. This guide covered the steps to install Nextcloud AIO, configure its dependencies, set up the database, and access the Nextcloud web interface. You can test Nextcloud AIO on dedicated server hosting from Atlantic.Net!
### How to Install Syncthing on Ubuntu 24.04
Syncthing is a powerful and secure open-source file synchronization tool that synchronizes files across multiple devices and platforms. Whether you need to synchronize files between your computers, servers, or mobile devices, Syncthing offers a decentralized and flexible solution that prioritizes privacy and security. Syncthing lets you create your private file synchronization network, ensuring your data remains controlled and protected from third-party access.
In this guide, we will walk you through the step-by-step process of installing Syncthing on Ubuntu 24.04.
Step 1 - Add Syncthing Repository
By default, the Syncthing package is not included in the Ubuntu central repository, so you will need to add the Syncthing official repo to the APT source list.
First, install the required dependencies:
apt update -y
apt install gnupg2 curl apt-transport-https -y
Next, download the Syncthing GPG key:
curl -fsSL https://syncthing.net/release-key.txt | gpg --dearmor -o /etc/apt/trusted.gpg.d/syncthing.gpg
Next, add the Syncthing repository to APT.
echo "deb https://apt.syncthing.net/ syncthing release" | tee /etc/apt/sources.list.d/syncthing.list
Next, update the repository index.
apt update
Step 2 - Install Syncthing
At this point, the Syncthing repository is ready. You can now install Syncthing using the apt command:
apt install syncthing
Once Syncthing is installed, you can verify the Syncthing installation using the following command:
syncthing --version
You will see the Syncthing version in the following output:
syncthing v1.27.2-ds4 "Gold Grasshopper" (go1.22.2 linux-amd64) debian@debian 2024-11-08 06:50:53 UTC
Step 3 - Manage Syncthing Service
By default Syncthing service is managed by systemd. You can easily start, stop, and disable the Syncthing service via the systemctl command.
To start the Syncthing service, run:
systemctl start syncthing@root.service
To enable the Syncthing service, run:
systemctl enable syncthing@root.service
To check the status of the Syncthing service, run:
systemctl status syncthing@root.service
Output:
● syncthing@root.service - Syncthing - Open Source Continuous File Synchronization for root
Loaded: loaded (/usr/lib/systemd/system/syncthing@.service; disabled; preset: enabled)
Active: active (running) since Wed 2025-05-14 06:44:27 UTC; 38s ago
Docs: man:syncthing(1)
Main PID: 5670 (syncthing)
Tasks: 15 (limit: 4609)
Memory: 15.2M (peak: 15.7M)
CPU: 1.520s
CGroup: /system.slice/system-syncthing.slice/syncthing@root.service
├─5670 /usr/bin/syncthing serve --no-browser --no-restart --logflags=0
└─5677 /usr/bin/syncthing serve --no-browser --no-restart --logflags=0
May 14 06:44:29 ubuntu syncthing[5670]: [VD6A4] INFO: QUIC listener ([::]:22000) starting
May 14 06:44:29 ubuntu syncthing[5670]: [VD6A4] INFO: Loading HTTPS certificate: open /root/.local/state/syncthing/https-cert.pem: no such file or directory
May 14 06:44:29 ubuntu syncthing[5670]: [VD6A4] INFO: Creating new HTTPS certificate
May 14 06:44:29 ubuntu syncthing[5670]: [VD6A4] INFO: GUI and API listening on 127.0.0.1:8384
May 14 06:44:29 ubuntu syncthing[5670]: [VD6A4] INFO: Access the GUI via the following URL: http://127.0.0.1:8384/
May 14 06:44:29 ubuntu syncthing[5670]: [VD6A4] INFO: My name is "ubuntu"
May 14 06:44:29 ubuntu syncthing[5670]: [VD6A4] WARNING: Syncthing should not run as a privileged or system user. Please consider using a normal user account.
May 14 06:44:29 ubuntu syncthing[5670]: [VD6A4] INFO: Completed initial scan of sendreceive folder "Default Folder" (default)
May 14 06:44:42 ubuntu syncthing[5670]: [VD6A4] INFO: Joined relay relay://172.93.167.234:22067
May 14 06:44:49 ubuntu syncthing[5670]: [VD6A4] INFO: Detected 0 NAT services
Step 4 - Configure Syncthing
By default, Syncthing listens on localhost. To access Syncthing from the outside world, you will need to configure It to listen on your server IP.
Edit the Syncthing configuration file.
nano /root/.local/state/syncthing/config.xml
Find the following line:
127.0.0.1:8384
Replace it with the following line:
your-server-ip:8384
Save and close the file, then restart the Syncthing service:
systemctl restart syncthing@root.service
Step 5 - Access Syncthing Web UI
Now, open your web browser and access the Syncthing web interface using the URL http://your-server-ip:8384. You will see the Syncthing dashboard on the following screen.
You can now follow the same steps to install Syncthing on another server and share files and folders between both servers.
Conclusion
In this guide, we've covered the steps to install Syncthing, configure its settings, and access its web interface for managing file synchronization across your devices. With Syncthing, you can synchronize files seamlessly, collaborate with others, and access your data from anywhere without relying on third-party cloud services or compromising the security of your files. You can try deploying Syncthing on dedicated server hosting from Atlantic.Net!
### How to Install Gitea DevOps Platform using Docker on Ubuntu 22.04
Gitea is an open-source, self-hosted Git service that allows you to create and manage Git repositories on your own server. Installing Gitea on Ubuntu 22.04 gives you complete control over your Git repositories, offering features similar to other popular Git hosting platforms while allowing customization and integration with your existing infrastructure.
In this guide, we will walk you through the step-by-step process of installing Gitea on Ubuntu 22.04, ensuring you have a seamless experience setting up your own Git hosting solution.
Step 1 - Getting Started
Before starting, you must update all the system packages to the latest version. You can do it with the following command:
apt update -y
Next, install other required dependencies using the following command:
apt install curl wget nano software-properties-common dirmngr apt-transport-https ca-certificates lsb-release debian-archive-keyring gnupg2 ufw unzip -y
Once all the required dependencies are installed, you can proceed to the next step.
Step 2 - Install Docker CE
This section will install the Docker CE from their official repository.
First, create a directory to store the Docker GPG key.
mkdir -p /etc/apt/keyrings
Next, download the Docker GPG key.
curl -fsSL https://download.docker.com/linux/ubuntu/gpg | gpg --dearmor -o /etc/apt/keyrings/docker.gpg
Next, add the Docker repository to the APT file.
echo "deb [arch=$(dpkg --print-architecture) signed-by=/etc/apt/keyrings/docker.gpg] https://download.docker.com/linux/ubuntu $(lsb_release -cs) stable" | tee /etc/apt/sources.list.d/docker.list > /dev/null
Next, update the repository index.
apt update
Next, install Docker CE and other packages using the following command:
apt install docker-ce docker-ce-cli containerd.io docker-buildx-plugin docker-compose-plugin
Once the installation has been completed, you can verify the Docker service using the following command:
systemctl status docker
Output:
● docker.service - Docker Application Container Engine
Loaded: loaded (/lib/systemd/system/docker.service; enabled; vendor preset: enabled)
Active: active (running) since Fri 2024-02-09 07:48:16 UTC; 10s ago
TriggeredBy: ● docker.socket
Docs: https://docs.docker.com
Main PID: 27927 (dockerd)
Tasks: 8
Memory: 29.6M
CPU: 206ms
CGroup: /system.slice/docker.service
└─27927 /usr/bin/dockerd -H fd:// --containerd=/run/containerd/containerd.sock
Step 3 - Create a Docker Compose File for Gitea
First, create a directory to store your Gitea configuration files.
mkdir ~/gitea-docker
Next, create other required directories:
cd ~/gitea-docker
mkdir {gitea,postgres}
Next, create a docker-compose.yml file.
nano docker-compose.yml
Add the following configurations:
services:
server:
image: gitea/gitea:1.21.0
container_name: gitea
environment:
- USER_UID=105
- USER_GID=111
- GITEA__database__DB_TYPE=postgres
- GITEA__database__HOST=db:5432
- GITEA__database__NAME=gitea
- GITEA__database__USER=gitea
- GITEA__database__PASSWD=gitea
restart: always
networks:
- gitea
volumes:
- ./gitea:/data
- /root/.ssh/:/data/git/.ssh
- /etc/timezone:/etc/timezone:ro
- /etc/localtime:/etc/localtime:ro
ports:
- "3000:3000"
- "2221:22"
depends_on:
- db
db:
image: postgres:15
restart: always
environment:
- POSTGRES_USER=gitea
- POSTGRES_PASSWORD=gitea
- POSTGRES_DB=gitea
networks:
- gitea
volumes:
- ./postgres:/var/lib/postgresql/data
networks:
gitea:
external: false
Save and close the file when you are done.
Step 4 - Launch Gitea Container
At this point, the Docker Compose file is ready to launch the Gitea Docker container. You can run the following command to start all the containers:
docker compose up -d
Next, verify the running containers using the following command:
docker ps
You will see the following output:
CONTAINER ID IMAGE COMMAND CREATED STATUS PORTS NAMES
e3a6eaac98d5 gitea/gitea:1.21.0 "/usr/bin/entrypoint…" 19 seconds ago Up 18 seconds 0.0.0.0:3000->3000/tcp, :::3000->3000/tcp, 0.0.0.0:2221->22/tcp, :::2221->22/tcp gitea
e8794d6c1a5e postgres:15 "docker-entrypoint.s…" 19 seconds ago Up 18 seconds 5432/tcp gitea-docker-db-1
As you can see, the Gitea container is started and listens on port 3000.
Step 5 - Configure Nginx as a Reverse Proxy
Now, you must configure Nginx as a reverse proxy to access the Gitea from the remote machine.
First, install the Nginx package:
apt install nginx
Next, create an Nginx configuration file.
nano /etc/nginx/conf.d/gitea.conf
Add the following configurations:
# Connection header for WebSocket reverse proxy
map $http_upgrade $connection_upgrade {
default upgrade;
"" close;
}
map $remote_addr $proxy_forwarded_elem {
# IPv4 addresses can be sent as-is
~^[0-9.]+$ "for=$remote_addr";
# IPv6 addresses need to be bracketed and quoted
~^[0-9A-Fa-f:.]+$ "for=\"[$remote_addr]\"";
# Unix domain socket names cannot be represented in RFC 7239 syntax
default "for=unknown";
}
map $http_forwarded $proxy_add_forwarded {
# If the incoming Forwarded header is syntactically valid, append to it
"~^(,[ \\t]*)*([!#$%&'*+.^_`|~0-9A-Za-z-]+=([!#$%&'*+.^_`|~0-9A-Za-z-]+|\"([\\t \\x21\\x23-\\x5B\\x5D-\\x7E\\x80-\\xFF]|\\\\[\\t \\x21-\\x7E\\x80-\\xFF])*\"))?(;([!#$%&'*+.^_`|~0-9A-Za-z-]+=([!#$%&'*+.^_`|~0-9A-Za-z-]+|\"([\\t \\x21\\x23-\\x5B\\x5D-\\x7E\\x80-\\xFF]|\\\\[\\t \\x21-\\x7E\\x80-\\xFF])*\"))?)*([ \\t]*,([ \\t]*([!#$%&'*+.^_`|~0-9A-Za-z-]+=([!#$%&'*+.^_`|~0-9A-Za-z-]+|\"([\\t \\x21\\x23-\\x5B\\x5D-\\x7E\\x80-\\xFF]|\\\\[\\t \\x21-\\x7E\\x80-\\xFF])*\"))?(;([!#$%&'*+.^_`|~0-9A-Za-z-]+=([!#$%&'*+.^_`|~0-9A-Za-z-]+|\"([\\t \\x21\\x23-\\x5B\\x5D-\\x7E\\x80-\\xFF]|\\\\[\\t \\x21-\\x7E\\x80-\\xFF])*\"))?)*)?)*$" "$http_forwarded, $proxy_forwarded_elem";
# Otherwise, replace it
default "$proxy_forwarded_elem";
}
server {
listen 80;
server_name gitea.example.com;
access_log /var/log/nginx/gitea.access.log;
error_log /var/log/nginx/gitea.error.log;
tcp_nopush on;
# security headers
add_header X-XSS-Protection "1; mode=block" always;
add_header X-Content-Type-Options "nosniff" always;
add_header Referrer-Policy "no-referrer-when-downgrade" always;
add_header Content-Security-Policy "default-src 'self' http: https: ws: wss: data: blob: 'unsafe-inline'; frame-ancestors 'self';" always;
add_header Permissions-Policy "interest-cohort=()" always;
# . files
location ~ /\.(?!well-known) {
deny all;
}
location / {
client_max_body_size 100M;
proxy_pass http://localhost:3000;
proxy_http_version 1.1;
proxy_cache_bypass $http_upgrade;
proxy_set_header Upgrade $http_upgrade;
proxy_set_header Connection $connection_upgrade;
proxy_set_header Host $host;
proxy_set_header X-Real-IP $remote_addr;
proxy_set_header X-Forwarded-For $proxy_add_x_forwarded_for;
proxy_set_header X-Forwarded-Proto $scheme;
proxy_set_header X-Forwarded-Port $server_port;
proxy_set_header Forwarded $proxy_add_forwarded;
proxy_connect_timeout 60s;
proxy_send_timeout 60s;
proxy_read_timeout 60s;
}
}
Save and close the file, then edit the Nginx main configuration file.
nano /etc/nginx/nginx.conf
Add the following line after the line http {:
server_names_hash_bucket_size 64;
Save the file, then reload the Nginx service to apply the changes:
systemctl reload nginx
Step 6 - Access Gitea Web Interface
Now, open your web browser and access the Gitea Web UI using the URL http://gitea.example.com. You will see the Gitea initial configuration page:
Provide all the required details and click on Install Gitea. You will see the following screen:
In the Register Account tab, provide your username, email, and password then click the Register Account button. You will see the Gitea dashboard on the following page:
Conclusion
By following the steps outlined in this guide, you have successfully set up Gitea, enabling you to collaborate with your team, manage version control, and maintain code integrity within your organization. As you explore the features and capabilities of Gitea, remember to regularly update the application and implement best practices for security and user management to ensure a reliable and robust Git hosting environment. With Gitea installed, you are well-equipped to streamline your development workflow and foster collaboration among your team members. You can now try to host your own repository using Gitea on dedicated server hosting from Atlantic.Net!
### How to Install BookStack on Ubuntu 24.04
BookStack is a versatile and user-friendly open-source platform for organizing and storing documentation. With its intuitive interface and powerful features, BookStack simplifies creating, managing, and sharing knowledge within organizations, teams, and communities. BookStack allows you to leverage its capabilities to streamline documentation workflows, improve collaboration, and ensure easy access to vital information.
This guide will walk you through the step-by-step process of installing BookStack on Ubuntu 24.04.
Step 1 - Install LEMP Stack
Before starting, the LEMP stack must be installed on your server. First, install the Nginx web server using the following command:
apt update -y
apt install nginx -y
Next, install PHP with other required dependencies using the following command:
apt install php php-fpm php-mbstring php-gd php-xml unzip php-bcmath php-curl php-mysql -y
Next, install the MariaDB database server with the following command:
apt install mariadb-server -y
Next, install the Composer using the following command:
apt install composer -y
You can verify the Composer installation using the following command:
composer --version
Output:
Composer 2.2.6 2022-02-04 17:00:38
Once all the packages are installed, you can proceed to the next step.
Step 2 - Create a Database
First, secure the MariaDB installation using the following command:
mysql_secure_installation
Answer all the questions as shown below:
Enter current password for root (enter for none): Press Enter
Switch to unix_socket authentication [Y/n] Type y
Change the root password? [Y/n] Type n
Remove anonymous users? [Y/n] Type y
Disallow root login remotely? [Y/n] Type y
Remove test database and access to it? [Y/n] Type y
Reload privilege tables now? [Y/n] Type y
Next, log in to the MariaDB shell:
mysql
Once you are logged in, create a database and user for Bookstack:
create database bookstack;
CREATE USER 'bookstackuser'@'localhost' identified by 'password';
Next, grant all the privileges to the Bookstack database:
grant CREATE,ALTER,SELECT,INSERT,UPDATE,DELETE on `bookstack`.* to 'bookstackuser'@'localhost';
grant All on `bookstack`.* to 'bookstackuser'@'localhost';
Next, flush the privileges and exit from the MariaDB shell.
flush privileges;
exit;
Step 3 - Install Bookstack
First, create a directory for Bookstack:
mkdir -p /var/www/html/bookstack
Next, navigate inside the Bookstack directory and download the latest version of Bookstack from the Git repository.
cd /var/www/html/bookstack
git clone https://github.com/BookStackApp/BookStack.git --branch=release --single-branch .
Next, install all the required PHP dependencies using the following command:
composer install --no-dev
Next, copy the sample environment file.
cp .env.example .env
Next, edit the .env file.
nano .env
Define your application URL and database settings:
APP_URL=http://bookstack.example.com
DB_HOST=localhost
DB_DATABASE=bookstack
DB_USERNAME=bookstackuser
DB_PASSWORD=password
Save and close the file then migrate the database using the following commands:
php artisan key:generate
php artisan migrate
You will be prompted by the above commands. Type [YES] to continue.
Next, set proper permission and ownership to the Bookstack directory:
chown -R www-data:www-data /var/www/html/bookstack
Step 4 - Configure Nginx for Bookstack
Next, create an Nginx virtual host configuration file to host Bookstack online.
nano /etc/nginx/conf.d/bookstack.conf
Add the following configurations:
server {
listen 80;
server_name bookstack.example.com;
root /var/www/html/bookstack/public;
index index.php index.html;
location / {
try_files $uri $uri/ /index.php?$query_string;
}
location ~ \.php$ {
fastcgi_split_path_info ^(.+\.php)(/.+)$;
include fastcgi_params;
fastcgi_param SCRIPT_FILENAME $document_root$fastcgi_script_name;
fastcgi_param PATH_INFO $fastcgi_path_info;
fastcgi_pass unix:/run/php/php8.3-fpm.sock;
}
}
Save and close the file, then edit the Nginx main configuration file.
nano /etc/nginx/nginx.conf
Add the following line after the line http {:
server_names_hash_bucket_size 64;
Save the file, then validate the configuration using the following command:
nginx -t
Output:
nginx: the configuration file /etc/nginx/nginx.conf syntax is ok
nginx: configuration file /etc/nginx/nginx.conf test is successful
Finally, restart the Nginx service to implement the changes.
systemctl restart nginx
Step 5 - Access Bookstack Web UI
Now, open your web browser and access the Bookstack web interface using the URL http://bookstack.example.com. You will see the Bookstack login page:
Provide default username admin@admin.com with a password of password, then click on the Log in button. You will see the Bookstack dashboard on the following screen.
Conclusion
In conclusion, installing BookStack on Ubuntu 24.04 gives you a robust and efficient platform for organizing and managing documentation. Following the steps outlined in this guide, you have successfully set up BookStack, empowering you and your team to create, collaborate, and share knowledge seamlessly. As you explore the features and capabilities of BookStack, consider customizing the platform to meet your specific requirements and integrating it into your existing workflows and tools. You can now deploy Bookstack on dedicated server hosting from Atlantic.Net!
### How to Install Harbor Docker Image Registry on Ubuntu 24.04
Harbor is an open-source cloud-native registry that provides a secure and scalable platform for storing, signing, and distributing container images. Developed by VMware, Harbor offers enterprises and developers a comprehensive solution for managing container artifacts, ensuring compliance, and promoting collaboration across the software development lifecycle.
In this guide, we will show you how to install the Harbor registry on Ubuntu 24.04.
Step 1 - Install Docker CE
By default, the latest Docker version is unavailable in the Ubuntu default repo, so you will need to install it from their official repo.
First, install all the necessary dependencies:
apt update -y
apt install ca-certificates curl gnupg lsb-release -y
Next, create a directory to store the Docker GPG key.
mkdir -p /etc/apt/keyrings
Next, download the GPG key:
curl -fsSL https://download.docker.com/linux/ubuntu/gpg | gpg --dearmor -o /etc/apt/keyrings/docker.gpg
Next, add the Docker repository to the APT source file.
echo "deb [arch=$(dpkg --print-architecture) signed-by=/etc/apt/keyrings/docker.gpg] https://download.docker.com/linux/ubuntu $(lsb_release -cs) stable" | tee /etc/apt/sources.list.d/docker.list > /dev/null
Next, update the repository cache:
apt update -y
Finally, install Docker CE and other required tools using the following command:
apt install docker-ce docker-ce-cli containerd.io docker-compose-plugin -y
You can verify the status of the Docker service using the following command:
systemctl status docker
Output:
● docker.service - Docker Application Container Engine
Loaded: loaded (/usr/lib/systemd/system/docker.service; enabled; preset: enabled)
Active: active (running) since Mon 2025-05-19 04:47:49 UTC; 3s ago
TriggeredBy: ● docker.socket
Docs: https://docs.docker.com
Main PID: 20631 (dockerd)
Tasks: 9
Memory: 20.9M (peak: 21.0M)
CPU: 339ms
CGroup: /system.slice/docker.service
└─20631 /usr/bin/dockerd -H fd:// --containerd=/run/containerd/containerd.sock
Step 2 - Install Harbor
First, download the latest version of Harbor from the Git repository.
curl -s https://api.github.com/repos/goharbor/harbor/releases/latest | grep browser_download_url | cut -d '"' -f 4 | grep '\.tgz$' | wget -i -
Once the download is completed, extract the downloaded file using the tar command:
tar -xzvf harbor-online-installer-v2.12.3.tgz
Next, move the extracted directory to the /opt directory.
mv harbor /opt/
Next, navigate to the Harbor directory and copy the Harbor configuration file.
cd /opt/harbor
cp harbor.yml.tmpl harbor.yml
Next, edit the Harbor configuration file.
nano harbor.yml
Change the following lines:
hostname: reg.example.com
harbor_admin_password: Harbor12345
Remove the following lines:
https:
# https port for harbor, default is 443
port: 443
# The path of cert and key files for nginx
certificate: /your/certificate/path
private_key: /your/private/key/path
Save and close the file when you are done.
Next, run the following command to install the Harbor:
./install.sh
You will see the following output:
[Step 4]: starting Harbor ...
[+] Running 9/10
⠧ Network harbor_harbor Created 1.8s
✔ Container harbor-log Started 0.4s
✔ Container harbor-db Started 0.9s
✔ Container harbor-portal Started 0.8s
✔ Container redis Started 1.0s
✔ Container registry Started 0.7s
✔ Container registryctl Started 1.0s
✔ Container harbor-core Started 1.2s
✔ Container nginx Started 1.6s
✔ Container harbor-jobservice Started 1.6s
✔ ----Harbor has been installed and started successfully.----
You can verify all running containers using the following command:
docker compose ps
Output:
NAME IMAGE COMMAND SERVICE CREATED STATUS PORTS
harbor-core goharbor/harbor-core:v2.12.3 "/harbor/entrypoint.…" core 4 seconds ago Up 2 seconds (health: starting)
harbor-db goharbor/harbor-db:v2.12.3 "/docker-entrypoint.…" postgresql 4 seconds ago Up 3 seconds (health: starting)
harbor-jobservice goharbor/harbor-jobservice:v2.12.3 "/harbor/entrypoint.…" jobservice 4 seconds ago Up 1 second (health: starting)
harbor-log goharbor/harbor-log:v2.12.3 "/bin/sh -c /usr/loc…" log 4 seconds ago Up 3 seconds (health: starting) 127.0.0.1:1514->10514/tcp
harbor-portal goharbor/harbor-portal:v2.12.3 "nginx -g 'daemon of…" portal 4 seconds ago Up 3 seconds (health: starting)
nginx goharbor/nginx-photon:v2.12.3 "nginx -g 'daemon of…" proxy 4 seconds ago Up 2 seconds (health: starting) 0.0.0.0:80->8080/tcp, [::]:80->8080/tcp
redis goharbor/redis-photon:v2.12.3 "redis-server /etc/r…" redis 4 seconds ago Up 3 seconds (health: starting)
registry goharbor/registry-photon:v2.12.3 "/home/harbor/entryp…" registry 4 seconds ago Up 3 seconds (health: starting)
registryctl goharbor/harbor-registryctl:v2.12.3 "/home/harbor/start.…" registryctl 4 seconds ago Up 3 seconds (health: starting)
Step 3 - Access Harbor Web UI
At this point, the Harbor registry is installed in the Docker container. You can now access it using the URL http://reg.example.com. You will see the Harbor login page:
Provide the default username admin and the password that you have configured via the configuration file harbor.yml, then click on the LOG IN button. You will see the Harbor dashboard on the following page.
Conclusion
By deploying Harbor, you gain control over your container image lifecycle, ensuring compliance with security policies, regulatory requirements, and best practices for containerized application development and deployment. Harbor's intuitive user interface, RESTful API, and integration capabilities enable seamless integration with your existing infrastructure, CI/CD pipelines, and identity providers, fostering collaboration and accelerating software delivery cycles. You can now try to host your own image hosting registry using Harbor on dedicated server hosting from Atlantic.Net!
### How to Make a HIPAA-Compliant Website: 2025 Guide
What Is a HIPAA-Compliant Website?
A HIPAA-compliant website protects protected health information (PHI) from unauthorized access. This includes websites that collect, store, or transfer PHI, such as patient portals or logins. This is done through security and privacy controls, such as:
Policies: Ensuring adherence to HIPAA data security and privacy rules.
Encryption: Encrypting health data being transmitted, passwords, web forms, and email servers.
SSL certificate: Ensuring the connection between the browser and the website is encrypted.
Third-party services: Using HIPAA-compliant third-party services, such as web platforms.
Business associate agreement: Ensuring relevant third parties commit to complying with HIPAA.
Secure hosting: Using a HIPAA-compliant hosting company that offers encrypted connections, secure servers, and protection against cyber-attacks.
Secure data center: Choosing a secure and audited data center.
Secure data disposal: Having a strong data disposal policy.
Backups: Backing up all PHI information in ways that ensure the data is recoverable.
Access: Limiting access to PHI to authorized staff using mechanisms like multi-factor authentication.
Safeguards: Implementing safeguards like firewalls to prevent tampering with health logs.
Any website that handles electronic patient information must adhere to the Health Insurance Portability and Accountability Act (HIPAA) standards to prevent data breaches. Websites that are only used to promote a business, such as providing contact information or hours, do not fall under HIPAA regulations. Websites that are only used to promote a business, such as providing contact information or hours, do not fall under HIPAA regulations.
The HIPAA legislation demands that any website handling electronic patient data via a web server must comply with the physical, technical, and administrative safeguards of HIPAA.
The bottom line is that you need a compliant site if you are collecting PHI (protected health information), and that means any individually identifiable healthcare information collected during the provision of healthcare.
Does Your Website Need to Comply with HIPAA?
Definition of Protected Health Information (PHI)
According to the HIPAA regulation, Protected Health Information (PHI) includes any information that can be used to identify a patient and is related to their health condition, healthcare provision, or payment for healthcare. This includes data that healthcare providers, health plans, healthcare clearinghouses, or any business associates collect or manage during the course of healthcare operations.
Under HIPAA, PHI is classified into 18 distinct identifiers, such as names, geographic data smaller than a state, elements of dates (except year) related to an individual, phone numbers, and email addresses. Additionally, any unique identifying number, characteristic, or code is considered PHI when linked with an individual's health information.
Any website or web application that collects, stores, or transmits PHI could be covered by the HIPAA regulation.
Organizations and Websites Covered by the HIPAA Regulation
It’s important to consult a legal expert to determine if your organization and its website are covered by HIPAA. Generally speaking, the following organizations are subject to the regulation:
Healthcare providers: This includes doctors, clinics, psychologists, dentists, chiropractors, nursing homes, and pharmacies that transmit any health information in electronic form in connection with a HIPAA transaction.
Health plans: This includes health insurance companies, HMOs, company health plans, and government programs that pay for healthcare, such as Medicare, Medicaid, and the military and veterans’ healthcare programs.
Healthcare clearinghouses: Entities that process nonstandard health information they receive from another entity into a standard format (or vice versa).
Business associates: Any organization or person working with or providing services to a covered entity that involves the use or disclosure of PHI. This includes entities such as billing companies, third-party consultants, IT service providers, and cloud storage providers.
HIPAA Compliant Website Video
HIPAA Compliant Website Checklist
What Is Needed to Make Your Website HIPAA Compliant?
Below you can find our 10-step checklist to make your website HIPAA compliant, which includes steps like identifying PHI, applying SSL encryption, and signing business associate agreements (BAAs).
The easiest way to achieve HIPAA compliance is to outsource this responsibility to a hosting provider that specializes in HIPAA-compliant hosting. Atlantic.Net is a leading provider that specializes in HIPAA-compliant web hosting. Atlantic.Net provides dedicated, HIPAA-compliant web servers running Apache, Nginx, or Microsoft IIS, as well as a one-click WordPress cloud solution.
Here are key HIPAA compliance concerns that should guide your efforts:
Privacy Rule & Security Rule
SSL encryption
HIPAA-compliant website platform
Business associate agreements
Healthcare focus of infrastructure
Security of data center & auditing
Disposal of sensitive data
Offsite CDP backups
Managed multi-factor authentication
Managed firewall
1. Adhere to the Privacy and Security Rules
The HIPAA Privacy Rule applies to all healthcare providers, plans, and clearinghouses, as well as to their business associates (any organizations handling health information on their behalf).
What Is the Privacy Rule?
The Privacy Rule mandates that there should be protections in place to safeguard the privacy of health information. The rule also establishes rights that patients have related to their information, such as the right to get a copy of health information and to review it, as well as to ask for corrections.
What Is the Security Rule?
The HIPAA Security Rule creates national standards to safeguard health information in electronic form, whether an organization is producing, receiving, sending, or storing it.
It requires the adoption of “reasonable and appropriate” technical, physical, and administrative safeguards, so organizations can protect the security, integrity, and confidentiality of ePHI in a HIPAA-compliant manner. The easiest way for covered entities with a website to achieve compliance with the security rule is to use HIPAA-compliant website hosting providers (see section 4 below).
2. Implement SSL Certificate Encryption (TLS)
You must implement a secure sockets layer (SSL) [TLS] encryption certificate for your website, transitioning from HTTP to the secure HTTPS protocol. This protocol encrypts all data that is in motion between the client device and the server.
Web developers should know how to install SSL certificates, but you can also work with your hosting provider on SSL-encrypting your site.
3. Use a HIPAA-Compliant Platform and HIPAA-Compliant Web Forms
To make sure your website is HIPAA-compliant, you must utilize a compliant content management platform and HIPAA-compliant web forms. No platform is inherently HIPAA-compliant, but some platforms are HIPAA-compliant when the proper procedures and safeguards are in place. For example, Atlantic.net can help you set up a HIPAA-compliant WordPress instance.
For a compliant environment, think about how people will use your site. The ways that patients can use HIPAA-compliant websites inform the types of security measures needed. The concern is specifically related to ePHI – whether your organization is creating, transmitting, receiving, or maintaining it.
If you are collecting information through forms on your site, you will need to ensure all that data is protected per HIPAA regulations. Any form collecting health data should protect the information under HIPAA regulations for safeguarding ePHI; the form must defend any identifiable health information against unauthorized access and potential data breaches. Read our list of the top HIPAA-compliant form tools here.
4. Sign a Business Associate Agreement
If you are going to work with any outside providers or businesses on any aspect of your site that involves the handling of ePHI, you need to sign a business associate agreement (BAA) with them. To meet HIPAA compliance rules, you must verify all health data that you store and that it is sent through your site securely (whether at rest or transmitting PHI in transit).
Be aware that your website developer is a direct business associate, but they will in turn have subcontractor business associates who independently perform services for them. Confirm that the website designer has BAAs with each of its third-party subcontractors – so that all applicable parties are included within HIPAA compliance upfront. Failure to identify business associates is no defense and led to a $1.5 million HHS fine in one case.
5. Select a Healthcare-Specific Infrastructure or Host
For organizations that handle individually identifiable medical information, choosing the right host for your ePHI is an important step. You need a hosting provider that is dedicated to following the Privacy Rule and Security Rule, and that has technical, administrative, and physical safeguards in place to protect PHI.
Atlantic.Net is a leading provider of HIPAA-compliant hosting services.
6. Select a Regularly Audited Secure HIPAA Data Center
Determine whether your host is secure and audited according to the appropriate HIPAA guidelines. One thing you can do to get a better sense of a host’s security stance is to look beyond those healthcare law certifications to an audit based on the insight of the American Institute for Certified Public Accountants (AICPA), Statement on Standards for Attestation Engagements 18 (SSAE 18; formerly SSAE 16), SOC 2 and SOC 3.
Atlantic.net provides its services within a HIPAA-compliant data center.
7. Ensure Proper Disposal of Sensitive Data
Proper disposal of sensitive data, including PHI, is critical to maintaining HIPAA compliance. When data is no longer needed, it must be securely destroyed to prevent unauthorized access. This involves using methods such as degaussing, shredding, or secure digital wiping for electronic media. For paper records, shredding or incineration should be used.
Ensuring that all data is irretrievably erased reduces the risk of data breaches, maintaining the confidentiality of patient information even after it is no longer in use. Additionally, organizations should have a documented data disposal policy and train employees on the correct disposal procedures to ensure consistency and compliance.
8. Perform Regular Off-Site Backups
It is best practice to have a replicated offsite copy of the daily backups of your IT infrastructure for business continuity and disaster recovery capabilities, and this is also true for HIPAA-compliant websites.
At Atlantic.net, we can back up your website data to any of our eight data center locations. Replicated offsite backups are easily retrievable and you can quickly and easily restore them when needed. Custom retention periods and backup frequency are available such as 5 minutes, 15 minutes, and hourly backups.
What About Onsite Backups?
Onsite backups using the ACP Onsite Backup solution create daily backups of your required servers and store the data geographically locally in a protected secured area. These backups are easily retrievable and if a restore is needed, the process is incredibly quick. Custom retention periods and backup frequency are available such as 5 minutes, 15 minutes, and hourly backups.
9. Implement Multi-Factor Authentication
You want a managed multi-factor authentication access system that is available through one sign-on. The system should perform diagnostics on devices to ensure their health. Infected and high-risk devices can be blocked via scanning for outdated applications and enforcing security controls.
10. Implement a Managed Firewall
A strong managed firewall will include powerful security response, routine device health checks, log monitoring, and control of network ingress and egress points. The system should include load balancing, redundancy via a secondary firewall, global blacklisting, virtual private network (VPN) connectivity, stateful filtering, monitoring, reporting, and management of router IP addresses.
Your HIPAA-Compliant Website
Many organizations work with third parties on their data systems, particularly if they are in rigorously controlled sectors such as healthcare. Contracting with outside organizations is not simply a way to push away off-focus work; it is also a way to tap expertise that is not present in-house. When you need a healthcare website, work with organizations that are HIPAA and HITECH certified, as well as SOC 2 and SOC 3 audited, so that they are prepared to meet their obligations to the Department of Health and Human Services. See our HIPAA-compliant web hosting solutions.
Get Help with Your Website to Make It HIPAA Compliant
Atlantic.Net can help make your website HIPAA-compliant with a range of certifications, such as SOC 2 and SOC 3, HIPAA, and HITECH, all with 24x7x365 support, monitoring, and world-class data center infrastructure. For faster application deployment, free IT architecture design, and assessment, call 888-618-DATA (3282), or email us at sales@atlantic.net.
### How to Deploy TimescaleDB on Ubuntu 22.04
TimescaleDB is a time-series database designed to handle time-stamped data efficiently. Time-series data is indexed, listed, or graphed in time order. It's often generated by sensors, IoT devices, or logging systems, where each data point is associated with a timestamp. TimescaleDB is a powerful solution for managing time-series data efficiently, offering scalability, performance, and flexibility for various use cases, such as IoT, financial data analysis, monitoring systems, and more.
In this tutorial, we will show you how to deploy TimescaleDB on Ubuntu 22.04.
Step 1 - Install PostgreSQL
TimescaleDB is an extension for PostgreSQL, so you need to have PostgreSQL installed.
First, add the PostgreSQL repository using the following command:
curl -fsSL https://www.postgresql.org/media/keys/ACCC4CF8.asc|gpg --dearmor -o /etc/apt/trusted.gpg.d/postgresql.gpg
sh -c 'echo "deb http://apt.postgresql.org/pub/repos/apt $(lsb_release -cs)-pgdg main" > /etc/apt/sources.list.d/pgdg.list'
Then, update the repository index and install the latest version of PostgreSQL using the following command:
apt update -y
apt install postgresql-12 -y
Next, set the PostgreSQL password using the following command:
su - postgres
psql -c "alter user postgres with password 'password'"
Next, exit from the PostgreSQL shell.
exit
Step 2 - Install TimescaleDB
Before installing TimescaleDB, you will need to install the OpenSSL library to your system.
First, download the libssl Debian package.
wget https://nz2.archive.ubuntu.com/ubuntu/pool/main/o/openssl/libssl1.1_1.1.1f-1ubuntu2.24_amd64.deb
Next, install the downloaded package file using the dpkg:
dpkg -i libssl1.1_1.1.1f-1ubuntu2.22_amd64.deb
Next, add the TimescaleDB GPG key.
apt-key adv --keyserver hkp://keyserver.ubuntu.com:80 --recv-keys 55EE6BF7698E3D58D72C0DD9ECB3980CC59E610B
Next, create a TimescaleDB APT configuration file.
nano /etc/apt/sources.list.d/timescale-ubuntu-timescaledb-ppa-jammy.list
Add the TimescaleDB repository:
deb https://ppa.launchpadcontent.net/timescale/timescaledb-ppa/ubuntu/ focal main
Save and close the file, update the repository index, and install TimescaleDB with the following command:
apt update
apt install timescaledb-postgresql-12
Next, initialize TimescaleDB on your PostgreSQL instance:
timescaledb-tune --quiet --yes
Finally, restart the PostgreSQL service to apply the changes.
systemctl restart postgresql
Step 3 - Enable TimescaleDB
To enable the TimescaleDB, edit the PostgreSQL main configuration file.
nano /etc/postgresql/12/main/postgresql.conf
Add the following line:
shared_preload_libraries = 'timescaledb'
Save and close the file, then restart the PostgreSQL service to apply the changes.
systemctl restart postgresql@12-main.service
Next, connect to the PostgreSQL shell:
su - postgres
psql
Then, create a database and enable the TimescaleDB extension:
CREATE database db1;
\c db1
CREATE EXTENSION IF NOT EXISTS timescaledb CASCADE;
Output:
WARNING:
WELCOME TO
_____ _ _ ____________
|_ _(_) | | | _ \ ___ \
| | _ _ __ ___ ___ ___ ___ __ _| | ___| | | | |_/ /
| | | | _ ` _ \ / _ \/ __|/ __/ _` | |/ _ \ | | | ___ \
| | | | | | | | | __/\__ \ (_| (_| | | __/ |/ /| |_/ /
|_| |_|_| |_| |_|\___||___/\___\__,_|_|\___|___/ \____/
Running version 1.7.5
For more information on TimescaleDB, please visit the following links:
1. Getting started: https://docs.timescale.com/getting-started
2. API reference documentation: https://docs.timescale.com/api
3. How TimescaleDB is designed: https://docs.timescale.com/introduction/architecture
Note: TimescaleDB collects anonymous reports to better understand and assist our users.
For more information and how to disable, please see our docs https://docs.timescaledb.com/using-timescaledb/telemetry.
CREATE EXTENSION
You can verify that TimescaleDB is installed and functioning correctly by connecting to your database and checking its status:
psql -U postgres -h localhost -d db1
Output:
psql (12.18 (Ubuntu 12.18-1.pgdg22.04+1))
SSL connection (protocol: TLSv1.3, cipher: TLS_AES_256_GCM_SHA384, bits: 256, compression: off)
Type "help" for help.
db1=#
Conclusion
In this guide, we explained how to deploy TimescaleDB on Ubuntu 22.04. Users opt for TimescaleDB for several compelling reasons. Its optimized architecture is specifically tailored for time-series data ensures superior performance and scalability compared to traditional relational databases. TimescaleDB's ability to handle large volumes of data while maintaining fast query response times makes it an ideal choice for time-series workloads. You can deploy TimescaleDB on dedicated server hosting from Atlantic.Net!
### How to Install CouchBase Database on Ubuntu 22.04
Apache Couchbase is an open-source, distributed, NoSQL document-oriented database management system. It's designed to store, manage, and retrieve data in flexible JSON-like documents. Couchbase is suitable for a wide range of use cases, from web and mobile applications to real-time analytics and caching layers. Its combination of performance, scalability, flexibility, and robust features makes it a compelling choice for organizations looking to modernize their data infrastructure.
In this tutorial, we will show you how to install the CouchBase database on Ubuntu 22.04.
Note: Couchbase recommends a server with 4 Cores
Step 1 - Add CouchBase Repository
CouchBase is not included in the Ubuntu default repository by default. Therefore, you will need to add the CouchBase repository to your server.
First, install the required dependencies using the following command:
apt install apt-transport-https ca-certificates software-properties-common -y
Next, download the CouchBase repository package.
curl -O https://packages.couchbase.com/releases/couchbase-release/couchbase-release-1.0-noarch.deb
Next, install the downloaded package file.
dpkg -i couchbase-release-1.0-noarch.deb
Finally, update the repository index using the following command:
apt update
Step 2 - Install CouchBase
You can install the CouchBase server package using the following command:
apt-get install couchbase-server-community
Once the CouchBase is installed, start the CouchBase service and enable it to start at system reboot.
systemctl start couchbase-server
systemctl enable couchbase-server
You can check the status of CouchBase using the following command:
systemctl status couchbase-server
Output:
● couchbase-server.service - Couchbase Server
Loaded: loaded (/lib/systemd/system/couchbase-server.service; enabled; vendor preset: enabled)
Active: active (running) since Sat 2024-04-06 03:15:30 UTC; 1min 41s ago
Docs: https://docs.couchbase.com
Main PID: 12511 (beam.smp)
Tasks: 149 (limit: 4579)
Memory: 224.3M
CPU: 14.346s
CGroup: /system.slice/couchbase-server.service
Step 3 - Access CouchBase Web Interface
At this point, the CouchBase server is installed and listens on port 8091. You can check it using the following command:
ss -antpl | grep 8091
Output:
LISTEN 0 128 0.0.0.0:8091 0.0.0.0:* users:(("beam.smp",pid=12640,fd=53))
Now, open your web browser and access the CouchBase web interface using the URL http://your-IP-address:8091. You will see the CouchBase dashboard on the following screen.
Click on Setup New Cluster. You will see the following screen:
Define your cluster name, admin username, and password, and click on Next. You will see the following screen.
Accept the term and click on Finish with Defaults. You will see the Couchbase dashboard on the following screen.
Conclusion
In this tutorial, we showed you how to install CouchBase on Ubuntu 22.04. With Couchbase, you gain access to features such as seamless scalability, high availability, flexible data modeling, and integrated caching, empowering you to handle diverse workloads and meet the evolving demands of modern applications. Try to deploy CouchBase on dedicated server hosting from Atlantic.Net!
### Container Hosting
Containers have revolutionized the delivery of cloud-enabled applications. The technology brings multiple benefits to businesses looking to deliver top-tier applications within a compliant, yet agile hosting platform. One of the fastest-growing solutions offered by managed service providers is containerized hosting based on either Docker or Kubernetes clusters.
What Is Container Hosting?
Many people think that containerized applications are a new technology, but in reality, the computer theory of containerized programs and processes started back in the early 1970s. The precursor to the technology was chroot process isolation introduced in Unix V7. It wasn't until 2004, when Solaris created boundary separation with Solaris containers, that containers took a form like those we use today; these were the very first business-ready, manageable containers running inside a host.
In 2013, containers went mainstream when Docker offered the first solution with complete control over the container ecosystem and the concept of container management tools. Today, Kubernetes and microservices architecture are leading the pack, and businesses are frequently choosing container hosting platforms above traditional cloud hosting platforms.
Specifically, container hosting refers to a service offered by Managed Service Providers that uses containerization technology to host and manage applications, typically in the same cloud infrastructure. Unlike virtual machines (VMs), containers share the host operating system's kernel, making them more efficient and faster to start up.
Container hosting allows you to run multiple applications on a single server instance, creating a highly efficient hosting ecosystem and reducing running costs. Plus, thanks to dependable scaling and management tools, managing containers is much simpler these days. They are lightweight, scalable, portable, and very fast to deploy!
What Is a Container Host?
A container host is often referred to as the container engine or runtime environment. A container platform typically consists of a collection of hosts that can span multiple environments and share resources on demand. Containerization is a very efficient way to host applications, and as a result, container hosts can manage many containers at once, much more than a virtualization hypervisor like VMware would be able to manage with like-for-like resources.
The container host is responsible for managing the local resources such as CPU, disk, memory, block storage, and networking. It also manages the lifecycle of the containers, making decisions about when to start, stop, scale up, scale down, or restart containerized applications. It is the host operating system that isolates the underlying container operating system from each other, creating a secure and reliable abstraction layer.
Container hosts are typically clustered together, which essentially means each host can communicate and share resources automatically. The runtime engine creates an abstraction layer that utilizes each host dynamically in a logical resource pool. The engine sees the available resources and uses them no matter the server location or host on which they are physically available.
There are lots of different engines available for your Container Hosts, including:
Docker: The most popular and user-friendly for building, running, and managing containers.
Kubernetes: Not a runtime itself, but orchestrates container deployments across hosts.
Rocket (Rkt): Lightweight, secure alternative to Docker, good for efficiency.
ContainerD: Lightweight runtime focused on managing container lifecycle for Linux-based systems.
Windows Containers (HyperV): This is a Windows alternative with two options: lightweight containers or full virtualized containers (or virtual machines) with HyperV.
RunC: Core container runtime engine used by Docker and others, following OCI standards.
What Is the Difference between Kubernetes and Docker?
Docker and Kubernetes are both synonymous with containerization, but it's important to understand that while both are important tools, they each serve a different purpose. The easiest way to demonstrate the difference is to remember that Docker builds and runs containers, and Kubernetes manages how and where those containers run. Although they are different, Docker and Kubernetes complement each other and work great together for building, delivering, and managing containerized applications.
Google originally developed Kubernetes but has since made it open-source. Kubernetes uses an API to control how and where containers are run. Kubernetes deploys, scales, and manages Docker containers in a node cluster. K8s features service discovery, load balancing, and health checks, being responsible for the entire lifecycle management of the container.
On the other hand, Docker is used to build container images, typically using Dockerfiles that define the code to execute, the software libraries needed, and any environmental variables required. a Docker image can be run locally or on a larger Docker engine, and you have simple management tools to run Docker, such as stop, start, restart, console, and logging.
Here is a key comparison between the two techs:
Docker:
Focus on Individual Containers
Docker builds and runs containers
Docker operates directly on the hosting platforms
Relies on docker host networking configuration
Kubernetes:
Manages Containerized applications at scale
Orchestrates deployments, networking, and scaling
Separate control plane managing the cluster (API access, controllers)
Provides service abstractions for container communication within the cluster
Do I Need Different Types of Hosting for Different Types of Containers?
No, containers are agnostic, meaning that they can run on any server, provided it supports the Docker engine or another runtime such as containers. This could be managed Docker hosting services or standalone Linux or Windows deployments hosting Docker.
Simple applications with relatively light resource requirements will run perfectly on shared hosting platforms or on a bespoke docker hosting platform running on a virtual private server (VPS hosting). However, complex applications with high resource demands would benefit from a dedicated server, or maybe a Kubernetes orchestration cloud platform.
For applications with fluctuating resource needs, cloud hosting with auto-scaling features can be ideal. This allows you to scale your container deployment up or down based on traffic demands. Consider your own hosting provider for containers' security needs. Highly sensitive applications might require dedicated hosting or a private cloud environment for enhanced security controls compared to shared hosting.
How Do I Choose the Best Container Hosting?
Deciding where to run docker containers is an important business decision to make. For simplicity look for a cloud platform provider with an intuitive control panel to manage docker containers and a good choice of docker hosting solutions.
When making this decision you may want to consider the following:
Resource Requirements
Evaluate your containerized application's CPU, memory, and storage requirements. Cloud providers typically offer various instance types with different resource configurations. Choose one that aligns with your application's demands. Take time to understand your traffic demands. Are you a seasonal business that needs specific scaling at certain times of the year?
Cost
Pricing is really important when choosing your preferred Docker hosting platform. There is an abundance of providers that will host Docker, but each offers different feature sets for a different price tag. Expect options for the pricing model, such as pay-as-you-go and reserved instance discounts, and make sure you opt for a suitable service plan.
You need container resources that fit your business needs without breaking the bank. Typically, you would expect to pay significantly less for a self-managed VPS to host Docker than you would for a multi-region Kubernetes cluster.
It's possible to overpay for Docker containerization because it's easy to overprovision the resources your application needs. Likewise, it's also possible to under-spec your docker containerization requirements and then spend the next days and weeks retrospectively allocating more resources at a further cost. So get your capacity planning estimates correct before you invest in containerization.
Performance
Containers are fast! Not only are they fast to deploy and fast when in use, but they also can be quickly scaled on demand. However, remember that application bottlenecks may occur if you do not take the time to architect your software application to container best practices. Health checks should be in place to alert and monitor if a resource is over or under-utilized; if this is not done correctly, it's easy for the application to crash or slow down, creating P1 and P2 incidents.
Required Features
The features offered by the cloud platform will make or break your choice. Do you need hosting in various global data centers? Do you require docker support, an elastic container service, automated resource management, or a private container registry? Look for a hosting provider that offers a built-in container registry that allows you to push and pull files and manage your private Docker images securely within the same platform.
If you're deploying complex applications with multiple containers, consider hosting solutions with integrated container orchestration platforms like Kubernetes to simplify management and automation tasks like deployment, automatic scaling up, and health checks.
Security
Ensure the hosting environment provides proper network isolation between your containers and other users or applications to reduce security risks and potential conflicts. Look for hosting options that offer container image scanning for vulnerabilities to help identify and address potential security issues before deployment.
The provider itself must be a reputable web hosting provider. Viewing their certifications and partnerships will help you understand their security posture. Providers with certifications such as HIPAA, PCI-DSS, SOC2, and HITECH will undertake additional auditing that helps guarantee customer security.
Ease of Use
Docker and Kubernetes are not easy technologies for new starters, but the learning curve is manageable if they provide an easy-to-use hosting platform. The best docker hosting providers will offer Linux or Windows hosting with root access. Docker apps with custom health checks should be available at multiple locations. Expect a reliable underlying infrastructure and a variety of hosting plans.
Where Can I Deploy My Docker Containers?
Atlantic.Net has been providing IT services for decades, and this year, we are celebrating our 30th year in business. The Atlantic.Net Cloud Platform (ACP) is designed from the ground up to provide the best hosting experience possible, with the option for additional managed services should they be required.
We have 8 state-of-the-art data center locations with global routing throughout the United States, Canada, Europe, and Asia. We feature a simple yet powerful, easy docker installation using our one-click installation button. You can deploy a powerful Docker host in less than 30 seconds with our custom applications.
Want to go it alone? No problem. You can build your own Docker host of various Linux or Windows operating systems. You can also opt for various dedicated server hosting plans at many of our edge locations.
With Atlantic.Net, you’ll experience unparalleled reliability for your container workloads. The highly redundant infrastructure, automated backups, and proactive monitoring ensure high availability and maximum uptime, granting you peace of mind and uninterrupted service. We even offer a 100% Uptime SLA.
The ACP cloud only uses SSD storage, and our servers feature either AMD Epyc or Intel Xeon Processors. Atlantic.Net’s team of friendly experts is at your service 24/7. Whether you require assistance with setup, troubleshooting, or optimizing the performance of cloud infrastructure, we are available to lend a helping hand and guide you toward success.
### How to Install Apache CouchDB on Ubuntu 22.04
Apache CouchDB is an open-source NoSQL database management system that stores data in a schema-less JSON format, allowing for flexible and dynamic data modeling. Apache CouchDB offers organizations a robust and flexible NoSQL database solution with features such as distributed architecture, document-oriented storage, offline-first capabilities, RESTful API, and fault tolerance. By leveraging CouchDB, organizations can build scalable, resilient, and responsive applications that meet the demands of modern data-driven environments.
In this tutorial, we will show you how to install Apache CouchDB on Ubuntu 22.04.
Step 1 - Install Apache CouchDB
To install Apache CouchDB on Ubuntu 22.04, you'll need to add the CouchDB repository to your system.
CouchDB provides a GPG key that is used to sign the repository packages. You can download and install this key using the following command:
curl https://couchdb.apache.org/repo/keys.asc | gpg --dearmor | sudo tee /usr/share/keyrings/couchdb-archive-keyring.gpg >/dev/null
Next, add the CouchDB repository to your system's software sources list. You can create a new file for the CouchDB repository in the /etc/apt/sources.list.d/ directory:
echo "deb [signed-by=/usr/share/keyrings/couchdb-archive-keyring.gpg] https://apache.jfrog.io/artifactory/couchdb-deb/ $(lsb_release -cs) main" | tee /etc/apt/sources.list.d/couchdb.list
After adding the repository, update the package lists to ensure that Ubuntu recognizes the newly added CouchDB repository:
apt-get update -y
Once the repository is added and the package lists are updated, you can install CouchDB using the apt package manager:
apt-get install couchdb -y
You will be asked to install CouchDB in standalone or clustered mode.
Select Standalone and press the Enter key. You will be asked to set the Erlang value:
Set your desired value and press the Enter key. You will be asked to set a bind address:
Set your bind address and press the Enter key. You will be asked to set admin password.
Define your password and press the Enter key to complete the installation.
Step 2 - Configure Apache CouchDB
By default, Apache CouchDB listens on localhost on port 5984. To access CouchDB from an external system, you will need to edit the CouchDB configuration file to define a band address.
nano /opt/couchdb/etc/local.ini
Change the following lines:
[chttpd]
port = 5984
bind_address = 0.0.0.0
Save and close the file then start the CouchDB service.
systemctl start couchdb
You can check the status of CouchDB using the following command:
systemctl status couchdb
Output:
● couchdb.service - Apache CouchDB
Loaded: loaded (/lib/systemd/system/couchdb.service; enabled; vendor preset: enabled)
Active: active (running) since Sat 2024-04-06 03:24:56 UTC; 48s ago
Main PID: 14158 (beam.smp)
Tasks: 28 (limit: 4579)
Memory: 43.0M
CPU: 5.853s
CGroup: /system.slice/couchdb.service
├─14158 /opt/couchdb/bin/../erts-12.3.2.15/bin/beam.smp -SDio 16 -Bd -- -root /opt/couchdb/bin/.. -progname couchdb -- -home /opt/couchdb -- -boot /opt/co>
├─14171 /opt/couchdb/bin/../erts-12.3.2.15/bin/epmd -daemon
└─14174 erl_child_setup 65536
Step 3 - Verifying the Installation
To verify the installation of CouchDB, use the curl command:
curl http://127.0.0.1:5984/
Output:
{"couchdb":"Welcome","version":"3.3.3","git_sha":"40afbcfc7","uuid":"7f98ad06b2538ed9b4d6843bd6b5c07d","features":["access-ready","partitioned","pluggable-storage-engines","reshard","scheduler"],"vendor":{"name":"The Apache Software Foundation"}}
Conclusion
Following the steps outlined in this guide, users can quickly set up CouchDB on their Ubuntu systems and begin leveraging its powerful data storage, retrieval, and synchronization features. Apache CouchDB is suitable for many use cases, from web and mobile applications to data synchronization hubs and offline-first solutions. You can now use CouchDB as a database backend on dedicated server hosting from Atlantic.Net!
### How to Deploy Akaunting - An Opensource WaveApps & FreshBooks Alternative on Ubuntu 22.04
Akaunting is an open-source accounting software for small and medium-sized businesses (SMBs) and freelancers. It provides a comprehensive suite of features to manage finances, including invoicing, expense tracking, banking, and reporting. It helps organizations manage their finances effectively, streamline processes, and make informed business decisions.
In this tutorial, we will show you how to install Akaunting on Ubuntu 22.04.
Step 1 - Install LAMP Server
Akaunting requires a web server with PHP and a database. You can install the LAMP (Linux, Apache, MySQL/MariaDB, PHP) stack using the following commands:
apt install apache2 mariadb-server php libapache2-mod-php php-imagick php-common php-mysql php-gd php-bcmath php-curl php-zip php-xml php-mbstring php-bz2 php-intl unzip -y
Once the LAMP server is installed, start and enable both Apache and MariaDB services:
systemctl start apache2 mariadb
systemctl enable apache2 mariadb
Step 2 - Create a Database
Log in to the MySQL/MariaDB shell as the root user:
mysql -u root -p
Then, create a database and user for Akaunting:
create database akaunting;
create user 'akaunting'@'localhost' identified by 'yourpassword';
Next, grant all the privileges to the Akaunting database.
grant all privileges on akaunting.* to 'akaunting'@'localhost';
Finally, flush the privileges and exit from the MariaDB shell.
flush privileges;
exit;
Step 3 - Download Akaunting
Navigate to the Akaunting website and download the latest version of Akaunting.
wget -O Akaunting.zip https://akaunting.com/download.php?version=latest
Once the download is complete, extract the Akaunting files to the web server's document root directory.
unzip Akaunting.zip -d /var/www/akaunting/
Set the correct permissions for the Akaunting files and directories:
chown www-data:www-data /var/www/akaunting/ -R
chmod -R 755 /var/www/akaunting
Step 4 - Configure Apache
Create a new virtual host configuration file for Akaunting:
nano /etc/apache2/sites-available/akaunting.conf
Add the following lines:
ServerName akaunting.example.com
DocumentRoot /var/www/akaunting/
DirectoryIndex index.php
Options +FollowSymLinks
AllowOverride All
Require all granted
ErrorLog ${APACHE_LOG_DIR}/akaunting.error.log
CustomLog ${APACHE_LOG_DIR}/akaunting.access.log combined
Enable the Akaunting site and rewrite module.
a2ensite akaunting.conf
a2enmod rewrite
Finally, restart the Apache service:
systemctl restart apache2
Step 5 - Perform Akaunting Web-based Installation
Open your web browser and navigate to the URL http://akaunting.example.com. You will see the Akaunting language selection page:
Select your language and click on Next. You will see the database configuration page:
Define your database settings and click on Next. You will see the admin user creation page:
Provide your admin user, password, and email and click on Next. You will see the Akaunting login page:
Enter your admin username and password and click on Login. You will see the following page:
Provide all required information and click on Save. You will see the currency page:
Add your new currency and click on Next. You will see the following page:
Click on Skip this. You will see the Akaunting dashboard on the following page.
Conclusion
This tutorial explained how to install Akaunting on Ubuntu 22.04 with Apache. By deploying Akaunting on Ubuntu, you gain control over your financial data while benefiting from the security, stability, and flexibility of the Ubuntu platform. Whether you're tracking expenses, managing invoices, or generating financial reports, Akaunting provides the tools to streamline your accounting processes and make informed decisions. You can now host your own Akaunting software on a dedicated server hosting by Atlantic.Net!
### What Is MFA as a Service?
MFA as a Service, or Multi-Factor Authentication as a Service, is a security identification platform various cloud-based applications use to secure private access to a particular service.
MFA enhances the protection of online accounts and systems by requiring multiple forms of verification from the user. MFA provides user identities with an extra layer of security beyond the traditional username and password combination.
By requiring that user accounts have multiple authentication factors, it becomes significantly more difficult for attackers to gain unauthorized access to a user account, even if they can obtain one of the user identities' authentication factors.
Below we'll learn what MFA is, how you can implement MFA in your environment, and why MFA as a service will make your life much easier.
What Is MFA and Why Is It Important?
Typically, multi-factor authentication involves three main factors.
Something you know: This factor requires knowledge of a secret piece of information that only you, the authorized user, should know, such as a password, PIN, or an answer to a security question.
Something you have: This factor involves possessing a physical item (such as hardware tokens) that verifies your identity, such as a security token, smart card, or mobile device. Typically, the ‘thing’ generates a unique code that changes frequently, such as an RSA code. The codes are used as part of the authentication process.
Something you are: This factor involves a unique physical characteristic or biometric trait of the user, such as a fingerprint, iris scan, voice recognition, or facial recognition. Biometrics are increasingly used in MFA to provide a highly secure and convenient form of identification.
MFA solutions can be complex and resource-heavy but are an excellent choice for delivering security functionalities over the cloud. Businesses can choose to go it alone and implement a private MFA solution; however, these are expensive to license, complicated to install, and difficult to manage.
A hugely popular alternative is the MFA solution as a service. Managed multi-factor authentication (MFA) platforms give businesses secure access to a comprehensive, scalable, and configurable multi-factor authentication solution. It enables organizations to enhance security without the need for extensive technical expertise.
Benefits of Outsourcing MFA-as-a-Service
Outsourcing MFA-as-a-Service offers several advantages that can improve an organization’s efficiency, cost-effectiveness, and security posture.
Here are some of the critical benefits of MFA as a service:
Ease of Implementation:
MFA-as-a-service providers manage the complex deployment process of access management solutions. Organizations can quickly implement an MFA solution without needing extensive in-house IT expertise and readily available staff resources. A managed MFA service reduces the complexity and time required to implement an effective MFA solution.
Reduce Costs:
A cloud-based multi-factor authentication service operates on a subscription basis, making it an operational expenditure (Opex) rather than a capital expense (Capex). Opex eliminates the need for hefty upfront investment in hardware and software licensing while reducing ongoing maintenance costs. Further cost savings can be introduced with 1-3 year subscription discounts.
Scalability:
MFA-as-a-service can scale up or down according to the business's needs. As an organization grows, additional users can effortlessly be added to the multi-factor authentication system. Conversely, during quieter periods, the service can be scaled down. Scalability reduces the licensing headache, making rapid development possible in the cloud, unlike monolithic data centers.
Continuous Updates and Innovation:
The service provider handles updates and upgrades to the MFA platform, including all the security hardening that takes place behind the scenes, such as encryption keys and server agents.
Ensuring that the MFA system always uses the latest technology and security protocols is essential in the rapidly evolving security industry, helping your business keep pace with evolving cybersecurity threats.
Better Compliance Management:
Some MFA-as-a-service providers excel at supporting compliance requirements, such as HIPAA, HITECH, PCI, and GDPR.
All forms of compliance require numerous layers of security controls, and MFA is a technology that spans every state of compliance.
Therefore, organizations adhering to data protection laws, authentication policies, and regulations will benefit from MFA as a service.
Enhanced Security:
Most importantly, outsourcing MFA as a service will foster an enhanced security posture for business accounts. Specialist providers have the resources and expertise to provide cutting-edge, multi-layered authentication solutions and protocols that most businesses need help implementing independently.
24/7 Support:
The best MFA providers offer round-the-clock support to address issues or queries quickly. Access to a continuous support model ensures minimal disruption to business operations if a problem occurs.
What Are MFA Solutions?
Multi-Factor Authentication (MFA) solutions are security measures designed to protect a corporate network against unauthorized access. These solutions are based on the premise that two-factor authentication, combining multiple factors of secure authentication, significantly enhances security, making it much more difficult for unauthorized individuals to gain access.
Did you know that conditional access policies are implemented in many very different ways:
On-Premises Advanced Authentication Services: These involve setting up servers and software in-house. They typically require significant investment in hardware, software, and IT resources, but they offer a high level of control.
Cloud-Based and MFA as a Service: These are hosted by a third-party provider and delivered over the Internet. They require minimal upfront investment in hardware and software tokens and are easy to scale, but they necessitate a certain level of trust in the provider’s security measures.
Hybrid MFA Solutions: These combine on-premises and cloud-based solutions, allowing an organization to leverage the benefits of both models.
Regardless of the form they take, MFA solutions play a crucial role in a comprehensive cybersecurity strategy, providing an extra layer of defense that helps protect sensitive data and systems from cyber threats.
Why Do You Need an MFA Solution?
MFA is a proven and reliable technology. Considering how your life has changed in the last decade concerning proving your identity, it’s fair to say that MFA is everywhere.
Here are just a few areas to consider:
Enhanced Security: The primary reason for implementing a multi-factor authentication solution is to bolster security. With MFA as a Service, you add multiple layers of your identity management and access management solution and verification, which enhance the security of your systems – whether it’s for online account security, accessing VPNs, or using cloud services. This way, even if a password is compromised, the additional authentication factors provide an extra line of defense.
Regulatory Compliance: In industries such as banking, where data sensitivity is high, regulations often necessitate certain levels of data security. An MFA solution can help these organizations meet regulatory requirements, such as online banking, where MFA as a Service is crucial for safeguarding customer information and fulfilling legal obligations.
Protection Against Phishing and Other Attacks: MFA is particularly effective against common cyber threats such as phishing attacks. Even if a user is tricked into revealing their password for a mobile application, an attacker would still need to bypass the MFA system, making unauthorized access to a registered device much more challenging.
Increasing Trust and Confidence: For businesses, having robust security measures like MFA can increase the confidence of customers, partners, and stakeholders. MFA as a Service is a commitment to protecting sensitive data, for example, by securing access to Identity and Access Management (IAM) systems, which could significantly enhance your stakeholders’ trust.
Adapting to Remote Work: The shift towards remote work has expanded the digital perimeter of businesses, making them more vulnerable to attacks. MFA provides an essential layer of security that can protect remote workers regardless of location, such as securing virtual meetings and collaboration tools or granting remote desktop access.
Reducing the Impact of Password Reuse: Many users reuse passwords across multiple online accounts. If one account, such as a password manager, is compromised, it could also lead to others being accessed. MFA as a Service reduces the risk associated with password reuse by necessitating additional authentication steps, offering an extra layer of protection.
By integrating multi-factor authentication (MFA) solutions into workforce applications and other platforms, businesses can significantly enhance their security posture and the overall safety of business users and their digital assets.
3 Key Questions to Ask Multi-Factor Authentication (MFA) Providers
When preparing to outsource your MFA requirements to a managed services provider, asking the right questions is crucial to ensure they can meet your organization’s unique needs.
Here are three key questions Atlantic.Net recommends you ask. They will give you insight into how the business provider operates and help you determine whether they meet your standards.
What Kind of Authentication Factors Do You Support?
MFA is most effective when it offers flexibility to the end-users. Ask the provider about the types of user authentication methods they support – these could include biometrics, mobile apps, SMS, physical hardware tokens, or others. The broader the range, the more effective security controls and better the solution will cater to diverse user preferences and situations
Each authentication method has its pros and cons, and its effectiveness can vary depending on the specific context and application.
Here’s a brief overview:
Knowledge-Based Authentication: This includes passwords, PINs, or security questions. They are the most common form of authentication but can also be vulnerable if not used correctly (such as using weak passwords or quickly guessable security answers).
Possession-Based Authentication: This method requires users to possess a specific device or item, like a mobile phone (authentication apps) or a hardware token (Duo security). Authentication codes can be delivered via SMS or email or generated by an app (like Google Authenticator) or physical hardware tokens. Identity management features also come into play in third-party solutions such as single sign-on OAUTH, Ping Identity, IBM Security Verify, or Cisco Secure Access.A physical hardware token can provide a high level of security but can also be inconvenient if the user loses the device or token. Configuring passwordless authentication single sign-on solutions is also possible using tokens and authenticator apps.
Biometrics: This includes fingerprints, facial recognition, voice recognition, and other biometric data. Biometric authentication can provide high security and convenience, as they are unique to each user and always “with” the user. However, they require specialized hardware (such as a fingerprint scanner or a device with a camera), and there can be privacy concerns around the storage and use of biometric data.Biometric factors have become much more popular in recent years because of mobile phones. It’s much easier to send mobile push notifications, SMS messages, or request a fingerprint scan from an authenticator app. Making each login attempt easier for each user’s access, and when combined with contextual factors, push notification single sign-on becomes highly secure.
Location-Based Authentication: This method allows access based on the user’s location. This is often used in conjunction with other strategies for added security, such as IP reputation, to track suspicious user activity.
Behavior-Based Authentication: includes keystroke dynamics, mouse movement patterns, and other behavior patterns. While these methods can provide an additional layer of security, they can also be more complex to implement and use.
Risk-Based Authentication: This is a dynamic method of verifying a user’s identity, providing additional layers of security when needed. This approach considers the risk associated with a particular user action and then adjusts the level of authentication required based on that perceived risk. For instance, a user attempting to access a system from a familiar location might only need a password. If you use PayPal, you will have probably witnessed this type of adaptive authentication.
How Do You Handle User Enrollment and Recovery Processes?
A smooth user experience is critical for the success of an MFA implementation. Ask about the provider’s processes for using authentication policies enrolling new users, using authentication requirements, and handling account recovery in case a user loses physical access to their account.
A good MFA service provider will balance security with usability, making these processes as smooth as possible.
User Enrollment: The user enrollment process is the first interaction a user has with the MFA system, and a positive initial experience can set the tone for subsequent interactions. This process should be simple, intuitive, and secure. Ask the provider if they offer step-by-step guides, user-friendly interfaces, and options to choose from multiple authentication factors according to the user’s preference. Understanding how the provider deals with bulk enrollments can be helpful, especially for larger organizations.
Account Recovery: In instances where a user loses access to an authentication factor (for example, if they lose their phone where the authentication app is installed), the account recovery process comes into play. The process should be secure enough to prevent unauthorized account access but also user-friendly to minimize downtime. It would help if you inquired about the methods available for account recovery. This could be via email, secondary phone numbers, security questions, or even biometrics. Importantly, ask about the safeguards in place to verify the user’s identity during the recovery process, as this stage can be an attractive target for attackers.
How Do You Ensure Compliance with Relevant Regulations?
In specific industries, there are stringent regulations regarding data privacy and security. It’s essential to ask how the provider ensures compliance with these regulations, particularly around storing and handling user authentication and data breaches. This is especially crucial if your business operates in regulated industries like healthcare or finance.
Your chosen multi-factor authentication (MFA) provider should be ready to support you in this area. Here are some points to consider when posing this question:
Data Protection Laws: Your provider should be able to assure you that they comply with relevant data protection laws, like the General Data Protection Regulation (GDPR) in the EU or the California Consumer Privacy Act (CCPA) in the U.S. Ask about their data handling and storage practices, including where data is stored and how it’s protected.
Industry-Specific Regulations: If you’re in an industry like healthcare or finance, there will be additional regulations you need to comply with, like HIPAA or GLBA. Ask the provider if they have experience with these regulations and if their service has features designed to help customers maintain compliance.
Certifications and Audits: Learn about the provider’s security certifications and audits. Certifications like ISO 27001 can indicate a provider’s commitment to security, while regular third-party audits can provide assurances that the provider’s security practices are up to standard.
Encryption and Security Measures: The provider should use strong encryption for all data and provide robust security measures, like secure development practices and regular vulnerability testing.
Data Privacy and Control: Ask how they handle data privacy, what personal data they collect, who has access to it, and how it can be controlled or deleted. In the context of GDPR and similar laws, the provider should have clear policies around data control.
The provider should be able to give clear, detailed answers to all of these questions. Their ability to support your compliance efforts can significantly affect your risk level and the overall success of your MFA implementation.
Self-Service Capabilities to Gain Access
Having self-service options will streamline the entire multi-factor authentication process. Self-service features should allow users to efficiently enroll themselves, including choosing the type of second factor used for authentication methods.
Users should have the ability to recover or reset their own authentication factors quickly if they forget a password, lose a hardware token, or have a new phone number or device. This key feature not only saves time for the user but also reduces the burden on IT support.
Some identity providers offer a self-service portal that enables users to easily access authorization and switch between authentication methods. For example, if a user loses their mobile device, they should be able to access security and quickly change to another form of secure authentication.
In much larger organizations, it might be beneficial to have a self-service feature where users can manage access to specific data or systems. The ability for users to update their account information is a game changer for MFA at scale.
The Atlantic.Net Managed Multi-Factor Authentication (MFA) Service
“Secure access to your digital assets and protect your business from cyber threats with Atlantic.Net’s Managed Multi-Factor Authentication (MFA) services. This service provides an additional layer of security by verifying users’ identities before granting access to your local network or server environment. It’s not just about knowing the proper login credentials; it’s also about having the correct device.
Atlantic.Net’s MFA service integrates with most on-premise and cloud mobile apps, offering remote access and a range of verification and authentication methods, from SMS passcodes to phone callbacks and time-based one-time passcodes. It even provides bypass codes for single-event access or in case of lost devices.
The service doesn’t stop at identity verification. It also checks the health of each device, ensuring the presence of vital security controls and up-to-date software. This way, high-risk or infected machines can be easily blocked, reducing your vulnerabilities and minimizing access to your confidential data.
Don’t wait for a security breach to happen. Take control of your digital security today with Atlantic.Net’s Managed MFA services. Contact us now to learn more!
### Kubernetes In a HIPAA Compliant Environment: Key Considerations
What Is Kubernetes and How Is It Used in Healthcare Applications?
Kubernetes is an open-source platform designed to automate deploying, scaling, and operating application containers. It groups containers that make up an application into logical units for easy management and discovery. Kubernetes provides tools to deploy applications, scale them as needed, roll out new features, or roll them back to previous versions. It is also designed to work across different environments, including on-premise data centers, public clouds, and hybrid clouds.
Kubernetes can be used for deploying and managing applications that handle sensitive patient data. It supports healthcare applications by providing scalable solutions that support large volumes of data and traffic, ensuring that these applications are always available when needed. Kubernetes also facilitates compliance with healthcare regulations by enabling organizations to preserve privacy. It supports security features that protect patient data while maintaining the flexibility to adapt to changing healthcare requirements.
HIPAA Requirements for Relevant Kubernetes
To meet HIPAA compliance, Kubernetes deployments in healthcare must ensure the confidentiality, integrity, and availability of Protected Health Information (PHI).
Ensuring Patient Data Availability
Kubernetes clusters must be configured to withstand failures and continue to operate, providing access to PHI when needed. For high availability, Kubernetes uses replication controllers and services that continuously monitor the state of applications and automatically replace failed instances. Proper configuration and regular testing of failover mechanisms help ensure that PHI remains accessible during a system failure.
Access Controls
Kubernetes must be configured to ensure that PHI is only accessible to authorized individuals and systems. Kubernetes offers role-based access control (RBAC) mechanisms that allow fine-grained control over who can access what resources within the cluster. Administrators can limit access to only what is necessary for each user. They should regularly review and update access policies to reflect changes in personnel or job roles.
Data Encryption
Kubernetes supports encryption at rest by integrating with storage providers that offer encryption capabilities. For data in transit, Kubernetes can enforce SSL/TLS encryption for data moving between different parts of the application, ensuring that PHI is encrypted as it traverses the network. Key management practices must be used to safely store encryption keys.
Audit Trails
Kubernetes provides logging mechanisms that can capture detailed information about every action taken in the cluster, including who performed the action, what resources were accessed, and when it occurred. To meet HIPAA requirements, logs should be stored securely and kept for a required retention period. Regular review of audit logs can help quickly identify and address security issues.
Best Practices and Considerations for Kubernetes in HIPAA-Compliant Environments
Here are some things to consider when working with healthcare data in Kubernetes.
1. Implement Network Policies for Pod Communication
By default, pods in a Kubernetes cluster can communicate with each other without restrictions. Malicious entities could potentially exploit this open communication channel. Implementing network policies allows administrators to explicitly define how pods communicate within the cluster, isolating sensitive workloads and minimizing the risk of unauthorized access.
Administrators should identify and categorize the different types of traffic within the cluster. This involves mapping out which Kubernetes services need to communicate with each other and establishing clear rules that allow only necessary communications. A frontend application pod may need access to a backend database pod, but it should not have access to other backend services.
2. Implement a Backup and Disaster Recovery Strategy
Backup and disaster recovery strategies involve regularly backing up both the data stored within the cluster and the cluster's state, including configurations and secrets. In case of a failure or data loss, these backups can be used to restore operations quickly, minimizing downtime.
A comprehensive strategy should include automated backup processes that capture data at regular intervals and store backups in a secure, off-site location. The disaster recovery plan should be tested regularly to ensure it can be executed effectively in an emergency. This could include drills simulating failure scenarios, including data corruption and cyber attacks.
3. Ensure Data Integrity During Transfer and Storage
Kubernetes deployments must employ mechanisms that verify data has not been altered or corrupted. For data in transit, SSL/TLS encryption provides a secure channel that also allows for integrity checks. For data at rest, storage solutions with built-in checksums or application-level integrity checks can help ensure data remains unaltered from its original state.
Kubernetes environments should leverage etcd's built-in mechanisms for maintaining the integrity of its stored data, which is important for preserving the cluster's state. Implementing regular integrity audits and employing tools that automatically detect and report anomalies can further enhance data integrity.
4. Continuously Monitor Kubernetes Clusters
Monitoring should cover various aspects of the cluster, including performance metrics, resource utilization, network traffic, and security events. This allows administrators to gain insights into the state of their deployments, identify potential issues before they escalate, and ensure that the environment adheres to best practices for security and compliance.
Integrating monitoring tools with alerting systems enables real-time notifications of critical events, allowing for prompt responses to potential threats or performance issues. This proactive approach to cluster management helps maintain high availability and secure operations.
5. Configure Alerts for Suspicious Activities
Keeping track of suspicious behavior involves setting up automated notifications for events that could indicate a security breach or an attempt to access sensitive data without authorization. These indicators include multiple failed login attempts, unexpected changes in configurations, and unusual data access patterns.
By defining clear criteria for what constitutes suspicious activity and using monitoring tools to detect such events, administrators can quickly respond to potential threats. Alert systems should be integrated with incident response workflows to ensure that alerts are quickly received and acted upon. This might involve triggering automated response actions to mitigate risks.
6. Implement Vulnerability Scanning and Remediation
Regular vulnerability scanning and remediation are critical components of maintaining a secure Kubernetes environment. This process involves using automated tools to scan the components of the Kubernetes cluster, including the container images, host systems, and applications running within the cluster, for known vulnerabilities.
Once vulnerabilities are identified, remediation measures, such as applying patches, updating software, or reconfiguring settings, must be taken to mitigate the risk they pose. Effective vulnerability management also includes regular reviews of the components used within the cluster to ensure they are up-to-date. A routine for scanning and updating components can help.
7. Conduct Compliance Audits and Reviews
Regular compliance audits should assess the effectiveness of the security controls in place, verify compliance with access controls, encryption standards, and data protection policies, and identify areas for improvement. Reviews might include examining the processes for responding to incidents and breaches to ensure they are adequate and align with regulatory expectations.
Engaging third-party auditors can provide an objective assessment of the compliance posture and help uncover issues that internal reviews might overlook. Findings from these audits should inform continuous improvement efforts, ensuring the Kubernetes environment remains secure and compliant.
Conclusion
Implementing best practices for Kubernetes in HIPAA-compliant environments requires a multi-faceted approach that encompasses network security, data protection, continuous monitoring, and regular compliance reviews.
By addressing these critical areas, healthcare organizations can leverage Kubernetes to support their applications while ensuring the confidentiality, integrity, and availability of PHI. As the healthcare landscape continues to evolve, staying informed and adapting to new challenges will be key to maintaining a secure and compliant Kubernetes environment.
Author Bio: Gilad David Maayan
Gilad David Maayan is a technology writer who has worked with over 150 technology companies including SAP, Imperva, Samsung NEXT, NetApp, and Check Point, producing technical and thought leadership content that elucidates technical solutions for developers and IT leadership. Today he heads Agile SEO, the leading marketing agency in the technology industry.
LinkedIn: Linkedin
### How to Install Angular CLI on Ubuntu 24.04
Angular is a popular open-source web application framework primarily maintained by Google and a community of developers. It is used for building dynamic, single-page web applications (SPAs) and progressive web applications (PWAs). Angular is written in TypeScript, a superset of JavaScript, and offers a comprehensive set of features for front-end development.
This tutorial will show you how to install Angular on Ubuntu 24.04.
Step 1 - Install Nodejs
Before starting, you will need to install Nodejs on your server. Follow the below steps to install the latest stable version of Nodejs.
First, create a directory to store the Nodejs GPG key.
mkdir -p /etc/apt/keyrings
Download the Nodejs GPG key to the above directory.
curl -fsSL https://deb.nodesource.com/gpgkey/nodesource-repo.gpg.key | sudo gpg --dearmor -o /etc/apt/keyrings/nodesource.gpg
Add the Nodejs repository to the APT source file.
echo "deb [signed-by=/etc/apt/keyrings/nodesource.gpg] https://deb.nodesource.com/node_22.x nodistro main" | sudo tee /etc/apt/sources.list.d/nodesource.list
Update the repository index.
apt update
Finally, install the Nodejs using the following command:
apt install nodejs
After the installation, you can verify the Nodejs version using the following command:
node --version
Output:
v22.15.1
Step 2 - Install Angular CLI
Angular CLI is a powerful tool provided by the Angular team to streamline the development process of Angular applications. It offers a set of commands and tools that automate repetitive tasks and provide a structured workflow for creating, building, testing, and deploying Angular applications.
First, update NPM with the latest version.
npm install npm@latest -g
Next, install Angular CLI using the NPM command:
npm install -g @angular/cli
After the installation, you can verify the Angular CLI version using the following command:
ng version
Output:
_ _ ____ _ ___
/ \ _ __ __ _ _ _| | __ _ _ __ / ___| | |_ _|
/ △ \ | '_ \ / _` | | | | |/ _` | '__| | | | | | |
/ ___ \| | | | (_| | |_| | | (_| | | | |___| |___ | |
/_/ \_\_| |_|\__, |\__,_|_|\__,_|_| \____|_____|___|
|___/
Angular CLI: 19.2.12
Node: 22.15.1
Package Manager: npm 11.4.0
OS: linux x64
Angular:
...
Package Version
------------------------------------------------------
@angular-devkit/architect 0.1902.12 (cli-only)
@angular-devkit/core 19.2.12 (cli-only)
@angular-devkit/schematics 19.2.12 (cli-only)
@schematics/angular 19.2.12 (cli-only)
Step 3 - Create an Application Using Angular CLI
You can easily use the ng command to create a new Angular application via the command line.
ng new angular-app
Select the CSS and press Enter to create a new Angular app.
? Which stylesheet format would you like to use? (Use arrow keys)
❯ CSS [ https://developer.mozilla.org/docs/Web/CSS ]
Sass (SCSS) [ https://sass-lang.com/documentation/syntax#scss ]
Sass (Indented) [ https://sass-lang.com/documentation/syntax#the-indented-syntax ]
Less [ http://lesscss.org ]
? Do you want to enable Server-Side Rendering (SSR) and Static Site Generation (SSG/Prerendering)? Yes
Next, change the directory to your application and start Angular locally.
cd angular-app
ng serve
Press the CTRL+C to stop the application.
Step 4 - Access Angular Application
To make the Angular application accessible from the outside network, you will need to start it using the --host parameter.
ng serve --host 0.0.0.0 --port 3001
This will start the Angular application on all network interfaces on port 3001, as shown below:
Watch mode enabled. Watching for file changes...
➜ Local: http://localhost:3001/
➜ Network: http://209.23.9.25:3001/
➜ press h + enter to show help
You can now access your Angular application using the URL http://your-server-ip:3001 from your web browser.
Conclusion
You can now easily install and use Angular on the Ubuntu 24.04 server. Overall, Angular is a comprehensive framework that empowers developers to build modern, responsive, and scalable web applications with ease. Its rich feature set, strong community support, and backing from Google make it a popular choice for web development projects of all sizes. Try Angular CLI on dedicated server hosting from Atlantic.Net!
### How to Install Odoo 18 on Ubuntu 24.04
Odoo is a suite of open-source business applications covering various needs such as CRM (Customer Relationship Management), e-commerce, accounting, inventory management, and project management. It is designed to be customizable and modular, allowing businesses to tailor it to their specific requirements.
Odoo is built on a modular architecture, meaning users can start with the basic modules and add more functionalities as needed. It offers both an open-source and free-to-use community edition and an enterprise edition with additional features and support, which requires a subscription fee.
In this tutorial, we will show you how to install Odoo 18 on Ubuntu 24.04.
Step 1 - Install Required Dependencies
Odoo is a Python-based software. Therefore, you will need to install Python and some additional dependencies on your server. You can install all of them using the following command:
apt-get install -y python3-pip python3-dev python3-venv libxml2-dev libxslt1-dev zlib1g-dev libsasl2-dev libldap2-dev build-essential libssl-dev libffi-dev libmysqlclient-dev libjpeg-dev libpq-dev libjpeg8-dev liblcms2-dev libblas-dev libatlas-base-dev -y
Next, install the NPM package manager.
apt-get install -y npm
Then, install other dependencies using NPM.
npm install -g less less-plugin-clean-css
Next, install the node-less package.
apt-get install -y node-less
Next, download wkhtmltopdf package and install it using the following command:
wget https://github.com/wkhtmltopdf/packaging/releases/download/0.12.6-1/wkhtmltox_0.12.6-1.bionic_amd64.deb
dpkg -i wkhtmltox_0.12.6-1.bionic_amd64.deb
apt install -f
Step 2 - Install PostgreSQL
Odoo uses PostgreSQL as a database backend. You can install it using the following command:
apt-get install postgresql -y
After the successful installation, verify the PostgreSQL status using the following command:
systemctl status postgresql
Output:
● postgresql.service - PostgreSQL RDBMS
Loaded: loaded (/lib/systemd/system/postgresql.service; enabled; vendor preset: enabled)
Active: active (exited) since Sat 2025-05-12 04:13:39 UTC; 9s ago
Process: 16418 ExecStart=/bin/true (code=exited, status=0/SUCCESS)
Main PID: 16418 (code=exited, status=0/SUCCESS)
CPU: 1ms
May 12 04:13:39 ubuntu24 systemd[1]: Starting PostgreSQL RDBMS...
May 12 04:13:39 ubuntu24 systemd[1]: Finished PostgreSQL RDBMS.
Next, create a user for Odoo using the following command:
useradd -m -U -r -d /opt/odoo18 -s /bin/bash odoo18
Also, create the same user for PostgreSQL.
su - postgres -c "createuser -s odoo18"
Step 3 - Install and Configure Odoo
First, log in as an Odoo user and download the Odoo 18 using the following command:
su - odoo18
git clone https://www.github.com/odoo/odoo --depth 1 --branch 18.0 /opt/odoo18/odoo18
Next, create a Python virtual environment for Odoo.
cd /opt/odoo18
python3 -m venv odoo18-venv
Next, activate the virtual environment.
source odoo18-venv/bin/activate
Next, update the pip to the latest version.
pip install --upgrade pip
Next, install the Weel package.
pip3 install wheel
Next, install additional Python dependencies.
pip3 install -r odoo18/requirements.txt
Finally, deactivate from the Python virtual environment.
deactivate
Also, log out of the Odoo user.
exit
Next, create a directory to store Odoo addons and give it proper ownership.
mkdir /opt/odoo18/odoo18-custom-addons
chown -R odoo18:odoo18 /opt/odoo18/odoo18-custom-addons
Next, create a log directory and file for Odoo and set proper permissions.
mkdir -p /var/log/odoo18
touch /var/log/odoo18/odoo18.log
chown -R odoo18:odoo18 /var/log/odoo18
Next, create an Odoo configuration file.
nano /etc/odoo18.conf
Add the following lines:
[options]
admin_passwd = master-password
db_host = False
db_port = False
db_user = odoo18
db_password = False
xmlrpc_port = 8069
logfile = /var/log/odoo18/odoo18.log
addons_path = /opt/odoo18/odoo18/addons,/opt/odoo18/odoo18-custom-addons
Step 4 - Create a Systemd File for Odoo
You will also need to create a system file to manage the Odoo service.
nano /etc/systemd/system/odoo18.service
Add the following lines:
[Unit]
Description=odoo18
After=network.target postgresql@14-main.service
[Service]
Type=simple
SyslogIdentifier=odoo18
PermissionsStartOnly=true
User=odoo18
Group=odoo18
ExecStart=/opt/odoo18/odoo18-venv/bin/python3 /opt/odoo18/odoo18/odoo-bin -c /etc/odoo18.conf
StandardOutput=journal+console
[Install]
WantedBy=multi-user.target
Save the file, then reload the systemd daemon.
systemctl daemon-reload
Now, start and enable the Odoo service.
systemctl start odoo18
systemctl enable odoo18
You can now check the Odoo status using the following command:
systemctl status odoo18
Output:
● odoo18.service - odoo18
Loaded: loaded (/etc/systemd/system/odoo18.service; disabled; preset: enabled)
Active: active (running) since Mon 2025-05-12 05:32:01 UTC; 3s ago
Main PID: 32045 (python3)
Tasks: 4 (limit: 4609)
Memory: 90.4M (peak: 90.8M)
CPU: 1.575s
CGroup: /system.slice/odoo18.service
└─32045 /opt/odoo18/odoo18-venv/bin/python3 /opt/odoo18/odoo18/odoo-bin -c /etc/odoo18.conf
May 12 05:32:01 ubuntu systemd[1]: Started odoo18.service - odoo18.
Step 5 - Access Odoo Web Interface
At this point, Odoo has started listening on port 8069. You can now access it using the URL http://your-server-ip:8069. You will see the following screen.
Provide your master password and Odoo database and click on Create Database. You will see the Odoo 18 login page.
Provide your admin username and password and click on Log in. The Odoo dashboard will appear on the following screen.
Conclusion
Odoo offers a powerful platform for managing various aspects of your business, from CRM to accounting to project management and beyond. By following the steps outlined in this guide, you can successfully set up Odoo 18 on your Ubuntu 24.04 system. Now try to deploy Odoo 18 on dedicated server hosting from Atlantic.Net!
### How to Install osTicket on Ubuntu 24.04
osTicket is an open-source customer support ticket system that helps businesses efficiently manage customer inquiries, complaints, and other support-related issues. It supports multiple communication channels, including email piping (converting emails into tickets), web forms, and API integration, allowing businesses to manage customer inquiries from various sources. OsTicket is a flexible and customizable solution for businesses seeking an open-source ticketing system to streamline their customer support operations.
In this tutorial, we will show you how to install osTicket on Ubuntu 24.04.
Step 1 - Install Apache and PHP
osTicket is a PHP-based application, so you will need to install Apache, PHP, and other PHP extensions on your server. You can install them using the following command:
apt install apache2 php php-cli php-common php-imap php-redis php-snmp php-xml php-zip php-mbstring php-curl php-mysqli php-gd php-intl php-apcu libapache2-mod-php unzip -y
After the installation, start and enable the Apache service.
systemctl start apache2
systemctl enable apache2
Step 2 - Install and Configure MariaDB Database
osTicket uses MariaDB as a database backend, so you will need to install and configure the MariaDB server.
First, install the MariaDB database server using the following command:
apt install mariadb-server -y
Next, connect to the MariaDB shell.
mysql
After connecting to the MariaDB, create a database and user for osTicket.
CREATE DATABASE osticket;
GRANT ALL PRIVILEGES ON osticket.* TO osticket@localhost IDENTIFIED BY "password";
Next, flush the privileges and exit from the MariaDB.
FLUSH PRIVILEGES;
EXIT;
Step 3 - Install osTicket
First, change the directory to Apache web root and download the latest osTicket version inside that directory.
cd /var/www/html
curl -s https://api.github.com/repos/osTicket/osTicket/releases/latest | grep browser_download_url | cut -d '"' -f 4 | wget -i -
Next, unzip the downloaded file.
unzip osTicket*.zip -d osTicket
Next, copy the osTicket sample configuration file.
cp /var/www/html/osTicket/upload/include/ost-sampleconfig.php /var/www/html/osTicket/upload/include/ost-config.php
Then, set the necessary permissions and ownership to the osTicket directory.
chown -R www-data:www-data /var/www/html/osTicket/
chmod -R 775 /var/www/html/osTicket/
Step 4 - Configure Apache for osTicket
Next, create an Apache virtual host configuration file for osTicket.
nano /etc/apache2/sites-available/osticket.conf
Add the following configuration:
ServerName osticket.example.com
DocumentRoot /var/www/html/osTicket/upload
AllowOverride All
ErrorLog ${APACHE_LOG_DIR}/error.log
CustomLog ${APACHE_LOG_DIR}/access.log combined
Save and close the file, activate the Apache virtual host, and enable the Apache rewrite module.
a2enmod rewrite
a2ensite osticket.conf
Finally, restart the Apache service to apply the changes.
systemctl reload apache2
Step 5 - Access osTicket Web UI
Now, open your web browser and access the osTicket using the URL http://osticket.example.com. You will see the osTicket prerequisites page.
Click on Continue. You will see the osTicket configuration page.
Provide your helpdesk name, URL, admin username, password, email, and database credentials, then click on Install Now. Once the osTicket is installed, you will see the following page.
Click on Your Staff Control Panel. You will see the osTicket login page.
Provide your admin username and password and click on Log In. You will see the osTicket system settings page.
Modify the default settings as needed and click on the Dashboard tab. The osTicket dashboard will appear on the following page.
Finally, remove the osTicket installation directory using the following command:
rm -rf /var/www/html/osTicket/upload/setup/
Conclusion
osTicket provides businesses with a robust and customizable solution for managing customer support tickets efficiently. Using osTicket, organizations can centralize their support operations, streamline ticket management processes, and improve customer satisfaction. You can now test the osTicket application on dedicated server hosting from Atlantic.Net!
### How To Install Home Assistant Core on Ubuntu 24.04
Home Assistant is an open-source home automation platform that allows users to control and automate various devices and services. It serves as a central hub for integrating smart devices, sensors, and other technologies, providing a unified interface for managing them. Home Assistant empowers users to create a smarter, more efficient, and more personalized home environment by bringing together disparate devices and technologies into a unified ecosystem.
This tutorial will show you how to install Home Assistant on Ubuntu 24.04.
Step 1 - Install Required Dependencies
Home Assistant Core requires some dependencies to be installed. You can install them with the following command:
apt install -y tmux bluez libffi-dev libssl-dev libjpeg-dev zlib1g-dev autoconf build-essential libopenjp2-7 libturbojpeg0-dev tzdata ffmpeg liblapack3 liblapack-dev libatlas-base-dev software-properties-common
Once all the dependencies are installed, you can proceed to the next step.
Step 2 - Install Python3.13
You will also need to install the latest version of Python to your server.
First, add the Python PPA using the following command:
add-apt-repository ppa:deadsnakes/ppa
Next, install Python3.13 with additional packages.
apt install python3.13 python3.13-dev python3.13-venv -y
Step 3 - Install Home Assistant
First, create a user account named "homeassistant" and set its default shell to "/bin/bash".
useradd -rm homeassistant
chsh -s /bin/bash homeassistant
Next, add a homeassistant user to the dialout group.
usermod -aG dialout homeassistant
Next, create a directory for your Home Assistant installation and set proper ownership.
mkdir /srv/homeassistant
chown homeassistant:homeassistant /srv/homeassistant
Next, log in as a home assistant user and navigate to the home assistant directory.
sudo -u homeassistant -H -s
cd /srv/homeassistant
Next, create a new virtual environment:
python3.13 -m venv .
Activate the virtual environment:
source bin/activate
Next, install the wheel package.
python3.13 -m pip install wheel
Output:
Collecting wheel
Downloading wheel-0.43.0-py3-none-any.whl.metadata (2.2 kB)
Downloading wheel-0.43.0-py3-none-any.whl (65 kB)
━━━━━━━━━━━━━━━━━━━━━━━━━━━━━━━━━━━━━━━━ 65.8/65.8 kB 1.1 MB/s eta 0:00:00
Installing collected packages: wheel
Successfully installed wheel-0.43.0
Finally, install the Hone Assistant package.
pip3.13 install homeassistant
Step 4 - Initialize Home Assistant
First, launch tmux session to run the Home Assistant.
tmux
Next, run the hass command to initialize the Home Assistant.
hass
This will install all the required basic dependencies on your server. Once all the dependencies are installed, open your web browser and access the Home Assistant web interface using the URL http://your-server-ip:8123. You will see the Home Assistant welcome page.
Click on CREATE MY SMART HOME. You will see the create user page:
Define your username and password and click on CREATE ACCOUNT. You will see the Home Location page.
Set your location and click on NEXT. You will see the following page:
Enable your desired settings and click on NEXT. You will see the following page.
Click on FINISH. You will see the HOME Assistant dashboard page.
Conclusion
In this tutorial, you learned how to install Home Assistant on Ubuntu 24.04. Home Assistant provides users with a powerful and flexible platform for creating a smart home environment. Through its open-source nature and extensive community support, Home Assistant offers various integrations and customization options, allowing users to tailor their home automation setup to their specific needs and preferences. Try to deploy Home Assistant on dedicated server hosting from Atlantic.Net!
### How to Install PHP 8.4 on Ubuntu 24.04
PHP (Hypertext Preprocessor) is a widely used open-source scripting language that is particularly well-suited for web development and can be embedded into HTML. With the release of PHP 8.4, developers gain access to new features, performance enhancements, and bug fixes that can significantly improve their web applications. However, upgrading PHP on your Ubuntu 24.04 server requires careful attention to ensure a smooth transition.
In this guide, we'll walk you through the process of installing PHP 8.4 on Ubuntu 24.04.
Step 1 - Add PHP Repository
To install PHP 8.4 on Ubuntu 24.04, you'll need to add a repository containing PHP 8.4 packages and install PHP along with any necessary extensions.
First, install all the necessary dependencies:
apt install curl gpg gnupg2 software-properties-common ca-certificates apt-transport-https lsb-release -y
Ondřej Surý maintains a repository with updated PHP versions for Ubuntu. Add this repository to your system:
add-apt-repository ppa:ondrej/php
Update the package index.
apt update -y
Step 2 - Install PHP 8.4
Now, you can install the PHP 8.4 using the following command:
apt -y install php8.4
After successful installation, you can verify the PHP version using the following command:
php --version
Output:
PHP 8.4.7 (cli) (built: May 9 2025 06:54:31) (NTS)
Copyright (c) The PHP Group
Zend Engine v4.4.7, Copyright (c) Zend Technologies
with Zend OPcache v8.4.7, Copyright (c), by Zend Technologies
Step 3 - Install Additional PHP Extensions
Depending on your requirements, you may need to install additional PHP extensions. You can install some common PHP extensions using the following command:
apt install php8.4-{cli,pdo,mysql,zip,gd,mbstring,curl,xml,bcmath,common}
You can also install PHP Composer using the following command:
php -r "copy('https://getcomposer.org/installer', 'composer-setup.php');"
php composer-setup.php --install-dir=/usr/local/bin --filename=composer
Output:
All settings correct for using Composer
Downloading...
Composer (version 2.8.8) successfully installed to: /root/composer.phar
Use it: php composer.phar
Next, verify the Composer version using the following command:
composer --version
Output:
Composer version 2.8.8 2025-04-04 16:56:46
PHP version 8.4.7 (/usr/bin/php8.4)
Run the "diagnose" command to get more detailed diagnostics output.
Step 4 - Verify PHP 8.4 Installation
To verify that PHP is installed and configured correctly on your Ubuntu 24.04 system, you can create a simple PHP script and then execute it through your web server or the command line.
Create a test.php file.
nano test.php
Add the following code:
Save and close the file.
Now, you have a test.php file containing a PHP script that will display information about your PHP installation.
You can execute the test.php script directly from the command line. Open a terminal and navigate to the directory where test.php is located. Then, run the following command:
php test.php;echo
You will see the following output:
Hello World!
Conclusion
By following the instructions provided in this tutorial, you've gained the knowledge and confidence to upgrade your PHP version safely and efficiently. With PHP 8.4, you'll benefit from enhanced performance, new features, and bug fixes that can help optimize your web applications and improve overall server security. You can now upgrade your PHP version on dedicated server hosting from Atlantic.Net!
### How to Install phpBB on Ubuntu 22.04
phpBB, which stands for "PHP Bulletin Board," is an open-source internet forum software written in the PHP programming language. It allows users to create and manage online discussion forums where participants can post messages, engage in discussions, share files, and interact with each other. It provides a platform for communities to communicate, collaborate, and exchange information on various topics of interest.
In this tutorial, we will show you how to install phpBB forum on Ubuntu 22.04.
Step 1 - Install LAMP Server
Before starting, you will need to install a LAMP server on your server. You can install it using the following command.
apt install apache2 mariadb-server php libapache2-mod-php php-gd php-curl openssl php-imagick php-intl php-json php-ldap php-common php-mbstring php-mysql php-imap php-sqlite3 php-net-ftp php-zip unzip php-pgsql php-ssh2 php-xml wget unzip -y
Once the LAMP server is installed, start and enable Apache and MariaDB services.
systemctl start apache2
systemctl start mariadb
systemctl enable apache2
systemctl enable mariadb
Step 2 - Create a Database for phpBB
phpBB uses MariaDB as a database backend, so you will need to create a database and user for phpBB.
First, connect to the MariaDB server console:
mysql
Next, create a database and user:
CREATE DATABASE phpdb;
GRANT ALL ON phpdb.* to 'phpbb'@'localhost' IDENTIFIED BY 'password';
Next, flush the privileges and exit from the MariaDB shell.
FLUSH PRIVILEGES;
EXIT;
Step 3 - Install phpBB Ubuntu 22.04
First, visit the phpBB download page, copy the URL of the latest phpBB, and download it using the following command.
wget https://download.phpbb.com/pub/release/3.3/3.3.7/phpBB-3.3.7.zip
Once the download is completed, unzip the downloaded file using the following command.
unzip phpBB-3.3.7.zip
Next, move the extracted directory to the Apache web root directory.
mv phpBB3 /var/www/html/phpbb
Next, set proper permissions and ownership.
chown -R www-data:www-data /var/www/html/phpbb
chmod -R 775 /var/www/html/phpbb
Step 4 - Create an Apache Virtual Host for phpBB
Next, you will need to create an Apache virtual host configuration file to host phpBB on the web.
nano /etc/apache2/sites-available/phpbb.conf
Add the following configuration:
ServerAdmin admin@example.com
DocumentRoot /var/www/html/phpbb
ServerName phpbb.example.com
Options FollowSymlinks
AllowOverride All
Require all granted
ErrorLog ${APACHE_LOG_DIR}/phpbb_error.log
CustomLog ${APACHE_LOG_DIR}/phpbb_access.log combined
Save the file, then activate the Apache virtual host and rewrite the module using the following command:
a2ensite phpbb
a2enmod rewrite
Finally, restart the Apache service to apply the changes.
systemctl restart apache2
Step 5 - Access phpBB Web Interface
Now, open your web browser and access the phpBB web interface using the URL http://phpbb.example.com. You will see the phpBB overview page:
Click on the INSTALL tab. You will see the Installation Welcome page.
Click on Install. You will see the administration configuration page:
Provide your admin username and password and click on Submit. You will see the database configuration page.
Provide your database user, password, and database, and click on Submit. You will see the server configuration page:
Provide all the required details and click on Submit. You will see the email configuration page:
Provide all necessary configurations and click on Submit. You will see the board configuration page:
Provide your board name and description and click on Submit. You will see the following page:
Click on Take me to the ACP. You will be redirected to the phpBB dashboard.
Conclusion
phpBB offers powerful online communities and discussion platforms to end users. With its user-friendly interface and extensive feature set, phpBB empowers users to create, customize, and manage forums tailored to their needs and preferences. You can now test phpBB on dedicated server hosting from Atlantic.Net!
### How to Install TYPO3 CMS on Ubuntu 22.04
TYPO3 CMS is an open-source "Content Management System" used for building and managing websites, web applications, and digital experiences. It is written in PHP and is known for its flexibility, scalability, and extensive feature set. TYPO3 CMS is particularly popular among enterprises, large organizations, and institutions due to its robustness and capability to handle complex web projects.
In this tutorial, we will explain how to install TYPO3 CMS on Ubuntu 22.04.
Step 1 - Install Apache, MariaDB, and PHP
First, install Apache, MariaDB, PHP and other PHP dependencies using the following command:
apt install apache2 mariadb-server php libapache2-mod-php php-cli php-common php-gmp php-curl php-mysql php-json php-intl php-mbstring php-xmlrpc php-gd php-xml php-zip php-imap
Next, edit the PHP configuration file.
nano /etc/php/8.1/apache2/php.ini
Change the following setting value as shown below:
max_execution_time = 240
memory_limit = 256M
upload_max_filesize = 64M
post_max_size = 64M
max_input_vars = 1500
date.timezone = UTC
Save and close the file, then restart the Apache service to apply the changes.
systemctl restart apache2
Step 2 - Configure MariaDB Database
TYPO3 stores data in the MariaDB database; therefore, you will need to create a database and user for TYPO3 CMS.
First, connect to the MariaDB shell.
mysql
Once you are connected, create a database and user for TYPO3.
CREATE DATABASE typo3db;
CREATE USER 'typo3user'@'localhost' IDENTIFIED BY 'password';
Next, grant all privileges to the TYPO3 database.
GRANT ALL PRIVILEGES ON typo3db.* TO 'typo3user'@'localhost';
Next, flush the privileges and exit from the MariaDB shell.
FLUSH PRIVILEGES;
EXIT;
Step 3 - Install TYPO3 CMS
First, download the latest version of TYPO3 CMS using the following command.
wget --content-disposition https://get.typo3.org/11.5.12
Next, extract the downloaded file inside the Apache root directory.
tar -xvzf typo3_src-11.5.12.tar.gz -C /var/www/html
Next, change the directory to Apache web root and rename the extracted directory.
cd /var/www/html
mv typo3_src-11.5.12 typo3
Next, create a file to install TYPO3 CMS.
touch /var/www/html/typo3/FIRST_INSTALL
Next, give the necessary permission and ownership to the TYPO3 CMS directory.
chown -R www-data:www-data typo3
chmod -R 775 typo3
Step 4 - Configure Apache for TYPO3 CMS
First, create an Apache virtual host configuration file for TYPO3 CMS.
nano /etc/apache2/sites-available/typo3.conf
Add the following content:
ServerAdmin admin@your_domain.com
DocumentRoot /var/www/html/typo3
ServerName typo3.example.com
Options FollowSymlinks
AllowOverride All
Require all granted
ErrorLog ${APACHE_LOG_DIR}/typo3_error.log
CustomLog ${APACHE_LOG_DIR}/typo3_access.log combined
Save and close the file, then activate the Apache virtual host and enable the Apache rewrite module using the following command:
a2ensite typo3
a2enmod rewrite
Finally, restart the Apache service to apply the changes.
systemctl restart apache2
Step 5 - Access TYPO3 CMS Web UI
Now, open your web browser and access the TYPO3 CMS web installation using the URL http://typo3.example.com. You will see the following page:
Click on No problem detected, continue with installation. You will see the database configuration page:
Define your database username and password and click on Continue. You will see the database selection page:
Select your existing database and click on Continue. You will see the administartor configuration page:
Define your admin username, password, and sitename, and click on Continue. Once the installation has been completed, you will see the following page:
Select Take me straight to backend and click on Open the TYPO3 Backend. You will see the TYPO3 login page:
Provide your admin username and password and click on Login. You will see the TYPO3 CMS dashboard:
Conclusion
Using TYPO3 CM, users can create powerful and versatile websites and digital experiences. With its robust feature set, flexibility, and scalability, TYPO3 CMS is a leading choice for enterprises, organizations, and developers looking to build sophisticated web projects. You can install TYPO3 CMS on dedicated server hosting from Atlantic.Net!
### How to Install Kubernetes Using K3s On Ubuntu 24.04
K3s is a lightweight, easy-to-install distribution of Kubernetes designed for resource-constrained environments, such as edge computing, IoT devices, and development/testing environments. It is developed by Rancher Labs, an organization known for its Kubernetes management platform.
In this tutorial, we will show you how to install Kubernetes using K3s on Ubuntu 24.04.
Step 1 - Install K3s
First, install the curl package for a smooth K3s installation.
apt install curl -y
Next, use the curl command to download and run the K3s installation script.
curl -sfL https://get.k3s.io | sh -
Once K3s has been installed, you can verify the K3s service using the following command.
systemctl status k3s
Output:
● k3s.service - Lightweight Kubernetes
Loaded: loaded (/etc/systemd/system/k3s.service; enabled; preset: enabled)
Active: active (running) since Tue 2025-05-27 07:04:59 UTC; 2s ago
Docs: https://k3s.io
Process: 23962 ExecStartPre=/bin/sh -xc ! /usr/bin/systemctl is-enabled --quiet nm-cloud-setup.service 2>/dev/null (code=exited, status=0/SUCCESS)
Process: 23964 ExecStartPre=/sbin/modprobe br_netfilter (code=exited, status=0/SUCCESS)
Process: 23968 ExecStartPre=/sbin/modprobe overlay (code=exited, status=0/SUCCESS)
Main PID: 23975 (k3s-server)
Tasks: 20
Memory: 464.0M (peak: 465.0M)
CPU: 11.019s
CGroup: /system.slice/k3s.service
├─23975 "/usr/local/bin/k3s server"
└─23996 "containerd "
Step 2 - Access Kubernetes Cluster
You will need to configure kubectl to access and interact with the Kubernetes cluster via the command line.
First, create a directory to store kubectl configuration.
mkdir ~/.kube
Next, copy the Kubernetes configuration file inside the .kube directory.
cp /etc/rancher/k3s/k3s.yaml ~/.kube/config
chmod 600 ~/.kube/config
Next, expose the path of the kubectl configuration file.
export KUBECONFIG=~/.kube/config
Next, verify the Kubernetes cluster nodes using the kubectl command.
kubectl get nodes
Output.
NAME STATUS ROLES AGE VERSION
ubuntu24 Ready control-plane,master 51s v1.32.5+k3s1
You can also see the Kubernetes cluster information using the following command.
kubectl cluster-info
Output:
Kubernetes control plane is running at https://127.0.0.1:6443
CoreDNS is running at https://127.0.0.1:6443/api/v1/namespaces/kube-system/services/kube-dns:dns/proxy
Metrics-server is running at https://127.0.0.1:6443/api/v1/namespaces/kube-system/services/https:metrics-server:https/proxy
Step 3 - Create an Nginx Deployment
To validate the Kubernetes installation, we will deploy a Nginx-based application and expose it via NodePort.
First, create an Nginx deployment using the following command.
kubectl create deployment nginx-app --image nginx --replicas 2
Next, verify the Nginx deployment using the following command.
kubectl get deployment nginx-app
Output.
NAME READY UP-TO-DATE AVAILABLE AGE
nginx-app 2/2 2 2 10s
Next, verify the Nginx pods using the following command.
kubectl get pods
Output:
NAME READY STATUS RESTARTS AGE
nginx-app-5777b5f95-lhcpp 1/1 Running 0 22s
nginx-app-5777b5f95-2j6ld 1/1 Running 0 22s
Next, expose the nginx-app deployment using NodePort.
kubectl expose deployment nginx-app --type NodePort --port 80
Next, get the IP address of nginx-app using the following command:
kubectl get svc nginx-app
Output:
NAME TYPE CLUSTER-IP EXTERNAL-IP PORT(S) AGE
nginx-app NodePort 10.43.162.54 80:31588/TCP 5s
Now, use the IP address from the above output and run the curl command to access the nginx-app.
curl http://10.43.162.54
If everything is fine, you will see the following output:
Welcome to nginx!
Welcome to nginx!
If you see this page, the nginx web server is successfully installed and
working. Further configuration is required.
For online documentation and support please refer to
nginx.org.
Commercial support is available at
nginx.com.
Save and close the file when you are finished.
Step 3 - Create a Virtual Host Configuration File
Next, you will need to edit the Caddy configuration file to host the new website. You can edit it with the following command:
nano /etc/caddy/Caddyfile
Remove all lines and add the following lines:
test.example.com:80 {
root * /var/www/example.com
file_server
encode gzip
log {
output file /var/log/caddy/example.access.log
}
@static {
file
path *.ico *.css *.js *.gif *.jpg *.jpeg *.png *.svg *.woff *.pdf *.webp
}
header @static Cache-Control max-age=5184000
}
Save and close the file when you are finished. Next, validate the Caddy configuration file:
caddy validate --adapter caddyfile --config /etc/caddy/Caddyfile
You should see the following output:
2021/11/17 09:59:04.997 INFO using provided configuration {"config_file": "/etc/caddy/Caddyfile", "config_adapter": "caddyfile"}
2021/11/17 09:59:05.000 WARN input is not formatted with 'caddy fmt' {"adapter": "caddyfile", "file": "/etc/caddy/Caddyfile", "line": 27}
2021/11/17 09:59:05.000 INFO http server is listening only on the HTTPS port but has no TLS connection policies; adding one to enable TLS {"server_name": "srv0", "https_port": 443}
2021/11/17 09:59:05.001 INFO http enabling automatic HTTP->HTTPS redirects {"server_name": "srv0"}
2021/11/17 09:59:05.001 INFO tls.cache.maintenance started background certificate maintenance {"cache": "0xc00057a8c0"}
2021/11/17 09:59:05.001 INFO tls.cache.maintenance stopped background certificate maintenance {"cache": "0xc00057a8c0"}
Valid configuration
Next, restart the Caddy service to apply the changes:
systemctl restart caddy
You can also check the Caddy service using the following command:
systemctl status caddy
You will get the following output:
● caddy.service - Caddy
Loaded: loaded (/usr/lib/systemd/system/caddy.service; disabled; vendor preset: disabled)
Active: active (running) since Wed 2021-11-17 10:00:23 UTC; 4s ago
Docs: https://caddyserver.com/docs/
Main PID: 20077 (caddy)
Tasks: 6 (limit: 11411)
Memory: 24.9M
CGroup: /system.slice/caddy.service
└─20077 /usr/bin/caddy run --environ --config /etc/caddy/Caddyfile
Nov 17 10:00:23 rockylinux systemd[1]: Started Caddy.
Nov 17 10:00:23 rockylinux caddy[20077]: {"level":"info","ts":1637143223.8054335,"logger":"tls.cache.maintenance","msg":"started background c>
Nov 17 10:00:23 rockylinux caddy[20077]: {"level":"info","ts":1637143223.8054764,"logger":"tls","msg":"cleaning storage unit","description":">
Nov 17 10:00:23 rockylinux caddy[20077]: {"level":"info","ts":1637143223.8055048,"logger":"tls","msg":"finished cleaning storage units"}
Nov 17 10:00:23 rockylinux caddy[20077]: {"level":"info","ts":1637143223.8060036,"logger":"tls.obtain","msg":"lock acquired","identifier":"ex>
Nov 17 10:00:24 rockylinux caddy[20077]: {"level":"error","ts":1637143224.0880945,"logger":"tls.obtain","msg":"could not get certificate from>
Nov 17 10:00:24 rockylinux caddy[20077]: {"level":"info","ts":1637143224.4512274,"logger":"tls.issuance.zerossl","msg":"generated EAB credent>
Nov 17 10:00:25 rockylinux caddy[20077]: {"level":"info","ts":1637143225.7558215,"logger":"tls.issuance.acme","msg":"waiting on internal rate>
Nov 17 10:00:25 rockylinux caddy[20077]: {"level":"info","ts":1637143225.755876,"logger":"tls.issuance.acme","msg":"done waiting on internal >
Nov 17 10:00:27 rockylinux caddy[20077]: {"level":"info","ts":1637143227.8956456,"logger":"tls.issuance.acme.acme_client","msg":"trying to so
Now, open your web browser and access the Caddy website using the URL http://test.example.com. You should see your website on the following screen:
Step 4 - Enable PHP Support on Caddy Web Server
First, you will need to install PHP and other required extensions to your server. You can install all of them with the following command:
dnf install php-fpm php-cli php-gd -y
Once all the packages are installed, edit the Caddy configuration file:
nano /etc/caddy/Caddyfile
Define the php_fastcgi location as shown below:
test.example.com:80 {
root * /var/www/example.com
php_fastcgi unix//run/php-fpm/www.sock
file_server
encode gzip
log {
output file /var/log/caddy/example.access.log
}
@static {
file
path *.ico *.css *.js *.gif *.jpg *.jpeg *.png *.svg *.woff *.pdf *.webp
}
header @static Cache-Control max-age=5184000
}
Save and close the file, then edit the PHP-FPM file:
nano /etc/php-fpm.d/www.conf
Change the following lines:
user = caddy
group = caddy
listen.acl_users = apache,nginx,caddy
Save and close the file, then start the PHP-FPM service and enable it to start at system reboot:
systemctl start php-fpm
systemctl enable php-fpm
Next, create a sample info.php page:
nano /var/www/example.com/info.php
Add the following line:
Save and close the file, then open your web browser and access the info.php page using the URL http://test.example.com/info.php. You will get the following page:
Conclusion
In the above guide, we explained how to install Caddy with PHP on Rocky Linux 8. Caddy is a very good alternative to Apache and Nginx. You should try it in the production environment - get started on your virtual private server from Atlantic.Net!
### How to Install and Use PIP Python Package Manager on Rocky Linux
Python is a general-purpose, high-level programming language used by developers around the world. PIP is a package manager for Python used for installing and managing additional packages. PIP allows you to manage full lists of packages and their corresponding version numbers. PIP provides a way to install user-defined projects locally with the use of a setup.py file.
In this post, we will explain how to install and use PIP on Rocky Linux. This procedure is compatible with Rocky Linux 8 and Rocky Linux 9.
Step 1 - Install PIP on Rocky Linux
Before installing PIP, you will need to install Python on your system. You can install it by running the following command:
dnf install python39 -y
Once Python is installed, you can verify the Python version using the following command:
python3.9 --version
You should get the following output:
Python 3.9.2
Next, install PIP using the following command:
dnf install python3.9-pip
Once PIP is installed, verify the installed version of PIP using the following command:
pip3 --version
You should see the following output:
pip 20.2.4 from /usr/lib/python3.9/site-packages/pip (python 3.9)
Step 2 - How to Update PIP
It is recommended to update PIP to the latest version. You can update it using the following command:
pip3 install --upgrade pip
You should see the following output:
Collecting pip
Downloading pip-21.3.1-py3-none-any.whl (1.7 MB)
|████████████████████████████████| 1.7 MB 1.9 MB/s
Installing collected packages: pip
Successfully installed pip-21.3.1
You can now verify the PIP version using the following command:
pip3 --version
You should see the following output:
pip 21.3.1 from /usr/local/lib/python3.9/site-packages/pip (python 3.9)
Step 3 - How to Use PIP
You can list all important options available with PIP using the following command:
pip3 --help
You should see the following output:
Usage:
pip3 [options]
Commands:
install Install packages.
download Download packages.
uninstall Uninstall packages.
freeze Output installed packages in requirements format.
list List installed packages.
show Show information about installed packages.
check Verify installed packages have compatible dependencies.
config Manage local and global configuration.
search Search PyPI for packages.
cache Inspect and manage pip's wheel cache.
wheel Build wheels from your requirements.
hash Compute hashes of package archives.
completion A helper command used for command completion.
debug Show information useful for debugging.
help Show help for commands.
To install a specific package, run the following command:
pip3 install wheel
To get detailed information about a package, run the following command:
pip3 show wheel
You will get the following output:
Name: wheel
Version: 0.37.0
Summary: A built-package format for Python
Home-page: https://github.com/pypa/wheel
Author: Daniel Holth
Author-email: dholth@fastmail.fm
License: MIT
Location: /usr/local/lib/python3.9/site-packages
Requires:
Required-by:
To list all installed packages, run the following command:
pip3 list
You should see the following output:
Package Version
---------- -------
pip 21.3.1
setuptools 50.3.2
wheel 0.37.0
To list all outdated packages, run the following command:
pip3 list --outdated
You should see the following output:
Package Version Latest Type
---------- ------- ------ -----
setuptools 50.3.2 58.5.3 wheel
To uninstall a specific package, run the following command:
pip3 uninstall wheel
Conclusion
In the above post, you learned how to install and use PIP on Rocky Linux 8. You also learned how to manage Python packages with PIP. You can now easily use PIP to manage the Python dependencies. Get started with VPS hosting from Atlantic.Net!
### How to Create a Sudo User in Rocky Linux
In Linux or Unix-based operating systems, there are two types of users: a super-user (root) and an average or regular user. The root user has complete control of the operating system, and it has privileges to run administrative commands like installing, removing, and updating software packages, changing permissions, and configuring different services. The non-root users have limited interactions with an operating system environment, and they can perform only user-specific tasks.
The sudo command, short for "super-user do," is a Linux utility that allows an average user to run any commands with unlimited privileges. In this case, you must add an average user to the sudo Group to execute administrative commands.
In this post, we will show you how to create a sudo user in Rocky Linux. This procedure is compatible with Rocky Linux 8 and Rocky Linux 9.
Create a Normal User in Rocky Linux
If you have not created any normal or no-root user on your system, you will need to create one user.
Let's create a new user named user1 with the following command:
adduser user1
Next, set a password for this user with the following command:
passwd user1
You will be asked to set a password as shown below:
Changing password for user user1.
New password:
Retype new password:
passwd: all authentication tokens updated successfully.
Also Read
How to Change or Set User Passwords in Linux
Enable Wheel Group access for All Users
Next, you must edit /etc/sudoers file and confirm that the wheel group is enabled.
nano /etc/sudoers
Make sure the following line exists:
%wheel ALL=(ALL) ALL
Save and close the file after the confirmation.
Add a Normal User to the sudo (wheel) Group.
Next, you must add your created user to the sudo (wheel) Group to grant it administrative privileges.
You can use the usermod command to add a regular user to the wheel group.
usermod -aG wheel user1
This command will add a user1 to the wheel group.
Verify the Sudo User
After adding a normal user to the sudo Group, you must verify whether the newly created user has sudo rights.
To verify, switch the user to the user1 using the following command:
su - user1
Next, run any administrative command with sudo:
sudo dnf update
If everything is fine, you will be asked to provide a password for user1:
We trust you have received the usual lecture from the local System
Administrator. It usually boils down to these three things:
#1) Respect the privacy of others.
#2) Think before you type.
#3) With great power comes great responsibility.
[sudo] password for user1:
Provide the password of user1 to run the above command.
The above output confirms that the user has sudo rights and can run administrative commands.
Also Read
How to Use the id Command in Linux
Conclusion
In this post, we explained how to create a sudo user in Rocky Linux 8. You can now grant super-user privileges to any regular user in your Linux environment. Try it on VPS hosting from Atlantic.Net!
### Install WordPress with Docker on Ubuntu
WordPress is a free, open-source, and widely used content management system. However, setting up a new web hosting environment with WordPress can be a time-consuming process. Docker simplifies the whole process with a few commands that reduce the time and effort needed for installation. Docker is an open-source containerization application built to develop, test, and run multiple applications on the same machine. It is very useful for developers to create a test environment without wasting server space and memory.
In this tutorial, we will show you how to install WordPress with Docker on Ubuntu. This procedure is compatible with Ubuntu 20.04 and Ubuntu 22.04.
[jumpbox]
Step 1 - Install Required Dependencies
First, you will need to install some dependencies in your server. You can install all of them by running the following command:
apt-get update -yapt-get install mariadb-client apt-transport-https ca-certificates curl gnupg-agent software-properties-common -y
Once all the packages are installed, you can proceed to the next step.
Step 2 - Install Docker
By default, the latest version of Docker is not available in the Ubuntu 20.04 default repository, so it is a good idea to add the Docker official repository in your system.
First, download and add the GPG key with the following command:
curl -fsSL https://download.docker.com/linux/ubuntu/gpg | apt-key add -
Next, add the Docker repository with the following command:
add-apt-repository "deb [arch=amd64] https://download.docker.com/linux/ubuntu $(lsb_release -cs) stable"
Once the repository is added, you can install the Docker and Docker Compose using the following command:
apt-get install docker-ce docker-ce-cli containerd.io -y
After installing both packages, check the installed version of Docker with the following command:
docker --version
You should get the following output:
Docker version 19.03.12, build 48a66213fe
Step 3 - Create a MariaDB Container
First, you will need to download the MariaDB image from the Docker repository. You can download it with the following command:
docker pull mariadb
You should see the following output:
Using default tag: latest
latest: Pulling from library/mariadb
3ff22d22a855: Pull complete
e7cb79d19722: Pull complete
323d0d660b6a: Pull complete
b7f616834fd0: Pull complete
78ed0160f03e: Pull complete
a122e9306ac4: Pull complete
673e89352b19: Pull complete
caf1e694359b: Pull complete
04f5e4f6ead3: Pull complete
a41772aadb3d: Pull complete
c3811aa2fa0a: Pull complete
655ad574d3c7: Pull complete
90ae536d75f0: Pull complete
Digest: sha256:812d3a450addcfe416420c72311798f3f3109a11d9677716dc631c429221880c
Status: Downloaded newer image for mariadb:latest
docker.io/library/mariadb:latest
Next, create a directory structure for WordPress on your server:
mkdir ~/wordpress
mkdir -p ~/wordpress/database
mkdir -p ~/wordpress/html
Next, create a MariaDB container with name wordpressdb by running the following command:
docker run -e MYSQL_ROOT_PASSWORD=root-password -e MYSQL_USER=wpuser -e MYSQL_PASSWORD=password -e MYSQL_DATABASE=wpdb -v /root/wordpress/database:/var/lib/mysql --name wordpressdb -d mariadb
You should see an output similar to the following:
e8c780b34cdcb66db9278635b109debb1775d6a6b6785c4e74c8e0815e3ba5e3
In the above command, here are the variables defined:
MYSQL_ROOT_PASSWORD: This option will configure MariaDB root password.
MYSQL_USER: This will create a new wpuser for WordPress.
MYSQL_PASSWORD: This will set the password for wpuser.
MYSQL_DATABASE: This will create a new database named wpdb for WordPress.
-v /root/wordpress/database:/varlib/mysql: This will link the database directory to the mysql directory.
Next, check the IP address of MariaDB container with the following command:
docker inspect -f '{{ .NetworkSettings.IPAddress }}' wordpressdb
You should see the MariaDB container IP address in the following output:
172.17.0.2
Now, connect to your MariaDB container using the database user and password:
mysql -u wpuser -h 172.17.0.2 -p
Enter password:
You should see the following output:
Welcome to the MariaDB monitor. Commands end with ; or \g.
Your MariaDB connection id is 3
Server version: 10.5.4-MariaDB-1:10.5.4+maria~focal mariadb.org binary distribution
Copyright (c) 2000, 2018, Oracle, MariaDB Corporation Ab and others.
Type 'help;' or '\h' for help. Type '\c' to clear the current input statement.
Now, verify the database with the following command:
show databases;
You should see your wpdb database in the following output:
+--------------------+
| Database |
+--------------------+
| information_schema |
| wpdb |
+--------------------+
2 rows in set (0.001 sec)
Now, exit from the MariaDB shell with the following command:
EXIT;
Step 4 - Create a WordPress Container
First, download the WordPress image from the Docker repository using the following command:
docker pull wordpress:latest
You should see the following output:
latest: Pulling from library/wordpress
bf5952930446: Pull complete
a409b57eb464: Pull complete
3192e6c84ad0: Pull complete
43553740162b: Pull complete
d8b8bba42dea: Pull complete
eb10907c0110: Pull complete
10568906f34e: Pull complete
03fe17709781: Pull complete
98171b7166c8: Pull complete
3978c2fb05b8: Pull complete
71bf21524fa8: Pull complete
24fe81782f1c: Pull complete
7a2dfd067aa5: Pull complete
a04586f4f8fe: Pull complete
b8059b10e448: Pull complete
e5b4db4a14b4: Pull complete
48018c17c4e9: Pull complete
d09f106f9e16: Pull complete
2ce4312168ba: Pull complete
01f0fe2819ef: Pull complete
Digest: sha256:19c6a3a796b1db1e6ee8bd3e8d5d69510885fa62255ce8bd07ee34d3878d0312
Status: Downloaded newer image for wordpress:latest
docker.io/library/wordpress:latest
Next, create a new WordPress container named wpcontainer from the downloaded image using the following command:
docker run -e WORDPRESS_DB_USER=wpuser -e WORDPRESS_DB_PASSWORD=password -e WORDPRESS_DB_NAME=wpdb -p 8081:80 -v /root/wordpress/html:/var/www/html --link wordpressdb:mysql --name wpcontainer -d wordpress
This will create a new WordPress container and expose the port 80 on the container to port 8081 on the host machine.
You can now verify your WordPress container with the following command:
curl -I localhost:8081
You should get the following output:
HTTP/1.1 302 Found
Date: Fri, 07 Aug 2020 04:44:36 GMT
Server: Apache/2.4.38 (Debian)
X-Powered-By: PHP/7.4.9
Expires: Wed, 11 Jan 1984 05:00:00 GMT
Cache-Control: no-cache, must-revalidate, max-age=0
X-Redirect-By: WordPress
Location: http://localhost:8081/wp-admin/install.php
Content-Type: text/html; charset=UTF-8
Step 5 - Configure Nginx as a Reverse Proxy
Next, you will need to install and configure Nginx as a reverse proxy for the WordPress container so you can access your WordPress using port 80.
First, install the Nginx web server with the following command:
apt-get install nginx -y
Once installed, create a new Nginx virtual host configuration file:
nano /etc/nginx/sites-available/wordpress
Add the following lines:
server {
listen 80;
server_name wp.example.com;
location / {
proxy_pass http://localhost:8081;
proxy_set_header Host $host;
proxy_set_header X-Real-IP $remote_addr;
proxy_set_header X-Forwarded-For $proxy_add_x_forwarded_for;
}
}
Save and close the file, then activate the virtual host with the following command:
ln -s /etc/nginx/sites-available/wordpress /etc/nginx/sites-enabled/
Next, restart the Nginx service to apply the changes:
systemctl restart nginx
Step 6 - Access WordPress Interface
Now, open your web browser and type the URL http://wp.example.com. You will be redirected to the WordPress installation wizard:
Select your language and click on the Continue button. You should see the following screen:
Provide your site name, admin username, email, and password and click on the Install WordPress button. Once the installation has been finished, you should see the following screen:
Provide your admin username and password and click on the Log In button. You should see the WordPress dashboard in the following screen:
Conclusion
In this guide, you learned how to install and configure WordPress in the Docker environment on Ubuntu 20.04. You can now set up WordPress in a test environment - get started today on VPS Hosting from Atlantic.Net!
### How to Install and Configure strongSwan VPN on Ubuntu
A VPN allows you to access the Internet safely and securely on an untrusted public Wi-Fi network. You can connect to remote VPN servers using the encrypted connection and surf the web anonymously.
strongSwan is free, open-source, and the most widely-used IPsec-based virtual private network implementation, allowing you to create an encrypted secure tunnel between two or more remote networks.
strongSwan uses the IKEv2 protocol, which allows for direct IPSec tunneling between the server and the client. strongSwan stands for Strong Secure WAN and supports both versions of automatic keying exchange in IPsec VPN, IKE V1 and V2.
In this tutorial, we will show you how to install and configure strongSwan VPN on Ubuntu. This procedure is compatible with Ubuntu 18.04, Ubuntu 20.04, Ubuntu 22.04 and Ubuntu 24.04
Step 1 - Enable Kernel Packet Forwarding
First, you will need to configure the kernel to enable packet forwarding for IPv4. You can configure it by editing the file /etc/sysctl.conf:
nano /etc/sysctl.conf
Add the following lines at the end of the file:
net.ipv4.ip_forward = 1
net.ipv6.conf.all.forwarding = 1
net.ipv4.conf.all.accept_redirects = 0
net.ipv4.conf.all.send_redirects = 0
Save and close the file. Then, run the following command to reload the settings:
sysctl -p
Step 2 - Install strongSwan
First, you will need to install the strongSwan IPSec daemon in your system. You can install it by simply running the following command:
apt-get install strongswan libcharon-extra-plugins strongswan-pki libtss2-tcti-tabrmd0 libtss2-esys-3.0.2-0 libstrongswan-extra-plugins -y
Once the installation is completed, you can proceed to the next step.
Step 3 - Setting Up a Certificate Authority
Now you will need to generate the VPN server certificate and key for the VPN client to verify the authenticity of the VPN server.
First, generate a private key for self-signing the CA certificate using a PKI utility:
ipsec pki --gen --size 4096 --type rsa --outform pem > ca.key.pem
Next, create your root certificate authority and use the above key to sign the root certificate:
ipsec pki --self --in ca.key.pem --type rsa --dn "CN=VPN Server CA" --ca --lifetime 3650 --outform pem > ca.cert.pem
Next, you will need to create a certificate and key for the VPN server so that the client can verify the server’s authenticity using the CA certificate we just generated.
First, create a private key for the VPN server with the following command:
ipsec pki --gen --size 4096 --type rsa --outform pem > server.key.pem
Next, generate the server certificate by running the following command:
ipsec pki --pub --in server.key.pem --type rsa | ipsec pki --issue --lifetime 2750 --cacert ca.cert.pem --cakey ca.key.pem --dn "CN=vpn.example.com" --san="vpn.example.com" --flag serverAuth --flag ikeIntermediate --outform pem > server.cert.pem
Next, you will need to copy the above certificate in the respective IPSec certificates directories as shown below:
mv ca.cert.pem /etc/ipsec.d/cacerts/
mv server.cert.pem /etc/ipsec.d/certs/
mv ca.key.pem /etc/ipsec.d/private/
mv server.key.pem /etc/ipsec.d/private/
At this point, you have all of the certificates ready, and you can now proceed to the next step.
Step 4 - Configure strongSwan
strongSwan has a default configuration file located at /etc/ipsec.conf. It is recommended to rename the default configuration file and create a new file.
To rename the default configuration file, run the following command:
mv /etc/ipsec.conf /etc/ipsec.conf.bak
Next, create a new configuration file as shown below:
nano /etc/ipsec.conf
Add the following lines:
config setup
charondebug="ike 2, knl 2, cfg 2, net 2, esp 2, dmn 2, mgr 2"
strictcrlpolicy=no
uniqueids=yes
cachecrls=no
conn ipsec-ikev2-vpn
auto=add
compress=no
type=tunnel # defines the type of connection, tunnel.
keyexchange=ikev2
fragmentation=yes
forceencaps=yes
dpdaction=clear
dpddelay=300s
rekey=no
left=%any
leftid=@vpn.example.com # if using IP, define it without the @ sign
leftcert=server.cert.pem # reads the VPN server cert in /etc/ipsec.d/certs
leftsendcert=always
leftsubnet=0.0.0.0/0
right=%any
rightid=%any
rightauth=eap-mschapv2
rightsourceip=192.168.0.0/24
rightdns=8.8.8.8
rightsendcert=never
eap_identity=%identity # defines the identity the client uses to reply to an EAP Identity request.
Save and close the file when you are finished.
Where:
config setup : Specifies general configuration information for IPSec which applies to all connections.
charondebug : Defines how much Charon debugging output should be logged.
leftid : Specifies the domain name or IP address of the server.
leftcert : Specifies the name of the server certificate.
leftsubnet : Specifies the private subnet behind the left participant.
rightsourceip : IP address pool to be assigned to the clients.
rightdns : DNS to be assigned to clients.
Step 5 - Configure Authentication
At this point, your VPN server is configured to accept client connections. Next, you will need to configure client-server authentication credentials to define the RSA private keys for authentication and set up the EAP user credentials.
nano /etc/ipsec.secrets
Add the following lines:
: RSA "server.key.pem"
vpnsecure : EAP "your-secure-password"
Save and close the file. Then, restart the strongSwan service and enable it to start at reboot:
systemctl restart strongswan-starter.service
systemctl enable strongswan-starter.service
You can also verify the status of the strongSwan service using the following command:
systemctl status strongswan-starter.service
You should see the following output:
• strongswan.service - strongSwan IPsec IKEv1/IKEv2 daemon using ipsec.conf
Loaded: loaded (/lib/systemd/system/strongswan.service; enabled; vendor preset: enabled)
Active: active (running) since Fri 2020-05-08 08:02:08 UTC; 8s ago
Main PID: 29947 (starter)
Tasks: 18 (limit: 2359)
CGroup: /system.slice/strongswan.service
├─29947 /usr/lib/ipsec/starter --daemon charon --nofork
└─29973 /usr/lib/ipsec/charon --debug-ike 2 --debug-knl 2 --debug-cfg 2 --debug-net 2 --debug-esp 2 --debug-dmn 2 --debug-mgr 2
May 08 08:02:08 ubuntu1804 charon[29973]: 05[CFG] eap_identity=%identity
May 08 08:02:08 ubuntu1804 charon[29973]: 05[CFG] dpddelay=300
May 08 08:02:08 ubuntu1804 charon[29973]: 05[CFG] dpdtimeout=150
May 08 08:02:08 ubuntu1804 charon[29973]: 05[CFG] dpdaction=1
May 08 08:02:08 ubuntu1804 charon[29973]: 05[CFG] sha256_96=no
May 08 08:02:08 ubuntu1804 charon[29973]: 05[CFG] mediation=no
May 08 08:02:08 ubuntu1804 charon[29973]: 05[CFG] keyexchange=ikev2
May 08 08:02:08 ubuntu1804 charon[29973]: 05[CFG] adding virtual IP address pool 192.168.0.0/24
May 08 08:02:08 ubuntu1804 charon[29973]: 05[CFG] loaded certificate "CN=vpn.example.com" from 'server.cert.pem'
May 08 08:02:08 ubuntu1804 charon[29973]: 05[CFG] added configuration 'ipsec-ikev2-vpn'
You can also verify the strongSwan certificates using the following command:
ipsec listcerts
You should get the following output:
List of X.509 End Entity Certificates
subject: "CN=vpn.example.com"
issuer: "CN=VPN Server CA"
validity: not before May 11 07:13:55 2025, ok
not after Nov 20 07:13:55 2032, ok (expires in 2749 days)
serial: 20:47:13:71:a8:8a:e7:65
altNames: vpn.example.com
flags: serverAuth ikeIntermediate
authkeyId: 90:9f:3f:b7:b1:12:8f:e3:d0:30:15:1b:49:39:94:c9:c9:8d:07:3c
subjkeyId: 68:ff:aa:f4:6a:e6:40:d2:4f:8d:dd:1f:6a:16:df:9e:f1:76:f6:28
pubkey: RSA 4096 bits, has private key
keyid: 02:0b:d8:03:cf:ee:3e:4f:8a:da:39:1b:fb:90:b2:10:f8:64:62:0e
subjkey: 68:ff:aa:f4:6a:e6:40:d2:4f:8d:dd:1f:6a:16:df:9e:f1:76:f6:28
At this point, your strongSwan VPN server is installed and configured. You can now proceed to install and configure the VPN client to connect the VPN server.
Step 6 - Install and Configure strongSwan Client
Log in to the client system and run the following command to install the strongSwan client packages:
apt-get install strongswan libcharon-extra-plugins -y
Once installed, disable the strongSwan service to start at boot:
systemctl disable strongswan-starter.service
Next, copy the ca.cert.pem file from the VPN server to the VPN client using the following command:
scp root@your-vpnserver-ip:/etc/ipsec.d/cacerts/ca.cert.pem /etc/ipsec.d/cacerts/
Next, configure VPN client authentication by editing the file /etc/ipsec.secrets:
nano /etc/ipsec.secrets
Add the following line:
vpnsecure : EAP "your-secure-password"
Save and close the file. Then, edit the strongSwan default configuration file:
nano /etc/ipsec.conf
Add the following lines:
conn ipsec-ikev2-vpn-client
auto=start
right=vpn.example.com
rightid=vpn.example.com
rightsubnet=0.0.0.0/0
rightauth=pubkey
leftsourceip=%config
leftid=vpnsecure
leftauth=eap-mschapv2
eap_identity=%identity
Save and close the file. Then, restart the strongSwan service with the following command:
systemctl restart strongswan-starter.service
On the strongSwan server, check the VPN connection status using the following command:
ipsec status
You should see that the IP 192.168.0.5 assign to the VPN client:
Security Associations (1 up, 0 connecting):
ipsec-ikev2-vpn-client[1]: ESTABLISHED 1 minutes ago, [vpnsecure]...192.168.0.1[vpn.example.com]
ipsec-ikev2-vpn-client{1}: INSTALLED, TUNNEL, reqid 1, ESP in UDP SPIs: 74ab87d0db9ea3d5_i 684cb0dbe4d1a70d_r
ipsec-ikev2-vpn-client{1}: 192.168.0.5/32 === 0.0.0.0/0
Conclusion
Congratulations! You have successfully installed and configured strongSwan VPN Server and Client on Ubuntu 24.04. You are now securely traversing the internet protecting your identity, location, and traffic from snoopers and censors - get started on your VPS hosted Ubuntu server from Atlantic.Net today!
Learn more about our VPS hosting services and Virtual private servers.
### How to Install Consul Server on Ubuntu
Consul is a service mesh solution offering a full-featured control plane, including segmentation functionality, configuration, and service discovery. These features may be used individually as required, or they may be used together for creating a full-service mesh. Consul operates over a data plane and supports both a proxy and a native integration model. Consul ships with a simple built-in proxy that ensures everything works out-of-the-box. Consul also supports 3rd party proxy integrations, such as Envoy.
Key features of Consul include:
Service Discovery
Health Checking
KV Store
Secure Service Communication
Multi-Datacenter Capabilities
In this tutorial, we will show you how to install a Consul server on Ubuntu. This procedure is compatible with Ubuntu 22.04 and Ubuntu 24.04.
Step 1 - Install Consul Server
First, install the required packages with the following command:
apt-get update -yapt-get install unzip gnupg2 curl wget -y
Next, download the latest version of Consul with the following command:
wget https://releases.hashicorp.com/consul/1.21.0/consul_1.21.0_linux_amd64.zip
Once the download is completed, unzip the downloaded file with the following command:
unzip consul_1.21.0_linux_amd64.zip
Next, move the consul binary to the /usr/local/bin directory with the following command:
mv consul /usr/local/bin/
Next, verify the Consul version using the following command:
consul --version
You should get the following output:
Consul v1.21.0
Revision 4e96098f
Build Date 2025-05-06T11:58:51Z
Protocol 2 spoken by default, understands 2 to 3 (agent will automatically use protocol >2 when speaking to compatible agents)
Step 2 - Create Consul Service File
First, you will need to create a separate user and group for Consul. You can create them with the following command:
groupadd --system consul
useradd -s /sbin/nologin --system -g consul consul
Next, create required directories with the following command:
mkdir -p /var/lib/consul
mkdir /etc/consul.d
Next, change the ownership and permission of those directories:
chown -R consul:consul /var/lib/consul
chmod -R 775 /var/lib/consul
chown -R consul:consul /etc/consul.d
Next, create a Consul systemd service file with the following command:
nano /etc/systemd/system/consul.service
Add the following lines:
[Unit]
Description=Consul Service Discovery Agent
After=network-online.target
Wants=network-online.target
[Service]
Type=simple
User=consul
Group=consul
ExecStart=/usr/local/bin/consul agent -server -ui \
-advertise=your-server-ip \
-bind=your-server-ip \
-data-dir=/var/lib/consul \
-node=consul-01 \
-config-dir=/etc/consul.d
ExecReload=/bin/kill -HUP $MAINPID
KillSignal=SIGINT
TimeoutStopSec=5
Restart=on-failure
SyslogIdentifier=consul
[Install]
WantedBy=multi-user.target
Save and close the file when you are finished.
Note: Provide proper server-ip, data directory path, and config directory that you created earlier.
Next, reload the systemd daemon with the following command:
systemctl daemon-reload
Step 3 - Configure Consul Server
First, you will need to generate a key to the necessary length and encoding. You can generate it with the following command:
consul keygen
You should get the following output:
TJ8iw/XJ+0/BSUMGuLFWkeT23LmGnfhmF/qWgA25wZU=
Next, you will need to create a Json configuration file for Consul. You can create it with the following command:
nano /etc/consul.d/config.json
Provide your server IP, hostname and Consul key as shown below:
{
"bootstrap": true,
"server": true,
"log_level": "DEBUG",
"enable_syslog": true,
"datacenter": "server1",
"addresses" : {
"http": "0.0.0.0"
},
"bind_addr": "your-server-ip",
"node_name": "ubuntu2404",
"data_dir": "/var/lib/consul",
"acl_datacenter": "server1",
"acl_default_policy": "allow",
"encrypt": "TJ8iw/XJ+0/BSUMGuLFWkeT23LmGnfhmF/qWgA25wZU="
}
Save and close the file when you are finished.
Next, start the Consul service and enable it to start at system reboot with the following command:
systemctl start consul
systemctl enable consul
Next, verify the status of the Consul with the following command:
● consul.service - Consul Service Discovery Agent
Loaded: loaded (/etc/systemd/system/consul.service; disabled; preset: enabled)
Active: active (running) since Sun 2025-05-25 05:51:50 UTC; 5s ago
Main PID: 16606 (consul)
Tasks: 8 (limit: 4609)
Memory: 30.0M (peak: 30.5M)
CPU: 130ms
CGroup: /system.slice/consul.service
└─16606 /usr/local/bin/consul agent -server -ui -advertise=69.87.219.209 -bind=69.87.219.209 -data-dir=/var/lib/consul -node=consul-01 -config-dir=/etc/co>
May 25 05:51:53 ubuntu24 consul[16606]: agent.server.cert-manager: CA has not finished initializing
May 25 05:51:53 ubuntu24 consul[16606]: agent.server.cert-manager: ACLs have not finished initializing
May 25 05:51:54 ubuntu24 consul[16606]: 2025-05-25T05:51:54.339Z [DEBUG] agent.server.cert-manager: ACLs have not finished initializing
May 25 05:51:54 ubuntu24 consul[16606]: 2025-05-25T05:51:54.339Z [DEBUG] agent.server.cert-manager: CA has not finished initializing
May 25 05:51:54 ubuntu24 consul[16606]: agent.server.cert-manager: ACLs have not finished initializing
May 25 05:51:54 ubuntu24 consul[16606]: agent.server.cert-manager: CA has not finished initializing
May 25 05:51:55 ubuntu24 consul[16606]: 2025-05-25T05:51:55.339Z [DEBUG] agent.server.cert-manager: ACLs have not finished initializing
May 25 05:51:55 ubuntu24 consul[16606]: agent.server.cert-manager: ACLs have not finished initializing
May 25 05:51:55 ubuntu24 consul[16606]: 2025-05-25T05:51:55.339Z [DEBUG] agent.server.cert-manager: CA has not finished initializing
May 25 05:51:55 ubuntu24 consul[16606]: agent.server.cert-manager: CA has not finished initializing
At this point, the Consul server is started and listening on port 8500. You can check it with the following command:
ss -plunt | grep 8500
You should get the following output:
tcp LISTEN 0 4096 *:8500 *:* users:(("consul",pid=5511,fd=17))
Step 4 - Configure Nginx as a Reverse Proxy
Next, it is a good idea to install and configure Nginx as a reverse proxy to access the Consul on port 80.
First, install the Nginx server with the following command:
apt-get install nginx -y
Once installed, remove the Nginx default virtual host configuration file:
rm -rf /etc/nginx/sites-enabled/default
Next, create a Consul virtual host configuration file with the following command:
nano /etc/nginx/sites-available/consul.conf
Add the following lines:
server {
listen 80 ;
server_name your-server-ip;
root /var/lib/consul;
location / {
proxy_pass http://127.0.0.1:8500;
proxy_set_header X-Real-IP $remote_addr;
proxy_set_header Host $http_host;
}
}
Save and close the file, then activate the virtual host with the following command:
ln -s /etc/nginx/sites-available/consul.conf /etc/nginx/sites-enabled/
Next, check the Nginx for any syntax errors with the following command:
nginx -t
You should get the following output:
nginx: the configuration file /etc/nginx/nginx.conf syntax is ok
nginx: configuration file /etc/nginx/nginx.conf test is successful
Next, restart the Nginx service with the following command:
systemctl restart nginx
If you get any errors, then you will need to edit the Nginx default server configuration file and set server_names_hash_bucket_size:
nano /etc/nginx/nginx.conf
Add the following line below http {:
server_names_hash_bucket_size 64;
Save and close the file, then restart the Nginx service to apply the changes:
systemctl restart nginx
Step 5 - Access Consul Dashboard
Next, open your web browser and access the Consul web interface using the URL http://your-server-ip/ui. You should see the Consul dashboard in the following page:
Click on the Nodes to list the active nodes in your server as shown below:
Conclusion
Congratulations! You have successfully installed Consul server on Ubuntu 24.04. You can now add more client nodes to the Consul server and start managing them from the Consul dashboard. For more information, you can visit the Consul documentation. Get started with Consul on VPS Hosting from Atlantic.Net!
### How to Setup Kerberos Server and Client on Ubuntu
Kerberos is a network authentication protocol that provides authentication against the devices to enable secure communication between client and server. It uses secret-key cryptography for verifying users' identities. Generally, Kerberos is used in POSIX authentication, Active Directory, NFS, and Samba.
This tutorial will show you how to install the Kerberos server and client on Ubuntu. This procedure is compatible with Ubuntu 22.04 and Ubuntu 24.04.
Prerequisites
Two fresh Ubuntu 24.04 VPSes on the Atlantic.Net Cloud Platform
A root password configured on your server
Step 1 - Setup Hostname Resolution
First, you must set up a fully qualified hostname on the server and client machine.
On the server machine, set the fully qualified hostname with the following command:
hostnamectl set-hostname server.myexample.com
On the client machine, set the fully qualified hostname with the following command:
hostnamectl set-hostname client.myexample.com
Next, edit the /etc/hosts files on both server and client machines and set up the hostname resolution so both systems can communicate using the hostname.
nano /etc/hosts
Add the following lines:
your-server-ip server.myexample.com
your-client-ip client.myexample.com
Save and close the file when you are finished.
Step 2 - Install Kerberos Server
Next, you must install the Kerberos server package on the server machine. You can install all the packages with the following command:
apt-get install krb5-kdc krb5-admin-server krb5-config -y
During the installation, you will be asked to provide Kerberos Realm, as shown below:
Provide myexample.com and click on the OK button. You will be asked to provide the Kerberos server hostname as shown below:
Provide server.myexample.com and click on the OK button. You will be asked to provide the hostname of the administrative server as shown below:
Provide server.myexample.com and click on the OK button. You should see the following page:
Click on the OK button to finish the installation.
Step 3 - Configure Kerberos Server
Next, you will need to generate the password for the Kerberos Realm. You can generate it with the following command:
krb5_newrealm
You will be asked to provide a secure password as shown below:
This script should be run on the master KDC/admin server to initialize
a Kerberos realm. It will ask you to type in a master key password.
This password will be used to generate a key that is stored in
/etc/krb5kdc/stash. You should try to remember this password, but it
is much more important that it be a strong password than that it be
remembered. However, if you lose the password and /etc/krb5kdc/stash,
you cannot decrypt your Kerberos database.
Loading random data
Initializing database '/var/lib/krb5kdc/principal' for realm 'myexample.com',
master key name 'K/M@myexample.com'
You will be prompted for the database Master Password.
It is important that you NOT FORGET this password.
Enter KDC database master key:
Re-enter KDC database master key to verify:
Now that your realm is set up you may wish to create an administrative
principal using the addprinc subcommand of the kadmin.local program.
Then, this principal can be added to /etc/krb5kdc/kadm5.acl so that
you can use the kadmin program on other computers. Kerberos admin
principals usually belong to a single user and end in /admin. For
example, if jruser is a Kerberos administrator, then in addition to
the normal jruser principal, a jruser/admin principal should be
created.
Don't forget to set up DNS information so your clients can find your
KDC and admin servers. Doing so is documented in the administration
guide.
Next, you must add the admin user principle to the access control. You can do it by editing the following file:
nano /etc/krb5kdc/kadm5.acl
Add the following line:
*/admin *
Save and close the file when you are finished.
Next, you must add the admin principal to the Kerberos database. You can do it with the following command:
kadmin.local
You should see the following output:
Authenticating as principal root/admin@myexample.com with password.
Next, run the following command to add the principal name kuser:
kadmin.local: addprinc kuser
You will be asked to set the password as shown below:
WARNING: no policy specified for kuser@myexample.com; defaulting to no policy
Enter password for principal "kuser@myexample.com":
Re-enter password for principal "kuser@myexample.com":
Principal "kuser@myexample.com" created.
Next, exit from the kadmin console with the following command:
kadmin.local: quit
Next, restart the Kerberos server with the following command:
systemctl restart krb5-admin-server
You can verify the status of Kerberos with the following command:
systemctl status krb5-admin-server
You should get the following output:
● krb5-admin-server.service - Kerberos 5 Admin Server
Loaded: loaded (/usr/lib/systemd/system/krb5-admin-server.service; enabled; preset: enabled)
Active: active (running) since Fri 2025-05-23 06:32:09 UTC; 4s ago
Main PID: 9786 (kadmind)
Tasks: 1 (limit: 2272)
Memory: 648.0K (peak: 912.0K)
CPU: 30ms
CGroup: /system.slice/krb5-admin-server.service
└─9786 /usr/sbin/kadmind -nofork
Step 4 - Install Kerberos Client
Next, you must install the Kerberos client on the client machine. You can install it with the following command:
apt-get install krb5-user -y
During the installation, you will be asked to provide Kerberos Realm as shown below:
Provide myexample.com and click on the OK button. You will be asked to provide the Kerberos server hostname as shown below:
Provide server.myexample.com and click on the OK button. You will be asked to provide the hostname of the administrative as shown below:
Provide server.myexample.com and click on the OK button. You should see the following page:
Click on the OK button to finish the installation.
Next, authenticate to the Kerberos server and obtain a ticket from it with the following command:
kinit kuser
You will be asked to provide a password for the kuser principal as shown below:
Password for kuser@myexample.com:
Next, obtain a ticket with the following command:
klist
You should get the following output:
Ticket cache: FILE:/tmp/krb5cc_0
Default principal: kuser@myexample.com
Valid starting Expires Service principal
05/23/2025 06:33:28 05/23/2025 16:33:28 krbtgt/myexample.com@myexample.com
renew until 05/24/2025 06:33:23
Step 5 - Verify Authentication
Next, you will need to verify the details of the principal on the Kerberos server.
On the Kerberos server machine, run the following command:
kadmin.local
Authenticating as principal root/admin@myexample.com with password.
Next, print the principal details with the following command:
kadmin.local: getprinc kuser
You should get the following output:
Principal: kuser@myexample.com
Expiration date: [never]
Last password change: Fri May 23 06:31:54 UTC 2025
Password expiration date: [never]
Maximum ticket life: 0 days 10:00:00
Maximum renewable life: 7 days 00:00:00
Last modified: Fri May 23 06:31:54 UTC 2025 (root/admin@myexample.com)
Last successful authentication: Fri May 23 06:33:28 UTC 2025
Last failed authentication: [never]
Failed password attempts: 0
Number of keys: 2
Key: vno 1, aes256-cts-hmac-sha1-96
Key: vno 1, aes128-cts-hmac-sha1-96
MKey: vno 1
Attributes: REQUIRES_PRE_AUTH
Policy: [none]
kadmin.local: quit
Conclusion
Congratulations! You have successfully installed and configured the Kerberos server and client on Ubuntu 24.04. You can now use Kerberos on your network for the authentication of users. Try it on your dedicated server hosting account from Atlantic.Net!
Learn more about our dedicated servers.
### How to Configure Reverse Proxy for Node.js Application Using Apache on Ubuntu
Node.js is a free, open-source, and popular JavaScript runtime environment built on Chrome's V8 JavaScript engine. It's used for traditional websites and back-end API services.
Apache is an open-source and one of the most popular web servers in the world. You can also use Apache as a frontend proxy server for backend applications including, Node.js.
In this post, we will show you how to configure Apache as a reverse proxy for the Node.js application on Ubuntu. This procedure is compatible with Ubuntu 22.04 and Ubuntu 24.04.
Step 1 - Install Node.js
First, install the necessary dependencies using the following command.
apt-get install -y ca-certificates curl gnupg
Next, download the Node.js GPG key.
mkdir -p /etc/apt/keyrings
curl -fsSL https://deb.nodesource.com/gpgkey/nodesource-repo.gpg.key | gpg --dearmor -o /etc/apt/keyrings/nodesource.gpg
Next, add the NodeSource repo to the APT source list.
echo "deb [signed-by=/etc/apt/keyrings/nodesource.gpg] https://deb.nodesource.com/node_22.x nodistro main" | tee /etc/apt/sources.list.d/nodesource.list
Then, update the repository index and install Node.js with the following command.
apt update
apt-get install -y nodejs
Next, verify the Node.js version using the following command.
node -v
Output.
v22.15.1
Step 2 - Create a Nodejs Application>
Next, you will need to create a Node.js application to your server.
First, create a directory for your application with the following command:
mkdir project
Next, change the directory to project and create a nodeapp.js file:
cd project
nano nodeapp.js
Add the following lines:
const http = require('http');
const hostname = 'localhost';
const port = 8000;
const server = http.createServer((req, res) => {
res.statusCode = 200;
res.setHeader('Content-Type', 'text/plain');
res.end('Welcome to Node.js!\n');
});
server.listen(port, hostname, () => {
console.log(`Server running at http://${hostname}:${port}/`);
});
Save and close the file, then run the application with the following command:
node nodeapp.js
If everything is fine, you should get the following output:
Server running at http://localhost:8000/
Press CTRL+C to stop the application.
Step 3 - Create a Systemd Service File for Nodejs
Next, you will need to create a systemd service file to manage the Node.js service. You can create it with the following command:
nano /lib/systemd/system/nodeapp.service
Add the following lines:
[Unit]
Description=Node.js Application
After=syslog.target network.target
[Service]
Type=simple
User=root
WorkingDirectory=/root/project
Environment=NODE_ENV=production
ExecStart=/usr/bin/node nodeapp.js
Restart=always
[Install]
WantedBy=multi-user.target
Save the file when you are finished, then reload the systemd daemon to apply the configuration changes:
systemctl daemon-reload
Next, start the nodeapp service and enable it so that it can start automatically at system reboot:
systemctl start nodeapp
systemctl enable nodeapp
Next, verify the status of the nodeapp service by running the following command:
systemctl status nodeapp
You should see the following output:
● nodeapp.service - Node.js Application
Loaded: loaded (/usr/lib/systemd/system/nodeapp.service; disabled; preset: enabled)
Active: active (running) since Fri 2025-05-16 07:10:05 UTC; 4s ago
Main PID: 79449 (node)
Tasks: 11 (limit: 629145)
Memory: 8.3M (peak: 9.1M)
CPU: 44ms
CGroup: /system.slice/nodeapp.service
└─79449 /usr/bin/node nodeapp.js
May 16 07:10:05 cyber.example.com systemd[1]: Started nodeapp.service - Node.js Application.
May 16 07:10:05 cyber.example.com node[79449]: Server running at http://localhost:8000/
Step 4 - Configure Apache as a Reverse Proxy
First, install the Apache package with the following command:
apt-get install apache2 -y
Next, create an Apache virtual host configuration file for Node.js:
nano /etc/apache2/sites-available/nodeapp.conf
Add the following lines:
ServerName your-server-ip
ProxyRequests Off
ProxyPreserveHost On
ProxyVia Full
Require all granted
ProxyPass / http://127.0.0.1:8000/
ProxyPassReverse / http://127.0.0.1:8000/
Save and close the file, then enable the virtual host configuration file:
a2ensite nodeapp.conf
Next, disable the default virtual host configuration file and enable the required proxy modules with the following command:
a2dissite 000-default
a2enmod proxy proxy_http rewrite headers expires
Finally, restart the Apache service to apply the changes:
systemctl restart apache2
Step 5 - Access Nodejs Application
Now, open your web browser and access your Node.js application using the URL http://your-server-ip. You should see your application in the following page:
Conclusion
In the above guide, you learned how to configure Apache as a reverse proxy for the Node.js application. This will help you to host your Node.js application from the local system to the production environment - try it on your dedicated hosting account from Atlantic.Net.
Learn more about our dedicated servers.
### How to Set Up HTTP Strict Transport Security (HSTS) for Apache on Ubuntu
HTTP Strict Transport Security (HSTS) is a web security policy mechanism used for securing HTTPS websites against downgrade attacks. HSTS prevents your web browser from accessing the website over non-HTTPS connections.
After installing SSL, some websites contain pages that serve requests over HTTP. In that case, to avoid the usage of HTTP protocol HSTS header was introduced, it forces your website to redirect URL from HTTP to HTTPS.
In this post, we will show you how to enable HTTP Strict Transport Security (HSTS) for Apache on Ubuntu. This procedure is compatible with Ubuntu 22.04 and Ubuntu 24.04.
Step 1 - Install and Configure Apache
For the purpose of this tutorial, you will need to install the Apache webserver and create a virtual host configuration file to host a website.
First, install the Apache webserver with the following command:
apt-get install apache2 -y
Once the installation is completed, create a new apache virtual host configuration file for domain test.example.com.
nano /etc/apache2/sites-available/test.conf
Add the following lines:
ServerName test.example.com
ServerAdmin webmaster@example.com
DocumentRoot /var/www/html/
DirectoryIndex index.html
Save and close the file, then enable the virtual host with the following command:
a2ensite test.conf
Next, restart the Apache to apply the changes:
systemctl restart apache2
Step 2 - Secure Apache with Let's Encrypt SSL
Next, you will need to install the Certbot client to secure your website with SSL. You can install the Certbot client for Apache with the following command:
apt-get install python3-certbot-apache -y
Once the installation is completed, run the following command to install Let's Encrypt SSL for your website test.example.com.
certbot --apache -d test.example.com
You will be asked to provide your email and accept the term of service:
Saving debug log to /var/log/letsencrypt/letsencrypt.log
Plugins selected: Authenticator apache, Installer apache
Enter email address (used for urgent renewal and security notices) (Enter 'c' to
cancel): hitjethva@gmail.com
- - - - - - - - - - - - - - - - - - - - - - - - - - - - - - - - - - - - - - - -
Please read the Terms of Service at
https://letsencrypt.org/documents/LE-SA-v1.2-November-15-2017.pdf. You must
agree in order to register with the ACME server at
https://acme-v02.api.letsencrypt.org/directory
- - - - - - - - - - - - - - - - - - - - - - - - - - - - - - - - - - - - - - - -
(A)gree/(C)ancel: A
- - - - - - - - - - - - - - - - - - - - - - - - - - - - - - - - - - - - - - - -
Would you be willing to share your email address with the Electronic Frontier
Foundation, a founding partner of the Let's Encrypt project and the non-profit
organization that develops Certbot? We'd like to send you email about our work
encrypting the web, EFF news, campaigns, and ways to support digital freedom.
- - - - - - - - - - - - - - - - - - - - - - - - - - - - - - - - - - - - - - - -
(Y)es/(N)o: Y
Obtaining a new certificate
Performing the following challenges:
http-01 challenge for test.example.com
Waiting for verification...
Cleaning up challenges
Created an SSL vhost at /etc/apache2/sites-available/test-le-ssl.conf
Enabled Apache socache_shmcb module
Enabled Apache ssl module
Deploying Certificate to VirtualHost /etc/apache2/sites-available/test-le-ssl.conf
Enabling available site: /etc/apache2/sites-available/test-le-ssl.conf
Next, you will need to select whether or not to redirect HTTP traffic to HTTPS:
Please choose whether or not to redirect HTTP traffic to HTTPS, removing HTTP access.
- - - - - - - - - - - - - - - - - - - - - - - - - - - - - - - - - - - - - - - -
1: No redirect - Make no further changes to the webserver configuration.
2: Redirect - Make all requests redirect to secure HTTPS access. Choose this for
new sites, or if you're confident your site works on HTTPS. You can undo this
change by editing your web server's configuration.
- - - - - - - - - - - - - - - - - - - - - - - - - - - - - - - - - - - - - - - -
Select the appropriate number [1-2] then [enter] (press 'c' to cancel): 2
Type 2 and hit Enter to finish the installation:
Redirecting vhost in /etc/apache2/sites-enabled/test.conf to ssl vhost in /etc/apache2/sites-available/test-le-ssl.conf
- - - - - - - - - - - - - - - - - - - - - - - - - - - - - - - - - - - - - - - -
Congratulations! You have successfully enabled https://test.example.com
You should test your configuration at:
https://www.ssllabs.com/ssltest/analyze.html?d=test.example.com
- - - - - - - - - - - - - - - - - - - - - - - - - - - - - - - - - - - - - - - -
IMPORTANT NOTES:
- Congratulations! Your certificate and chain have been saved at:
/etc/letsencrypt/live/test.example.com/fullchain.pem
Your key file has been saved at:
/etc/letsencrypt/live/test.example.com/privkey.pem
Your cert will expire on 2021-06-22. To obtain a new or tweaked
version of this certificate in the future, simply run certbot again
with the "certonly" option. To non-interactively renew *all* of
your certificates, run "certbot renew"
- Your account credentials have been saved in your Certbot
configuration directory at /etc/letsencrypt. You should make a
secure backup of this folder now. This configuration directory will
also contain certificates and private keys obtained by Certbot so
making regular backups of this folder is ideal.
- If you like Certbot, please consider supporting our work by:
Donating to ISRG / Let's Encrypt: https://letsencrypt.org/donate
Donating to EFF: https://eff.org/donate-le
- We were unable to subscribe you the EFF mailing list because your
e-mail address appears to be invalid. You can try again later by
visiting https://act.eff.org.
Your website test.example.com is now secured with Let's Encrypt SSL.
Step 3 - Enable HSTS Header
Next, you will need to activate the HSTS header within your website virtual host configuration file.
Edit your website virtual host configuration file:
nano /etc/apache2/sites-enabled/test-le-ssl.conf
Add the following line below the first line:
Header always set Strict-Transport-Security "max-age=31536000; includeSubDomains"
Save and close the file then restart the Apache service to apply the changes.
systemctl restart apache2
Step 4 - Verify HSTS Header
At this point, your website is configured with HSTS header. Now you should verify whether the HSTS header is activated or not.
You can verify it with the following command:
curl -s -D- https://test.example.com/ | grep -i Strict
If everything is fine, you should get the following output:
Strict-Transport-Security: max-age=31536000; includeSubDomains
You can also verify it using the URL ssl labs.
Conclusion
In the above guide, you learned how to enable HSTS header for Apache on Ubuntu 24.04. Your website is now secured with HSTS and it can be accessed only through HTTPS protocol. Try it on your dedicated server hosting account from Atlantic.Net.
### How to Install Icecast Audio Streaming Server on Ubuntu
Icecast is an open-source audio/video streaming server that can be used to create your Internet radio stations. It supports Ogg, Opus, WebM, and MP3 streaming formats. You can also stream your media from your server and access it over the internet. It is optimized for MP3 streaming and allows to handle large music collections.
In this tutorial, we will show you how to install Icecast Audio Streaming Server on Ubuntu. This procedure is compatible with Ubuntu 22.04 and Ubuntu 24.04.
Step 1 - Install Icecast
By default, the Icecast package is available in the Ubuntu 24.04 default repository. You can install it by just running the following command:
apt-get install icecast2 -y
During the installation, you will be asked to configure Icecast as shown below:
Select Yes and hit Enter to continue. You will be asked to provide a fully qualified domain name:
Provide your valid domain name and hit Enter to continue. You will be asked to set the password to control access to media resources:
Provide your password and hit Enter to continue. You will be asked to set a password to control access to stream relays:
Provide your password and hit Enter to continue. You will be asked to set your administrator password:
Provide your password and hit Enter to finish the installation.
Once Icecast is installed, start the Icecast service and enable it to start at system reboot with the following command:
systemctl start icecast2
systemctl enable icecast2
At this point, Icecast is started and listening on port 8000. You can check it with the following command:
ss -tunelp | grep 8000
You should get the following output:
tcp LISTEN 0 5 0.0.0.0:8000 0.0.0.0:*
users:(("icecast2",pid=1264,fd=4)) uid:108 ino:20678 sk:8 <->
Step 2 - Configure Nginx as a Reverse Proxy for Icecast
Next, you will need to install and configure Nginx as a reverse proxy to access Icecast.
First, install the Nginx server with the following command:
apt-get install nginx -y
Once installed, create an Nginx virtual host configuration file:
nano /etc/nginx/sites-available/icecast.conf
Add the following lines:
server {
listen 80;
listen [::]:80;
server_name icecast.example.com;
access_log /var/log/nginx/access.log;
error_log /var/log/nginx/error.log;
location / {
proxy_pass http://localhost:8000;
}
}
Save and close the file, then enable the virtual host with the following command:
ln -s /etc/nginx/sites-available/icecast.conf /etc/nginx/sites-enabled/
Next, you will also need to set hash bucket size in Nginx main configuration file:
nano /etc/nginx/nginx.conf
Add the following line inside http {:
server_names_hash_bucket_size 64;
Save and close the file, then restart the Nginx service to apply the changes:
systemctl restart nginx
Step 3 - Access Icecast Web UI
Now, open your web browser and access the Icecast web interface using the URL http://icecast.example.com. You should see the Icecast dashboard on the following page:
Click on the Administration tab. You will be redirected to the Icecast login page:
Provide your admin username and password and click on the Sign-in button. You should see your Icecast admin dashboard on the following page:
Conclusion
Congratulations! You have successfully installed and configured the Icecast streaming server on Ubuntu 24.04. You can now install the Icecast application on your computer or mobile devices and access your music from everywhere. Install Icecast on dedicated server hosting from Atlantic.Net and start using it today!
### How to Set and Change Hostname in Rocky Linux
When working in the local environment, each system is assigned an IP address to distinguish them from one another on the LAN. However, it is very difficult to remember each host by their IP address, especially in a large environment. In this case, we can assign a unique hostname to each machine to remember them easily. Hostname also allows each machine to communicate using the device name rather than the IP address.
This post will show you how to set and change the hostname in Rocky Linux. This procedure is compatible with Rocky Linux 8 and Rocky Linux 9.
Step 1 - Check Your Current Hostname
Before setting up a hostname, it is important to check the current hostname of your system.
You can check it using the following command:
hostnamectl
You should see the current hostname of your system in the following output:
Static hostname: vyompc
Icon name: computer-laptop
Chassis: laptop
Machine ID: cfefe3a7c8694e51879fb521a2021b2e
Boot ID: ef565102d26f4edfb9cadd816eb99419
Operating System: Rocky Linux 8.4 ( Green Obsidian )
Kernel: Linux 5.4.0-99-generic
Architecture: x86-64
As you can see, the current hostname of your system is vyompc.
Also Read
How to Set Path in Linux
Step 2 - Change the Hostname Temporarily
If you want to change the hostname of your system temporarily, you can use the following syntax:
hostname new-hostname
After a system restart or logging out, the set hostname will return to the previous one.
For example, to change the hostname to newpc, run the following command:
hostname newpc
Step 3 - Change the Hostname Permanently
You can use the hostnamectl command to change your system hostname permanently. Use the following syntax to change the hostname permanently:
hostnamectl set-hostname new-hostname
For example, to change the hostname of your system to newpc, run the following command:
hostnamectl set-hostname newpc
After running the above command, you can confirm the new hostname using the following command:
hostnamectl
Step 4 - Change the Hostname Using /etc/hostname File
You can also change the hostname by editing the hostname configuration file. In this case, you will need to restart your system to apply the changes.
To change the hostname, edit the /etc/hostname file:
nano /etc/hostname
Replace the old hostname with a new hostname:
newpc
Save and close the file, then restart your system to apply the changes:
reboot
Also Read
How to Change or Set User Password in Linux
Step 5 - Change the Hostname Using NMTUI Tool
You can also change the system hostname using the NMTUI tool.
To change the system hostname, open the command line interface and run the following command:
nmtui
You should see the following dialog box:
Select Set system hostname and press the Enter key. You should see the following dialog box:
Type your new hostname and click on the OK. You should see the following dialog box:
Click on the OK button to change the hostname.
Conclusion
In this guide, we explained several methods to change the hostname of your Rocky Linux 8. You can now use your preferred method to change your system hostname. Try it on dedicated hosting from Atlantic.Net!
### How to Install And Setup Suricata IDS on Ubuntu
Suricata is a free, open-source, robust network threat detection engine developed by the Open Security Foundation. It is capable of real-time intrusion detection, intrusion prevention, and network security monitoring. Suricata comes with a powerful rule set that inspects the network traffic and detects complex threats. It supports all major operating systems including Linux, Windows, FreeBSD, and macOS, and also supports IPv4, IPv6, SCTP, ICMPv4, ICMPv6, and GRE.
In this tutorial, we will show you how to install and configure Suricata IDS on Ubuntu. This procedure is compatible with Ubuntu 20.04 and Ubuntu 22.04.
Step 1 - Install Required Dependencies
First, you will need to install some dependencies required to compile Suricata from the source. You can install all of them with the following command:
apt-get update -yapt-get install rustc cargo make libpcre3 libpcre3-dbg libpcre3-dev build-essential autoconf automake libtool libpcap-dev libpcre2-dev libnet1-dev libyaml-0-2 libyaml-dev zlib1g zlib1g-dev libcap-ng-dev libcap-ng0 make libmagic-dev libjansson-dev libjansson4 pkg-config -y
By default, Suricata functions as an intrusion detection system (IDS). If you want to include intrusion prevention system (IPS) functionality, then you will need to install some more packages in your system. You can install them with the following command:
apt-get install libnetfilter-queue-dev libnetfilter-queue1 libnfnetlink-dev libnfnetlink0 -y
Once all the packages are installed, you will need to install the suricata-update tool to update the Suricata rules. You can install it with the following commands:
apt-get install python3-pip pip3 install --upgrade suricata-update ln -s /usr/local/bin/suricata-update /usr/bin/suricata-update
Step 2 - Install Suricata
First, download the latest version of Suricata from their official website with the following command:
wget https://www.openinfosecfoundation.org/download/suricata-5.0.3.tar.gz
Once the download is completed, extract the downloaded file with the following command:
tar -xvzf suricata-5.0.3.tar.gz
Next, change the directory to the extracted directory and configure it with the following command:
cd suricata-5.0.3
./configure --enable-nfqueue --prefix=/usr --sysconfdir=/etc --localstatedir=/var
Next, install the Suricata with the following command:
make
make install-full
Note: This process will take over 10 minutes
Next, install all rules with the following command:
make install-rules
By default, all rules are located at /var/lib/suricata/rules/suricata.rules:
You can see it with the following command:
cat /var/lib/suricata/rules/suricata.rules
Step 3 - Configure Suricata
The default Suricata configuration file is located at /etc/suricata/suricata.yaml. You will need to configure it to protect your internal network. You can do it by editing the file:
nano /etc/suricata/suricata.yaml
Change the following lines:
HOME_NET: "[192.168.1.0/24]"
EXTERNAL_NET: "!$HOME_NET"
Save and close the file when you are finished.
Note: In the command above, replace 192.168.1.0/24 with your internal network.
Step 4 - Test Suricata Against DDoS
Before starting, you will need to disable packet offload features on the network interface on which Suricata is listening.
First, install ethtool package with the following command:
apt-get install ethtool -y
Next, disable packet offload with the following command:
ethtool -K eth0 gro off lro off
Next, run the Suricata in NFQ mode with the following command:
suricata -c /etc/suricata/suricata.yaml -q 0 &
Next, go to the remote system and perform a simple DDoS attack test against the Suricata server using the hping3 tool as shown below:
hping3 -S -p 80 --flood --rand-source your-server-ip
On the Suricata server, check the Suricata logs with the following command:
tail -f /var/log/suricata/fast.log
You should see the following output:
09/17/2020-07:29:52.934009 [**] [1:2402000:5670] ET DROP Dshield Block Listed Source group 1 [**] [Classification: Misc Attack] [Priority: 2] {TCP} 167.248.133.70:18656 -> your-server-ip:9407
Conclusion
Congratulations! You have successfully installed and configured Suricata IDS and IPS on Ubuntu 20.04 server. You can now explore the Suricata and create your own rules to protect your server from DDoS attack. Get started with Suricata on VPS Hosting from Atlantic.Net, and for more information, visit the Suricata documentation page.
### How to Install Python 3.10 on Rocky Linux
The free and open-source programming language Python is one of the most popular high-level languages and object-oriented applications. Generally, it is used in automation, scripting, data analysis, machine learning, back-end development, handling big data, and performing complex mathematics. Due to its versatile features, it is a popular choice for both beginners and experienced developers. At the time of writing this article, Python 3.10 is the latest version of Python.
In this post, we will show you how to install Python 3.10 on Rocky Linux. This procedure is compatible with Rocky Linux 8 and Rocky Linux 9.
Step 1 - Install Required Dependencies
First, you will need to install some dependencies required to compile Python 3.10. You can install all of them by running the following command:
dnf install tar curl gcc openssl-devel bzip2-devel libffi-devel zlib-devel wget make -y
Once all the dependencies are installed, you can proceed to the next step.
Step 2 - Install Python 3.10 on Rocky Linux
First, go to the Python official download page and download the latest version of Python using the following command:
wget https://www.python.org/ftp/python/3.10.0/Python-3.10.0.tar.xz
Once the download is completed, extract the downloaded file using the following command:
tar -xf Python-3.10.0.tar.xz
Next, change the directory to the extracted directory and configure Python using the following command:
cd Python-3.10.0
./configure --enable-optimizations
Next, start the build process using the following command:
make -j 2
nproc
Finally, install Python 3.10 by running the following command:
make altinstall
After the successful installation, verify the Python installation using the following command:
python3.10 --version
You will get the following output:
Python 3.10.0
Step 3 - Create a Virtual Environment in Python
Python provides a venv module that allows you to create a virtual environment and deploy your application in an isolated environment.
To create a virtual environment named app_env, run the following command:
python3.10 -m venv app_env
Next, activate the virtual environment using the following command:
source app_env/bin/activate
You will get the following shell:
(app_env) [root@RockyLinux8 ~]#
Now, you can use the PIP package manager to install any package and dependencies inside your virtual environment.
For example, run the following command to install apache-airflow:
pip3.10 install apache-airflow
If you want to remove this package, run the command below:
pip3.10 uninstall apache-airflow
To exit from the Python virtual environment, run the following command:
deactivate
Conclusion
In the above guide, we explained how to install Python 3.10 on Rocky Linux 8. You can now start developing your first application using the Python programming language. Try it today on VPS hosting from Atlantic.Net!
### Install eSpeak on Ubuntu
eSpeak is free and open-source software that can be used to convert text to voice in English and other languages. It can be installed on Windows and Linux-based operating systems. eSpeak takes input from the string or files and generates an audio format file. You can play this file using any player.
In this tutorial, we will show you how to install eSpeak on an Ubuntu 24.04 server. This procedure is compatible with Ubuntu 22.04 and Ubuntu 24.04.
Step 1 - Install eSpeak
By default, this tool is available in all major Linux distributions. You can install it by just running the following command:
apt-get install espeak -y
Once the installation is finished, verify the installed version of eSpeak with the following command:
espeak --version
You should get the following output:
eSpeak text-to-speech: 1.48.15 16.Apr.15 Data at: /usr/lib/x86_64-linux-gnu/espeak-data
Step 2 - Generate Audio File with eSpeak
Now, let's speak the line "Hi Welcome to eSpeak" and record it to the file1.mp4 audio file:
espeak "Hi Welcome to eSpeak" -w file1.mp4 -g 60 -p 70 -s 100 -v en-us
You can now play the file1.mp4 using any audio player.
You can also specify the text file that you want to record in the mp4 format.
First, create a sample file named file.txt:
nano file.txt
Add the following contents:
Atlantic Cloud offers hosting solutions customized to your business needs including cloud,
managed, dedicated, HIPAA compliant, and more.
Save and close the file when you are finished.
Next, run the following command to convert file.txt to the mp4 audio format file named file2.mp4:
espeak -f file.txt -w file2.mp4 -g 60 -p 70 -s 100 -v en-us
You can now download file1.mp4 and file2.mp4 to your desktop computer and play both file to test.
Conclusion
In the above guide, you learned how to install eSpeak on Ubuntu 24.04. You can now easily convert any text file into an audio file. Try it today on dedicated server hosting from Atlantic.Net!
### How to Install ClamAV on Ubuntu and Scan for Vulnerabilities
ClamAV is free and open-source antivirus software that can be used to find trojans and malicious software and other viruses in your system. It is simple, easy to use, and capable to scan over one million viruses and trojans. ClamAV supports various archive formats including Tar, Gzip, Zip, Bzip2, OLE2, Cabinet, CHM, BinHex, SIS, and also supports all mail file formats. It comes with several in-built tools, including a multi-threaded daemon and command-line interface to update the database automatically.
In this tutorial, we will explain how to install and use ClamAV on Ubuntu. This procedure is compatible with Ubuntu 22.04 and Ubuntu 24.04.
Step 1 - Install ClamAV
By default, the ClamAV package is available in the Ubuntu 24.04 default repository. You can install it with the following command:
apt-get install clamav clamav-daemon -y
Once the ClamAV has been installed, you can proceed to update the virus database.
Step 2 - Update the Virus Database
Next, you will need to update the virus database in order for scanning to work. You can update it over the internet using the freshclam command.
Before updating the database, you will need to stop the clamav-freshclam service. You can stop it with the following command:
systemctl stop clamav-freshclam
Next, update the database using the following command:
freshclam
Once the database is updated, you should get the following output:
ClamAV update process started at Sat May 24 06:56:25 2025
Sat May 24 06:56:25 2025 -> daily database available for download (remote version: 27647)
Time: 1.8s, ETA: 0.0s [========================>] 61.67MiB/61.67MiB
Testing database: '/var/lib/clamav/tmp.b9c6b8fb47/clamav-2d3a596f4aab3c1b28c30f9e4a4accc4.tmp-daily.cvd' ...
Database test passed.
Sat May 24 06:56:47 2025 -> daily.cvd updated (version: 27647, sigs: 2075674, f-level: 90, builder: raynman)
Sat May 24 06:56:47 2025 -> main database available for download (remote version: 62)
Time: 4.0s, ETA: 0.0s [========================>] 162.58MiB/162.58MiB
Testing database: '/var/lib/clamav/tmp.b9c6b8fb47/clamav-63c6479294bf2cb9051abd5fd68e6589.tmp-main.cvd' ...
Database test passed.
Sat May 24 06:57:14 2025 -> main.cvd updated (version: 62, sigs: 6647427, f-level: 90, builder: sigmgr)
Sat May 24 06:57:14 2025 -> bytecode database available for download (remote version: 336)
Time: 0.1s, ETA: 0.0s [========================>] 277.52KiB/277.52KiB
Testing database: '/var/lib/clamav/tmp.b9c6b8fb47/clamav-6b76e971e17cfc5e0258c20a5d6436e9.tmp-bytecode.cvd' ...
Database test passed.
Sat May 24 06:57:15 2025 -> bytecode.cvd updated (version: 336, sigs: 83, f-level: 90, builder: nrandolp)
Next, start the clamav-freshclam service and enable it to start at system reboot with the following command:
systemctl start clamav-freshclam
systemctl enable clamav-freshclam
By default, freshclam stores all databases inside /var/lib/clamav/ directory. You can list them with the following command:
ls /var/lib/clamav/
You should get the following output:
bytecode.cvd daily.cvd main.cvd
Step 3 - Use Clamscan to Scan the Directory
Clamscan is used to scan files and directories for viruses and delete them immediately.
The basic syntax of Clamscan is shown below:
clamscan [options] [files-or-directories]
A brief explanation of most commonly used options are shown below:
--infected : This option display a list of all infected files.
--remove : This option removes all infected files from your system.
--recursive : This option will scan all directories and sub-directories.
For example, you can scan the /etc directory with the following command:
clamscan --infected --remove --recursive /etc
You should see the following output:
----------- SCAN SUMMARY -----------
Known viruses: 8707441Engine version: 1.0.8Scanned directories: 305Scanned files: 1200Infected files: 0Data scanned: 4.56 MBData read: 2.14 MB (ratio 2.13:1)Time: 67.366 sec (1 m 7 s)Start Date: 2025:05:24 07:00:51End Date: 2025:05:24 07:01:59
You can print all available option with clamscan using the following command:
clamscan -h
You should get the following output:
Clam AntiVirus: Scanner 0.102.4
By The ClamAV Team: https://www.clamav.net/about.html#credits
(C) 2020 Cisco Systems, Inc.
clamscan [options] [file/directory/-]
--help -h Show this help
--version -V Print version number
--verbose -v Be verbose
--archive-verbose -a Show filenames inside scanned archives
--debug Enable libclamav's debug messages
--quiet Only output error messages
--stdout Write to stdout instead of stderr. Does not affect 'debug' messages.
--no-summary Disable summary at end of scanning
--infected -i Only print infected files
--suppress-ok-results -o Skip printing OK files
--bell Sound bell on virus detection
--tempdir=DIRECTORY Create temporary files in DIRECTORY
--leave-temps[=yes/no(*)] Do not remove temporary files
--gen-json[=yes/no(*)] Generate JSON description of scanned file(s). JSON will be printed and also-
dropped to the temp directory if --leave-temps is enabled.
--database=FILE/DIR -d FILE/DIR Load virus database from FILE or load all supported db files from DIR
--official-db-only[=yes/no(*)] Only load official signatures
--log=FILE -l FILE Save scan report to FILE
--recursive[=yes/no(*)] -r Scan subdirectories recursively
--allmatch[=yes/no(*)] -z Continue scanning within file after finding a match
--cross-fs[=yes(*)/no] Scan files and directories on other filesystems
--follow-dir-symlinks[=0/1(*)/2] Follow directory symlinks (0 = never, 1 = direct, 2 = always)
--follow-file-symlinks[=0/1(*)/2] Follow file symlinks (0 = never, 1 = direct, 2 = always)
--file-list=FILE -f FILE Scan files from FILE
--remove[=yes/no(*)] Remove infected files. Be careful!
--move=DIRECTORY Move infected files into DIRECTORY
--copy=DIRECTORY Copy infected files into DIRECTORY
--exclude=REGEX Don't scan file names matching REGEX
--exclude-dir=REGEX Don't scan directories matching REGEX
--include=REGEX Only scan file names matching REGEX
--include-dir=REGEX Only scan directories matching REGEX
--bytecode[=yes(*)/no] Load bytecode from the database
--bytecode-unsigned[=yes/no(*)] Load unsigned bytecode
--bytecode-timeout=N Set bytecode timeout (in milliseconds)
--statistics[=none(*)/bytecode/pcre] Collect and print execution statistics
--detect-pua[=yes/no(*)] Detect Possibly Unwanted Applications
--exclude-pua=CAT Skip PUA sigs of category CAT
--include-pua=CAT Load PUA sigs of category CAT
--detect-structured[=yes/no(*)] Detect structured data (SSN, Credit Card)
--structured-ssn-format=X SSN format (0=normal,1=stripped,2=both)
--structured-ssn-count=N Min SSN count to generate a detect
--structured-cc-count=N Min CC count to generate a detect
--scan-mail[=yes(*)/no] Scan mail files
--phishing-sigs[=yes(*)/no] Enable email signature-based phishing detection
--phishing-scan-urls[=yes(*)/no] Enable URL signature-based phishing detection
--heuristic-alerts[=yes(*)/no] Heuristic alerts
--heuristic-scan-precedence[=yes/no(*)] Stop scanning as soon as a heuristic match is found
--normalize[=yes(*)/no] Normalize html, script, and text files. Use normalize=no for yara compatibility
--scan-pe[=yes(*)/no] Scan PE files
--scan-elf[=yes(*)/no] Scan ELF files
--scan-ole2[=yes(*)/no] Scan OLE2 containers
--scan-pdf[=yes(*)/no] Scan PDF files
--scan-swf[=yes(*)/no] Scan SWF files
--scan-html[=yes(*)/no] Scan HTML files
--scan-xmldocs[=yes(*)/no] Scan xml-based document files
--scan-hwp3[=yes(*)/no] Scan HWP3 files
--scan-archive[=yes(*)/no] Scan archive files (supported by libclamav)
--alert-broken[=yes/no(*)] Alert on broken executable files (PE & ELF)
--alert-encrypted[=yes/no(*)] Alert on encrypted archives and documents
--alert-encrypted-archive[=yes/no(*)] Alert on encrypted archives
--alert-encrypted-doc[=yes/no(*)] Alert on encrypted documents
--alert-macros[=yes/no(*)] Alert on OLE2 files containing VBA macros
--alert-exceeds-max[=yes/no(*)] Alert on files that exceed max file size, max scan size, or max recursion limit
--alert-phishing-ssl[=yes/no(*)] Alert on emails containing SSL mismatches in URLs
--alert-phishing-cloak[=yes/no(*)] Alert on emails containing cloaked URLs
--alert-partition-intersection[=yes/no(*)] Alert on raw DMG image files containing partition intersections
--nocerts Disable authenticode certificate chain verification in PE files
--dumpcerts Dump authenticode certificate chain in PE files
--max-scantime=#n Scan time longer than this will be skipped and assumed clean
--max-filesize=#n Files larger than this will be skipped and assumed clean
--max-scansize=#n The maximum amount of data to scan for each container file (**)
--max-files=#n The maximum number of files to scan for each container file (**)
--max-recursion=#n Maximum archive recursion level for container file (**)
--max-dir-recursion=#n Maximum directory recursion level
--max-embeddedpe=#n Maximum size file to check for embedded PE
--max-htmlnormalize=#n Maximum size of HTML file to normalize
--max-htmlnotags=#n Maximum size of normalized HTML file to scan
--max-scriptnormalize=#n Maximum size of script file to normalize
--max-ziptypercg=#n Maximum size zip to type reanalyze
--max-partitions=#n Maximum number of partitions in disk image to be scanned
--max-iconspe=#n Maximum number of icons in PE file to be scanned
--max-rechwp3=#n Maximum recursive calls to HWP3 parsing function
--pcre-match-limit=#n Maximum calls to the PCRE match function.
--pcre-recmatch-limit=#n Maximum recursive calls to the PCRE match function.
--pcre-max-filesize=#n Maximum size file to perform PCRE subsig matching.
--disable-cache Disable caching and cache checks for hash sums of scanned files.
Conclusion
In the above guide, you learned how to install ClamAV and use it to remove the various types of viruses from your systems. You should now have enough knowledge to use ClamAV in the production environment to clean the system. Get started with ClamAV today on VPS Hosting from Atlantic.Net!
### How to Configure Postfix as a Send-Only SMTP Server on Ubuntu
A mail server is handy when you own a website or web application and want to send transactional emails to users. Postfix is a free and open-source Mail Transfer Agent used to send and receive emails. Postfix is free, so you don't need to rely on third-party service providers like Sendgrid or Pepipost. You can easily install and configure Postfix to send emails through your local application.
This post will show you how to install and configure Postfix as a Send-Only SMTP server on Ubuntu. This procedure is compatible with Ubuntu 22.04 and Ubuntu 24.04.
Step 1 - Setup Hostname
Before starting, you must set up a fully qualified hostname on your server. You can set it up with the following command:
hostnamectl set-hostname email.linuxbuz.com
Next, edit the/etc/hosts file and add the following line:
nano /etc/hosts
Add the following line:
your-server-ip email.linuxbuz.com
Save and close the file when you are finished.
Step 2 - Install Postfix
The simplest and easiest way to install Postfix is to install a mailutils package to your system.
You can install the mailutils package using the following command:
apt-get install mailutils -y
After the installation, run the following command to configure Postfix:
dpkg-reconfigure postfix
You will be asked to select the type of mail configuration as shown below:
Select Internet Site and hit Enter. You will be asked to provide your mail name as shown below:
Provide your domain name and hit Enter to finish the installation.
Next, check the status of Postfix using the following command:
systemctl status postfix
Step 3 - Configure Postfix as a Send-Only SMTP Server
Next, you must configure Postfix to send an email from the local host. You can configure it by editing the Postfix main configuration file:
nano /etc/postfix/main.cf
Change the following line:
inet_interfaces = loopback-only
Save and close the file, then set the hostname directly in the Postfix configuration file using the following command:
postconf -e "myhostname = email.linuxbuz.com"
Next, verify your configured domain name using the following command:
postconf mydomain
You should get the following output:
mydomain = email.linuxbuz.com
You must verify the default domain name appended to sender and recipient addresses.
postconf myorigin
Sample output:
myorigin = /etc/mailname
Next, display the content of the above file using the following command:
cat /etc/mailname
You should see your domain in the following output:
email.linuxbuz.com
Finally, restart the Postfix service to apply the changes:
systemctl restart postfix
You can also check the status of Postfix with the following command:
systemctl status postfix
Sample output:
● postfix.service - Postfix Mail Transport Agent
Loaded: loaded (/lib/systemd/system/postfix.service; enabled; vendor preset: enabled)
Active: active (exited) since Sun 2021-08-15 12:52:44 UTC; 9s ago
Process: 4230 ExecStart=/bin/true (code=exited, status=0/SUCCESS)
Main PID: 4230 (code=exited, status=0/SUCCESS)
Aug 15 12:52:44 ubuntu2004 systemd[1]: Starting Postfix Mail Transport Agent...
Aug 15 12:52:44 ubuntu2004 systemd[1]: Finished Postfix Mail Transport Agent.
Step 4 - Verify Postfix Server
At this point, Postfix is installed and configured as a send-only SMTP server. Now, it's time to send emails to an external email account.
You can use the following command to send a simple email to the external email address:
echo "This is the body of the email" | mail -s "This is the subject line" user@yourdomain.com
You should now see the message in your Inbox or Spam folder.
Step 5 - Forward System Mail
Forwarding all system mail to your external email address is a good idea. This section will set up email forwarding for the root user.
Edit the /etc/aliases file:
nano /etc/aliases
Find the following line:
postmaster: root
And replace it with the next line:
root: user@yourdomain.com
Save and close the file, then run the following command to apply the changes:
newaliases
Now, verify email forwarding by sending an email to the root user:
echo "This new email" | mail -s "This is new email" root
If everything is fine, you should receive an email at your external email address.
Conclusion
Congratulations! You have successfully set up a Postfix as a send-only SMTP server. You can now use this setup with your application to notify your users via email. Give it a try on your VPS from Atlantic.Net!
### How to Set up APT-Caching Server Using Apt-Cacher NG on Ubuntu
Apt-Cacher NG is a caching proxy server for Debian-based Linux distributions including Ubuntu, Debian, Linux Mint, etc. It creates a local cache of the Debian mirrors and other Linux distributions. When you use the apt command to install any package, the package is pulled from the official repositories, and the APT cache server caches that package in the system. When you install the same package again, it will download that package from the local caching server. This will save you a lot of time and internet bandwidth.
In this post, we will explain how to set up an APT-Caching server using Apt-Cacher NG on Ubuntu. This procedure is compatible with Ubuntu 22.04 and Ubuntu 24.04.
Step 1 - Install Apt-Cacher-NG
By default, the Apt-Cacher-NG package is included in the Ubuntu default repository. You can install it using the following command:
apt-get update -y
apt-get install apt-cacher-ng -y
Once the Apt-Cacher-NG package is installed, start the Apt-Cacher-NG service and enable it to start at system reboot:
systemctl start apt-cacher-ng
systemctl enable apt-cacher-ng
You can check the status of Apt-Cacher-NG with the following command:
systemctl status apt-cacher-ng
Sample output:
● apt-cacher-ng.service - Apt-Cacher NG software download proxy
Loaded: loaded (/usr/lib/systemd/system/apt-cacher-ng.service; enabled; preset: enabled)
Active: active (running) since Sat 2025-05-24 06:30:37 AST; 10s ago
Main PID: 490755 (apt-cacher-ng)
Tasks: 1 (limit: 4609)
Memory: 2.1M (peak: 2.3M)
CPU: 17ms
CGroup: /system.slice/apt-cacher-ng.service
└─490755 /usr/sbin/apt-cacher-ng -c /etc/apt-cacher-ng ForeGround=1
By default, Apt-Cacher-NG listens on port 3142. You can check it with the following command:
ss -altnp | grep apt
Sample output:
LISTEN 0 250 0.0.0.0:3142 0.0.0.0:* users:(("apt-cacher-ng",pid=3748,fd=10))
LISTEN 0 250 [::]:3142 [::]:* users:(("apt-cacher-ng",pid=3748,fd=11))
Step 2 - Configure Apt-Cacher-NG
By default, Apt-Cacher NG does not serve HTTPS repositories, so you will need to enable it. To do so edit the Apt-Cacher-NG default configuration file:
nano /etc/apt-cacher-ng/acng.conf
Uncomment the following line:
PassThroughPattern: .*
Save and close the file, then restart the Apt-Cacher-NG service to apply the changes:
systemctl restart apt-cacher-ng
Step 3 - Configure Client System to use Apt-Cacher NG
By default, all Ubuntu system uses Ubuntu repository to download and install packages, so you will need to configure your client system to use Apt-Cacher NG for package installation.
To do so, create a new proxy configuration file:
nano /etc/apt/apt.conf.d/00aptproxy
Add the following line:
Acquire::http::Proxy "http://your-server-ip:3142";
Save and close the file when you are finished.
Step 4 - Verify APT-Cacher NG
Now, let's try to install the Apache package on the Client system using the following command:
apt-get install apache2 -y
The above command will find, download, and install an Apache package from the Apt-Cache NG server.
You can check it using the following command on the server system:
tail -f /var/log/apt-cacher-ng/apt-cacher.log
Sample output:
1629012079|I|91694|69.87.221.199|uburep/pool/main/a/apr/libapr1_1.6.5-1ubuntu1_amd64.deb
1629012079|O|91685|69.87.221.199|uburep/pool/main/a/apr/libapr1_1.6.5-1ubuntu1_amd64.deb
1629012079|I|85057|69.87.221.199|uburep/pool/main/a/apr-util/libaprutil1_1.6.1-4ubuntu2_amd64.deb
1629012079|O|85058|69.87.221.199|uburep/pool/main/a/apr-util/libaprutil1_1.6.1-4ubuntu2_amd64.deb
1629012079|I|10880|69.87.221.199|uburep/pool/main/a/apr-util/libaprutil1-dbd-sqlite3_1.6.1-4ubuntu2_amd64.deb
1629012079|O|10894|69.87.221.199|uburep/pool/main/a/apr-util/libaprutil1-dbd-sqlite3_1.6.1-4ubuntu2_amd64.deb
1629012079|I|9071|69.87.221.199|uburep/pool/main/a/apr-util/libaprutil1-ldap_1.6.1-4ubuntu2_amd64.deb
1629012079|O|9078|69.87.221.199|uburep/pool/main/a/apr-util/libaprutil1-ldap_1.6.1-4ubuntu2_amd64.deb
1629012079|I|29280|69.87.221.199|uburep/pool/main/j/jansson/libjansson4_2.12-1build1_amd64.deb
1629012079|O|29279|69.87.221.199|uburep/pool/main/j/jansson/libjansson4_2.12-1build1_amd64.deb
1629012079|I|1180480|69.87.221.199|uburep/pool/main/a/apache2/apache2-bin_2.4.41-4ubuntu3.4_amd64.deb
1629012079|O|1180482|69.87.221.199|uburep/pool/main/a/apache2/apache2-bin_2.4.41-4ubuntu3.4_amd64.deb
1629012079|I|158846|69.87.221.199|uburep/pool/main/a/apache2/apache2-data_2.4.41-4ubuntu3.4_all.deb
1629012079|O|158848|69.87.221.199|uburep/pool/main/a/apache2/apache2-data_2.4.41-4ubuntu3.4_all.deb
1629012079|I|84349|69.87.221.199|uburep/pool/main/a/apache2/apache2-utils_2.4.41-4ubuntu3.4_amd64.deb
1629012079|O|84354|69.87.221.199|uburep/pool/main/a/apache2/apache2-utils_2.4.41-4ubuntu3.4_amd64.deb
1629012079|I|95853|69.87.221.199|uburep/pool/main/a/apache2/apache2_2.4.41-4ubuntu3.4_amd64.deb
1629012079|O|95852|69.87.221.199|uburep/pool/main/a/apache2/apache2_2.4.41-4ubuntu3.4_amd64.deb
1629012079|I|17288|69.87.221.199|uburep/pool/main/s/ssl-cert/ssl-cert_1.0.39_all.deb
1629012079|O|17277|69.87.221.199|uburep/pool/main/s/ssl-cert/ssl-cert_1.0.39_all.deb
Apt-Cache NG also provides a web-based interface to display all reports. You can access it using the URL
http://your-server-ip:3142/acng-report.html. You should see the following screen:
Step 5 - Control Apt-Cacher NG Usage
You can also set up access control for Apt-Cache NG so that only authenticated hosts can download the package from the Apt-Cacher NG server.
You can use the /etc/hosts.allow and /etc/hosts.deny for controling access.
For example, to allow 192.168.0.10 and 192.168.0.11 to use Apt-Cacher NG server, edit the /etc/hosts.allow file:
nano /etc/hosts.allow
Add the following line:
apt-cacher-ng : 192.168.0.10 192.168.0.11
Save and close the file when you are finished.
If you want to block the host 192.168.1.100 to use Apt-Cacher NG server, edit the /etc/hosts.deny file:
nano /etc/hosts.deny
Add the following line:
apt-cacher-ng : 192.168.1.100
Save and close the file when you are finished.
Conclusion
In the above guide, we explained how to install and use Apt-Cache NG server on Ubuntu 24.04 server. You can now set up Apt-Cache NG in your local network to save a lot of internet bandwidth - try it on VPS hosting from Atlantic.Net!
### Detect Linux Security Holes and Rootkits with Rkhunter on Ubuntu
Rkhunter is a command-line utility that scans the local system for rootkits, backdoors, and possible local exploits. It also checks for hidden files, wrong permissions set on binaries, suspicious strings in the kernel, and many more potential security problems. Rkhunter works by comparing local files with hashes in an online database. It scans the Linux systems to determine if any rootkits infect the server.
This tutorial will show you how to install and use Rkhunter to scan and detect security holes in Ubuntu. This procedure is compatible with Ubuntu 22.04 and Ubuntu 24.04.
Step 1 - Install Rkhunter
By default, Rkhunter is available in the Ubuntu 20.04 default repository. You can install it with the following commands:
apt-get update -y
apt-get install rkhunter -y
Now, verify the installed version of Rkhunter with the following command:
rkhunter --version
You should get the following output:
Rootkit Hunter 1.4.6
Step 2 - Configure Rkhunter
Before starting, you will need to configure Rkhunter to scan your system. You can configure it by editing the file /etc/rkhunter.conf:
nano /etc/rkhunter.conf
Change the following lines:
UPDATE_MIRRORS=1
MIRRORS_MODE=0
WEB_CMD=""
Save and close the file when you are finished.
Next, you must create /etc/default/rkhunter.conf file to automatically set up regular scans and updates with a cron job.
nano /etc/default/rkhunter.conf
Change the following lines:
CRON_DAILY_RUN="true"
CRON_DB_UPDATE="true"
APT_AUTOGEN="true"
Save and close the file when you are finished.
Next, run the following command to verify any configuration errors:
rkhunter -C
Step 3 - Update the Database
Rkhunter uses text data files to find suspicious activities on the system, so you must first update the text data file. You can edit it with the following command:
rkhunter --update
You should get the following output:
[ Rootkit Hunter version 1.4.6 ]
Checking rkhunter data files...
Checking file mirrors.dat [ Updated ]
Checking file programs_bad.dat [ No update ]
Checking file backdoorports.dat [ No update ]
Checking file suspscan.dat [ No update ]
Checking file i18n/cn [ Skipped ]
Checking file i18n/de [ Skipped ]
Checking file i18n/en [ No update ]
Checking file i18n/tr [ Skipped ]
Checking file i18n/tr.utf8 [ Skipped ]
Checking file i18n/zh [ Skipped ]
Checking file i18n/zh.utf8 [ Skipped ]
Checking file i18n/ja [ Skipped ]
Next, update the Rkhunter data file with the current value by running the following command:
rkhunter --propupd
You should get the following output:
[ Rootkit Hunter version 1.4.6 ]
File updated: searched for 179 files, found 135
Step 4 - Start a System Check with Rkhunter
At this point, Rkhunter is installed and configured. Now, perform the test scan against your system with the following command:
rkhunter --check
You should get the following output:
If you want to display only warning messages in the output, run the following command:
rkhunter --check --rwo
You should get the following output:
Warning: The SSH and rkhunter configuration options should be the same:
SSH configuration option 'PermitRootLogin': yes
Rkhunter configuration option 'ALLOW_SSH_ROOT_USER': no
Warning: Suspicious file types found in /dev:
/dev/shm/PostgreSQL.613016838: data
Step 5 - Setup Email Notifications
It is also recommended to enable email notifications so that Rkhunter sends an email if a threat is found on your system.
nano /etc/rkhunter.conf
Change the following line:
MAIL-ON-WARNING=root@localhost
Save and close the file when you are finished.
Conclusion
Congratulations! You have successfully installed and configured Rkhunter on the Ubuntu 24.04 server. I hope you can now easily find backdoors and malware with rkhunter. After making any changes in your system, we recommend running the rkhunter --propupd command to update rkhunter to the new file properties. Try out Rkhunter on dedicated server hosting from Atlantic.Net!
### How to Install Asterisk and FreePBX on Ubuntu
Asterisk is an open-source telephone solution for individuals, businesses, and governments. It runs over the Internet instead of copper phone lines and is used for voicemail, call recording, interactive voice response, and conference calling.
FreePBX is a free, open-source, web-based application that manages the Asterisk through a browser. It offers all the components required to build a phone system. With FreePBX, you can create an extension, IVRs, set user permissions, firewall, backup and restore, and more.
This tutorial will show you how to install Asterisk and FreePBX on Ubuntu. This procedure is compatible with Ubuntu 24.04.
Step 1 - Install Required Dependencies
Before starting, you must install all the dependencies required to compile Asterisk on your system. You can install all of them with the following commands:
apt-get update -y
apt-get install sox pkg-config libedit-dev unzip git gnupg2 curl libnewt-dev libssl-dev libncurses5-dev subversion libsqlite3-dev build-essential libjansson-dev libxml2-dev uuid-dev subversion -y
Once all the dependencies are installed, you can proceed to compile Asterisk.
Step 2 - Install Asterisk
First, download the latest version of Asterisk from the Asterisk official website using the following command:
wget https://downloads.asterisk.org/pub/telephony/asterisk/asterisk-22-current.tar.gz
Once the download is completed, extract the downloaded file with the following command:
tar -xvzf asterisk-22-current.tar.gz
Next, change the directory to the extracted directory and install the required dependencies with the following command:
cd asterisk-22.*/
contrib/scripts/get_mp3_source.sh
contrib/scripts/install_prereq install
Next, run the following command to configure Asterisk:
./configure
Next, set the menu options with the following command:
make menuselect
You can use the Arrow key to navigate and the Enter key to select.
Enable required add-ons:
Enable Core Sound Modules
Enable MOH packages
Extra Sound Packages
Once all the components are installed, build Asterisk with the following command:
make -j2
Next, install Asterisk using the following command:
make install
Next, install configs and samples using the following command:
make samples
make config
ldconfig
Step 3 - Configure Asterisk
Next, you must create a separate user and group for Asterisk. You can create them with the following command:
groupadd asterisk
useradd -r -d /var/lib/asterisk -g asterisk asterisk
Next, add some required users to the Asterisk group with the following command:
usermod -aG audio,dialout asterisk
Next, set proper permissions and ownership using the following command:
chown -R asterisk:asterisk /etc/asterisk
chown -R asterisk:asterisk /var/{lib,log,spool}/asterisk
chown -R asterisk:asterisk /usr/lib/asterisk
Next, edit the /etc/default/asterisk file and set the asterisk user as a default user:
nano /etc/default/asterisk
Change the following lines:
AST_USER="asterisk"
AST_GROUP="asterisk"
Save and close the file, then edit the Asterisk default configuration file and define the “run as” user and group:
nano /etc/asterisk/asterisk.conf
Change the following lines:
runuser = asterisk ; The user to run as.
rungroup = asterisk ; The group to run as.
Save and close the file, then restart the Asterisk service and enable it to start at system reboot with the following command:
systemctl restart asterisk
systemctl enable asterisk
Next, verify the status of the Asterisk service with the following command:
systemctl status asterisk
In some cases, you should get the following error:
radcli: rc_read_config: rc_read_config: can't open /etc/radiusclient-ng/radiusclient.conf: No such
file or directory
You can resolve this error using the following commands:
sed -i 's";\[radius\]"\[radius\]"g' /etc/asterisk/cdr.conf
sed -i 's";radiuscfg => /usr/local/etc/radiusclient-ng/radiusclient.conf"radiuscfg => /etc/radcli/radiusclient.conf"g' /etc/asterisk/cdr.conf
sed -i 's";radiuscfg => /usr/local/etc/radiusclient-ng/radiusclient.conf"radiuscfg =>
/etc/radcli/radiusclient.conf"g' /etc/asterisk/cel.conf
Next, start the Asterisk service again with the following command:
systemctl start asterisk
systemctl status asterisk
Next, connect to the Asterisk command-line interface with the following command:
asterisk -rvv
You should get the following output:
Asterisk 20.4.0, Copyright (C) 1999 - 2022, Sangoma Technologies Corporation and others.
Created by Mark Spencer
Asterisk comes with ABSOLUTELY NO WARRANTY; type 'core show warranty' for details.
This is free software, with components licensed under the GNU General Public
License version 2 and other licenses; you are welcome to redistribute it under
certain conditions. Type 'core show license' for details.
=========================================================================
Running as user 'asterisk'
Running under group 'asterisk'
Connected to Asterisk 22.4.0 currently running on ubuntu2404 (pid = 89531)
Exit out of the CLI type:
Exit
Step 4 - Install FreePBX
FreePBX requires Apache web server, MariaDB, and PHP to be installed on your server.
First, install the Apache, MariaDB, PHP and other required packages with the following command.
apt install mariadb-server apache2 php libapache2-mod-php php-intl php-mysql php-curl php-cli php-zip php-xml php-gd php-common php-mbstring php-xmlrpc php-bcmath php-json php-sqlite3 php-soap php-zip php-ldap php-imap php-cas -y
Once all the packages are installed, download the latest version of FreePBX using the following command:
wget http://mirror.freepbx.org/modules/packages/freepbx/freepbx-17.0-latest.tgz
Once downloaded, extract the downloaded file with the following command:
tar -xvzf freepbx-17.0-latest.tgz
Next, change the directory to the extracted directory and install the Node.js package with the following command:
cd freepbx
apt-get install nodejs npm -y
Next, set the required permissions with the following command:
./install -n
You should get the following output:
Setting specific permissions...
30690 [============================]
Finished setting permissions
Generating default configurations...
Finished generating default configurations
You have successfully installed FreePBX
Next, install the pm2 package with the following command:
fwconsole ma install pm2
Next, change the Apache user to Asterisk and turn on the AllowOverride option with the following command:
sed -i 's/^\(User\|Group\).*/\1 asterisk/' /etc/apache2/apache2.conf
sed -i 's/AllowOverride None/AllowOverride All/' /etc/apache2/apache2.conf
Next, set upload_max_filesize to php.ini file with the following command:
sed -i 's/\(^upload_max_filesize = \).*/\120M/' /etc/php/*/apache2/php.ini
sed -i 's/\(^upload_max_filesize = \).*/\120M/' /etc/php/*/cli/php.ini
Next, enable the Apache rewrite module and restart the Apache service with the following command:
a2enmod rewrite
systemctl restart apache2
Step 5 - Access FreePBX
Now, open your web browser and access the FreePBX web interface using the URL http://your-server-ip/admin. You will be redirected to the Admin user creation page:
Provide your Admin user details and click on the Setup System button. You should see the following page:
Click on the FreePBX Administration button. You should see the FreePBX login page:
Provide your admin username and password, and click on the Continue button. You should see the FreePBX dashboard on the following page:
Conclusion
The above guide taught you how to install Asterisk and FreePBX servers on Ubuntu 24.04. You can now easily manage your VoIP server from the FreePBX dashboard. Install Asterisk today using your VPS hosting account with Atlantic.Net!
### How to Add PHP-FPM Support on Apache and Nginx Web Server on Ubuntu
Apache and Nginx are free, open-source, and popular – the most widely used web servers worldwide. Apache and Nginx both run on all Unix-based operating systems. Apache is known for its power, while Nginx is known for its speed. Nginx is also used as a reverse proxy for HTTP, HTTPS, IMAP, SMTP, and POP3 and as a load balancer.
PHP-FPM (FastCGI Process Manager) is an alternative PHP FastCGI implementation specially designed for high-loaded websites. PHP-FPM allows you to run multiple versions of PHP at a time. PHP-FPM can be run differently than mod_PHP on a web server. If you want to host your web application with optimal performance, then PHP-FPM is the best choice.
This tutorial will explain how to enable PHP-FPM support on Apache and Nginx web servers on Ubuntu. This procedure is compatible with Ubuntu 18.04, Ubuntu 22.04, and Ubuntu 24.04.
Step 1 - Enable PHP-FPM Support on the Apache Web Server
This section will teach us how to install and enable PHP-FPM support on the Apache webserver.
First, install the Apache and PHP-FPM by running the following command:
apt-get update -y
apt-get install apache2 libapache2-mod-php libapache2-mod-fcgid php php-fpm php-cli -y
Once all the packages are installed, start Apache and PHP-FPM service with the following command:
systemctl start apache2
systemctl start php7.2-fpm
Note: Replaced php7.2-fpm with your installed PHP version.
Next, you will need to configure the Apache webserver with PHP-FPM support. To do so, create a new Apache virtual host configuration file:
nano /etc/apache2/sites-available/example.com.conf
Add the following lines:
ServerAdmin admin@example.com
DocumentRoot /var/www/html/
DirectoryIndex info.php
ServerName example.com
Options Indexes FollowSymLinks MultiViews
AllowOverride All
Order allow,deny
allow from all
# 2.4.10+ can proxy to unix socket
SetHandler "proxy:unix:/run/php/php8.3-fpm.sock|fcgi://localhost"
ErrorLog ${APACHE_LOG_DIR}/example.com_error.log
CustomLog ${APACHE_LOG_DIR}/example.com_access.log combined
Note: Replaced php8.3-fpm with your installed PHP version.
Save and close the file. Then, enable the virtual host configuration file with the following command:
a2ensite example.com
Next, you will need to enable a few modules for apache2 to work with PHP-FPM:
a2enmod actions fcgid alias proxy_fcgi
Next, restart the Apache service using the following command:
systemctl restart apache2
Step 2 - Test Apache Web Server
Apache webserver is now configured with PHP-FPM support. It's time to test whether PHP-FPM is loaded with Apache webserver or not.
To test it, create a sample info.php file inside the Apache document root directory:
nano /var/www/html/info.php
Add the following lines:
Save and close the file, then change the ownership of the info.php file to www-data:
chown www-data:www-data /var/www/html/info.php
Next, open your web browser and type the URL http://example.com. You should see the following page:
The above page indicates that PHP-FPM is loaded with the Apache webserver.
Note: Don't forget to remove the info.php file after testing.
Step 3 - Enable PHP-FPM Support on the Nginx Web Server
This section will teach us how to install and enable PHP-FPM support on the Nginx webserver.
Step 4 - Install Nginx and PHP-FPM
First, install Nginx and PHP-FPM by running the following command:
apt-get install nginx php php-fpm php-cli -y
Once all the packages are installed, start Nginx and PHP-FPM service with the following command:
systemctl start nginx
systemctl start php7.2-fpm
Step 5 - Configure Nginx with PHP-FPM Support
Next, you will need to configure the Nginx webserver with PHP-FPM support. To do so, create a new Nginx virtual host configuration file:
nano /etc/nginx/sites-available/example.com.conf
Add the following lines:
server {
listen 80;
root /var/www/html/;
index info.php;
server_name example.com;
location ~ \.php$ {
fastcgi_split_path_info ^(.+\.php)(/.+)$;
fastcgi_pass unix:/var/run/php/php8.3-fpm.sock;
fastcgi_index index.php;
include fastcgi_params;
fastcgi_param SCRIPT_FILENAME $document_root$fastcgi_script_name;
fastcgi_intercept_errors off;
fastcgi_buffer_size 16k;
fastcgi_buffers 4 16k;
fastcgi_connect_timeout 600;
fastcgi_send_timeout 600;
fastcgi_read_timeout 600;
}
location / {
try_files $uri $uri/ =404;
}
}
Note: Replaced php8.3-fpm with your installed PHP version.
Save and close the file. Then, enable the Nginx virtual host with the following command:
ln -s /etc/nginx/sites-available/example.com.conf /etc/nginx/sites-enabled/
Next, restart the Nginx and PHP-FPM service to apply the configuration changes:
systemctl restart nginx
systemctl restart php7.2-fpm
Step 6 - Test Nginx Web Server
The Nginx webserver is now configured with PHP-FPM support. It's time to test whether PHP-FPM is loaded with the Nginx webserver or not.
To test it, create a sample info.php file in the Nginx document root directory:
nano /var/www/html/info.php
Add the following lines:
Save and close the file, then change the ownership of the info.php file to www-data:
chown www-data:www-data /var/www/html/info.php
Next, open your web browser and type the URL http://example.com. You should see the following page:
The above page indicates that PHP-FPM is loaded with the Nginx webserver.
Note: Don't forget to remove the info.php file after testing.
Conclusion
Congratulations! You have successfully configured Nginx and Apache web servers with PHP-FPM support. I hope you now have enough knowledge to use PHP-FPM to run multiple versions of PHP at a time. To start with PHP-FPM on Apache and Nginx, sign up for a VPS Hosting plan with Atlantic.Net today.
### Optimizing Costs in the Cloud: VMs vs. VPS vs. Bare Metal
Cloud cost optimization is the process of reducing your overall cloud spending by identifying mismanaged resources, eliminating waste, reserving capacity for higher discounts, and right-sizing computing services to scale.
The objective is to understand cloud spending and usage, and then take strategic action to control and optimize expenses. This process is critical for businesses to ensure they are getting the most value from their cloud investment. Read this in-depth blog post for more background on cloud cost optimization.
Cutting down on unnecessary costs doesn't mean compromising on the quality of services. It's about smart management and making the most of what you have. Let’s see how the principles of cloud cost optimization apply to three common cloud deployment models: VM, VPS, and bare metal servers.
Three Options for Running Servers in the Cloud
Virtual Private Servers (VPS)
A Virtual Private Server (VPS) is a virtual machine sold as a service by an internet hosting service. A VPS runs its copy of an operating system, and customers have superuser-level access to that operating system instance, allowing them to install almost any software that runs on that OS. VPS provides a higher level of control compared to shared hosting.
Virtual Machines (VMs)
Virtual Machines (VMs) are emulations of computer systems. They can run applications and operating systems just like a physical computer. VMs are often used in cloud computing platforms to provide computing resources. They are a critical part of the infrastructure-as-a-service (IaaS) cloud service model.
Bare Metal
Bare Metal refers to a physical server dedicated to a single tenant, contrary to the concept of a virtual server that shares resources with other users. Although it is less flexible than its virtual counterparts, bare metal provides high performance and is ideal for data-intensive workloads that require superior processing power.
VMs vs. VPS vs. Bare Metal: What Are the Differences?
Now that we've understood the key concepts let's delve into the specifics of each and how they impact your cloud costs.
Pricing Models
When it comes to VMs, VPS, and Bare Metal, their pricing models differ significantly. VMs and VPS usually have a pay-as-you-go pricing model, meaning you pay for what you use. On the other hand, Bare Metal servers often require a significant upfront investment but can be more cost-effective in the long run for high-demand applications.
Performance and Resource Allocation
Performance and resource allocation are other factors that play a significant role in the cost. VMs and VPS offer a shared resource environment where the physical server's resources are divided among multiple users. On the other hand, Bare Metal servers provide dedicated resources, resulting in better performance but at a higher cost.
Scalability and Flexibility
Scalability and flexibility are key factors to consider when choosing between VMs, VPS, and Bare Metal. VMs and VPS offer a high degree of scalability and flexibility, allowing you to easily scale up or down based on your business needs. Bare Metal servers, on the other hand, offer less flexibility but provide a higher level of performance.
VMs, VPS, and Bare Metal: Cost Optimization Strategies
1. Right-Sizing Resources
Virtual Private Servers (VPS): Right-sizing in a VPS context typically involves choosing the best plan that aligns with your resource requirements. You can adjust CPU, memory, and storage allocations based on your specific use case. Upgrading or downgrading is usually straightforward, allowing for dynamic resource management.
Virtual Machines (VMs): Cloud platforms often offer various VM types tailored for different needs—compute-optimized, memory-optimized, etc. Right-sizing here would involve choosing the correct VM type and scaling your VM instances according to your application's demands. Dynamic resource allocation is often possible, allowing you to adapt to changing requirements without any downtime.
Bare Metal: Since these servers are not virtualized and are dedicated to a single tenant, right-sizing typically involves a more in-depth hardware selection process. The process is often less flexible and may require longer-term commitments. Make sure to evaluate your needs carefully before making a choice to avoid overprovisioning and unnecessary costs.
2. Managing Storage Costs
VPS: Storage costs can escalate quickly if not managed well. VPS usually offers various storage options like SSDs or HDDs. Choose the type of storage based on your application's needs—SSDs for high-speed data access or HDDs for cheaper, less-critical data storage.
VMs: Similar to VPS, you can choose between high-performance SSDs and cost-effective HDDs. Additionally, many cloud providers offer cold or archival object storage services, which can be a cost-effective solution for infrequently accessed data.
Bare Metal: Bare Metal servers usually allow for extensive storage customization. High-performance RAID configurations or large-scale HDD deployments can be optimized for cost depending on the workload requirements.
3. Monitoring and Analyzing Usage
VPS: Most VPS providers offer built-in monitoring tools that can track CPU usage, data transfer, and disk utilization. Regularly checking these metrics can help you identify underutilized resources and allow you to downgrade or upgrade your plan accordingly.
VMs: Monitoring and logging services are usually more extensive for VMs, giving insights into not only resource usage but also network performance, application errors, etc. Utilize these metrics to identify inefficiencies and optimize configurations.
Bare Metal: Given that Bare Metal servers are often used for resource-intensive tasks, robust monitoring systems are essential. These could include hardware-level monitoring, network usage stats, and application performance metrics. Use this data to fine-tune your environment and potentially save costs.
4. Leveraging Reserved Instances and Discounts
VPS: Some providers offer discounts for long-term commitments. If your usage pattern is predictable, committing to a one or three-year plan can save substantial amounts.
VMs: Cloud providers often offer reserved instances, which come at a significantly lower cost if you can commit to a long-term contract. Additionally, they may offer spot instances—temporary resources at lower costs—that can be beneficial for non-critical, ephemeral workloads.
Bare Metal: Given the significant upfront costs, long-term contracts are standard in the Bare Metal environment. However, discounts can be negotiated for long-term commitments or high-volume usage.
5. Consider Total Cost of Ownership (TCO)
VPS: The TCO includes not just the cost of the server but also the overheads for maintenance, security, and potential software licenses. VPS costs are generally more transparent but still require budgeting for these additional costs.
VMs: While the compute costs may be straightforward, additional costs can include network transfer fees, additional services like load balancers, and monitoring solutions. Make sure to include these when calculating the TCO.
Bare Metal: Bare Metal servers typically have a higher TCO due to initial hardware costs, maintenance, and potential software licenses. However, they may offer better performance per dollar for specific, resource-intensive workloads, making the TCO favorable when considered over an extended period.
Conclusion
Cloud cost optimization is not a one-size-fits-all proposition; rather, it requires a nuanced approach tailored to the specific needs and objectives of each organization. In this article, we examined the three prevalent cloud deployment models—Virtual Private Servers (VPS), Virtual Machines (VMs), and Bare Metal—to understand how each can impact your overall cloud spending.
While VPS and VMs offer flexibility and scalability with a pay-as-you-go pricing model, Bare Metal servers excel in providing superior performance, albeit at a higher upfront cost. Right-sizing resources, managing storage costs, monitoring usage, leveraging discounts, and taking into account the total cost of ownership are critical strategies that apply across all three models.
The key takeaway is to align your choice of cloud deployment model with your specific business requirements—be it performance, scalability, or cost-effectiveness. Regularly reviewing and adjusting your cloud configurations can result in substantial cost savings without compromising the quality of services. Therefore, whether you're running a small application or a data-intensive workload, smart management and continuous optimization are vital to getting the most value from your cloud investment.
Author Bio: Gilad David Maayan
Gilad David Maayan is a technology writer who has worked with over 150 technology companies including SAP, Imperva, Samsung NEXT, NetApp and Check Point, producing technical and thought leadership content that elucidates technical solutions for developers and IT leadership. Today he heads Agile SEO, the leading marketing agency in the technology industry.
### Managed Kubernetes Services
Integrating Kubernetes into a public cloud infrastructure has become a standard practice for companies looking to manage containers and orchestrate their applications efficiently.
Various cloud services vendors offer managed Kubernetes clusters, making it easier for businesses to deploy, manage, and scale applications without the complexities of handling the control plane or storing cluster data themselves.
A managed Kubernetes service is a popular managed service provided by numerous cloud providers. Running Kubernetes at scale demands a lot of computing horsepower.
Did you know you can also create and manage your own Kubernetes service on an Atlantic.Net cloud server running Docker or minikube?
This article will uncover the complexities of managed K8s services, and we will discover how you can run your own K8s service on Atlantic.Net.
The Evolution of Managed Kubernetes Services
Managed K8s Services have come a long way since their inception. Initially considered a niche offering, they have evolved into a mainstream solution for businesses of all sizes.
This transformation has been driven by the increasing complexity of managing Kubernetes clusters and the need for specialized expertise.
Kubernetes was originally developed by Google, drawing from the company's years of experience managing containerized applications at scale with their internal platform, Borg. Google open-sourced Kubernetes and officially announced it in mid-2014.
Today, Managed K8s Services offer many features, from automated scaling to advanced security protocols, making them indispensable for modern enterprises.
Managed Kubernetes Service vs. DIY
When it comes to deploying Kubernetes clusters, organizations often face the dilemma of choosing between a managed service like Google Kubernetes Engine, Azure Kubernetes Service (AKS), or IBM Cloud Kubernetes Service, and a do-it-yourself (DIY) approach.
While a DIY strategy offers greater control, it also comes with the burden of continuous monitoring, manual scaling, cluster management, and security management. If you are proficient in cloud computing, it is absolutely possible to do it yourself.
On the other hand, Managed K8s Services from major cloud providers alleviate these challenges by automating many operational tasks, such as deploying cloud-native apps, allowing businesses to focus on application development and strategic initiatives in a public cloud environment
Architectural Considerations for Kubernetes Clusters in Managed Services
When you deploy Kubernetes clusters, the architecture plays a pivotal role in both performance and scalability. Managed Kubernetes providers like Amazon Elastic Kubernetes Service and Google Cloud often offer architectural best practices immediately.
These can include optimized node configurations, efficient resource allocation, and even bare-metal servers for those who require it. Atlantic.Net can also provide dedicated and bare-metal servers.
However, understanding these architectural choices is crucial, as they can significantly impact your application's performance and overall cloud computing expenditure.
Managed Kubernetes: Beyond the Basics
Managed K8s Services often go beyond basic container orchestration. These services, including Tanzu Kubernetes Grid and Alibaba Cloud Container Service, offer additional features like built-in CI/CD pipelines, advanced monitoring dashboards, and integrated logging solutions.
These features enhance operational efficiency and provide deeper insights into your Kubernetes environment. They can include built-in monitoring and health monitoring features that can be crucial for managing application availability.
The Role of AI and Machine Learning in Managed Kubernetes Services
Artificial Intelligence (AI) and Machine Learning (ML) are increasingly integrated into Managed K8s Services. These technologies enable predictive scaling, intelligent anomaly detection, and automated resource optimization.
By leveraging AI and ML, businesses can achieve more efficient resource utilization and faster issue resolution. This is particularly true in fully managed Kubernetes solutions, where automated lifecycle management improves applications' overall reliability and performance.
Managed Kubernetes and Multi-Cloud Strategies
The rise of multi-cloud architectures has added another layer of complexity to managing Kubernetes clusters. Managed Kubernetes Services, including those from major cloud services providers like AWS Cloud and Azure, often offer multi-cloud support.
This allows you to run Kubernetes across different cloud providers seamlessly, from AWS infrastructure to Azure to Google Cloud. This capability is particularly beneficial for businesses looking to avoid vendor lock-in and optimize costs across multiple cloud environments.
Popular Kubernetes Cluster Providers
Google Kubernetes Engine (GKE) is a fully managed service that allows organizations to easily create production-ready clusters. It offers robust features, including advanced access management and a user-friendly Kubernetes dashboard.
GKE is built on upstream Kubernetes, ensuring compatibility with standard Kubernetes toolchains. This makes it a go-to Kubernetes provider for those already invested in Google's ecosystem.
Azure Kubernetes Service (AKS) is Microsoft's hosted Kubernetes service that simplifies deploying a managed cluster in Azure. One of its standout features is how Azure handles critical tasks like maintenance and upgrades without manual intervention.
AKS integrates seamlessly with Azure's suite of services, including Azure Virtual Machines and Amazon Virtual Private Cloud, providing a comprehensive solution for businesses.
The service also offers robust control configurations, making managing and scaling clusters according to demand easier.
Popular Hybrid Managed Kubernetes Services
VMware Tanzu Kubernetes Grid (TKG) offers a unique approach to Kubernetes, especially for businesses that operate both on-premises and in the public cloud. TKG is designed to run on various infrastructures, including vSphere, AWS resources, and even Azure, making it a versatile choice.
VMware Tanzu Kubernetes Grid provides a consistent, upstream-compatible environment for Kubernetes across different data centers and cloud environments. This allows organizations to manage their clusters through a single control plane, regardless of where they are deployed.
Tanzu Kubernetes Grid also integrates well with Amazon EKS, which automatically manages certain aspects of your clusters, freeing up resources for other critical tasks. Like GKE and AKS, Tanzu also allows for the creation of production-ready clusters that can be automatically scaled as needed.
This is particularly useful for businesses with fluctuating workloads and requiring the ability to scale clusters up or down quickly.
The Economics of Managed Kubernetes: ROI and TCO Insights
Understanding the economic impact of adopting a Managed Kubernetes Service is vital. While the upfront costs may be higher than a DIY approach, the total cost of ownership (TCO) often favors managed services. This is particularly true when you factor in operational efficiencies, reduced downtime, and quicker time-to-market.
Managed services, including Amazon Elastic Kubernetes Service and Azure Kubernetes Service (AKS), often handle critical tasks like load balancing and networking resources, providing a fully supported Kubernetes solution that can offer a better ROI in the long run.
Securing Your K8s Cluster in a Managed Service Environment
Security remains a paramount concern in Kubernetes. Managed services often have built-in security features like automated patching, role-based access control, and integrated firewalls.
These services, whether they are from Google Cloud or third-party providers, align with various compliance requirements, ensuring that your data and applications are adequately protected.
Features like networking and security services can be particularly beneficial.
Managed Kubernetes: A Guide to Disaster Recovery and High Availability
Ensuring high availability and robust disaster recovery mechanisms are critical aspects of any Kubernetes deployment. Managed K8s Services often offer automated backup solutions and failover capabilities.
These services, including those from a cloud provider like Oracle Container Engine and DigitalOcean Kubernetes, ensure that your applications remain available even in the event of hardware failure or other catastrophic events.
They often come with features like service discovery and associated storage solutions that can be crucial for maintaining business continuity.
The Future of Managed Kubernetes: What to Expect in the Next Five Years
As Kubernetes continues to evolve, so will the landscape of Managed K8s Services. We can expect to see further integration of AI and ML technologies, more robust multi-cloud support, and increasingly sophisticated security features.
Businesses that stay ahead of these trends and adapt their Kubernetes strategies accordingly will be better positioned to leverage the full potential of this powerful orchestration platform.
This will likely include more flexible deployment options, enhanced node management, and the ability to attach multiple nodes to existing infrastructure.
Running Kubernetes Clusters on Atlantic.Net with Minikube
Minikube is an open-source tool designed to enable developers to run Kubernetes clusters on individual servers. Developed as part of the Kubernetes project, minikube aims to provide a convenient way for developers to test and develop applications in a Kubernetes environment without requiring a full-scale, production-level cluster.
It essentially creates a virtual machine on your local system and deploys a simple cluster containing a single node.
The primary advantage of using minikube is its simplicity and ease of use. It offers a straightforward way to get a Kubernetes cluster up and running, making it an ideal choice for those who are new to the Kubernetes ecosystem or for developers who want to test their applications in a controlled environment.
Minikube supports various hypervisors like VirtualBox, VMware Fusion, Hyper-V, and container runtimes like Docker.
Another notable feature is its compatibility with various Kubernetes features and components, such as DNS, NodePorts, ConfigMaps, and Secrets. This allows developers to simulate a production-like environment on their local machines, facilitating more accurate testing and development.
To manage the local cluster, minikube provides a command-line interface allowing users to start, stop, and manage their Kubernetes clusters. It also integrates seamlessly with kubectl, the command-line tool for interacting with a Kubernetes cluster, offering a cohesive experience for cluster management.
Experience the power of Kubernetes with minikube on Atlantic.Net. Our cloud and dedicated servers provide the perfect environment for you to deploy your minikube cluster, offering you a streamlined, efficient way to manage your containerized applications.
Elevate your DevOps game—get started with Atlantic.Net today!
### Server Management Tools
Introduction to Server Management Tools
Server management tools are crucial components in maintaining, monitoring, and optimizing computing environments, both virtual and physical. Server management software is designed to provide system administrators with suitable instruments to oversee server resources, manage servers, and maintain server health optimally.
Server management tools are crucial for managing every server type, whether Windows, Linux, SQL, or cloud servers. Ensuring they operate efficiently is essential to ensure smooth day-to-day business operations.
This article will look at the vital role that server management tools play within a modern digitally-focused enterprise, and we will learn what server management involves and discover the important role that managed service providers undertake in providing the critical skills needed to keep your systems running optimally.
The Importance of Effective Server Management
Effective server management is not just about managing servers; it's about ensuring every component, from operating systems to network devices, works harmoniously, allowing businesses and IT professionals to focus on more strategic initiatives.
Here is why effective server management is so critical:
Server Health and Performance
Maintaining optimal server health is crucial. Server management tools offer real-time insights into performance metrics and server overhead, enabling identifying and resolving performance issues before they impact business operations.
Managing Multiple Server Environments
Managing multiple servers can be complex, whether dealing with Linux, Windows, SQL, or physical and virtual servers. Effective server management software simplifies this, allowing system administrators to monitor and manage domains, ensure security, and oversee the entire infrastructure from a central location.
Enhanced Security
Cybersecurity threats arise daily, and robust server management solutions are indispensable. The best server management software offers comprehensive security solutions, including patch management and proactive monitoring, to promptly detect and mitigate potential security threats and vulnerabilities.
Advanced Monitoring Systems
Advanced server monitoring systems allow complete visibility of server domains, giving IT professionals detailed monitoring capabilities of servers, network traffic, and the health of network devices over the device's lifetime, ensuring smooth business operations and data collaboration.
Resource Optimization
Server management tools enable businesses to optimize server resources effectively, managing both cloud services and physical servers efficiently. Capacity planning and resource allocation are streamlined, ensuring optimal server performance and resources are utilized efficiently.
Empowering Businesses through Managed Services
Managed service providers offering top server management software empower businesses by taking over the intricate tasks of server management, allowing business leaders to gain visibility and control over their IT environments.
Remote monitoring and management services provided by these providers ensure that servers are always up-to-date and running efficiently.
Contribution to Business Goals
Effective server management directly contributes to achieving business goals by ensuring uninterrupted services, enhancing productivity, and allowing for swift and efficient resolution of any issues.
This benefits your product performance and enables businesses to focus more on strategic growth and less on managing their IT environment.
Impact on Operating Systems
Proper server management has a considerable impact on the performance of operating systems. Whether dealing with cloud or physical servers, server management tools ensure that every operating system functions optimally, reducing the likelihood of system crashes and downtime.
Understanding Server Management Software
Server monitoring tools are indispensable, providing real-time insights into server health, network traffic, and performance metrics. These tools are particularly crucial for managing complex server ecosystems on Linux or Windows.
Server Monitoring and Performance Tools
When selecting a server monitoring tool, several key features must be considered. These include automated monitoring capabilities, real-time performance metrics, and remote monitoring and management. Additionally, generating custom reports can be invaluable for in-depth analysis.
SolarWinds Server & Application Monitor: SolarWinds offers a comprehensive monitoring solution, including performance metrics and patch management. It's ideal for businesses that require a robust, all-in-one solution.
PRTG Network Monitor: Specializing in network traffic monitoring, this tool also provides excellent server monitoring features. It's highly customizable and offers various options for network performance analysis.
Nagios: Known for its flexibility, Nagios offers a wide range of monitoring services, including server, network, and database management. It's open-source and highly customizable, making it a favorite among Linux users.
Zabbix: This is another open-source option that excels in monitoring various server resources. It comes with a strong focus on security solutions and log management.
Datadog: This cloud-based tool offers a unified view of an entire infrastructure, making it easier to manage servers, cloud services, and SQL databases from a central location.
ManageEngine OpManager: This tool offers both network monitoring and server management features. It supports multiple platforms and allows for managing user accounts and domains.
Automation and Configuration Management Tools
This type of server management tool streamlines the deployment, maintenance, and scaling of server resources, thereby reducing manual errors and enhancing efficiency. Whether you're dealing with Linux servers or Windows environments, these tools offer a range of functionalities that can significantly improve your server management processes.
Manual configuration and management are no longer feasible or efficient. Automation tools help execute repetitive tasks, while configuration governance ensures that all server settings are consistent and compliant with organizational policies.
Together, they enable IT teams to focus on more strategic tasks, such as capacity planning and performance optimization.
Ansible: An open-source, highly extensible automation tool that can manage everything from task execution to configuration management. It is particularly strong in managing Linux-based systems.
Puppet: This server management software is widely used for automating the provisioning and management of server resources. It offers a robust framework for defining and enforcing configurations across various systems.
Chef: Primarily used for configuration management, Chef allows for the automation of infrastructure as code. It supports both Windows and Linux environments and integrates well with cloud services.
SaltStack: This tool excels in configuration management and remote server administration. It offers a Python-based open-source platform that is both flexible and powerful.
Terraform: is designed for efficiently building, changing, and versioning infrastructure. It can manage existing service providers and custom in-house solutions, making it highly versatile.
Microsoft Azure Automation: Designed for the Azure cloud platform, this tool offers automation and configuration services that are deeply integrated with other Azure services. It's beneficial for businesses invested in the Microsoft ecosystem.
Benefits of Opting for Managed Service Providers
Managed Service Providers (MSPs) like Atlantic.Net have become an invaluable resource for businesses looking to optimize their IT operations. By outsourcing various IT functions to specialized providers, companies can focus on their core competencies while benefiting from the expert management of their technology infrastructure.
Here, we delve into some key advantages of partnering with an MSP.
Expertise in Multiple Technologies
MSPs like Atlantic.Net have a diverse team of experts skilled in different technologies. This multidisciplinary approach allows us to handle a wide range of tasks, including but not limited to:
Server Management: Whether it's Linux servers or Windows environments, MSPs have the tools and expertise to manage your server infrastructure's day-to-day management.
Cloud Services: MSPs can guide businesses through cloud migration, management, and security complexities, whether you are just starting your cloud journey or already cloud-enabled.
Database Management: With specialized knowledge in database management, MSPs can optimize MySQL, Postgres, Redis, and SQL server performance and security.
The advantages of multi-technological expertise offered by Managed Service Providers (MSPs) are diverse and include such benefits as:
Cost-Efficiency: Opting for a single provider capable of managing a diverse range of technologies can significantly reduce the need for multiple vendors, leading to cost savings.
Seamless Integration: MSPs ensure that various technologies are integrated smoothly, resulting in a more cohesive and efficient IT infrastructure.
Scalability: MSPs can effortlessly adapt and scale their services to meet your evolving needs as your organization expands, thanks to their extensive technological expertise.
In practical terms, this expertise can be demonstrated in several real-world applications:
Custom Reports: Specialized reporting is often essential for auditing and decision-making processes. MSPs leverage their database management and analytics skills to generate custom reports from multiple data sources.
Enhanced Security Measures: Security is paramount, and MSPs can implement advanced protocols across different platforms. This ensures a secure IT environment, safeguarding everything from server logs to user accounts.
Performance Optimization: MSPs continuously monitor and analyze performance metrics, allowing them to fine-tune various IT infrastructure components for optimal functionality.
This multi-faceted skill set makes MSPs an invaluable partner for businesses looking to optimize their IT operations.
24/7 Monitoring and Support
One of the most appealing aspects of a managed service is the compelling advantage of around-the-clock support. Costs for such a service vary, so do your research. However, the benefits afforded to your business are substantial.
Continuous monitoring enables MSPs to identify and address issues promptly (often before the customer is aware of a problem), minimizing downtime and mitigating potential revenue loss. The rapid response provided by MSP experts strengthens overall business continuity, making it a critical aspect of modern IT management.
MSPs also offer proactive maintenance by constantly monitoring for signs of potential issues, such as server hardware issues. This preventive approach reduces the likelihood of severe disruptions, allowing businesses to operate more smoothly.
The peace of mind gained from knowing that your IT infrastructure is under constant, expert surveillance is a game changer. You are secure in the knowledge that your technology base is well-managed.
Enhanced Security Measures
Managed Service Provider helps to enhance your business's security posture. Today, cyber threats are increasingly sophisticated, and the advanced security protocols implemented by MSPs offer a robust line of defense.
Security measures include log management, encrypted data storage, multi-factor authentication, DDoS protection, and Web Application Firewalls. By employing such comprehensive security solutions, MSPs ensure that internal and external threats are effectively mitigated, safeguarding crucial business data and IT infrastructure.
MSPs like Atlantic.Net are highly experienced in compliance requirements across various industries, from healthcare to finance. This expertise allows our business to tailor security measures that meet specific regulatory standards, providing additional protection.
Key Features of an Effective Server Management Solution
A top-tier server management platform should offer functionalities ranging from sophisticated server monitoring to remote server administration tools for managed servers at multi-site operations. The platform must provide in-depth analytics, extend business oversight to the broader IT ecosystem, and include stringent security measures. Specialized tools for web server management and virtual infrastructure oversight are increasingly vital.
Next, we will focus on three critical areas that your next management software company should be able to provide your business:
#1: Robust Monitoring Capabilities
Your chosen server monitoring system must have reliable and functional monitoring capabilities. To offer a comprehensive view of your IT infrastructure, monitoring capabilities must exceed essential server monitoring.
Here's why robust monitoring capabilities are a key feature:
Real-Time Insights: Advanced monitoring tools provide real-time data on server performance, network traffic, and resource utilization. This enables IT teams to identify and address issues as they happen, minimizing downtime and enhancing overall system reliability.
Multi-Faceted Monitoring: A robust monitoring system doesn't just focus on servers. It also extends to other aspects of the IT environment, such as network performance, web servers, API throughput, container insights, etc.
Automated Alerts: A key feature often requested is the ability to set up automatic alerts for specific events or thresholds. This ensures that IT teams are immediately notified of any issues, allowing for quick resolution and minimal impact on operations.
Historical Data Analysis: Reviewing historical data can offer valuable insights into performance trends and potential bottlenecks. This is crucial for long-term planning and optimization efforts.
Security Monitoring: Besides performance metrics, robust monitoring capabilities should include security features. This involves tracking unauthorized access attempts, monitoring server logs, and even automated scanning for vulnerabilities.
Remote Monitoring: In an increasingly remote work environment, monitoring server resources and performance from anywhere is invaluable. Robust monitoring capabilities should offer secure and efficient remote access options.
User Activity Tracking: Understanding user behavior is essential for security and performance optimization. Robust monitoring should include user activity tracking to identify any unusual behavior or potential security risks.
#2: User-Friendly Interface
The importance of a user-friendly interface cannot be overstated. While the backend may be packed with powerful features, the front end must be accessible and intuitive for users of varying technical expertise. Many customers expect at least read-only access to chosen server management tools.
Therefore, here's why a user-friendly interface is a key feature:
Ease of Use: A well-designed server management software interface simplifies complex tasks that would otherwise need to be performed via the command line, making it easier for IT teams to manage servers, monitor server resources, and perform device management tasks. This ease of use can significantly reduce the time to respond to incidents.
Quick Onboarding: A user-friendly interface ensures new team members can quickly get up to speed with the system. This is particularly beneficial for businesses with a high turnover rate or those that rely on temporary staff for specific projects.
Efficient Workflow: An intuitive design can streamline the workflow, allowing IT professionals to perform multiple tasks from a central location. Whether remote server administration, inventory management, or web server monitoring, a user-friendly interface can make these tasks more efficient.
Reduced Error Rate: A complicated or cluttered interface can lead to mistakes, which can be costly in a server management environment. A user-friendly interface minimizes this risk by providing clear instructions and straightforward navigation.
Enhanced Productivity: Ultimately, an easy-to-use interface can boost productivity. IT teams can focus more on strategic tasks like infrastructure management and less on navigating a complicated system.
Remote Access: In today's work-from-home culture, accessing the server management system remotely is crucial. A user-friendly interface should extend to remote access capabilities, ensuring users can perform essential tasks from anywhere without a steep learning curve.
#3: Comprehensive Reporting and Analytics
Reporting and analytics tools enable businesses to make data-driven decisions, optimize performance, and enhance security measures. Data is quickly becoming a valuable asset for digital-focused enterprises.
Here's a closer look at why these key features are so vital:
Informed Decision-Making: Robust reporting tools can give business leaders the visibility they need to make informed decisions. Whether it's about resource allocation or security protocols, analytics can offer valuable insights into how the system is performing.
Performance Optimization: Analytics can help IT teams identify real-time bottlenecks or performance issues. This enables proactive maintenance, allowing adjustments before issues escalate into significant problems.
Security Audits: Comprehensive reports can be invaluable for security audits. They can provide a detailed account of server activities, user access, and security incidents, helping businesses comply with industry regulations.
Resource Planning: Businesses can gain insights into server resource utilization through analytics. This is crucial for effective capacity planning, ensuring the infrastructure can handle current needs and scale for future growth.
Cost Management: Detailed reports can also help in cost management by identifying underutilized resources or potential areas for optimization. This can lead to more efficient use of resources and, consequently, cost savings.
User Behavior Analysis: Understanding how users interact with the system can offer insights into potential security risks or areas for improvement. Analytics tools can track user behavior, providing an additional security and usability assessment layer.
Customization: The ability to customize reports allows businesses to focus on metrics most relevant to their operations. Whether it's monitoring specific server resources or tracking particular performance metrics, customized reports offer targeted insights.
Choosing the Right Managed Service Provider
Now that you know the exclusive benefits of choosing the best server management tools available, it's important to decide whether you want to go down the self-managed path or reach out to a managed service provider for help.
Evaluating Provider Expertise and Reputation
A provider's track record can offer valuable insights into the quality and reliability of their services. We have created a list of what to look for:
Industry Experience: A provider with extensive experience will likely offer a more robust and reliable solution. Look for a management software company that has been in the business for several years and has a portfolio of successful implementations. If you work in healthcare, choose a partner that has been providing HIPAA compliance services for years.
Customer Reviews: Customer testimonials and reviews can provide a candid look at what to expect from the provider. These can offer insights into the provider's strengths and weaknesses, from monitoring capabilities to customer support.
Certifications and Accreditations: Industry certifications can testify to the provider's expertise. Whether in security solutions or infrastructure management, certifications indicate a level of competence that industry authorities have recognized.
Case Studies: Many providers offer case studies that detail how their solution has helped businesses solve specific challenges. These can provide practical examples of the provider's expertise in robust monitoring, analytics, and security measures.
Technical Support: The availability and quality of technical support are indicators of a provider's commitment to customer satisfaction. Look for 24/7 monitoring and support providers, showing they are invested in their client's success.
Assessing Service Level Agreements (SLAs)
Service Level Agreements (SLAs) are critical when selecting a server management solution. These legally binding documents outline the level of service you can expect from a provider, covering everything from uptime guarantees to response times for support queries.
Here's how to assess SLAs effectively:
Uptime Guarantees: An uptime guarantee is one of the most crucial elements in an SLA. This metric indicates the time the service is expected to be available. High uptime percentages, such as 99.9%, indicate a reliable service.
Response and Resolution Times: SLAs should specify the expected response and resolution times for technical issues. This is particularly important for businesses that require 24/7 monitoring and support to maintain continuous operations.
Data Backup and Recovery: An SLA should outline the provider's data backup and recovery policies. This includes how frequently backups are made, where the data is stored, and the procedures for data recovery in case of a system failure.
Security Protocols: Given the increasing importance of cybersecurity, the SLA should detail the security measures in place. This can range from encryption methods to how the provider monitors server resources for potential security threats.
Compliance Standards: For businesses in regulated industries, the SLA should specify how the provider will help maintain compliance with relevant laws and regulations. This is especially important for features like inventory management and user activity tracking.
Penalties and Remedies: The SLA should also outline the penalties for service failures and the remedies available to the customer. This provides accountability and offers a course of action if the provider fails to meet the agreed-upon service levels.
Flexibility and Scalability: Your server management needs may change as your business grows. The SLA should offer flexibility to adjust services and costs accordingly, whether adding more server resources or scaling down.
Exit Strategy: Finally, the SLA should provide clear terms for contract termination, including any associated fees and the process for data retrieval upon service termination.
The Role of Managed Service Providers in Server Management
So, what do you get when you choose a managed service provider to manage your server infrastructure?
Proactive Maintenance and Issue Resolution
You get a managed service that focuses on keeping your estate healthy and operating at its peak performance.
Here's how:
Predictive Analytics: Utilizing advanced monitoring software, MSPs can analyze performance metrics and usage patterns to predict potential issues before they become critical problems. This enables them to perform preventive maintenance, reducing the risk of severe disruptions.
Regular Updates and Patches: Keeping software and hardware up-to-date is crucial for performance and security. MSPs manage this by regularly applying patches and updates, often during off-peak hours, to minimize impact on business operations.
Resource Optimization: Through continuous monitoring and analytics, MSPs can optimize the allocation of server resources. This ensures that hardware and software are used efficiently, reducing costs and improving performance.
Incident Response Plans: In the event of a security incident or system failure, MSPs have predefined incident response plans. These plans outline the steps for quick recovery and are regularly updated to adapt to new threats.
Implementing Scalable and Flexible Solutions
As businesses grow and evolve, so do their IT needs. MSPs are adept at adapting to these changing requirements, offering solutions that can scale with your business.
Here's how:
Modular Architecture: Many MSPs offer solutions built on a modular architecture, allowing for easy addition or removal of features. Businesses can start with a basic setup and add more complex functionalities as their needs evolve.
Cloud Integration: MSPs provide seamless integration with cloud services, offering a hybrid approach that combines the benefits of both on-premises and cloud-based solutions, which is great if your business is looking to scale quickly.
Automated Workflows: To improve efficiency, MSPs can implement computerized workflows that streamline patch management, backups, and system updates. Automation not only saves time but also reduces the likelihood of human error.
Customizable Solutions: MSPs offer a level of customization that allows businesses to tailor solutions to their specific needs. Whether it's dedicated hosting, bare-metal server hosting, or even shared hosting, MSPs can adapt their offerings to meet your unique business requirements.
Ensuring Optimal Server Performance and Uptime
In the real world, businesses outsource IT systems to MSPS because they want a guaranteed uptime and an expert eye to keep their systems functioning as expected. It is not uncommon for growing businesses to outgrow their in-house capabilities. As a result, outsourcing empowers the company to grow at the pace your investors demand.
As your business grows, you may want to consider:
Disaster Recovery Plans: In addition to preventive measures, MSPs offer robust disaster recovery plans. These plans outline the data backup and recovery procedures, enabling quick restoration of services in the event of a catastrophic failure.
Audits and Assessments: To maintain optimal performance, MSPs conduct regular audits and assessments of the server environment. These reviews help identify potential bottlenecks or vulnerabilities impacting server performance and uptime.
High Availability Configurations: MSPs can set up high availability configurations that automatically switch to a backup server in case of failure. This ensures that services remain available even when individual components encounter issues.
Load Balancing: MSPs often employ load-balancing techniques to distribute workloads efficiently across multiple servers. This ensures that no single server is overwhelmed, optimizing performance and reducing the risk of crashes.
Exploring Advanced Server Management Techniques
MSPs are at the forefront of implementing advanced server management techniques beyond traditional methods. These techniques leverage cutting-edge technologies and methodologies to offer superior performance, security, and scalability.
Artificial Intelligence and Machine Learning: MSPs increasingly incorporate AI and machine learning algorithms into their monitoring software. These technologies can predict issues before they occur, allowing for preemptive action and reducing downtime.
Zero Trust Security Models: In a zero-trust model, every access request is fully authenticated, authorized, and encrypted before granting access, regardless of where the request originates. This enhances security by minimizing the potential for internal threats.
Infrastructure as Code (IaC): This technique allows for the automated setup, configuration, and management of servers using code. IaC enables quick deployment and scaling of server resources, making it an ideal solution for agile and DevOps environments.
Serverless Architectures: Businesses can run applications without worrying about the underlying server infrastructure in a serverless setup. This allows for automatic scaling and is particularly cost-effective as you only pay for the compute time you use.
Blockchain for Security: While still a relatively new technology in server management, blockchain offers the potential for enhancing security, particularly in ensuring data integrity and secure, transparent transactions.
Edge Computing: As IoT devices proliferate, edge computing becomes more relevant. This involves processing data closer to its source, reducing latency and bandwidth use. MSPs can manage edge computing environments as part of a comprehensive server management strategy.
Future Trends in Server Management
As technology evolves, server management is poised to undergo significant transformations. MSPs and IT professionals are closely watching several emerging trends that promise to redefine how servers are managed, optimized, and secure.
Here's a glimpse into the future of server management:
Hyperautomation: Building on the current trend of automation, hyperautomation involves using advanced technologies like AI and machine learning to automate complex decision-making processes, not just tasks. This could revolutionize how server resources are allocated and optimized.
Quantum Computing: While still in its relative infancy, quantum computing has the potential to bring about a paradigm shift in server management. Its ability to perform complex calculations at unprecedented speeds could be a game-changer for data analytics and security protocols.
5G Networks: The continued rollout of 5G is expected to significantly impact server management by enabling faster and more reliable wireless communication. This could facilitate more efficient remote server administration and open new avenues for edge computing.
Sustainability: As data centers consume vast energy, sustainability is becoming a focus. Future server management solutions may prioritize energy-efficient operations and integrate renewable energy sources.
Augmented Reality (AR): AR has the potential to aid in server management by providing real-time overlay data during physical server maintenance. This can guide technicians more effectively than traditional methods.
Blockchain Beyond Security: While currently used primarily for security, blockchain has potential applications in server management for ensuring data integrity and creating transparent, unchangeable logs of all server activities.
AI-Driven Predictive Maintenance: AI algorithms are expected to become more sophisticated, allowing for even more accurate predictive maintenance. This could minimize downtime by identifying and addressing issues before they become critical failures.
Human-AI Collaboration: Future trends may see a more collaborative approach between human administrators and AI algorithms. AI can handle routine tasks, while humans focus on strategic decision-making guided by insights and recommendations from AI.
Why Atlantic.Net's Server Management is Essential for Your Business
Comprehensive Service Suite
At Atlantic.Net, we understand that managing a server infrastructure can be a complex and time-consuming task. That's why we offer a comprehensive range of server management services to free up your IT resources, allowing you to focus on your core business. From operating system support, including Windows Server and Linux distributions, to database and cPanel assistance, our managed services are tailored to your needs.
Security and Performance
Security is a paramount concern for any business. Our server management services include vulnerability scans, patching, and updates, ensuring that your servers are always secure and up-to-date. Additionally, we offer web server support, including general security tweaks and performance optimizations. This ensures not only your data's safety but also your servers' optimal performance.
Flexibility and Customization
We offer support for various platforms and technologies, including MSSQL, MySQL, Apache, and Nginx. Whether you need assistance with email server setup, load balancing, or VPN configurations, our team is equipped to handle it all. Our managed services are not just about maintaining your servers; they're about enhancing your entire hosted infrastructure.
Monitoring and Support
Our OnWatch Platinum Monitoring Platform keeps a vigilant eye on your servers, and our dedicated account representatives are always available to assist you with any issues. We also offer server migration services, making switching to Atlantic.Net's managed platform easier.
Cost-Effectiveness
You can enjoy a 20% discount on Atlantic.Net Professional Service Agreements by leveraging our server management services. This makes our services efficient and cost-effective, providing you with excellent value for your investment.
Testimonials
Don't just take our word for it. Industry leaders like Jason Coleman, VP of Information Technology at Orlando Magic, and Erin Chapple, General Manager for Windows Server at Microsoft Corp., have praised our infrastructure and technical expertise.
Final Thoughts
The need for reliable and efficient server management cannot be overstated. Atlantic.Net's Server Management services offer a one-stop solution for all your server-related needs, ensuring your business runs smoothly and securely. Partner with us and experience the peace of mind of knowing your server infrastructure is in capable hands.
For more information or to get started, contact an advisor at 888-618-DATA (3282), email sales@atlantic.net, or fill out our online form. We're dedicated to your success and ready to develop a hosting environment tailored to your business needs.
### Managed Kubernetes
Kubernetes is an open-source platform that automates containerized application deployment, scaling, and management. Initially developed by Google, it has since been donated to the Cloud Native Computing Foundation (CNCF), which now maintains the project.
The essence of Kubernetes lies in its ability to manage many containers, ensuring they interact seamlessly across multiple hosts. Containers are the building blocks of modern software architecture, encapsulating an application and its dependencies into a 'container,' making moving the application across various computing environments easier.
When the number of containers grows, manual management becomes inefficient and error-prone. This is where Kubernetes comes into play. It offers a powerful orchestration system that allows for more efficient deployment and scaling of applications, reducing the burden on IT teams and streamlining the software delivery process.
This article will help you to understand what Kubernetes clusters are, how they work, and what a fully managed Kubernetes service should involve.
Key Components of Kubernetes
Kubernetes comprises several key components that help in automating and managing containerized applications:
Control Plane: The central control hub that manages the overall Kubernetes environment. It is responsible for scheduling deployments and maintaining the cluster's desired state.
Worker Nodes: These are the machines where containers are deployed. A node may host multiple containers depending on the requirements and configuration.
Pods: The smallest deployable unit in a Kubernetes cluster is a pod, each containing one or more containers.
Service Discovery: Kubernetes uses its internal DNS for service discovery, making it easier for applications within the cluster to find each other.
Traffic Distribution: Automatically distributing incoming application traffic across multiple targets, such as pods or nodes, is a critical feature provided by Kubernetes.
Kubernetes Cluster
A Kubernetes cluster is a set of machines, known as nodes, that run containerized applications. These managed Kubernetes clusters can run on various environments, from on-premises servers to public cloud infrastructure. A cluster is generally composed of one master node that coordinates the activities of multiple worker nodes where the containers are deployed.
Managed Kubernetes Services
Enterprises that find it challenging to manage and deploy Kubernetes clusters on their own often turn to managed Kubernetes services. Such services cover various aspects of cluster management, such as scaling, monitoring, and security, allowing businesses to focus on application development rather than infrastructure management.
Why Use Kubernetes?
Kubernetes offers several benefits that make it a popular choice for organizations:
High Availability: Kubernetes can automatically distribute and schedule containers across a cluster of machines to ensure that applications are highly available.
Scalability: With built-in auto-scaling features, Kubernetes can easily adapt to the varying load on an application, scaling it up or down as needed.
Portability: Being an open-source platform, Kubernetes can run on multiple types of infrastructure, providing businesses with flexibility in their deployment options.
Robust Ecosystem: The vibrant community around Kubernetes offers a wealth of plugins, extensions, and add-ons that can be used to extend its capabilities.
Innovate, deploy, and operate Kubernetes seamlessly
Kubernetes is a transformative tool in its ability to facilitate containerized applications' seamless deployment node management and operation. Here's a closer look at how Kubernetes enables innovation, eases deployment, and simplifies operational tasks.
Facilitating Innovation with Kubernetes
Kubernetes encourages a culture of innovation by providing a robust and flexible platform for deploying containerized applications. Teams can iterate faster, experiment with new features, and make changes with minimal friction. The extensibility of the Kubernetes ecosystem also allows for the integration of third-party tools and services, thereby opening avenues for innovation.
Microservices Architecture: Kubernetes is exceptionally well-suited for microservices, a modern architectural style that breaks down applications into loosely coupled, independently deployable components. This makes it easier to update specific parts of an application without affecting the whole system, accelerating innovation.
Built-in Monitoring: Kubernetes offers a range of monitoring tools that provide insights into performance metrics, error rates, and usage patterns. This data can inform iterative development, enabling teams to build more reliable and user-centric applications.
Simplified Deployment Process
Deploying applications can be a cumbersome process that involves numerous steps, like provisioning servers, configuring software, and setting up databases. Kubernetes drastically simplifies this process:
Automated Rollouts and Rollbacks: Kubernetes can manage the rollout of new features and configurations without causing downtime. It can also automate the rollback to a previous state if something goes wrong.
Configuration Management: Kubernetes allows you to securely store and manage sensitive information, such as passwords and API keys. These configurations can be deployed and updated independently from the application code.
Multi-Environment Support: Whether it's a development, staging, or production environment, Kubernetes provides the toolset to manage them with a consistent workflow, reducing the chances of environment-specific bugs.
Streamlined Operational Tasks
Managing day-to-day operations of containerized applications becomes less cumbersome with Kubernetes:
Self-Healing Capabilities: If a pod or node fails, Kubernetes automatically replaces it or reschedules the containers to other nodes. This ensures high availability without manual intervention.
Resource Optimization: Kubernetes can automatically allocate and de-allocate resources, such as CPU and memory, based on your requirements and constraints. This leads to more efficient utilization of underlying hardware resources.
Access Management: With Kubernetes Role-Based Access Control (RBAC), you can define what actions a user, or a group of users, can perform. This granularity in access management enhances the security posture of your applications.
Load Balancer and Pod Autoscaling
Resource optimization is a critical component in any Kubernetes environment. It distributes incoming application traffic across multiple nodes, thereby ensuring that no single node is overwhelmed with too much load. This is crucial for applications that experience varying traffic levels, as it helps maintain high availability and reliability.
The Importance of Load Balancing in Managed Kubernetes
In a managed K8s service, load balancing is often provided as a built-in feature, eliminating the need for manual configuration. This is particularly beneficial for businesses that may not have the expertise to set up and manage load-balancing resources. The fully managed service distributes the load across multiple nodes, enhancing the performance and reliability of your Kubernetes clusters.
Types of Traffic Distribution in Kubernetes
Kubernetes offers several types of traffic distribution, each serving a specific purpose:
Layer 4 Load Balancing: Operates at the network layer and is generally faster but less flexible.
Layer 7 Load Balancing: Operates at the application layer, offering more flexibility in terms of routing and traffic management.
When utilizing traffic management in a managed Kubernetes environment, consider the following best practices:
Health Checks: Ensure that your managed Kubernetes providers offer health checks to automatically remove unhealthy nodes from the connection pool.
Scalability: Opt for a solution that scales clusters automatically based on the incoming traffic, ensuring optimal resource utilization.
Pod autoscaling is another indispensable feature in Kubernetes, particularly for applications that experience fluctuating traffic patterns. It automatically adjusts the number of pod replicas in the cluster nodes of a deployment or replica set based on observed metrics like CPU utilization or custom metrics defined by the user.
Pod autoscaling in Kubernetes operates on the principle of metrics collection. Metrics such as CPU and memory usage are collected and analyzed to determine whether to scale the pods in or out. The control plane plays a vital role in managing Kubernetes during this process, making decisions based on the metrics it receives.
When leveraging pod autoscaling in a managed Kubernetes environment, keep the following best practices in mind:
Metric Selection: Choose the right metrics that accurately reflect the performance and needs of your application.
Resource Limits: Set appropriate resource limits and requests to ensure that the autoscale can make more accurate scaling decisions.
Easy Deployment, from Development to Production
In a managed Kubernetes environment, the service provider takes care of many of the complexities associated with deploying Kubernetes clusters. This includes initial setup and ongoing management tasks like updates, monitoring, and scaling. This ease of deployment is particularly beneficial for businesses that may not have extensive in-house expertise in Kubernetes but still want to leverage its powerful features for their applications.
Development to Production Workflow
Managed K8s services often have built-in CI/CD (Continuous Integration/Continuous Deployment) tools that make moving from development to production easier. These tools automate the testing and deployment phases, ensuring that code changes are automatically built, tested, and deployed to the Kubernetes clusters. This results in a more efficient and error-free development workflow.
When leveraging the easy, flexible deployment options and features of a managed Kubernetes service, consider the following best practices:
Version Control: Always use version control systems like Git to manage your Kubernetes configurations and application code.
Automated Testing: Integrate automated testing into your CI/CD pipeline to catch issues early in development.
Monitoring and Alerts: Utilize your managed Kubernetes service's monitoring and alerting features to keep track of application performance and issues.
Multiple versions and upgrades
Keeping up with the rapid pace of Kubernetes updates is a challenging task. Each new version brings a host of improvements, bug fixes, and new features that can significantly impact your cluster's performance and capabilities. Managed Kubernetes services excel in this area by offering support for multiple versions and seamless upgrades.
Version Management
Managing multiple versions in a Kubernetes cluster can be complex, but managed Kubernetes services simplify this process. They offer features like version rollback and phased rollouts, which allow you to test new versions in a controlled environment before deploying them across your entire cluster.
Upgrades
Upgrades in a managed Kubernetes service are typically automated, reducing the risk of human error and system downtime. Before any upgrade, it's advisable to back up your cluster's data and configurations. Managed services often provide tools for this, ensuring that you can quickly revert to a previous state in case of any issues.
When managing multiple versions and upgrades in a managed Kubernetes environment, consider the following best practices:
Compatibility Checks: Ensure that your applications and configurations are compatible with the new version before upgrading.
Staging Environment: Use a staging environment to test new versions before rolling them out to production.
Scheduled Upgrades: Take advantage of scheduled upgrades offered by many managed k8s services to minimize impact during peak business hours.
Managed Kubernetes Service Providers
When it comes to managed K8s services, there are several key players in the market that offer robust, feature-rich solutions. These providers often come with unique features, pricing models, and supported cloud environments, making it essential for businesses to choose the one that best aligns with their specific needs.
Major Cloud Providers
Many of the major cloud providers offer managed k8s services, each with its own set of features and benefits:
Google Kubernetes Engine (GKE): Offered by Google Cloud, GKE is known for its high-performance and premium networking features. It provides an environment for deploying, managing, and scaling containerized applications using Google's infrastructure.
Amazon Elastic Kubernetes Service (EKS): One of Amazon's vast cloud offerings, EKS integrates seamlessly with services like Amazon Virtual Private Cloud and offers robust security features, making it a popular choice for enterprises.
Azure Kubernetes Service (AKS): Provided by Microsoft, AKS offers deep integration with Azure's suite of cloud services. It is known for its enterprise-grade security and compliance features.
VMware Tanzu Kubernetes Grid: Unlike cloud-specific providers, VMware's Tanzu Kubernetes Grid allows for multi-cloud and on-premises deployments, offering greater flexibility for businesses with complex infrastructure needs.
Considerations for Choosing a Provider
When selecting a managed Kubernetes service, consider the following:
Feature Set: Different providers offer different features, such as auto-scaling, integrated CI/CD pipelines, and advanced monitoring tools.
Compliance and Security: Ensure that the provider meets your organization's compliance and security requirements.
Cost: Pricing models can vary significantly between providers, so it's important to understand the cost implications of your chosen solution.
Compatibility: Ensure that the provider's service is compatible with your existing infrastructure and tools.
Support and Maintenance: Opt for providers that offer comprehensive support and automated management features, including updates and monitoring.
Community and Ecosystem: A strong community and a rich ecosystem of third-party integrations can be valuable assets when working with Kubernetes.
Running Kubernetes Clusters on Atlantic.Net
Experience the power of Kubernetes with minikube on Atlantic.Net. Our cloud and dedicated servers provide the perfect environment for you to deploy your minikube cluster, offering you a streamlined, efficient way to manage your containerized applications.
Elevate your DevOps game—get started with Atlantic.Net today!
### How to Install Caddy Web Server on Fedora
Caddy is an open-source, cross-platform, enterprise-ready web server written in Go language. Caddy can be configured to serve websites directly from its file system, or it can proxy requests to other web servers. It is a cross-platform web server that runs on different operating systems such as Linux, macOS, Windows, BSD, and Solaris. If you are looking for a high-performance, flexible, and easy-to-use web server, then Caddy is the best option for you.
In this post, we will show you how to install and use the Caddy web server on Fedora Linux.
Step 1 - Install Caddy
By default, the Caddy web server package is available in the Fedora default repository. You can install it using the following command.
dnf install caddy -y
Once the Caddy package is installed, you can verify the Caddy installation using the following command.
caddy version
You will see the Caddy version in the following output.
2.3.0-1.fc34
Next, edit the Caddy default configuration file.
nano /etc/caddy/Caddyfile
Make the following changes:
:80 {
root * /usr/share/caddy
file_server
}
Save and close the file, then start and enable the Caddy service with the following command.
systemctl enable --now caddy
You can verify the Caddy service status using the following command.
systemctl status caddy
Output:
● caddy.service - Caddy web server
Loaded: loaded (/usr/lib/systemd/system/caddy.service; enabled; vendor preset: disabled)
Active: active (running) since Tue 2023-09-19 01:10:59 EDT; 4s ago
Docs: https://caddyserver.com/docs/
Process: 7150 ExecStartPre=/usr/bin/caddy validate --config /etc/caddy/Caddyfile (code=exited, status=0/SUCCESS)
Main PID: 7155 (caddy)
Tasks: 5 (limit: 2328)
Memory: 16.7M
CPU: 140ms
CGroup: /system.slice/caddy.service
└─7155 /usr/bin/caddy run --environ --config /etc/caddy/Caddyfile
Now, open your web browser and access the Caddy default page using the URL http://your-server-ip. You will see the Caddy default page on the following screen.
Step 2 - Create a New Site with Caddy
In this section, we will create a new website using Caddy.
First, create a document root and log directory for Caddy.
mkdir -p /var/www/example.com/html
mkdir /var/log/caddy
Next, assign proper permissions to those directories.
chown caddy:caddy /var/www/example.com/html -R
chown caddy:caddy /var/log/caddy
Next, create an Index page for your website.
nano /var/www/example.com/html/index.html
Add the following code:
Congratulations! Caddy is working
Save and close the file when you are done.
Step 3 - Configure Caddy for Your Website
Next, you will need to configure the Caddy configuration file to serve your website.
nano /etc/caddy/Caddyfile
Remove the default configuration and add the following configuration.
caddy.example.com:80 {
root * /var/www/example.com/html
file_server
encode gzip
log {
output file /var/log/caddy/example.access.log
}
@static {
file
path *.ico *.css *.js *.gif *.jpg *.jpeg *.png *.svg *.woff *.pdf *.webp
}
header @static Cache-Control max-age=5184000
}
Save and close the file, then validate the Caddy configuration.
caddy validate --adapter caddyfile --config /etc/caddy/Caddyfile
If everything is fine, you will see the following output.
2023/09/19 05:12:35.854 INFO using provided configuration {"config_file": "/etc/caddy/Caddyfile", "config_adapter": "caddyfile"}
2023/09/19 05:12:35.860 INFO http server is listening only on the HTTPS port but has no TLS connection policies; adding one to enable TLS {"server_name": "srv0", "https_port": 443}
2023/09/19 05:12:35.861 INFO http enabling automatic HTTP->HTTPS redirects {"server_name": "srv0"}
2023/09/19 05:12:35.861 INFO tls.cache.maintenance started background certificate maintenance {"cache": "0xc0004902a0"}
2023/09/19 05:12:35.863 INFO tls.cache.maintenance stopped background certificate maintenance {"cache": "0xc0004902a0"}
Valid configuration
Finally, restart the Caddy service to apply the changes.
systemctl restart caddy
Step 4 - Access the Caddy Website
At this point, your Caddy web server is configured to serve your new website. Now, it's time to verify the website.
Open your web browser and access your website using the URL http://caddy.example.com. You will see your website page on the following screen.
Conclusion
Congratulations! You have successfully installed and configured the Caddy web server on Fedora Linux. You can now start deploying high-performance websites using the Caddy web server. Try to deploy the Caddy web server on dedicated server hosting from Atlantic.Net!
### How to Install and Configure Redis on Fedora
Redis is an in-memory data store used to store metadata about users' profiles, authentication information, and manifest files. It is primarily used as an application cache or quick-response database. It is designed for real-time applications such as gaming, ad-tech, and financial services. It allows you to write fewer lines of code to store, access, and use data in your applications.
In this post, we will show you how to install Redis on Fedora Linux.
Step 1 - Install Redis
By default, the Redis package is included in the Fedora default repo. You can install it using the following command.
dnf install redis -y
After the installation, start and enable the Redis service using the following command.
systemctl enable --now redis
You can check the status of the Redis service using the following command.
systemctl status redis
Output:
● redis.service - Redis persistent key-value database
Loaded: loaded (/usr/lib/systemd/system/redis.service; disabled; vendor preset: disabled)
Drop-In: /etc/systemd/system/redis.service.d
└─limit.conf
Active: active (running) since Tue 2023-09-19 00:45:48 EDT; 14min ago
Main PID: 4066 (redis-server)
Status: "Ready to accept connections"
Tasks: 5 (limit: 2328)
Memory: 2.0M
CPU: 1.619s
CGroup: /system.slice/redis.service
└─4066 /usr/bin/redis-server 127.0.0.1:6379
Sep 19 00:45:48 fedora systemd[1]: Starting Redis persistent key-value database...
Sep 19 00:45:48 fedora systemd[1]: Started Redis persistent key-value database.
At this point, Redis is started and listens on port 6379. You can check it with the following command.
ss -antpl | grep -i redis
Output:
LISTEN 0 511 127.0.0.1:6379 0.0.0.0:* users:(("redis-server",pid=4066,fd=6))
LISTEN 0 511 [::1]:6379 [::]:* users:(("redis-server",pid=4066,fd=7))
Step 2 - Configure Redis
Redis' default configuration file is located at /etc/redis/redis.conf. You will need to edit it to secure Redis.
nano /etc/redis/redis.conf
Change the following lines.
bind 0.0.0.0
requirepass yourpass
appendonly yes
appendfilename "appendonly.aof"
Save and close the file, then restart the Redis service to apply the changes.
systemctl restart redis
Step 3 - Verify Redis Connection
At this point, Redis is installed and configured. Now, connect to the Redis instance using the Redis CLI.
redis-cli
Next, authenticate Redis using a password.
127.0.0.1:6379> AUTH yourpass
Next, check the Redis connectivity.
127.0.0.1:6379> PING
Output:
PONG
Run the following command to get Redis server information.
127.0.0.1:6379> INFO Server
Output:
# Server
redis_version:6.2.7
redis_git_sha1:00000000
redis_git_dirty:0
redis_build_id:63e4c6cb7f542ebb
redis_mode:standalone
os:Linux 5.12.8-300.fc34.x86_64 x86_64
arch_bits:64
monotonic_clock:POSIX clock_gettime
multiplexing_api:epoll
atomicvar_api:c11-builtin
gcc_version:11.2.1
process_id:6207
process_supervised:systemd
run_id:4e86466f757313d4572daf01911d9914c5cfb3ec
tcp_port:6379
server_time_usec:1695099789257222
uptime_in_seconds:25
uptime_in_days:0
hz:10
configured_hz:10
lru_clock:600973
executable:/usr/bin/redis-server
config_file:/etc/redis/redis.conf
io_threads_active:0
Step 4 - Benchmark Redis
Redis has a built-in benchmark tool used to send a pre-defined number of requests to the server to measure performance.
Let's run the following command to check the average number of requests per second that Redis can handle.
redis-benchmark -a yourpass -h 127.0.0.1 -q
Output:
PING_INLINE: 165837.48 requests per second
PING_BULK: 156006.25 requests per second
SET: 156006.25 requests per second
GET: 136425.66 requests per second
INCR: 155038.77 requests per second
LPUSH: 173913.05 requests per second
RPUSH: 139275.77 requests per second
LPOP: 136798.91 requests per second
RPOP: 137362.64 requests per second
SADD: 149031.30 requests per second
HSET: 168067.22 requests per second
SPOP: 151975.69 requests per second
ZADD: 170648.45 requests per second
You can also use the -c and -t options to use 20 parallel connections to run 100000 SET requests on the server:
redis-benchmark -a yourpass -h 127.0.0.1 -p 6379 -n 100000 -c 20
Output:
====== PING_INLINE ======
100000 requests completed in 3.87 seconds
20 parallel clients
3 bytes payload
keep alive: 1
host configuration "save": 3600 1 300 100 60 10000
host configuration "appendonly": yes
multi-thread: no
Latency by percentile distribution:
0.000% <= 0.159 milliseconds (cumulative count 2129)
50.000% <= 0.391 milliseconds (cumulative count 50188)
75.000% <= 0.503 milliseconds (cumulative count 75368)
87.500% <= 0.567 milliseconds (cumulative count 88337)
93.750% <= 0.631 milliseconds (cumulative count 93856)
96.875% <= 0.703 milliseconds (cumulative count 97127)
98.438% <= 0.751 milliseconds (cumulative count 98549)
99.219% <= 0.791 milliseconds (cumulative count 99243)
99.609% <= 0.839 milliseconds (cumulative count 99630)
99.805% <= 0.999 milliseconds (cumulative count 99808)
99.902% <= 1.279 milliseconds (cumulative count 99903)
99.951% <= 1.599 milliseconds (cumulative count 99953)
99.976% <= 2.007 milliseconds (cumulative count 99976)
99.988% <= 2.151 milliseconds (cumulative count 99988)
99.994% <= 2.687 milliseconds (cumulative count 99994)
99.997% <= 2.791 milliseconds (cumulative count 99997)
99.998% <= 2.847 milliseconds (cumulative count 99999)
99.999% <= 2.863 milliseconds (cumulative count 100000)
100.000% <= 2.863 milliseconds (cumulative count 100000)
To see the real-time latency stats for your Redis server, run the following command.
redis-cli --latency
Output:
min: 0, max: 8, avg: 0.25 (5217 samples)
Conclusion
In this post, we explained how to install the Redis server on Fedora Linux. We also showed you how to secure Redis with a password and verify its connectivity. Then, we used the redis-benchmark tool to measure the performance of the Redis server. You can now try Redis on dedicated server hosting from Atlantic.Net!
### Email Security Requirements in Major Compliance Standards: HIPAA, GDPR, PCI DSS
Email has become an indispensable communication tool for both businesses and individuals. As such, the security of email communication is of paramount importance. From ensuring the confidentiality of patient health information under HIPAA, to protecting personal data under GDPR, to securing financial information as per PCI DSS, compliance with email security requirements is both a legal obligation and a best practice.
However, simply adhering to the letter of these standards is not enough. With the evolving nature of cyber threats, it's imperative that organizations remain vigilant, continuously update their security practices, and foster a culture of security awareness among their staff. The goal is not just compliance but the creation of a secure environment where the integrity, availability, and confidentiality of email data are preserved at all times.
What Is Email Security?
Email security is a broad term that refers to a variety of techniques and methodologies used to protect email accounts, content, and communication against unauthorized access, loss, or compromise. Cybercriminals and hackers are constantly on the prowl for weaknesses they can exploit, and email is often a prime target.
Email security involves various methods and procedures to keep email data private and secure. These measures include the use of strong passwords, encryption, secure email gateways, and regularly updating and patching email software to ensure vulnerabilities are not exploited.
Moreover, email security doesn't only focus on the security of the email itself, but also on the security of the email infrastructure. It includes measures to secure the mail servers, the network connections to the mail servers, and the user's end devices that receive the emails.
Common Email Security Measures Required by Compliance Standards
Many compliance standards have specific requirements related to email security. Below we provide specifics for HIPAA, GDPR, and PCI DSS. But first, let’s review some basic security measures that are common to these and many other compliance standards.
End-to-End Encryption
Most compliance standards emphasize the importance of encryption, particularly end-to-end encryption. This form of encryption ensures that only the sender and the intended recipient can read the email content, making it an essential tool for securing email communication.
Multi-Factor Authentication
Multi-factor authentication (MFA) is another common measure required by compliance standards. MFA requires users to provide two or more pieces of evidence to authenticate their identity when accessing their email accounts, adding an extra layer of security that makes it harder for unauthorized individuals to gain access.
Regular Audits and Monitoring
Regular audits and monitoring of email systems are another common requirement. Audits help organizations identify potential vulnerabilities and monitor the effectiveness of their security measures, while continuous monitoring enables them to detect and respond to threats in real time.
Data Retention and Backup
Another common requirement of compliance standards is proper data retention and backup strategies for business email. These strategies ensure that important emails can be recovered in the event of data loss, while also ensuring that unnecessary email data is not retained longer than necessary.
Staff Training and Awareness Programs
Finally, staff training and awareness programs are a typical requirement of compliance frameworks. This helps employees understand the importance of email security and equips them with the knowledge and skills to identify and respond to potential threats.
HIPAA Email Security Requirements
The Health Insurance Portability and Accountability Act (HIPAA) sets forth specific requirements for email security, especially for those handling protected health information (PHI).
Encryption of Emails Containing Protected Health Information (PHI)
Encryption is a method of converting information into an unreadable code to prevent unauthorized access. When it comes to emails containing PHI, encryption is crucial. HIPAA requires that all PHI transmitted over an open network must be encrypted to a standard that renders it unreadable, undecipherable, and unusable to unauthorized individuals.
Authentication and Access Controls
HIPAA also requires authentication measures to verify the identities of individuals who request access to PHI. This often involves the use of unique user identification, emergency access procedures, automatic logoff, and encryption and decryption procedures.
Regular Audits and Monitoring of Email Systems
Regular audits and monitoring are also a key part of HIPAA's email security requirements. This involves keeping track of attempted access, successful and unsuccessful access, and any modifications or deletions of PHI. This helps in identifying any potential security threats and allows for swift action to mitigate them.
Retention and Backup of Email Data
HIPAA requires that PHI be retained for a certain period and that it can be restored in case of loss. For this, it's important to have robust backup systems in place. This involves backing up email data regularly and ensuring that backups are secure.
Training for Staff on Secure Email Communication Protocols
Finally, staff training is an essential aspect of HIPAA's email security requirements. It's important that all staff members understand the importance of email security and are aware of the protocols in place to safeguard PHI. This can go a long way in preventing data breaches and ensuring compliance with HIPAA.
GDPR Email Security Requirements
The General Data Protection Regulation (GDPR), a regulation in EU law on data protection and privacy, also sets forth specific requirements for email security.
Requirement for Explicit Consent for Email Marketing
Under GDPR, explicit consent is required for email marketing. This means that organizations must obtain clear, affirmative consent from individuals before sending them marketing emails. It's also important to keep records of these consents.
Use of Encryption and Pseudonymization Techniques
Similar to HIPAA, the GDPR also requires the use of encryption in certain circumstances. In addition to this, the GDPR encourages the use of pseudonymization techniques. This involves replacing identifiable data with artificial identifiers to protect individuals' identities.
Data Breach Notification Rules Related to Email Data
GDPR has strict rules when it comes to data breaches. Organizations are required to notify the relevant supervisory authority of a breach within 72 hours of becoming aware of it, unless the breach is unlikely to result in a risk to the rights and freedoms of individuals. If the breach is high risk, the organization may also need to notify the individuals affected.
Limitation and Purpose Specification: Only Collecting Relevant Email Data
GDPR enforces a principle known as data minimization. This principle requires organizations to only collect personal data that's necessary for a specified purpose. In the context of email security, this means only collecting relevant email data.
For example, if an organization is sending out a newsletter, it only needs the recipient’s email address, not their physical address or financial information. Limiting the amount of information collected can reduce the potential damage in case of a data breach.
Rights to Access, Rectify and Erase Personal Email Data
Another aspect of GDPR is the empowerment of individuals regarding their personal data. The regulation provides individuals with the right to access their data, rectify any inaccuracies, and erase their data.
In email security, this means that organizations should have mechanisms in place that allow individuals to review, correct, or delete their email data if they wish to do so. This reinforces the individual's control over their data and indirectly strengthens email security by reducing unnecessary data storage.
PCI DSS Email Security Requirements
The Payment Card Industry Data Security Standard (PCI DSS) is a set of security standards designed to ensure that all companies that accept, process, store, or transmit credit card information maintain a secure environment. Email communications often involve the transmission of such sensitive information, making PCI DSS highly relevant in the field of email security.
Encryption of Emails Containing Cardholder Data
One of the primary requirements of PCI DSS is the encryption of cardholder data during transmission over open, public networks. In the context of email security, this means that any emails containing cardholder data should be encrypted. Encryption converts the readable data into an unreadable format to anyone without the decryption key, ensuring the confidentiality of the information if intercepted during transmission.
Strong Access Controls and Authentication Mechanisms
PCI DSS also mandates strong access controls and authentication mechanisms. For email security, this could mean implementing multi-factor authentication (MFA) for accessing email accounts, especially those used for financial transactions. Access controls can also involve restricting access to certain email accounts only to specific individuals or roles within an organization.
Regular Vulnerability Scans and Monitoring of Email Systems
To maintain a secure environment, PCI DSS requires regular vulnerability scans and monitoring of systems. This means that organizations should regularly check their email systems for potential weaknesses or vulnerabilities that could be exploited by cybercriminals. Regular monitoring can also help detect any unusual or suspicious activity in the email system in real-time.
Restriction of Cardholder Data to a Need-to-Know Basis
Another key requirement of PCI DSS is restricting access to cardholder data on a need-to-know basis. This principle of 'least privilege' minimizes the number of individuals who can access sensitive data, thereby reducing the risk of internal threats and data breaches.
Requirement for Security Policies and Staff Training Related to Email Handling
Finally, PCI DSS emphasizes the importance of having robust security policies in place and providing staff training related to handling email. This helps ensure that all employees are aware of their responsibilities in maintaining email security and know how to identify and respond to potential threats.
Conclusion
In conclusion, email security is a complex field that is strongly impacted by regulations and compliance standards. By adhering to compliance requirements and implementing the security measures discussed above, organizations can support compliance efforts while also significantly enhancing the security of their email communications.
Author Bio: Gilad David Maayan
Gilad David Maayan is a technology writer who has worked with over 150 technology companies including SAP, Imperva, Samsung NEXT, NetApp and Check Point, producing technical and thought leadership content that elucidates technical solutions for developers and IT leadership. Today he heads Agile SEO, the leading marketing agency in the technology industry.
LinkedIn: Linkedin
### How to Install Wiki.js on Fedora
Wiki.js is a free and open-source wiki software solution written in JavaScript and running on the Node.js runtime. It is cross-platform and is compatible with PostgreSQL, MySQL, MariaDB, MS SQL Server, or SQLite. It offers an intuitive admin panel that allows you to manage all aspects of your wiki. It has a built-in visual editor that allows you to write all content in Markdown files and sync with your remote Git repository.
In this post, we will show you how to install Wiki.js on Fedora Linux.
Step 1 - Install Nginx and MariaDB
Before starting, you will need to install Nginx, MariaDB, Redis, and Node.js on your server. You can install all of them using the following command.
dnf install nginx mariadb-server nodejs npm redis -y
Once all the packages are installed, start and enable all required services.
systemctl start nginx mariadb redis
systemctl enable nginx mariadb redis
Step 2 - Configure MariaDB Database
Wiki.js uses MariaDB as a database backend, so you will need to create a database and user for Wiki.js.
First, connect to the MariaDB shell.
mysql
Next, create a database and user for Wiki.js.
CREATE DATABASE wikijs;
GRANT ALL PRIVILEGES ON wikijs.* TO 'wikijs'@'localhost' IDENTIFIED BY 'password';
Next, flush the privileges and exit from the MariaDB shell.
FLUSH PRIVILEGES;
QUIT;
Step 3 - Download Wiki.js
First, download the latest version of Wiki.js from Git Hub.
curl -s https://api.github.com/repos/Requarks/wiki/releases/latest \
| grep browser_download_url \
| grep -v windows \
| cut -d '"' -f 4 \
| wget -qi -
Next, create a directory for Wiki.js and extract the downloaded file inside that directory.
mkdir -p /var/www/html/wikijs
tar zxf wiki-js.tar.gz -C /var/www/html/wikijs
Next, navigate to the Wiki.js directory and copy the sample configuration file.
cd /var/www/html/wikijs
cp config.sample.yml config.yml
Next, edit the Wiki.js configuration file.
nano config.yml
Change the following lines.
port: 3000
type: mariadb
host: localhost
port: 3306
user: wikijs
pass: 'password'
db: wikijs
bindIP: 0.0.0.0
Save and close the file, then verify the configuration using the following command.
node server
If everything is fine, you will get the following output.
Loading configuration from /var/www/html/wikijs/config.yml... OK
2023-09-19T04:50:39.759Z [MASTER] info: =======================================
2023-09-19T04:50:39.762Z [MASTER] info: = Wiki.js 2.5.300 =====================
2023-09-19T04:50:39.762Z [MASTER] info: =======================================
2023-09-19T04:50:39.763Z [MASTER] info: Initializing...
2023-09-19T04:50:40.675Z [MASTER] info: Using database driver mysql2 for mariadb [ OK ]
2023-09-19T04:50:40.688Z [MASTER] info: Connecting to database...
2023-09-19T04:50:40.789Z [MASTER] info: Database Connection Successful [ OK ]
2023-09-19T04:50:41.770Z [MASTER] warn: DB Configuration is empty or incomplete. Switching to Setup mode...
2023-09-19T04:50:41.771Z [MASTER] info: Starting setup wizard...
2023-09-19T04:50:41.980Z [MASTER] info: Starting HTTP server on port 3000...
2023-09-19T04:50:41.981Z [MASTER] info: HTTP Server on port: [ 3000 ]
2023-09-19T04:50:41.990Z [MASTER] info: HTTP Server: [ RUNNING ]
2023-09-19T04:50:41.990Z [MASTER] info: 🔻🔻🔻🔻🔻🔻🔻🔻🔻🔻🔻🔻🔻🔻🔻🔻🔻🔻🔻🔻🔻🔻🔻🔻🔻🔻🔻🔻🔻
2023-09-19T04:50:41.991Z [MASTER] info:
2023-09-19T04:50:41.991Z [MASTER] info: Browse to http://YOUR-SERVER-IP:3000/ to complete setup!
2023-09-19T04:50:41.991Z [MASTER] info:
2023-09-19T04:50:41.991Z [MASTER] info: 🔺🔺🔺🔺🔺🔺🔺🔺🔺🔺🔺🔺🔺🔺🔺🔺🔺🔺🔺🔺🔺🔺🔺🔺🔺🔺🔺🔺🔺
Press CTRL+C to stop the server.
Step 4 - Create a Systemd Service File for Wiki.js
Next, create a systemd file to manage the Wiki.js service.
nano /etc/systemd/system/wiki.service
Add the following configuration:
[Unit]
Description=Wiki.js
After=network.target
[Service]
Type=simple
ExecStart=/usr/bin/node server
Restart=always
User=nginx
Environment=NODE_ENV=production
WorkingDirectory=/var/www/html/wikijs
[Install]
WantedBy=multi-user.target
Save and close the file, then change the ownership of the Wiki.js directory.
chown -R nginx:nginx /var/www/html/wikijs
Next, reload the systemd daemon to reload the configuration.
systemctl daemon-reload
Finally, start and enable the Wiki.js service to start at the system reboot.
systemctl enable --now wiki.service
You can check the status of the Wiki.js using the following command.
systemctl status wiki
You will see the following output.
● wiki.service - Wiki.js
Loaded: loaded (/etc/systemd/system/wiki.service; enabled; vendor preset: disabled)
Active: active (running) since Tue 2023-09-19 00:51:27 EDT; 4s ago
Main PID: 4388 (node)
Tasks: 11 (limit: 2328)
Memory: 55.8M
CPU: 1.710s
CGroup: /system.slice/wiki.service
└─4388 /usr/bin/node server
Sep 19 00:51:28 fedora node[4388]: 2023-09-19T04:51:28.996Z [MASTER] warn: DB Configuration is empty or incomplete. Switching to Setup mode...
Sep 19 00:51:28 fedora node[4388]: 2023-09-19T04:51:28.996Z [MASTER] info: Starting setup wizard...
Sep 19 00:51:29 fedora node[4388]: 2023-09-19T04:51:29.181Z [MASTER] info: Starting HTTP server on port 3000...
Sep 19 00:51:29 fedora node[4388]: 2023-09-19T04:51:29.182Z [MASTER] info: HTTP Server on port: [ 3000 ]
Sep 19 00:51:29 fedora node[4388]: 2023-09-19T04:51:29.190Z [MASTER] info: HTTP Server: [ RUNNING ]
Sep 19 00:51:29 fedora node[4388]: 2023-09-19T04:51:29.191Z [MASTER] info: 🔻🔻🔻🔻🔻🔻🔻🔻🔻🔻🔻🔻🔻🔻🔻🔻🔻🔻🔻🔻🔻🔻🔻🔻🔻🔻🔻🔻🔻
Sep 19 00:51:29 fedora node[4388]: 2023-09-19T04:51:29.191Z [MASTER] info:
Sep 19 00:51:29 fedora node[4388]: 2023-09-19T04:51:29.191Z [MASTER] info: Browse to http://YOUR-SERVER-IP:3000/ to complete setup!
Sep 19 00:51:29 fedora node[4388]: 2023-09-19T04:51:29.192Z [MASTER] info:
Sep 19 00:51:29 fedora node[4388]: 2023-09-19T04:51:29.192Z [MASTER] info: 🔺🔺🔺🔺🔺🔺🔺🔺🔺🔺🔺🔺🔺🔺🔺🔺🔺🔺🔺🔺🔺🔺🔺🔺🔺🔺🔺🔺🔺
Step 5 - Configure Nginx Virtual Host
Next, create an Nginx virtual host configuration file for Wiki.js.
nano /etc/nginx/conf.d/wikijs.conf
Add the following configuration:
server {
listen 80;
server_name wiki.example.com;
location / {
proxy_set_header Host $http_host;
proxy_set_header X-Real-IP $remote_addr;
proxy_pass http://127.0.0.1:3000;
proxy_http_version 1.1;
proxy_set_header Upgrade $http_upgrade;
proxy_set_header Connection "upgrade";
proxy_next_upstream error timeout http_502 http_503 http_504;
}
}
Save and close the file, then edit the Nginx main configuration file.
nano /etc/nginx/nginx.conf
Add the following line after http{:
server_names_hash_bucket_size 64;
Save the file, then verify the Nginx configuration.
nginx -t
Output:
nginx: the configuration file /etc/nginx/nginx.conf syntax is ok
nginx: configuration file /etc/nginx/nginx.conf test is successful
Finally, restart the Nginx service to apply the changes.
systemctl restart nginx
Step 6 - Access Wiki.js
Now, open your web browser and access Wiki.js using the URL http://wiki.example.com. You will see the site configuration screen.
Define your admin email, password, and site URL, and click on INSTALL. You will see the Wiki.js login screen.
Provide your admin username and password and click on Log in. You will see the Wiki.js welcome screen.
Click on ADMINISTRATION. You will see the Wiki.js dashboard on the following screen.
Conclusion
In this tutorial, you learned how to install Wiki.js with Nginx on Fedora Linux. You can now explore the Wiki.js administration panel and start creating your own Wiki site within a few minutes. You can now try Wiki.js on dedicated server hosting from Atlantic.Net!
### How to Install and Configure Nginx with PHP-FPM on Fedora
Nginx is an open-source HTTP server that allows developers to quickly build and deploy interactive websites. Nginx uses PHP-FPM (FastCGI Process Manager) for processing PHP pages. PHP-FPM uses less memory and CPU as compared to traditional CGI-based methods of running PHP. Configuring the Nginx with PHP-FPM can improve the website's loading speed and allow it to handle a huge amount of traffic in no time.
In this post, we will show you how to install Nginx with PHP-FPM on Fedora Linux.
Step 1 - Install Nginx Web Server
First, you will need to install the Nginx server package on your server. You can install it using the following command.
dnf install nginx -y
Once the Nginx package is installed, start and enable the Nginx service with the following command.
systemctl start nginx
systemctl enable nginx
Step 2 - Install PHP and PHP-FPM
Next, install the PHP and PHP-FPM packages using the following command.
dnf install php php-cli php-common php-fpm -y
After installing all the packages, start and enable the PHP-FPM service.
systemctl start php-fpm
systemctl enable php-fpm
You can check the status of the PHP-FPM service with the following command.
systemctl status php-fpm
You will see the following output.
● php-fpm.service - The PHP FastCGI Process Manager
Loaded: loaded (/usr/lib/systemd/system/php-fpm.service; disabled; vendor preset: disabled)
Active: active (running) since Tue 2023-09-19 01:06:35 EDT; 3s ago
Main PID: 6994 (php-fpm)
Status: "Ready to handle connections"
Tasks: 6 (limit: 2328)
Memory: 10.0M
CPU: 74ms
CGroup: /system.slice/php-fpm.service
├─6994 php-fpm: master process (/etc/php-fpm.conf)
├─6995 php-fpm: pool www
├─6996 php-fpm: pool www
├─6997 php-fpm: pool www
├─6998 php-fpm: pool www
└─6999 php-fpm: pool www
Sep 19 01:06:35 fedora systemd[1]: Starting The PHP FastCGI Process Manager...
Sep 19 01:06:35 fedora systemd[1]: Started The PHP FastCGI Process Manager.
Step 3 - Configure PHP-FPM with Nginx
Next, you will need to configure Nginx to run PHP with FPM. First, create a document root directory for your site.
mkdir -p /var/www/html/
Next, create a sample info.php file.
nano /var/www/html/info.php
Add the following code:
Save and close the file, then set proper ownership to info.php file.
chown -R nginx: /var/www/html/info.php
Next, create an Nginx virtual host configuration file.
nano /etc/nginx/conf.d/example.conf
Add the following configuration:
server {
listen 80;
server_name nginx.example.com;
root /var/www/html/;
index info.php;
access_log /var/log/nginx/example.com.access.log;
error_log /var/log/nginx/example.com.error.log;
location ~ \.php$ {
try_files $uri =404;
fastcgi_pass unix:/run/php-fpm/www.sock;
fastcgi_index index.php;
fastcgi_param SCRIPT_FILENAME $document_root$fastcgi_script_name;
include fastcgi_params;
}
location ~* \.(js|css|png|jpg|jpeg|gif|ico|svg)$ {
expires max;
log_not_found off;
}
}
Save and close the file, then edit the Nginx main configuration file.
nano /etc/nginx/nginx.conf
Add the following line after http{.
server_names_hash_bucket_size 64;
Save and close the file, then verify the Nginx for any syntax errors.
nginx -t
Finally, restart the Nginx service to apply the changes.
systemctl restart nginx
Step 4 - Verify the Setup
At this point, Nginx is configured to work with PHP-FPM. Now, open your web browser and verify your setup using the URL http://nginx.example.com. You will see your PHP information page on the following screen.
Conclusion
In this tutorial, you have learned to configure the Nginx web server with PHP-FPM on the Fedora Linux system. You can also use PHP-FPM to run multiple PHP versions on a single machine. You can now deploy Nginx with PHP-FPM on dedicated server hosting from Atlantic.Net.
### Full Guideline to Install Backdrop CMS on Fedora
Backdrop CMS is an open-source and community-developed content management system written in PHP. It is a fork of the Drupal project and offers an administration panel for managing CMS. It is a simple, lightweight, and mobile-friendly CMS that allows you to create, edit, and manage your content with ease. Backdrop CMS offers multiple add-ons, plugins, themes, and layouts that help you to increase the additional functionality.
In this post, we will show you how to install Backdrop CMS on Fedora Linux.
Step 1 - Install Apache, MariaDB, and PHP
First, install the Apache and MariaDB server using the following command.
dnf install httpd mariadb-server -y
Next, install PHP with other required dependencies using the following command.
dnf install php php-cli php-fpm php-gd php-mysqlnd php-json php-curl php-pdo php-mbstring php-dom php-xml unzip -y
Once all the packages are installed, start and enable Apache, MariaDB, and PHP-FPM services.
systemctl start httpd mariadb php-fpm
systemctl enable httpd mariadb php-fpm
Step 2 - Create a Database for Backdrop
Next, you will need to create a database and user for Backdrop CMS.
First, log in to MariaDB.
mysql
Next, create a database and user for Backdrop CMS.
CREATE DATABASE backdrop;
CREATE USER 'backdrop'@'localhost' IDENTIFIED BY 'password';
Next, grant all the privileges to the Backdrop database.
GRANT ALL PRIVILEGES ON backdrop.* TO 'backdrop'@'localhost';
Finally, flush the privileges and exit from the MariaDB shell.
FLUSH PRIVILEGES;
EXIT;
Step 3 - Download Backdrop
First, download the latest version of Backdrop CMS with the following command.
wget https://github.com/backdrop/backdrop/releases/download/1.26.0/backdrop.zip
Next, unzip the downloaded file.
unzip backdrop.zip
Next, move the extracted directory to the Apache document root.
mv backdrop /var/www/html/backdrop
Next, set proper permissions and ownership to the Backdrop directory.
chown -R apache:apache /var/www/html/backdrop
chmod -R 755 /var/www/html/backdrop
Step 4 - Configure Apache for Backdrop CMS
Next, you will need to create an Apache virtual host configuration file for Backdrop CMS.
nano /etc/httpd/conf.d/backdrop.conf
Add the following configuration:
ServerAdmin admin@example.com
ServerName backdrop.example.com
DocumentRoot /var/www/html/backdrop
allowoverride all
allow from all
TransferLog /var/log/httpd/backdrop_access.log
ErrorLog /var/log/httpd/backdrop_error.log
Save and close the file, then restart the Apache service to implement the changes.
systemctl restart httpd
Step 5 - Access Backdrop CMS
Now, open your web browser and access the Backdrop CMS using the URL http://backdrop.example.com. You will see the language selection screen.
Select your language and click on SAVE AND CONTINUE. You will see the database configuration screen.
Define your database configuration and click on SAVE AND CONTINUE. You will see the site configuration screen.
Define your site information and click on SAVE AND CONTINUE. You will see the Backdrop CMS dashboard screen.
Conclusion
Congratulations! You have successfully installed Backdrop CMS with Apache on Fedora Linux. Now, explore the Backdrop CMS features and create your own website via the Backdrop CMS panel. Let's deploy the Backdrop CMS on dedicated server hosting from Atlantic.Net!
### How to Install Cockpit Web Console on Fedora
Cockpit is a free, open-source, web-based tool used to manage and administer multiple remote Linux servers via a web interface. It is lightweight, easy to use, and allows you to interact directly with the operating system from a real Linux session in a browser. It is designed for beginner users and helps them to perform many tasks such as starting containers, storage administration, network configuration, inspecting logs, and so on.
In this post, we will show you how to install and use Cockpit on Fedora Linux.
Step 1 - Install Cockpit
By default, the Cockpit package is included in the Fedora default repo. You can install it using the following command.
dnf install cockpit -y
After installing Cockpit, start and enable the Cockpit service.
systemctl start cockpit
systemctl enable cockpit
You can check the status of the Cockpit using the following command.
systemctl status cockpit
You will see the following output:
● cockpit.service - Cockpit Web Service
Loaded: loaded (/usr/lib/systemd/system/cockpit.service; static)
Active: active (running) since Tue 2023-09-19 00:56:12 EDT; 3s ago
TriggeredBy: ● cockpit.socket
Docs: man:cockpit-ws(8)
Process: 5239 ExecStartPre=/usr/sbin/remotectl certificate --ensure --user=root --group=cockpit-ws --selinux-type=etc_t (code=exited, status=0/SUCCESS)
Main PID: 5250 (cockpit-tls)
Tasks: 1 (limit: 2328)
Memory: 1.1M
CPU: 1.666s
CGroup: /system.slice/cockpit.service
└─5250 /usr/libexec/cockpit-tls
Sep 19 00:56:10 fedora systemd[1]: Starting Cockpit Web Service...
Sep 19 00:56:12 fedora remotectl[5249]: /usr/bin/chcon: can't apply partial context to unlabeled file '/etc/cockpit/ws-certs.d/0-self-signed.cert'
Sep 19 00:56:12 fedora remotectl[5239]: remotectl: couldn't change SELinux type context 'etc_t' for certificate: /etc/cockpit/ws-certs.d/0-self-signed.cert: Child proc>
Sep 19 00:56:12 fedora systemd[1]: Started Cockpit Web Service.
Step 2 - Configure Firewall
If firewalld is installed and configured in your system then you will also need to allow Cockpit service via firewalld. You can allow it using the following command.
firewall-cmd --add-service=cockpit --permanent
firewall-cmd --reload
Step 3 - Access Cockpit
At this point, the Cockpit is started and listens on port 9090. You can check it with the following command.
ss -antpl | grep 9090
You will see the following output:
LISTEN 0 4096 *:9090 *:* users:(("cockpit-tls",pid=5250,fd=3),("systemd",pid=1,fd=53))
Now, open your web browser and access the Cockpit web interface using the URL http://server_ip:9090. You will see the Cockpit login page.
Provide your root username and password and click on the Login button. You will see the Cockpit dashboard on the following screen.
Click on the Services button. You will see the status of all system services on the following screen.
Click on Terminal. You will see your Linux terminal screen on the following screen.
From here, you can run any command in your Linux system.
Conclusion
In this post, you learned how to install and use Cockpit on Fedora Linux. Cockpit is designed to enable beginner users to manage a Linux system without any advanced knowledge. Try to deploy Cockpit on dedicated server hosting from Atlantic.Net!
### How to Use "Docker Push" and "Docker Pull" Command to Upload and Download Images To Docker Hub
The Docker pull command is used for downloading Docker images from the Docker Hub or private registry. By default, it will download the images from the Docker Hub. You will need to specify the name of the private registry if you want to pull from it.
The Docker push command is used to upload or share images to the Docker Hub registry. Before pushing an image to the Docker Hub, you will need to create an account on Docker Hub.
Step 1 - Docker Pull Command
In this section, we will show you how to pull a Docker image from the Docker Hub.
The basic syntax to pull a Docker image from the Docker Hub is shown below:
docker pull [OPTIONS] NAME[:TAG|@DIGEST]
Run the Docker pull command followed by the --help option to see all available options.
docker pull --help
You will see all the options that you can use with the Docker pull command as shown below:
To understand better, let's download the Ubuntu 22.04 image from the Docker Hub.
docker pull ubuntu:22.04
This will download the Ubuntu 22.04 image from the Docker Hub registry as shown below:
To verify your downloaded image, run the following command.
docker images
You will see your downloaded Ubuntu 22.04 image in the following output:
REPOSITORY TAG IMAGE ID CREATED SIZE
ubuntu 22.04 d70eaf7277ea 12 days ago 72.9MB
Step 2 - Update and Commit an Image
At this point, you have the Ubuntu 22.04 image in your system. Now, we will create a container from this image, install the Nginx package, and save this container to a new image named nginx-instance.
First, create a new container from the Ubuntu 22.04 image.
docker run -t -i ubuntu:22.04 /bin/bash
This will create a new container and attach it to the bash shell as shown below:
root@013aecdd6919:/#
Now, update the package index and install the Nginx package inside the container.
root@013aecdd6919:/# apt-get update -y
root@013aecdd6919:/# apt-get install nginx -y
Next, exit from the container with the following command:
root@013aecdd6919:/# exit
Next, locate your new container ID using the following command:
dokcer ps -a
You should get the container ID in the following output:
CONTAINER ID IMAGE COMMAND CREATED STATUS PORTS NAMES
013aecdd6919 ubuntu:22.04 "/bin/bash" 3 minutes ago Exited (0) 33 seconds ago angry_mayer
Next, use the container ID from the above output and save the updated container with a new image named nginx-instance.
docker commit "013aecdd6919" nginx-instance
Note: Replace the 013aecdd6919 with your container ID.
You can now verify your newly created “nginx-instance” image with the following command:
docker images
You will see your nginx-instance image in the following output.
REPOSITORY TAG IMAGE ID CREATED SIZE
nginx-instance latest 12cefc9b5362 57 seconds ago 158MB
ubuntu 22.04 d70eaf7277ea 12 days ago 72.9MB
Step 3 - Docker Push Command
At this point, you have your own custom Docker image named nginx-instance in your system. We will now use the Docker push command to push the nginx-instance image to the Docker Hub registry.
Note: To push an image to the Docker Hub registry, you will need to create an account on Docker Hub.
First, log in to the Docker Hub using the docker login command:
docker login
You will be asked to provide your Docker Hub username and password as shown below:
Next, tag the nginx-instance image that matches with your Docker Hub username:
docker tag 12cefc9b5362 hitjethva/nginx-instance:ubuntu
A brief explanation of the above command is shown below:
12cefc9b5362 is the ID of the nginx-instance image.
hitjethva is your Docker Hub username.
nginx-instance is the name of the image that you want to push.
You can now verify your tagged image using the following command:
docker images
You should see the following output:
REPOSITORY TAG IMAGE ID CREATED SIZE
hitjethva/nginx-instance ubuntu 12cefc9b5362 12 minutes ago 158MB
nginx-instance latest 12cefc9b5362 12 minutes ago 158MB
ubuntu 22.04 d70eaf7277ea 12 days ago 72.9MB
Finally, push your hitjethva/nginx-instance image to the Docker Hub using the following command:
docker push hitjethva/nginx-instance
This will push an nginx-instance image to the Docker Hub registry as shown below.
You can now login to the Docker Hub using your web browser and verify your nginx-instance image in Repositories:
Conclusion
In this tutorial, you learned how to use the Docker pull and pull command to download and upload images to the Docker Hub registry. You can now start building your own custom Docker images, store them on the Docker Hub registry, and share them with other developers and users. Docker Hub service makes it easier for users to push their local images to Docker Hub and pull them from Docker Hub per their needs. Try to use Docker on dedicated server hosting from Atlantic.Net!
### Using MySQL with Ruby on Rails App on Ubuntu 22.04
Ruby is an interpreted, high-level, and general-purpose language developed by Yukihiro Matsumoto. Ruby on Rails is a powerful web framework built on top of Ruby. It is used as a backend for several web applications such as GitHub, Spotify, and more. Ruby on Rails can also be integrated with several databases including MySQL, SQLite, and PostgreSQL.
Step 1 - Install and Configure MySQL
First, install the MySQL server and client library with the following command.
apt install mysql-server-8.0 libmysqlclient-dev
Once the MySQL server is installed, secure MySQL with the following command.
mysql_secure_installation
Answer all the questions as shown below.
Press y|Y for Yes, any other key for No: Y
Remove anonymous users? (Press y|Y for Yes, any other key for No) : Y
Disallow root login remotely? (Press y|Y for Yes, any other key for No) : Y
Remove test database and access to it? (Press y|Y for Yes, any other key for No) : Y
Reload privilege tables now? (Press y|Y for Yes, any other key for No) : Y
Next, connect to MySQL with the following command.
mysql -u root --skip-password
Set a password for the root user using the following command.
ALTER USER 'root'@'localhost' IDENTIFIED WITH mysql_native_password BY 'securepassword';
Next, flush the privileges and exit from the MySQL shell.
FLUSH PRIVILEGES;
EXIT;
Step 2 - Install rbenv
First, install all required dependencies using the following command.
apt install git curl libssl-dev libreadline-dev zlib1g-dev autoconf bison build-essential libyaml-dev libreadline-dev libncurses5-dev libffi-dev libgdbm-dev
After successful installation, install rbenv with the following command.
apt install rbenv libtool
Next, initialize rbenv.
rbenv init
Output:
eval "$(rbenv init -)"
Next, edit the .bashrc file and add the above output.
nano ~/.bashrc
Add the following line:
eval "$(rbenv init -)"
Next, reload the .bashrc file.
source ~/.bashrc
Next, install rbenv plugin to provide support for the rbenv install command.
mkdir -p "$(rbenv root)"/plugins
git clone https://github.com/rbenv/ruby-build.git "$(rbenv root)"/plugins/ruby-build
Next, verify your rbenv configuration with the following command.
curl -fsSL https://github.com/rbenv/rbenv-installer/raw/main/bin/rbenv-doctor | bash
You will see the following output:
Checking for `rbenv' in PATH: /usr/bin/rbenv
Checking for rbenv shims in PATH: OK
Checking `rbenv install' support: /root/.rbenv/plugins/ruby-build/bin/rbenv-install (ruby-build 20231014-3-g1d9b4e2)
Counting installed Ruby versions: none
There aren't any Ruby versions installed under `/root/.rbenv/versions'.
You can install Ruby versions like so: rbenv install 3.2.2
Auditing installed plugins: OK
Step 3 - Install Ruby
First, list all available Ruby versions using the following command:
rbenv install -l
Next, install a specific Ruby version with the following command:
rbenv install 3.2.0
Next, set the Ruby version as a global version:
rbenv global 3.2.0
You can now verify the Ruby version with the following command:
ruby --version
Output:
ruby 3.0.2p107 (2021-07-07 revision 0db68f0233) [x86_64-linux-gnu]
Step 4 - Install Ruby on Rails
First, install the gem bundler with the following command:
gem install bundler
Next, install Ruby on Rails using the following command:
gem install rails
Next, rehash Rails with the following command:
rbenv rehash
To verify the Rails version, run the following command:
rails -v
Output:
Rails 7.1.1
Next, install the MySQL gem adapter to connect to the MySQL server.
gem install mysql2
Step 5 - Create a Rails App and Configure MySQL Connection
At this point, all the required components of Ruby on Rails are installed. Now, let's create a new application named myapp with the following command:
rails new myapp -d mysql
Next, change the directory to myapp application and exit the database configuration file.
cd myapp
nano config/database.yml
Define your MySQL root username and password as shown below:
default: &default
adapter: mysql2
encoding: utf8mb4
pool: <%= ENV.fetch("RAILS_MAX_THREADS") { 5 } %>
username: root
password: securepassword
socket: /var/run/mysqld/mysqld.sock
Save and close the file, then create the necessary databases with the following command.
rake db:create
Step 6 - Verify Configuration
Finally, start the Rails server to verify the configuration.
rails server --binding=0.0.0.0
If everything is fine, you will see the following output:
=> Booting Puma
=> Rails 7.1.1 application starting in development
=> Run `bin/rails server --help` for more startup options
Puma starting in single mode...
* Puma version: 6.4.0 (ruby 3.2.0-p0) ("The Eagle of Durango")
* Min threads: 5
* Max threads: 5
* Environment: development
* PID: 69257
* Listening on http://0.0.0.0:3000
Use Ctrl-C to stop
Now, open your web browser and access the Ruby on Rails app using the URL http://your-server-ip:3000. You will see the following screen.
Conclusion
In this post, we explained how to install Ruby on Rails and connect it to the MySQL database on Ubuntu 22.04. Ruby on Rails supports several database engines. If you need concurrency and scaling, then MySQL will be a better choice for your project. You can now integrate MySQL with the Ruby on Rails application on dedicated server hosting from Atlantic.Net!
### How To Install JFrog Artifactory on Ubuntu 22.04
JFrog Artifactory is a powerful open-source repository management software and DevOps solution used for managing and automating all software packages and artifacts during the application delivery process. JFrog Artifactory provides a central management portal from where you can host, store, and distribute all artifacts and binaries. It can be integrated easily with most CI/CD platforms with other DevOps tools.
Step 1 - Install Java JDK
JFrog is a Java-based software, so Java JDK must be installed on your server. If not installed, you can install it with the following command.
apt install -y default-jdk
Once Java JDK is installed, you can verify the Java version using the following command.
java -version
You will see the following output:
openjdk version "11.0.20.1" 2023-08-24
OpenJDK Runtime Environment (build 11.0.20.1+1-post-Ubuntu-0ubuntu122.04)
OpenJDK 64-Bit Server VM (build 11.0.20.1+1-post-Ubuntu-0ubuntu122.04, mixed mode, sharing)
Step 2 - Install MariaDB Database
JFrog uses MariaDB as a database backend, so you will need to install the latest MariaDB version on your server. First, add the MariaDB repository using the following command.
curl -LsS https://downloads.mariadb.com/MariaDB/mariadb_repo_setup | bash -s --
Next, update the repository and install the MariaDB package with the following command.
apt update
apt install mariadb-server mariadb-client -y
Once the installation is complete, start and enable the MariaDB service.
systemctl start mariadb
systemctl enable mariadb
Step 3 - Install JFrog Artifactory
By default, the JFrog Artifactory package is not included in the Ubuntu default repository, so you will need to add the JFrog Artifactory repository to APT. You can add it with the following command:
echo "deb https://releases.jfrog.io/artifactory/artifactory-debs xenial main" | tee -a /etc/apt/sources.list.d/artifactory.list
curl -fsSL https://releases.jfrog.io/artifactory/api/gpg/key/public|sudo gpg --dearmor -o /etc/apt/trusted.gpg.d/artifactory.gpg
Next, update the repository cache with the following command:
apt update -y
Finally, install the JFrog Artifactory with the following command:
apt install jfrog-artifactory-oss
After successful installation, start and enable the JFrog Artifactory service:
systemctl start artifactory.service
systemctl enable artifactory.service
You can verify the status of JFrog Artifactory with the following command:
systemctl status artifactory.service
Output:
● artifactory.service - Artifactory service
Loaded: loaded (/lib/systemd/system/artifactory.service; enabled; vendor preset: enabled)
Active: active (running) since Sun 2023-10-15 10:50:35 UTC; 10s ago
Process: 7599 ExecStart=/opt/jfrog/artifactory/app/bin/artifactoryManage.sh start (code=exited, status=0/SUCCESS)
Main PID: 11264 (java)
Tasks: 0 (limit: 9410)
Memory: 191.8M
CPU: 11.878s
CGroup: /system.slice/artifactory.service
‣ 11264 /opt/jfrog/artifactory/app/third-party/java/bin/java -Djava.util.logging.config.file=/opt/jfrog/artifactory/app/artifactory/tomcat/conf/logging.pr>
Oct 15 10:50:31 ubuntu su[11941]: pam_unix(su:session): session opened for user artifactory(uid=998) by (uid=0)
Oct 15 10:50:32 ubuntu su[11941]: pam_unix(su:session): session closed for user artifactory
Oct 15 10:50:32 ubuntu su[12065]: (to artifactory) root on none
Oct 15 10:50:32 ubuntu su[12065]: pam_unix(su:session): session opened for user artifactory(uid=998) by (uid=0)
Oct 15 10:50:33 ubuntu su[12182]: (to artifactory) root on none
Oct 15 10:50:33 ubuntu su[12182]: pam_unix(su:session): session opened for user artifactory(uid=998) by (uid=0)
Oct 15 10:50:34 ubuntu su[12309]: (to artifactory) root on none
Oct 15 10:50:34 ubuntu su[12309]: pam_unix(su:session): session opened for user artifactory(uid=998) by (uid=0)
Oct 15 10:50:35 ubuntu su[12309]: pam_unix(su:session): session closed for user artifactory
Oct 15 10:50:35 ubuntu systemd[1]: Started Artifactory service.
Next, log in to the MariaDB shell with the following command:
mysql
Next, import the Artifactory data to the MariaDB database.
source /opt/jfrog/artifactory/app/misc/db/createdb_mariadb.sql;
Next, exit from the MariaDB shell.
exit;
Step 4 - Access JFrog Artifactory Web UI
At this point, JFrog Artifactory is installed and listening on port 8082. You can check it with the following command:
ss -antpl | grep 8082
Output:
LISTEN 0 4096 *:8082 *:* users:(("jf-router",pid=11783,fd=18))
Now, open your web browser and access the JFrog Artifactory using the URL http://server-ip:8082/ui/. You will see the JFrog welcome page.
Provide default admin username as "admin" and password as "password" then click on the Login button. You will see the Getting Started page.
Click on Get Started. You will see the reset admin password screen.
Set your password and click on Next. You will see the following screen.
Provide your JFrog URL and click on the Next or Skip button. You will see the following screen.
Click on the Finish button. You will see the JFrog dashboard.
Conclusion
In this post, we explained how to install and set up a JFrog Artifactory on Ubuntu 22.04. You can now deploy JFrog in the production environment and use it as a central repository manager to store all binaries and artifacts with ease. Try to deploy JFrog Artifactory on dedicated server hosting from Atlantic.Net!
### Deploying a Go Web Application Using Nginx on Ubuntu 22.04
Go is an open-source and general-purpose programming language developed by Google. It is cross-platform, lightweight, and simple to build with, making it an ideal choice for software developers. It produces compiled machine code binaries so you don’t need source code compilation to create an executable file. Go language syntax is very similar to C language and offers a rich set of features such as structural typing, garbage collection, memory safety, and more.
Step 1 - Install Go Language
By default, the Go package is included in the Ubuntu default repository. You can install it using the following command.
apt install golang-go -y
Once the Go package is installed, you can verify its version with the following command:
go version
Output:
go version go1.18.1 linux/amd64
Step 2 - Create a Simple Go Application
In this section, we will create a Go application that will print "Hello Go Application" when accessing the domain.
First, create a project directory for your application.
mkdir project
Next, navigate to the project directory and initiate the project with the following command:
cd project
go mod init go.example.com/app
Next, create a Go application file.
nano main.go
Add the following code:
package main
import (
"fmt"
"net/http"
)
func main() {
http.HandleFunc("/", func(w http.ResponseWriter, r *http.Request) {
fmt.Fprintf(w, "Hello Go Application")
})
http.HandleFunc("/greet/", func(w http.ResponseWriter, r *http.Request) {
name:= r.URL.Path[len("/greet/"):]
fmt.Fprintf(w, "Hello %s\n", name)
})
http.ListenAndServe(":9990", nil)
}
Save and close the file, then compile the file into the executable binary file.
go build main.go
You can see the executable binary file using the following command:
ls -l
Output:
total 6152
-rw-r--r-- 1 root root 35 Oct 15 15:43 go.mod
-rwxr-xr-x 1 root root 6288896 Oct 15 15:44 main
-rw-r--r-- 1 root root 408 Oct 15 15:44 main.go
Step 3 - Create a Systemd Service File for Your Application
Next, you will need to create a systemd file to manage the Go application.
nano /lib/systemd/system/goweb.service
Add the following configurations:
[Unit]
Description=goweb
[Service]
Type=simple
Restart=always
RestartSec=5s
ExecStart=/root/project/main
[Install]
WantedBy=multi-user.target
Save and close the file, then reload the systemd daemon to apply the changes.
systemctl daemon-reload
Next, start and enable the Go service using the following command:
systemctl start goweb
systemctl enable goweb
You can check the status of the Go service with the following command:
systemctl status goweb
Output:
● goweb.service - goweb
Loaded: loaded (/lib/systemd/system/goweb.service; disabled; vendor preset: enabled)
Active: active (running) since Sun 2023-10-15 15:45:37 IST; 3s ago
Main PID: 47830 (main)
Tasks: 6 (limit: 9180)
Memory: 1.1M
CPU: 6ms
CGroup: /system.slice/goweb.service
└─47830 /root/project/main
Oct 15 15:45:37 ubuntupc systemd[1]: Started goweb.
Step 4 - Configure Nginx as a Reverse Proxy
Next, you will need to install and configure Nginx as a reverse proxy for the Go application. First, install the Nginx package with the following command:
apt install nginx
Next, create an Nginx virtual host configuration file.
nano /etc/nginx/conf.d/go.conf
Add the following configuration:
server {
server_name go.example.com;
location / {
proxy_pass http://localhost:9990;
}
}
Save and close the file, then verify the Nginx for any syntax errors.
nginx -t
Output:
nginx: the configuration file /etc/nginx/nginx.conf syntax is ok
nginx: configuration file /etc/nginx/nginx.conf test is successful
Then, restart the Nginx service to reload the changes.
systemctl restart nginx
Step 5 - Access Go Application
Now, open your web browser and access the Go application using the URL http://go.example.com. You will see the following screen.
You can also greet with a specific keyword using the URL http://go.example.com:/greet/atlantic. You will see the following screen.
Conclusion
In this post, we explained how to install Go and create a simple application on Ubuntu 22.04. We also configured the Nginx as a reverse proxy to access the application using the domain name. You can now deploy the Go application on dedicated server hosting from Atlantic.Net!
### Configuring Basic HTTP Authentication with Nginx on Ubuntu 24.04
Nginx is a popular free web server used to host a website or web application online. Sometimes you may need to protect some external sections that contain sensitive information on your website. In this case, you can implement password protection to secure your data. Nginx has the ability to secure web directories by setting up basic authentication.
Step 1 - Install Nginx Web Server
Before starting, Nginx must be installed on your server. If not installed, you can install it using the following command.
apt install nginx -y
Once Nginx is installed, start and enable the Nginx service.
systemctl start nginx
systemctl enable nginx
Step 2 - Create a Password File Using OpenSSL
To set up a basic authentication, you will need to create a password file to store username and password information.
First, create a password file named .htpasswd and add a user called testuser.
sh -c "echo -n 'testuser:' >> /etc/nginx/.htpasswd"
Then, add a password for this user.
sh -c "openssl passwd -apr1 >> /etc/nginx/.htpasswd"
Set your user's password as shown below.
Password:
Verifying - Password:
You can now verify your username and encrypted password using the following command.
cat /etc/nginx/.htpasswd
Output:
testuser:$apr1$YyYXPvbO$JaXhAmiNPeapbbWano6gj.
Step 3 - Create a Password File Using Apache Utils
You can also create a password file using the Apache Utils. In this method, you will need to install the apache2-utils package to your server.
apt install apache2-utils
Next, create a new user named newuser as shown below:
htpasswd /etc/nginx/.htpasswd newuser
Set a password for this user.
New password:
Re-type new password:
Adding password for user newuser
Next, verify your added user and password using the following command:
cat /etc/nginx/.htpasswd
Output:
testuser:$apr1$YyYXPvbO$JaXhAmiNPeapbbWano6gj.
newuser:$apr1$du.hu6U1$JD8cjsbzPNv89NPBXaTRJ1
Step 4 - Set Up Password Authentication in NGINX
Next, you will need to add the password authentication directives to the NGINX configuration file for your website.
nano /etc/nginx/sites-enabled/default
Add the auth_basic and auth_basic_user_file directives to your existing configuration as shown below:
server {
listen 80 default_server;
listen [::]:80 default_server;
root /var/www/html;
index index.html;
server_name _;
location / {
try_files $uri $uri/ =404;
auth_basic "Basic Authentication";
auth_basic_user_file /etc/nginx/.htpasswd;
}
}
Save and close the file, then restart the Nginx service to apply the changes.
systemctl restart nginx
Step 5 - Verify the Password Authentication
At this point, your Nginx website is protected with a password. You can now verify it using the URL http://your-server-ip. You will be asked to provide your username and password as shown below.
Type your username and password and click on the Sign In button to access your website content.
Conclusion
In this post, you learned how to protect your web directory in Nginx with password authentication. Implementing password protection is essential to restrict access to sensitive content of your website. Try to set up a basic authentication with Nginx on dedicated server hosting from Atlantic.Net!
### How to Manage Packages with pkg Binary Package Manager on FreeBSD
Package manager is a collection of software tools used to install, remove upgrade, and manage programs in a computer system. Package management is an essential skill when working in a command-line interface. FreeBSD provides a pkg package manager to install and manage different packages via the command line.
Step 1 - Getting Help Information
Before working with a pkg package manager, we will show you how to use the pkg command with the help flag to find all sub-commands.
To see all available options of the pkg command, run the following command:
pkg help
You will see all supported sub-commands in the following output:
Commands supported:
add Compatibility interface to install a package
alias List the command line aliases
annotate Add, modify or delete tag-value style annotations on packages
audit Reports vulnerable packages
autoremove Removes orphan packages
check Checks for missing dependencies and database consistency
clean Cleans old packages from the cache
config Display the value of the configuration options
create Creates software package distributions
delete Deletes packages from the database and the system
fetch Fetches packages from a remote repository
help Displays help information
info Displays information about installed packages
install Installs packages from remote package repositories and local archives
lock Locks package against modifications or deletion
plugins Manages plugins and displays information about plugins
query Queries information about installed packages
register Registers a package into the local database
remove Deletes packages from the database and the system
repo Creates a package repository catalogue
rquery Queries information in repository catalogues
search Performs a search of package repository catalogues
set Modifies information about packages in the local database
ssh Package server (to be used via ssh)
shell Opens a debug shell
shlib Displays which packages link against a specific shared library
stats Displays package database statistics
triggers Execute deferred triggers
unlock Unlocks a package, allowing modification or deletion
update Updates package repository catalogues
updating Displays UPDATING information for a package
upgrade Performs upgrades of packaged software distributions
version Displays the versions of installed packages
which Displays which package installed a specific file
If you want to see the help information of any sub-command, run the following command:
pkg help search
You will see how to use the pkg command with the search sub-command:
NAME
pkg search – search package repository catalogues
SYNOPSIS
pkg search [-U] [-r reponame] [-S search] [-L label] [-Q query-modifier]
[-Cegix] pattern
pkg search [-cDdfopqRsU] [-r reponame] [-Cegix] pattern
pkg search [--no-repo-update] [--repository reponame] [--search search]
[--label label] [--query-modifier query-modifier]
[--{case-sensitive,exact,glob,case-insensitive,regex}] pattern
pkg search [--{comment,description,depends-on,full,origins,prefix}]
[--{quiet,raw,size,no-repo-update}] [--repository reponame]
[--{case-sensitive,exact,glob,case-insensitive,regex}]
[--raw-format format] pattern
To see the help information about the install sub-command, run the following command:
pkg help install
You will see the following command:
NAME
pkg install – install packages from remote package repositories or local
archives
SYNOPSIS
pkg install [-AfIMnFqRUy] [-r reponame] [-Cgix]
...
pkg install [--{automatic,force,no-scripts,ignore-missing}]
[--{dry-run,fetch-only,quiet,recursive,no-repo-update,yes}]
[--repository reponame]
[--{case-sensitive,glob,case-insensitive,regex}]
...
Step 2 - Search Packages Using pkg Command
The basic syntax to search a package is shown below.
pkg search package-name
For example, to search for Nginx packages, run the following command:
pkg search nginx
You will see all Nginx packages in the following output:
nginx-1.24.0_12,3 Robust and small WWW server
nginx-devel-1.25.2_7 Robust and small WWW server
nginx-lite-1.24.0,3 Robust and small WWW server (lite package)
nginx-naxsi-1.24.0,3 Robust and small WWW server (plus NAXSI)
nginx-prometheus-exporter-0.11.0_2 Prometheus exporter for NGINX and NGINX Plus stats
nginx-ultimate-bad-bot-blocker-4.2020.03.2005_1 Nginx bad bot and other things blocker
nginx-vts-exporter-0.10.7_14 Server that scraps NGINX vts stats and export them via HTTP
p5-Nginx-ReadBody-0.07_1 Nginx embeded perl module to read and evaluate a request body
p5-Nginx-Simple-0.07_1 Perl 5 module for easy to use interface for Nginx Perl Module
p5-Test-Nginx-0.30 Testing modules for Nginx C module development
py39-certbot-nginx-2.6.0 NGINX plugin for Certbot
To see the information about a specific package, use the -f flag followed by the package name.
pkg search -f nginx-1.24.0_12,3
You will see the following output:
nginx-1.24.0_12,3
Name : nginx
Version : 1.24.0_12,3
Origin : www/nginx
Architecture : FreeBSD:13:amd64
Prefix : /usr/local
Repository : FreeBSD [pkg+http://pkg.FreeBSD.org/FreeBSD:13:amd64/quarterly]
Categories : www
Licenses : BSD2CLAUSE
Maintainer : joneum@FreeBSD.org
WWW : https://nginx.com/
Comment : Robust and small WWW server
Step 3 - Install Packages Using pkg Command
The basic syntax to install a package is shown below.
pkg install package-name
For example, to install an Nginx package, run the following command:
pkg install nginx
If you want to download the package without installing it on your system, run the following command:
pkg fetch nginx
To download the package with all of its dependencies use the -d flag.
pkg fetch -d nginx
You can see all fetched packages in the /var/cache/pkg directory.
ls /var/cache/pkg
Output:
brotli-1.1.0,1.pkg indexinfo-0.3.1~bd05368104.txz nettle-3.9.1.pkg
brotli-1.1.0,1~2e5f90142a.pkg libassuan-2.5.6.pkg nettle-3.9.1~6bc5253893.pkg
e2fsprogs-1.46.2.txz libassuan-2.5.6~7b204af578.pkg nginx-1.24.0_12,3.pkg
e2fsprogs-1.46.2~a2abff02bc.txz libedit-3.1.20221030,1.pkg nginx-1.24.0_12,3~af8e35c324.pkg
e2fsprogs-1.46.2~b1851d3194.txz libedit-3.1.20221030,1~02edf68058.pkg npth-1.6.pkg
e2fsprogs-1.47.0.pkg libffi-3.4.4.pkg npth-1.6~55fe55fef2.pkg
e2fsprogs-1.47.0~196e9c9c54.pkg libffi-3.4.4~3c80f31254.pkg p11-kit-0.24.1_2.pkg
e2fsprogs-core-1.47.0.pkg libgcrypt-1.10.2.pkg p11-kit-0.24.1_2~d841595c85.pkg
e2fsprogs-core-1.47.0~584e640d80.pkg libgcrypt-1.10.2~4ef2ab992e.pkg pcre2-10.42.pkg
e2fsprogs-libblkid-1.46.2.txz libgpg-error-1.47.pkg pcre2-10.42~0252e988c3.pkg
e2fsprogs-libblkid-1.46.2~11342cdd9e.txz libgpg-error-1.47~a11cc8f9f8.pkg perl5-5.34.1_3.pkg
e2fsprogs-libblkid-1.46.2~d0aac929ad.txz libhsts-0.1.0.pkg perl5-5.34.1_3~be88f18f29.pkg
To remove packages from the cache directory, run the following command:
pkg clean
Output:
The following package files will be deleted:
/var/cache/pkg/e2fsprogs-1.46.2~b1851d3194.txz
/var/cache/pkg/gettext-runtime-0.21.txz
/var/cache/pkg/e2fsprogs-1.46.2.txz
/var/cache/pkg/e2fsprogs-libuuid-1.46.2~b78457aa6b.txz
/var/cache/pkg/gettext-runtime-0.21~7f53ebc469.txz
/var/cache/pkg/e2fsprogs-libuuid-1.46.2.txz
/var/cache/pkg/e2fsprogs-libblkid-1.46.2~11342cdd9e.txz
/var/cache/pkg/e2fsprogs-libblkid-1.46.2.txz
/var/cache/pkg/indexinfo-0.3.1~bd05368104.txz
/var/cache/pkg/indexinfo-0.3.1.txz
/var/cache/pkg/e2fsprogs-libss-1.46.2~d0e44d1a51.txz
/var/cache/pkg/indexinfo-0.3.1~75a19b3acb.txz
/var/cache/pkg/e2fsprogs-libss-1.46.2.txz
/var/cache/pkg/vim-tiny-8.2.2725~640683e659.txz
/var/cache/pkg/vim-tiny-8.2.2725.txz
/var/cache/pkg/vim-tiny-8.2.2725~a1de39a0a9.txz
/var/cache/pkg/gettext-runtime-0.21~4f88146680.txz
/var/cache/pkg/e2fsprogs-libuuid-1.46.2~b01e611407.txz
/var/cache/pkg/e2fsprogs-libss-1.46.2~b2cac5e088.txz
/var/cache/pkg/e2fsprogs-libblkid-1.46.2~d0aac929ad.txz
/var/cache/pkg/e2fsprogs-1.46.2~a2abff02bc.txz
The cleanup will free 5 MiB
Proceed with cleaning the cache? [y/N]: y
To remove all cached packages, run the following command:
pkg clean -a
Step 4 - View Information About Installed Package
The basic syntax to see the information about installed packages is shown below.
pkg info package-name
For example, to see the Nginx package information, run the following command:
pkg info nginx
You will see the following output:
nginx-1.24.0_12,3
Name : nginx
Version : 1.24.0_12,3
Installed on : Sat Oct 14 08:53:08 2023 UTC
Origin : www/nginx
Architecture : FreeBSD:13:amd64
Prefix : /usr/local
Categories : www
Licenses : BSD2CLAUSE
Maintainer : joneum@FreeBSD.org
WWW : https://nginx.com/
Comment : Robust and small WWW server
Step 5 - Remove Packages Using pkg Command
The basic syntax to remove a package is shown below.
pkg delete package-name
For example, to remove a package named nginx, run the following command:
pkg delete nginx
To remove additional dependencies that are installed with the package, run the following command:
pkg autoremove
Step 6 - Lock and Unlock Packages Using pkg Command
Sometimes, you don't want to upgrade a package on your server. In this case, you can lock that package so that pkg never upgrades it.
To lock the Nginx package, run:
pkg lock nginx
To list all locked packages, run:
pkg lock -l
Output:
Currently locked packages:
nginx-1.24.0_12,3
To unlock an Nginx package, run:
pkg unlock nginx
To lock all packages, run:
pkg lock -a
To unlock all packages, run:
pkg unlock -a
Conclusion
In this post, we showed you how to manage packages with the pkg command in FreeBSD. You can now easily install, remove, update, upgrade, and manage packages via the command line interface. Try to manage packages using the pkg command on dedicated server hosting from Atlantic.Net!
### How to Install PostgreSQL on FreeBSD
PostgreSQL is an open-source, high-performance database management system suitable for large databases. It is used as a data store for mobile, geospatial, web, and analytics applications. It is cross-platform, offers complex data types, and supports Java, Python, Perl, Ruby, Go, C, C#, and many more languages. It can handle complex workloads while maintaining data integrity and reliability.
Step 1 - Install PostgreSQL
By default, the PostgreSQL package is included in the FreeBSD official repository. You can search all available PostgreSQL packages using the following command.
pkg search postgresql
You will see the following list:
postgresql15-server-15.4 PostgreSQL is the most advanced open-source database available anywhere
postgresql15-tds_fdw-2.0.3 PostgreSQL foreign data wrapper to connect to TDS databases
postgresql15-zhparser-2.2 PostgreSQL extension for full-text search of Chinese
postgresql16-client-16.0 PostgreSQL database (client)
postgresql16-contrib-16.0 The contrib utilities from the PostgreSQL distribution
postgresql16-docs-16.0 The PostgreSQL documentation set
postgresql16-plperl-16.0 Write SQL functions for PostgreSQL using Perl5
postgresql16-plpython-16.0 Module for using Python to write SQL functions
postgresql16-pltcl-16.0 Module for using Tcl to write SQL functions
postgresql16-server-16.0 PostgreSQL is the most advanced open-source database available anywhere
prometheus-postgresql-adapter-0.6.0_14 Use PostgreSQL as a remote storage database for Prometheus
py39-postgresql-1.3.0 Python 3 compatible PostgreSQL database driver and tools
rubygem-azure_mgmt_postgresql-0.17.2 Microsoft Azure PostgreSQL Client Library for Ruby
Now, install the PostgreSQL server and client package using the following command:
pkg install postgresql16-server postgresql16-client nano-7.2
Once both packages are installed, enable the PostgreSQL service to start at system reboot.
sysrc postgresql_enable=yes
Next, initialize the PostgreSQL database with the following command:
/usr/local/etc/rc.d/postgresql initdb
Output:
creating directory /var/db/postgres/data16 ... ok
creating subdirectories ... ok
selecting dynamic shared memory implementation ... posix
selecting default max_connections ... 100
selecting default shared_buffers ... 128MB
selecting default time zone ... UTC
creating configuration files ... ok
running bootstrap script ... ok
performing post-bootstrap initialization ... ok
syncing data to disk ... ok
Next, start the PostgreSQL service.
service postgresql start
You can verify the PostgreSQL service status using the following command:
service postgresql status
By default, PostgreSQL listens on port 5432. You can check it with the following command:
sockstat -l4 -P tcp
Output:
USER COMMAND PID FD PROTO LOCAL ADDRESS FOREIGN ADDRESS
postgres postgres 2870 7 tcp4 127.0.0.1:5432 *:*
Step 2 - Configure PostgreSQL Authentication
By default, PostgreSQL supports different authentication methods such as md5, RADIUS, PAM, LDAP, and more. In this section, we will set up the password-based authentication using MD5.
First, edit the PostgreSQL configuration file.
nano /var/db/postgres/data16/pg_hba.conf
Find and change the following lines from trust to md5:
# TYPE DATABASE USER ADDRESS METHOD
# "local" is for Unix domain socket connections only
local all all trust
# IPv4 local connections:
host all all 127.0.0.1/32 md5
# IPv6 local connections:
host all all ::1/128 md5
Save and close the file, then restart the PostgreSQL service to apply the changes.
service postgresql restart
Step 3 - Create a User and Database in PostgreSQL
First, connect to the Postgres with the following command:
su - postgres
psql
Next, set the password for the default postgres user.
\password postgres
Next, create a new database named testdb and a user named testuser.
create database testdb;
create user testuser with encrypted password 'password';
Next, grant all the privileges on testdb database to testuser.
grant all privileges on database testdb to testuser;
Next, verify your created users using the following command:
\du
Output:
List of roles
Role name | Attributes
-----------+------------------------------------------------------------
postgres | Superuser, Create role, Create DB, Replication, Bypass RLS
testuser |
Next, create a table named mytable with the following command:
create table mytable (id int, name text, site text);
Next, insert some data into the table.
insert into mytable (id,name,site) values (1,'myserver','atlantic.net');
Next, retrieve the data from your table.
select * from mytable;
Output:
id | name | site
----+----------+--------------
1 | myserver | atlantic.net
(1 row)
You can now exit from the PostgreSQL shell with the following command.
\q
Conclusion
In this post, we explained how to install PostgreSQL on FreeBSD. We also showed you how to create a database, user, and table in PostgreSQL. You can now easily use PostgreSQL as a database backend for your application. Try deploying a PostgreSQL server on dedicated server hosting from Atlantic.Net!
### Install Apache2, MariaDB and PHP (FAMP) Stack on FreeBSD
A FAMP stack is a collection of open-source software used to enable a server to host a website or web application written in PHP language. FAMP uses FreeBSD as the operating system, Apache as the Web server, MySQL as the database management system, and PHP as the object-oriented scripting language.
Step 1 - Install Apache Web Server
By default, the Apache package is included in the FreeBSD default repo, so you can easily install it using the pkg command.
First, update all the packages using the following command.
pkg update
Next, install the Apache web server package with the following command.
pkg install apache24
Once Apache is installed, you can enable it to start at system reboot.
sysrc apache24_enable="YES"
Next, start the Apache service using the below command.
service apache24 start
To check the Apache service status, run the following command.
service apache24 status
Output:
apache24 is running as pid 1494.
Step 2 - Install MariaDB Server
By default, the MariaDB package is included in the default repository. You can search all available package versions using the following command.
pkg search mariadb
You will see the following list.
mariadb-connector-c-3.3.4 MariaDB database connector for C
mariadb-connector-odbc-3.1.17 MariaDB database connector for odbc
mariadb1011-client-10.11.5 Multithreaded SQL database (client)
mariadb1011-server-10.11.5 Multithreaded SQL database (server)
mariadb105-client-10.5.21 Multithreaded SQL database (client)
mariadb105-server-10.5.21 Multithreaded SQL database (server)
mariadb106-client-10.6.14 Multithreaded SQL database (client)
mariadb106-server-10.6.14 Multithreaded SQL database (server)
p5-DBD-MariaDB-1.21 MariaDB driver for the Perl5 Database Interface (DBI)
Next, install the MariaDB server and client package from the above list using the following command:
pkg install mariadb1011-server-10.11.5 mariadb1011-client-10.11.5
Once both packages are installed, enable the MariaDB package to start at system reboot.
sysrc mysql_enable="yes"
Next, start the MariaDB service.
service mysql-server start
Next, run the mysql_secure_installation script to secure the installation.
/usr/local/bin/mysql_secure_installation
Answer all the questions as shown below:
Enter current password for root (enter for none):
Switch to unix_socket authentication [Y/n] Y
Change the root password? [Y/n] Y
New password:
Re-enter new password:
Remove anonymous users? [Y/n] Y
Disallow root login remotely? [Y/n] Y
Remove test database and access to it? [Y/n] Y
Reload privilege tables now? [Y/n] Y
Next, verify the MariaDB databases using the following command.
mysql -u root -p -e "show databases"
You will see all default databases in the following output.
+--------------------+
| Database |
+--------------------+
| information_schema |
| mysql |
| performance_schema |
| sys |
+--------------------+
Step 3 - Install PHP
You can install PHP with other extensions using the following command:
pkg install php80 mod_php80 php80-mbstring php80-zlib php80-curl php80-gd php80-mysqli nano-7.2
After installing PHP, you must create a PHP configuration file for the Apache web server. You can create it with the following command:
nano /usr/local/etc/apache24/Includes/php.conf
Add the following configurations:
DirectoryIndex index.php index.html
SetHandler application/x-httpd-php
SetHandler application/x-httpd-php-source
Save and close the file, then create a simple info.php file to test the web server.
nano /usr/local/www/apache24/data/info.php
Add the following code:
Save and close the file, then restart the Apache service to apply the changes.
service apache24 restart
Now, open your web browser and access the info.php file using the URL http://your-server-ip/info.php. You will see the PHP information page.
Conclusion
This post showed you how to install Apache, MariaDB, and PHP (FAMP) stack on FreeBSD. Using this stack, you can deploy any web application easily on the internet. Try to deploy the FAMP stack on dedicated server hosting from Atlantic.Net!
### How to Install Mautic Marketing Software on Fedora
Mautic is an open-source marketing automation software solution that allows you to create a multi-channel marketing campaign for your business. It is community-developed and offers all required features for a marketing platform, including lead management, campaign management, contacts and emails, and responsive email creation. Mautic is simple to use and inexpensive when compared to other similar software.
This post will show you how to install Matic marketing software on Fedora Linux.
Step 1 - Install Apache, MariaDB, and PHP
First, update your server, then install the Apache web server and MariaDB server using the following commands.
dnf update -y
dnf install httpd mariadb-server -y
Next, start and enable both the Apache and MariaDB services.
systemctl start httpd mariadb
systemctl enable httpd mariadb
Next, add the PHP Remi repository using the following command.
dnf install -y http://rpms.remirepo.net/fedora/remi-release-34.rpm
dnf module install php:remi-8.0 -y
Next, install the PHP with other required extensions using the following command.
dnf install -y php php-gd php-bcmath php-zip php-mysqlnd php-cgi php-pear php-xml php-mcrypt php-openssl php-opcache php-apcu php-memcached php-xdebug php-json php-mbstring php-curl php-common php-pear git
Once all the packages are installed, you can proceed to the next step.
Step 2 - Create a Database and User
Next, you will need to create a database and user for Mautic. First, connect to the MariaDB with the following command.
mysql
Next, create a database and user for Mautic.
CREATE DATABASE mautic;
CREATE USER 'mautic'@'localhost' IDENTIFIED BY 'password';
Next, grant all the privileges to the Mautic database.
GRANT ALL PRIVILEGES ON mautic.* TO 'mautic'@'localhost' IDENTIFIED BY 'password';
Then, flush the privileges to apply the changes.
FLUSH PRIVILEGES;
Next, define the global InnoDB format and SQL mode.
SET GLOBAL innodb_default_row_format=DYNAMIC;
SET GLOBAL sql_mode=(SELECT REPLACE(@@sql_mode,'ONLY_FULL_GROUP_BY',''));
Finally, exit from the MariaDB shell.
EXIT;
Step 3 - Install Node.js and Composer
First, install Composer using the following command.
wget https://getcomposer.org/installer -O composer-installer.php
php composer-installer.php --filename=composer --install-dir=/usr/local/bin
Next, install Node.js and NPM using the following command.
dnf install -y nodejs npm
Once both packages are installed, you can proceed to the next step.
Step 4 - Install Mautic
First, navigate to the Apache root directory and download the latest version of Mautic from the Git repository.
cd /var/www/html
git clone https://github.com/mautic/mautic.git
Next, change the directory to mautic and install the required dependencies using the following command.
cd mautic
composer install --ignore-platform-req=ext-imap --ignore-platform-req=ext-zip
Next, set proper permission and ownership to the Mautic directory.
chown -R apache:apache /var/www/html/mautic
chmod -R 775 /var/www/html/mautic
Step 5 - Configure Apache for Mautic
Next, create an Apache virtual host configuration file for Mautic.
nano /etc/httpd/conf.d/mautic.conf
Add the following configuration.
ServerAdmin admin@example.com
DocumentRoot /var/www/html/mautic/
ServerName mautic.example.com
Options FollowSymLinks
AllowOverride All
Order allow,deny
allow from all
ErrorLog /var/log/httpd/mautic_error_log
CustomLog /var/log/httpd/mautic_access_log common
Save and close the file, then restart the Apache service to apply the changes.
systemctl restart httpd
Step 6 - Access Mautic Web UI
Now, open your web browser and access the Mautic web installation wizard using the URL http://mautic.example.com. You will see the environment check page.
Click on Next Step. You will see the database configuration page.
Define your Mautic database settings and click on Next Step. You will see the admin user creation page.
Define your admin username and password and click on Next Step. You will see the Mautic login page.
Provide your admin username and password, and click on the login button. You will see the Mautic dashboard on the following screen.
Conclusion
Congratulations! You have successfully installed the Mautic marketing automation platform on Fedora Linux. You can now implement Mautic in your organization and create your marketing campaign using Mautic web UI. You can now try to deploy Mautic on dedicated server hosting from Atlantic.Net!
### How to Install GitLab on Fedora
GitLab is an open-source repository and collaborative software development platform for DevOps projects. It is a self-hosted platform that provides a set of tools for managing and collaborating on software development projects. GitLab has built-in CI/CD capabilities that allow developers to automate the build, test, and deployment process. It also provides a centralized container registry to store Docker images and containers.
This post will show you how to install GitLab on Fedora Linux.
Step 1 - Install Required Dependencies
Before starting, you will need to install some required dependencies on your server. You can install them using the following command.
dnf update -y
dnf -y install postfix curl
Next, start and enable the Postfix service with the following command.
systemctl start postfix
systemctl enable postfix
Step 2 - Install GitLab CE
The GitLab package is not available in the Fedora default repo by default, so you will need to create a repo for GitLab.
nano /etc/yum.repos.d/gitlab-ce.repo
Add the following lines.
[gitlab_gitlab-ce]
name=gitlab_gitlab-ce
baseurl=https://packages.gitlab.com/gitlab/gitlab-ce/el/8/$basearch
repo_gpgcheck=1
gpgcheck=1
enabled=1
gpgkey=https://packages.gitlab.com/gitlab/gitlab-ce/gpgkey
https://packages.gitlab.com/gitlab/gitlab-ce/gpgkey/gitlab-gitlab-ce-3D645A26AB9FBD22.pub.gpg
sslverify=1
sslcacert=/etc/pki/tls/certs/ca-bundle.crt
metadata_expire=300
[gitlab_gitlab-ce-source]
name=gitlab_gitlab-ce-source
baseurl=https://packages.gitlab.com/gitlab/gitlab-ce/el/8/SRPMS
repo_gpgcheck=1
gpgcheck=1
enabled=1
gpgkey=https://packages.gitlab.com/gitlab/gitlab-ce/gpgkey
https://packages.gitlab.com/gitlab/gitlab-ce/gpgkey/gitlab-gitlab-ce-3D645A26AB9FBD22.pub.gpg
sslverify=1
sslcacert=/etc/pki/tls/certs/ca-bundle.crt
metadata_expire=300
Save and close the file, then install the GitLab CE with the following command.
dnf install -y gitlab-ce
Step 3 - Configure GitLab CE
After installing GitLab CE, you will need to define your domain to access the GitLab dashboard. You can do it by editing the GitLab default configuration file.
nano /etc/gitlab/gitlab.rb
Change the following line.
external_url 'http://gitlab.example.com'
Save and close the file, then reconfigure the GitLab CE with the following command.
gitlab-ctl reconfigure
You will see the following output.
Running handlers:
[2023-09-12T11:22:48-04:00] INFO: Running report handlers
Running handlers complete
[2023-09-12T11:22:48-04:00] INFO: Report handlers complete
Infra Phase complete, 571/1587 resources updated in 05 minutes 13 seconds
Notes:
Default admin account has been configured with following details:
Username: root
Password: You didn't opt-in to print initial root password to STDOUT.
Password stored to /etc/gitlab/initial_root_password. This file will be cleaned up in first reconfigure run after 24 hours.
NOTE: Because these credentials might be present in your log files in plain text, it is highly recommended to reset the password following https://docs.gitlab.com/ee/security/reset_user_password.html#reset-your-root-password.
gitlab Reconfigured!
You can check the status of GitLab CE with the following command.
gitlab-ctl status
You will see the following output.
run: gitaly: (pid 9832) 100s; run: log: (pid 8777) 361s
run: gitlab-exporter: (pid 9890) 96s; run: log: (pid 9175) 191s
run: gitlab-kas: (pid 9860) 97s; run: log: (pid 8956) 336s
run: gitlab-workhorse: (pid 9869) 97s; run: log: (pid 9069) 217s
run: logrotate: (pid 8700) 376s; run: log: (pid 8708) 375s
run: nginx: (pid 9098) 213s; run: log: (pid 9110) 210s
run: node-exporter: (pid 9878) 98s; run: log: (pid 9157) 200s
run: postgres-exporter: (pid 9933) 94s; run: log: (pid 9348) 158s
run: postgresql: (pid 8820) 349s; run: log: (pid 8835) 346s
run: prometheus: (pid 9898) 97s; run: log: (pid 9221) 177s
run: puma: (pid 9016) 231s; run: log: (pid 9025) 229s
run: redis: (pid 8737) 371s; run: log: (pid 8746) 370s
run: redis-exporter: (pid 9892) 97s; run: log: (pid 9197) 186s
run: sidekiq: (pid 9034) 225s; run: log: (pid 9042) 224s
Step 4 - Access GitLab CE
Before accessing the GitLab CE, you will need to retrieve the GitLab login password. You can retrieve it with the following command.
cat /etc/gitlab/initial_root_password
You will see your root password in the following output.
# WARNING: This value is valid only in the following conditions
# 1. If provided manually (either via `GITLAB_ROOT_PASSWORD` environment variable or via `gitlab_rails['initial_root_password']` setting in `gitlab.rb`, it was provided before database was seeded for the first time (usually, the first reconfigure run).
# 2. Password hasn't been changed manually, either via UI or via command line.
#
# If the password shown here doesn't work, you must reset the admin password following https://docs.gitlab.com/ee/security/reset_user_password.html#reset-your-root-password.
Password: RDr2u50wloMV7CqnPpVFPN3WwxTBt03yFtscw/eOlvg=
# NOTE: This file will be automatically deleted in the first reconfigure run after 24 hours.
Now, open your web browser and access the GitLab CE using the URL http://gitlab.example.com. You will see the GitLab login screen.
Provide your username and password and click on the Sign in button. You will see the GitLab CE dashboard on the following screen.
Step 6 - Uninstall GitLab CE
To remove GitLab CE from your server, first stop GitLab CE with the following command.
gitlab-ctl stop
Next, remove GitLab CE using the following command.
gitlab-ctl uninstall
Output.
Terminating processes running under application users. This will take a few seconds.
Your config files have been backed up to /root/gitlab-cleanse-2023-09-12T11:28.
Conclusion
This tutorial taught you how to install GitLab CE on Fedora Linux. You can now create your first project via the GitLab CE dashboard to automate the build, test, and deployment process. You can now try to deploy GitLab CE on dedicated server hosting from Atlantic.Net!
### How to Install Bagisto eCommerce on Fedora
Bagisto is a free and open-source eCommerce platform used for managing multi-tenant businesses. It helps users track inventory, monitor stock levels, and handle orders from a web-based UI. It is built on Laravel and Vue.js, a progressive Javascript framework, and was designed to enable anyone to develop and scale an online business. It provides extensions to support mobile number login, Stripe payment gateway, dropshipping, point-of-sale, and other options to extend the functionality.
This post will show you how to install the Bagisto eCommerce platform on Fedora Linux.
Step 1 - Install Nginx, MariaDB, and PHP
First, update the server and install the Nginx and MariaDB servers using the following commands.
dnf update -y
dnf install nginx mariadb-server -y
Next, add the PHP remi repository.
dnf install -y http://rpms.remirepo.net/fedora/remi-release-34.rpm
dnf module install php:remi-8.0
Then, install PHP with other required extensions using the following command.
dnf install php php-bcmath php-common php-curl php-fpm php-gd php-mbstring php-mysqlnd php-soap php-xml php-xsl php-devel php-pear libsodium-devel
yum --enablerepo=remi install php-intl php-sodium php-zip
Next, install libsodium library and add it to the PHP configuration file.
pecl install libsodium
echo "extension=sodium.so" >> /etc/php.ini
Next, start and enable the Nginx, MariaDB, and PHP-FPM services.
systemctl start nginx mariadb php-fpm
systemctl enable nginx mariadb php-fpm
Step 2 - Create a Database for Bagisto
Bagisto uses MariaDB as a database backend, so you will need to create a database and user for Bagisto.
First, log in to MariaDB with the following command.
mysql
Next, create a database and user for Bagisto.
CREATE DATABASE bagisto;
GRANT ALL on bagisto.* to bagisto@localhost identified by 'password';
Next, flush the privileges and exit from MariaDB with the following command.
FLUSH PRIVILEGES;
\q;
Step 3 - Install Node.js and Composer
You will also need to install the Node.js and Composer to your server.
First, install the Node.js package with the following command.
dnf install nodejs npm -y
Next, install Composer using the following command.
curl -sS https://getcomposer.org/installer -o composer-setup.php
php composer-setup.php --install-dir=/usr/local/bin --filename=composer
You can verify the Composer version with the following command.
composer -V
Output:
Composer version 2.6.2 2023-09-03 14:09:15
Step 4 - Install Bagisto
First, navigate to the Nginx web root directory.
cd /var/www/html
Next, install Bagisto using Composer.
composer create-project bagisto/bagisto
You will see the following output.
> Webkul\Core\Events\ComposerEvents::postCreateProject
____ _ _
| __ ) __ _ __ _(_)___| |_ ___
| _ \ / _` |/ _` | / __| __/ _ \
| |_) | (_| | (_| | \__ \ || (_) |
|____/ \__,_|\__, |_|___/\__\___/
|___/
Welcome to the Bagisto project! Bagisto Community is an open-source e-commerce ecosystem
which is built on top of Laravel and Vue.js.
Made with 💖 by the Bagisto Team. Happy helping :)
Next, edit the Bagisto environment file.
nano bagisto/.env
Modify the following lines.
APP_URL=http://bagisto.example.com
DB_DATABASE=bagisto
DB_USERNAME=bagisto
DB_PASSWORD=password
DB_PREFIX=bgs_
Save and close the file, then install the Bagisto with the following command.
cd bagisto
php artisan bagisto:install
You will see the following output.
-----------------------------
Congratulations!
The installation has been finished and you can now use Bagisto.
Go to http://bagisto.example.com/admin and authenticate with:
Email: admin@example.com
Password: admin123
Cheers!
Note down the admin username and password from the above output.
Step 5 - Configure Nginx for Bagisto
Next, you must create a Nginx virtual host configuration file to serve Bagisto.
nano /etc/nginx/conf.d/bagisto.conf
Add the following configurations.
server {
listen 80;
server_name bagisto.example.com;
root /var/www/html/bagisto/public;
add_header X-Frame-Options "SAMEORIGIN";
add_header X-Content-Type-Options "nosniff";
index index.php;
charset utf-8;
location / {
try_files $uri $uri/ /index.php?$query_string;
}
location = /favicon.ico { access_log off; log_not_found off; }
location = /robots.txt { access_log off; log_not_found off; }
error_page 404 /index.php;
location ~ \.php$ {
fastcgi_pass unix:/run/php-fpm/www.sock;
fastcgi_param SCRIPT_FILENAME $realpath_root$fastcgi_script_name;
include fastcgi_params;
}
location ~ /\.(?!well-known).* {
deny all;
}
}
Save the file, then edit the Nginx main configuration file.
nano /etc/nginx/nginx.conf
Add the following line after the line http{:
server_names_hash_bucket_size 64;
Save the file, then set permissions and ownership to the Bagisto directory.
chown -R nginx:nginx /var/www/html/bagisto
chmod -R 777 /var/www/html/bagisto
Finally, restart the Nginx and PHP-FPM services.
systemctl restart nginx php-fpm
Step 6 - Access Bagisto Web Interface
Now, open your web browser and access the Bagisto admin panel using the URL http://bagisto.example.com/admin/. You will see the Bagisto login screen.
Provide your admin username and password and click on the Sign in button. You will see the Bagisto dashboard on the following screen.
Conclusion
Congratulations! You have successfully installed Bagisto on Fedora Linux. You can now explore the Bagisto features and start managing your stocks and inventory from a central location. Try to deploy Bagisto on dedicated server hosting from Atlantic.Net!
### How to Install Zabbix Monitoring Tool on Fedora
Zabbix is an open-source monitoring solution that allows system administrators to monitor networks, servers, virtual machines, and cloud services via a web-based interface. It offers prebuilt official and community-developed templates for integrating with networks, applications, and endpoints and can automate some monitoring processes. Zabbix also offers automation capabilities such as packet loss rate, memory utilization, predictive bandwidth trends, and downtime trends.
This post will show you how to install a Zabbix server on Fedora Linux.
Step 1 - Install LAMP Server
First, update the server, and install the Apache and MariaDB servers with the following commands.
dnf update -y
dnf -y install httpd mariadb-server
Next, add the PHP remi repository and install the PHP 7.4 remi module.
dnf install -y http://rpms.remirepo.net/fedora/remi-release-34.rpm
dnf module install php:remi-7.4
Next, install PHP with other required extensions.
dnf install php php-fpm php-gd php-mysqlnd
Next, edit the PHP-FPM configuration file.
nano /etc/php-fpm.d/www.conf
Modify the following lines.
listen = /run/php-fpm/zabbix.sock
listen.allowed_clients = 0.0.0.0
Save and close the file, then create a new Zabbix file.
nano /etc/php-fpm.d/zabbix.conf
Define your date and time zone.
php_value[date.timezone] = UTC
Next, edit the PHP configuration file.
nano /etc/php.ini
Change the following values.
post_max_size = 16M
max_execution_time = 300
max_input_time = 300
Save the file, then enable Apache, MariaDB, and PHP-FPM services.
systemctl start httpd mariadb php-fpm
systemctl enable httpd mariadb php-fpm
Step 2 - Create a Zabbix Database
Next, you will need to create a database and user for Zabbix.
First, connect to the MariaDB shell.
mysql
Once you are connected, create a database and user for Zabbix.
CREATE DATABASE zabbix CHARACTER SET utf8 COLLATE utf8_bin;
CREATE USER 'zabbix'@'localhost' IDENTIFIED BY 'password';
Next, grant all the privileges to the Zabbix database.
GRANT ALL PRIVILEGES ON zabbix.* TO 'zabbix'@'localhost' IDENTIFIED BY 'password';
Next, flush the privileges and exit from the MariaDB shell.
FLUSH PRIVILEGES;
EXIT;
Step 3 - Install Zabbix Server
The Zabbix server package is unavailable in the Fedora default repo by default, so you will need to install the Zabbix repo to your server. You can install it with the following command.
rpm -Uvh https://repo.zabbix.com/zabbix/5.5/rhel/8/x86_64/zabbix-release-5.5-1.el8.noarch.rpm
Next, install the Zabbix server with other packages.
dnf install zabbix-server-mysql zabbix-web-mysql zabbix-apache-conf zabbix-sql-scripts zabbix-selinux-policy zabbix-agent
Next, download the Zabbix source.
wget https://cdn.zabbix.com/zabbix/sources/stable/5.0/zabbix-5.0.37.tar.gz
Next, extract the downloaded file.
tar zxvf zabbix-5.0.37.tar.gz
Next, change the directory to the extracted directory:
cd zabbix-5.0.37/database/mysql/
Next, import the database schema, images, and data with the following commands.
mysql -uzabbix -p zabbix < schema.sql
mysql -uzabbix -p zabbix < images.sql
mysql -uzabbix -p zabbix < data.sql
Next, edit the Zabbix configuration.
nano /etc/zabbix_server.conf
Change the following lines to define your database.
DBHost=localhost
DBName=zabbix
DBUser=zabbix
DBPassword=password
Save and close the file, then restart all required services with the following command.
systemctl restart zabbix-server zabbix-agent httpd php-fpm
systemctl enable zabbix-server zabbix-agent httpd php-fpm
Step 4 - Access Zabbix Web Installation
Now, open your web browser and access the Zabbix web installation using the URL http://your-server-ip/zabbix. You will see the Zabbix welcome screen.
Click on Next step. You will see the pre-requisites check screen.
Click on Next step. You will see the database configuration screen.
Define your database settings and click on Next step. You will see the Zabbix server details screen.
Provide your Zabbix host, port, name, and click on Next step. You will see the installation summary screen.
Click on Next step. You will see the following screen.
Click on Download the configuration file to download the zabbix.conf.php file to your local machine.
Next, create a new directory in your server with the following command.
mkdir -p /usr/share/zabbix/etc/zabbix/web/
Next, copy zabbix.conf.php file to /usr/share/zabbix/etc/zabbix/web/.
Next, go back to the web installation screen and click on the Finish button. You will see the Zabbix login screen.
Provide the default username and password as Admin / zabbix, then click the Sign in button. You will see the Zabbix dashboard on the following screen.
Conclusion
In this post, we showed you how to install the Zabbix monitoring server on Fedora. You can now add your remote servers to the Zabbix and monitor them via the Zabbix web interface. You can now deploy the Zabbix monitoring server on dedicated server hosting from Atlantic.Net!
### How To Install Sails.js Framework with Nginx on Fedora
Sails.js is an open-source MVC back-end web framework built on top of JavaScript runtime. It allows developers to create custom, enterprise-grade Node.js apps quickly. It offers a modern approach to building web applications with real-time features, such as a live chat option for smooth customer experiences. It also allows you to share your code between the server and the client.
This post will show you how to install Sails.js with Nginx on Fedora Linux.
Step 1 - Install Nodejs
First, update the server and install the required dependencies using the following commands.
dnf update -y
dnf install curl gcc-c++ make -y
Next, add the Nodesource repository using the following command.
curl -sL https://rpm.nodesource.com/setup_18.x | bash -
Next, install the Node.js package with the following command.
dnf install nodejs -y
You can now verify the Node.js installation using the following command.
node --version
Output:
v18.19.0
Step 2 - Install Sailsjs Framework
You can use the NPM command line tool to install the Sails.js easily, as shown below.
npm -g install sails
Once Sails.js is installed, you can verify its version with the following command.
sails --version
Output.
1.5.8
Step 3 - Create an Application with Sailsjs
Sails.js provides an easier way to create an application via the command line terminal. Let's make an application called sailsapp with the following command.
sails new sailsapp
You will be asked to choose a template for your application.
Choose a template for your new Sails app:
1. Web App · Extensible project with auth, login, & password recovery
2. Empty · An empty Sails app, yours to configure
(type "?" for help, or to cancel)
? 2
Type 2 and press the Enter key to create an application.
info: Installing dependencies...
Press CTRL+C to cancel.
(to skip this step in the future, use --fast)
------------------------------------------------------------
Cancelled `npm install`.
New app was generated successfully, but some dependencies
in node_modules/ are probably still incomplete or missing.
Before you can lift this app, you'll need to cd in and run:
rm -rf node_modules && npm install
For more help, visit https://sailsjs.com/support.
Next, change the directory to your application directory and remove the node modules.
cd sailsapp
rm -rf node_modules
Next, install all the required dependencies using the NPM command.
npm install
Finally, start your application with the following command.
sails lift
You will see the following output.
info: Starting app...
info:
info: .-..-.
info:
info: Sails <| .-..-.
info: v1.5.8 |\
info: /|.\
info: / || \
info: ,' |' \
info: .-'.-==|/_--'
info: `--'-------'
info: __---___--___---___--___---___--___
info: ____---___--___---___--___---___--___-__
info:
info: Server lifted in `/root/sailsapp`
info: To shut down Sails, press + C at any time.
info: Read more at https://sailsjs.com/support.
debug: -------------------------------------------------------
debug: :: Wed Sep 13 2023 11:25:30 GMT-0400 (Eastern Daylight Time)
debug: Environment : development
debug: Port : 1337
debug: Local : http://localhost:1337
debug: -------------------------------------------------------
Press the CTRL+C to stop the application.
Step 4 - Create a Systemd Service File for Sailsjs
Next, create a systemd service file to manage your application.
nano /lib/systemd/system/sails.service
Add the following configurations.
[Unit]
After=network.target
[Service]
Type=simple
User=root
WorkingDirectory=/root/sailsapp
ExecStart=/usr/bin/sails lift
Restart=on-failure
[Install]
WantedBy=multi-user.target
Save and close the file, then reload the systemd daemon.
systemctl daemon-reload
Next, start and enable the Sails.js service.
systemctl start sails
systemctl enable sails
You can also verify the status of your Sails.js service using the following command.
systemctl status sails
Output:
● sails.service
Loaded: loaded (/usr/lib/systemd/system/sails.service; disabled; vendor preset: disabled)
Active: active (running) since Wed 2023-09-13 11:26:03 EDT; 5s ago
Main PID: 2499 (node)
Tasks: 22 (limit: 4666)
Memory: 162.4M
CPU: 4.090s
CGroup: /system.slice/sails.service
├─2499 node /usr/bin/sails lift
└─2507 grunt
Sep 13 11:26:05 fedora sails[2499]: info:
Sep 13 11:26:05 fedora sails[2499]: info: Server lifted in `/root/sailsapp`
Sep 13 11:26:05 fedora sails[2499]: info: To shut down Sails, press + C at any time.
Sep 13 11:26:05 fedora sails[2499]: info: Read more at https://sailsjs.com/support.
Sep 13 11:26:05 fedora sails[2499]: debug: -------------------------------------------------------
Sep 13 11:26:05 fedora sails[2499]: debug: :: Wed Sep 13 2023 11:26:05 GMT-0400 (Eastern Daylight Time)
Sep 13 11:26:05 fedora sails[2499]: debug: Environment : development
Sep 13 11:26:05 fedora sails[2499]: debug: Port : 1337
Sep 13 11:26:05 fedora sails[2499]: debug: Local : http://localhost:1337
Sep 13 11:26:05 fedora sails[2499]: debug: -------------------------------------------------------
Step 5 - Configure Nginx as a Reverse Proxy for Sailsjs
You must configure the Nginx as a reverse proxy to access your application from the remote machine.
First, install the Nginx server.
dnf install nginx -y
Next, create an Nginx configuration file.
nano /etc/nginx/conf.d/sails.conf
Add the following configurations.
server {
listen 80;
server_name sails.example.com;
location / {
proxy_pass http://localhost:1337/;
proxy_set_header Host $host;
proxy_buffering off;
}
}
Save and close the file, then edit the Nginx main configuration file.
nano /etc/nginx/nginx.conf
Add the following line after the line http{:
server_names_hash_bucket_size 64;
Save and close the file, then verify the Nginx configuration.
nginx -t
You should get the following output:
nginx: the configuration file /etc/nginx/nginx.conf syntax is ok
nginx: configuration file /etc/nginx/nginx.conf test is successful
Finally, start and enable the Nginx service with the following command.
systemctl start nginx
systemctl enable nginx
Step 6 - Access Sailsjs Application
At this point, the Sails.js application is installed on your server. You can now access it using the URL http://sails.example.com. You will see the Sails.js default dashboard on the following screen.
Conclusion
This tutorial explained installing and creating a Sails.js application on Fedora Linux. We also showed you how to configure the Nginx as a reverse proxy to access the application from the outside world. You can now try to deploy the Sails.js application on dedicated server hosting from Atlantic.Net!
### How to Install Terraform on Fedora
Terraform is an infrastructure-as-code tool that allows you to provision and manage infrastructure in any cloud created by HashiCorp. It provides a rich interface for orchestrating single or multi-cloud deployments. Using Terraform, you can provision all the infrastructure components in code. If you are looking for a tool to manage infrastructure components, such as computing, storage, and networking resources, then Terraform is the best tool.
This post will show you how to install Terraform on Fedora Linux.
Step 1 - Install Terraform from Hashicorp Repo
By default, the Terraform package is unavailable in the Fedora default repo, so you will need to install it from the HashiCorp repo.
First, update the server and install the HashiCorp repo with the following commands.
dnf update -y
dnf install -y dnf-plugins-core
dnf config-manager --add-repo https://rpm.releases.hashicorp.com/fedora/hashicorp.repo
Next, verify the added repo with the following command.
dnf repolist
You will see the following output.
repo id repo name
fedora Fedora 34 - x86_64
fedora-cisco-openh264 Fedora 34 openh264 (From Cisco) - x86_64
fedora-modular Fedora Modular 34 - x86_64
hashicorp Hashicorp Stable - x86_64
updates Fedora 34 - x86_64 - Updates
updates-modular Fedora Modular 34 - x86_64 - Updates
Next, install Terraform using the following command.
dnf install terraform -y
After the installation, verify the Terraform version with the following command.
terraform --version
Output:
Terraform v1.5.7
on linux_amd64
Step 2 - Install Terraform Manually
You can also install Terraform manually by downloading it from GitHub. Run the following command to download the latest version of Terraform.
TER_VER=`curl -s https://api.github.com/repos/hashicorp/terraform/releases/latest | grep tag_name | cut -d: -f2 | tr -d \"\,\v | awk '{$1=$1};1'`
wget https://releases.hashicorp.com/terraform/${TER_VER}/terraform_${TER_VER}_linux_amd64.zip
Once the download is completed, unzip the downloaded file.
unzip terraform_${TER_VER}_linux_amd64.zip
Next, move the Terraform binary to the system location.
mv terraform /usr/bin/
Next, verify the Terraform version using the following command.
terraform --version
You will see the Terraform version in the following output.
Terraform v1.5.7
on linux_amd64
Step 3 - How to Use Terraform
You can see all available options for Terraform using the following command.
terraform
You will see the following output.
Main commands:
init Prepare your working directory for other commands
validate Check whether the configuration is valid
plan Show changes required by the current configuration
apply Create or update infrastructure
destroy Destroy previously-created infrastructure
All other commands:
console Try Terraform expressions at an interactive command prompt
fmt Reformat your configuration in the standard style
force-unlock Release a stuck lock on the current workspace
get Install or upgrade remote Terraform modules
graph Generate a Graphviz graph of the steps in an operation
import Associate existing infrastructure with a Terraform resource
login Obtain and save credentials for a remote host
logout Remove locally-stored credentials for a remote host
metadata Metadata related commands
output Show output values from your root module
providers Show the providers required for this configuration
refresh Update the state to match remote systems
show Show the current state or a saved plan
state Advanced state management
taint Mark a resource instance as not fully functional
test Experimental support for module integration testing
untaint Remove the 'tainted' state from a resource instance
version Show the current Terraform version
workspace Workspace management
Now, let's create a new project and see how to use Terraform to manage infrastructure.
mkdir projects
Next, create a Terraform main configuration file inside the project directory.
cd projects
nano main.tf
Add your cloud provider's information as shown below.
provider "aws" {
access_key = ""
secret_key = ""
region = "us-west-1"
}
Save and close the file, then initialize a Terraform working directory using the following command.
terraform init
You will see the following output.
Initializing the backend...
Initializing provider plugins...
- Finding latest version of hashicorp/aws...
- Installing hashicorp/aws v5.16.2...
- Installed hashicorp/aws v5.16.2 (signed by HashiCorp)
Terraform has created a lock file .terraform.lock.hcl to record the provider
selections it made above. Include this file in your version control repository
so that Terraform can guarantee to make the same selections by default when
you run "terraform init" in the future.
Terraform has been successfully initialized!
You may now begin working with Terraform. Try running "terraform plan" to see
any changes that are required for your infrastructure. All Terraform commands
should now work.
If you ever set or change modules or backend configuration for Terraform,
rerun this command to reinitialize your working directory. If you forget, other
commands will detect it and remind you to do so if necessary.
Next, generate an execution plan using the following command.
terraform plan
Output:
No changes. Your infrastructure matches the configuration.
Terraform has compared your real infrastructure against your configuration and found no differences, so no changes are needed.
Now, run the following command to build your infrastructure.
terraform apply
Output:
No changes. Your infrastructure matches the configuration.
Terraform has compared your real infrastructure against your configuration and found no differences, so no changes are needed.
Apply complete! Resources: 0 added, 0 changed, 0 destroyed.
If you want to destroy your infrastructure, run the following command.
terraform destroy
Conclusion
In this post, we explained different ways to install Terraform on Fedora Linux. We also showed you how to use Terraform to deploy and manage infrastructure. You can now deploy and use Terraform on dedicated server hosting from Atlantic.Net!
### How to Install and Configure Squid Proxy on Fedora
Squid is a free, open-source, widely used proxy server for Linux and Unix operating systems. It acts as an intermediary between clients and servers for web objects accessed through HTTP and HTTPS. It is also used as a proxy caching server to improve web server speed by caching frequently requested pages. Squid also allows you to control web access via access control rules.
In this post, we will show you how to install the Squid proxy server on Fedora Linux.
Step 1 - Install Squid Proxy
By default, the Squid package is included in the Fedora operating system. You can install it by simply running the following command.
dnf install squid -y
After installing the Squid proxy package, start and enable the Squid service to start it at system reboot.
systemctl start squid
systemctl enable squid
By default, the Squid proxy listens on port 3128. You can verify it using the following command.
ss -antpl | grep -i squid
Output.
LISTEN 0 4096 *:3128 *:* users:(("squid",pid=65118,fd=13))
Step 2 - Create a Squid User
You will need to create a user for Squid if you want to control Internet access. First, install the Apache tools package with the following command.
dnf install httpd-tools -y
Next, create a password file and change its ownership.
touch /etc/squid/squid_passwd
chown squid /etc/squid/squid_passwd
Next, create a Squid user and set a password with the following command.
htpasswd /etc/squid/squid_passwd client1
Set your user's password as shown below.
New password:
Re-type new password:
Adding password for user client1
Step 3 - Configure Squid Proxy Server
In this section, we will configure user-based authentication in Squid proxy so that only the Squid user can access the internet.
Edit the Squid configuration file.
nano /etc/squid/squid.conf
Add the following lines at the top of the file:
auth_param basic program /usr/lib64/squid/basic_ncsa_auth /etc/squid/squid_passwd
acl ncsa_users proxy_auth REQUIRED
http_access allow ncsa_users
Save and close the file when you are done. Then, restart the Squid service to apply the changes.
systemctl restart squid
Step 4 - Verify Squid Proxy Server
At this point, your Squid proxy server is installed and configured. Now you will need to define your proxy server on the client's machine.
First, open the Firefox web browser on the client machine and open the settings. You will see the following screen.
Scroll down the page and click on Settings. You will see the following screen.
Define your proxy server IP and port, and click on OK to save the changes. Now, open a new tab in your browser and access the whatismyip.com website. You will be asked to authenticate the Squid server.
Provide your Squid username and password and click on Sign in. After the successful authentication, you will be able to access the website.
Conclusion
In this post, you learned how to install and configure the Squid proxy server on Fedora Linux. You can now hide your identity and control Internet access using the Squid proxy server. Try out Squid proxy on dedicated server hosting from Atlantic.Net!
### How to Install HumHub Social Network Platform on Fedora
HumHub is an open-source social network software designed to help businesses build private or public social spaces within their organization. It is customizable and offers additional modules to extend its functionality. It is written on top of the Yii PHP framework and uses MariaDB as a database backend.
In this post, we will show you how to install HumHub social network on Fedora Linux.
Step 1 - Install Apache, MariaDB, and PHP
Before starting, you will need to install the Apache web server, MariaDB, and PHP on your server. You can install all the packages using the following command.
dnf install httpd mariadb-server php php-zip php-mysqlnd php-fpm php-xml php-cli php-soap php-opcache php-iconv php-pear php-bcmath php-gd php-mbstring php-json php-devel php-intl unzip wget -y
Next, start and enable the Apache, MariaDB, and PHP-FPM services with the following command.
systemctl start httpd mariadb php-fpm
systemctl enable httpd mariadb php-fpm
Step 2 - Create a Database for HumHub
HumHub uses MariaDB or MySQL as a database backend, so you will need to create a database for HumHub.
First, log in to the MariaDB shell using the following command.
mysql
Once you are logged in, create a database and user with the following command.
CREATE DATABASE humhub;
CREATE USER 'humhub'@'localhost' IDENTIFIED BY 'secure_password';
Next, grant all privileges to the HumHub database.
GRANT ALL PRIVILEGES ON humhub.* TO 'humhub'@'localhost';
Next, flush the privileges and exit from the MariaDB with the following command.
FLUSH PRIVILEGES;
EXIT;
Step 3 - Install HumHub
First, download the latest version of HumHub with the following command.
wget https://download.humhub.com/downloads/install/humhub-1.14.3.tar.gz
Once the download is completed, extract the downloaded file.
tar -xvzf humhub-1.14.3.tar.gz
Next, move the extracted directory to the Apache web root.
mv humhub-1.14.3 /var/www/html/humhub
Then, change the ownership and permissions of the HumHub directory.
chmod -R 777 /var/www/html/humhub/
chown -R apache:apache /var/www/html/humhub/
Step 4 - Configure Apache for HumHub
Next, create an Apache virtual host configuration file to host HumHub on the web.
nano /etc/httpd/conf.d/humhub.conf
Add the following configurations:
ServerAdmin admin@example.com
ServerName humhub.example.com
DocumentRoot /var/www/html/humhub/
Options -Indexes +FollowSymLinks
AllowOverride All
ErrorLog /var/log/httpd/humhub.example.com-error.log
CustomLog /var/log/httpd/humhub.example.com-access.log combined
Save and close the file, then restart the Apache service to apply the changes.
systemctl restart httpd
Step 5 - Access HumHub Dashboard
Now, open your web browser and access the HumHub web interface using the URL http://humhub.example.com. You will see the HumHub welcome page.
Click on Next. You will see the requirements check page.
If everything is fine, click on Next. You will see the database configuration page.
Define your database configuration and click on Next. You will see the Scheduled Jobs page.
Click on Next. You will see the Pretty URLs page.
Click on Next. You will see the following page.
Define your social network name and click on Next. You will see the following page.
Select your preferred option and click on Next. You will see the security settings page.
Define your preferred settings and click on Next. You will see the Modules selection page.
Select your required modules and click on Next. You will see the Account creation page.
Define your account details and click on Create Admin Account. You will see the following page.
Click on Next. Once the HumHub setup is completed, you will see the following page.
Click on Sign in. You will see the HumHub dashboard on the following screen.
Conclusion
In this post, we showed you how to install HumHub on Fedora Linux. You can now deploy the HumHub social network in your school, college, or organization to build your own community. Try to deploy HumHub social network on dedicated server hosting from Atlantic.Net!
### How to Install Dollibar ERP on Fedora Linux
Dolibarr is an open-source ERP/CRM platform that helps you manage your organization’s activity, including, contacts, suppliers, invoices, orders, stocks, and more. It is written in PHP and designed for small, medium, or large companies, foundations, and freelancers. If you are looking for an affordable and self-hosted CRM/ERP solution then Dolibarr is the best option for you.
In this post, we will explain how to install the Dolibarr CRM/ERP on Fedora Linux.
Step 1 - Install the LAMP Server
First, you will need to install a LAMP server on your system. You can install all the LAMP components using the command given below.
dnf install httpd mariadb-server php php-zip php-mysqlnd php-fpm php-xml php-cli php-soap php-opcache php-iconv php-pear php-bcmath php-gd php-mbstring php-json php-devel php-intl unzip wget -y
After installing the LAMP server, start and enable the Apache, PHP-FPM, and MariaDB services with the following command.
systemctl start httpd mariadb php-fpm
systemctl enable httpd mariadb php-fpm
Next, edit the PHP configuration file and change some default settings.
nano /etc/php.ini
Change the following values.
memory_limit = 512M
upload_max_filesize = 150M
max_execution_time = 360
date.timezone = UTC
Save and close the file when you are done.
Step 2 - Create a Database for Dolibarr
Next, log in to the MariaDB shell using the following command.
mysql
After the login, create a database and user for Dolibarr.
MariaDB [(none)]> CREATE DATABASE dolibarrdb;
MariaDB [(none)]> CREATE USER dolibarr;
Next, grant all the privileges to the Dolibarr database.
MariaDB [(none)]> GRANT ALL PRIVILEGES ON dolibarrdb.* TO 'dolibarr'@'localhost' IDENTIFIED BY 'password';
Then, flush the privileges and exit from MariaDB using the following command.
MariaDB [(none)]> FLUSH PRIVILEGES;
MariaDB [(none)]> EXIT
Step 3 - Download Dolibarr
First, download the latest version of Dolibarr from the source forge website.
wget https://sourceforge.net/projects/dolibarr/files/Dolibarr%20ERP-CRM/16.0.0/dolibarr-16.0.0.zip
Once the download is completed, unzip the downloaded file.
unzip dolibarr-16.0.0.zip
Next, move the extracted directory to the Apache root directory.
mv dolibarr-16.0.0 /var/www/html/dolibarr
Then, change the ownership and permissions of Dolibarr.
chown -R apache:apache /var/www/html/dolibarr/
chmod -R 775 /var/www/html/dolibarr/
Step 4 - Configure Apache for Dolibarr
Now, create an Apache virtual host configuration file for Dolibarr.
nano /etc/httpd/conf.d/dolibarr.conf
Add the following code.
ServerAdmin admin@example.com
ServerName dolibarr.example.com
DocumentRoot /var/www/html/dolibarr/htdocs
Options +FollowSymlinks
AllowOverride All
Require all granted
ErrorLog /var/log/httpd/dolibarr.example.com-error.log
CustomLog /var/log/httpd/dolibarr.example.com-access.log combined
Save and close the file, then restart the Apache service to apply the changes.
systemctl restart httpd
Step 5 - Access Dolibarr Web UI
Now, open your web browser and access the Dolibarr web installer using the URL http://dolibarr.example.com. You will see the language selection page.
Click on Next step. You will see the prerequisites check page.
Click on the Start button to start the installation. You will see the web and database configuration page.
Define your website and database configurations and click on Next step. You will see the following page.
Click on Next step. You will see the following page.
Ignore all errors and click on Next step. You will see the user creation page.
Click on Next step. Once the installation is finished, you will see the following page.
Now, create an install.lock file to secure the installation.
touch /var/www/html/dolibarr/htdocs/install.lock
Then, click on Go to Dolibarr. You will see the Dolibarr login page.
Provide your admin username and password and click on LOGIN. You will see the Dolibarr dashboard.
Conclusion
Congratulations! You have successfully installed Dolibarr on Fedora Linux. You can now explore the Dolibarr and start using it in your organization to manage all things centrally. Try to deploy Dolibarr ERP on dedicated server hosting from Atlantic.Net!
### How to Install AzuraCast Radio Management Suite on Fedora
AzuraCast is an open-source and self-hosted web radio management suite that helps you to get a web radio station up and running in minutes. It offers a powerful and intuitive web interface where you can manage every aspect of your radio station. You can upload media, manage playlists, create local mount points and remote relays, and view analytics and reports via a web browser. It also offers an API to build your own players and interfaces.
In this post, we will show you how to install AzuraCast radio management solutions on Fedora Linux.
Step 1 - Add Docker Repo
By default, the Docker package is not included in the Fedora default repo, so you will need to add the repo for Docker.
You can add the Docker repo using the following command.
dnf -y install dnf-plugins-core
dnf config-manager --add-repo https://download.docker.com/linux/fedora/docker-ce.repo
The above command will create a docker-ce.repo file in the Yum configuration directory.
Step 2 - Install Docker and Docker Compose
Once the Docker repo is added to the Yum repository, you can install both Docker and Docker compose packages with the following command.
dnf install docker-ce docker-ce-cli containerd.io docker-compose-plugin docker-compose -y
After installing both packages, start and enable the Docker service.
systemctl start docker
systemctl enable docker
You can now verify the Docker version using the following command.
docker --version
Output:
Docker version 20.10.17, build 100c701
Step 3 - Install AzureCast
First, create a directory to store all configuration files.
mkdir -p /var/azuracast
Next, download the AzureCast installation script using the following command.
cd /var/azuracast
curl -fsSL https://raw.githubusercontent.com/AzuraCast/AzuraCast/main/docker.sh > docker.sh
Next, set the executable permissions on the downloaded script.
chmod a+x docker.sh
Next, start the AzureCast installation with the following command.
./docker.sh install
You will be asked several questions as shown below:
Checking installation requirements for AzuraCast...
[PASS] Operating System: Linux
[PASS] Architecture: x86_64
[PASS] Command Present: curl
[PASS] Command Present: awk
[PASS] User Permissions
[PASS] Installation Directory
[PASS] All requirements met!
Docker is already installed! Continuing...
Docker Compose v2 is already installed. Continuing...
Your current release channel is 'Rolling Release'. Switch to 'Stable' release channel? [y/N] N
Type N and press the Enter key. You will be asked to select a language.
Select Language [English (Default)]:
[en_US] English (Default)
[cs_CZ] čeština
[de_DE] Deutsch
[es_ES] Español
[fr_FR] Français
[el_GR] ελληνικά
[it_IT] Italiano
[hu_HU] magyar
[nl_NL] Nederlands
[pl_PL] Polski
[pt_PT] Português
[pt_BR] Português do Brasil
[ru_RU] Русский язык
[sv_SE] Svenska
[tr_TR] Türkçe
[zh_CN] 簡化字
[ko_KR] 한국어
>
Just press the Enter key to choose the English language. You will see the following output.
AzuraCast Installer
===================
Welcome to AzuraCast! Complete the initial server setup by answering a few questions.
AzuraCast is currently configured to listen on the following ports:
* HTTP Port: 80
* HTTPS Port: 443
* SFTP Port: 2022
* Radio Ports: 8000,8005,8006,8010,8015,8016,8020,8025,8026,8030,8035,8036,8040,8045,8046,8050,8055,8056,8060,8065,8066,8070,8075,8076,8090,8095,8096,8100,8105,8106,8110,8115,8116,8120,8125,8126,8130,8135,8136,8140,8145,8146,8150,8155,8156,8160,8165,8166,8170,8175,8176,8180,8185,8186,8190,8195,8196,8200,8205,8206,8210,8215,8216,8220,8225,8226,8230,8235,8236,8240,8245,8246,8250,8255,8256,8260,8265,8266,8270,8275,8276,8280,8285,8286,8290,8295,8296,8300,8305,8306,8310,8315,8316,8320,8325,8326,8330,8335,8336,8340,8345,8346,8350,8355,8356,8360,8365,8366,8370,8375,8376,8380,8385,8386,8390,8395,8396,8400,8405,8406,8410,8415,8416,8420,8425,8426,8430,8435,8436,8440,8445,8446,8450,8455,8456,8460,8465,8466,8470,8475,8476,8480,8485,8486,8490,8495,8496
Customize ports used for AzuraCast? (yes/no) [no]:
>
Just press the Enter key to select default ports.
Enable Custom Code Plugins (yes/no) [no]:
>
Press the Enter key to enable the default plugins.
Enable web-based Docker image updates (yes/no) [yes]:
>
Press the Enter key to use the default option. Once the installation has been completed, you should see the following output.
[OK] AzuraCast installation complete!
Visit http://192.168.10.10 to complete setup.
[+] Running 2/2
⠿ Container azuracast_updater Started 1.6s
⠿ Container azuracast Started 14.2s
Step 4 - Access AzureCast Web Interface
Now, open your web browser and access the AzureCast web interface using the URL http://your-server-ip. You will see the account creation page.
Define your account information and click on the CREATE ACCOUNT. You will see the Create Radio Station page.
Provide all required information and click on CREATE AND CONTINUE. You should see the “Customize AzuraCast” page.
Select your required options and click on SAVE AND CONTINUE. You should see the following page.
You can now add your music files and start playing them via a web browser.
Conclusion
Congratulations! You have successfully installed the AzuraCast radio station management tool on Fedora Linux and can now start your own radio station with AzureCast. You can now test AzureCast on dedicated server hosting from Atlantic.Net!
### How to Install Laravel Framework on Fedora
Laravel is an open-source PHP web framework with expressive and elegant syntax. It is robust, easy to understand, and follows a model-view-controller design pattern. Laravel provides a set of tools and resources to build modern PHP applications. If you are looking for an open-source framework to create extensible PHP-based websites and web applications at scale, then Laravel is the best option for you.
In this post, we will show you how to install Laravel on Fedora Linux.
Step 1 - Install LEMP Server
First, install the Nginx and MariaDB server using the following command.
dnf install nginx mariadb-server
Next, add the PHP Remi repository with the following command.
dnf install -y http://rpms.remirepo.net/fedora/remi-release-34.rpm
dnf module install php:remi-8.1
Then, install PHP with additional PHP extensions using the following command.
dnf install php php-cli php-common php-fpm php-spl php-hash php-ctype php-json php-mbstring php-gd php-curl php-mysqli php-xml php-gmp php-xmlrpc php-bcmath php-soap php-ldap unzip -y
Once all the packages are installed, start and enable Nginx, MariaDB, and PHP-FPM services.
systemctl start php-fpm nginx mariadb
systemctl enable php-fpm nginx mariadb
Next, edit the PHP-FPM configuration file.
nano /etc/php-fpm.d/www.conf
Change the following lines.
listen.owner = nginx
listen.group = nginx
Then, edit the PHP configuration file.
nano /etc/php.ini
Change the following values.
date.timezone = UTC
cgi.fix_pathinfo=1
Save and close the file, then restart the PHP-FPM service to reload the changes.
systemctl restart php-fpm
Step 2 - Install Laravel
Before starting, you will need to install PHP Composer on your server. You can install it with the following command.
wget https://getcomposer.org/installer -O composer-installer.php
php composer-installer.php --filename=composer --install-dir=/usr/local/bin
Next, change the directory to the Apache root and create a Laravel project with the following command.
cd /var/www/html
composer create-project --prefer-dist laravel/laravel laravelsite
Once the Laravel is installed, you will see the following output.
> @php artisan vendor:publish --tag=laravel-assets --ansi --force
INFO No publishable resources for tag [laravel-assets].
No security vulnerability advisories found
> @php artisan key:generate --ansi
INFO Application key set successfully.
Next, set proper permissions and ownership to the Laravel directory.
chown -R nginx:nginx /var/www/html/laravelsite/storage/
chown -R nginx:nginx /var/www/html/laravelsite/bootstrap/cache/
chmod -R 0777 /var/www/html/laravelsite/storage/
chmod -R 0775 /var/www/html/laravelsite/bootstrap/cache/
Step 3 - Configure Nginx for Laravel
Next, create an Nginx virtual host configuration file to host Laravel on the Internet.
nano /etc/nginx/conf.d/laravel.conf
Add the following lines:
server {
listen 80;
server_name laravel.yourdomain.com;
root /var/www/html/laravelsite/public;
index index.php;
charset utf-8;
gzip on;
gzip_types text/css application/javascript text/javascript application/x-javascript image/svg+xml text/plain text/xsd text/xsl text/xml image/x-icon;
location / {
try_files $uri $uri/ /index.php?$query_string;
}
location ~ \.php {
include fastcgi.conf;
fastcgi_split_path_info ^(.+\.php)(/.+)$;
fastcgi_pass unix:/run/php-fpm/www.sock;
}
location ~ /\.ht {
deny all;
}
}
Save and close the file, then edit the Nginx main configuration file.
nano /etc/nginx/nginx.conf
Add the following lines after the line http {:
server_names_hash_bucket_size 64;
Save the file, then verify the Nginx configuration for any syntax error.
nginx -t
You should get the following output:
nginx: the configuration file /etc/nginx/nginx.conf syntax is ok
nginx: configuration file /etc/nginx/nginx.conf test is successful
Finally, restart the Nginx and PHP-FPM services to apply the changes.
systemctl restart php-fpm
systemctl restart nginx
Step 4 - Access Laravel Site
Now, Laravel is installed with Nginx on your server. You can now access it using the URL http://laravel.yourdomain.com. You will see the Laravel page on the following screen.
Conclusion
Congratulations! You have successfully installed the Laravel framework on Fedora Linux. You can now start developing your PHP-based web application using the Laravel framework. You can now deploy the Laravel application on dedicated server hosting from Atlantic.Net!
### HIPAA Requirements for Attorneys
It’s not just healthcare organizations that need to adhere to HIPAA requirements. Attorneys and law firms often deal with health care providers and private health records and need to ensure they meet regulatory standards.
Getting HIPAA requirements wrong can lead to a financial penalty, so read on to find out what you need to know about HIPAA as an attorney and the best practices you and your firm should be following.
What Is HIPAA?
HIPAA stands for the Health Insurance Portability and Accountability Act. As an attorney, you need to be fully aware of HIPAA requirements and consider them in your everyday practices, from handling sensitive patient data to your use of tort attorney software.
Attorneys concerned with HIPAA requirements will need to pay particular attention to the accountability aspects of the act noted in these provisions:
Privacy Rule: Protects the privacy of individually identifiable health information, known as Protected Health Information (PHI). It sets boundaries on the use and release of health records, establishes safeguards to protect the privacy of PHI, and holds violators accountable, often with civil and criminal penalties.
Security Rule: Specifies a series of administrative, physical, and technical safeguards to ensure the confidentiality, integrity, and availability of electronic protected health information (e-PHI).
Transactions and Code Sets Rule: Standardizes the codes used to specify diseases, treatments, and medical procedures. This facilitates health-related electronic transactions like billing, referrals, and other administrative work.
Unique Identifiers Rule: Provides a standardized way to identify healthcare entities in electronic transactions through the National Provider Identifier (NPI).
Enforcement Rule: Provides guidelines for investigations into HIPAA compliance violations, including imposing monetary penalties for violations and procedures for hearings.
The Scope of HIPAA for Attorneys
The healthcare industry may be the primary target of HIPAA regulations. Still, there are various instances where attorneys must follow its guidelines, especially when dealing with medical cases with Protected Health Information (PHI).
Attorneys may encounter PHI in scenarios such as:
Medical malpractice litigation
Personal injury cases
Worker’s compensation
Family law cases involving medical records
Employment discrimination cases with medical considerations
Key HIPAA Requirements for Attorneys
Business Associate Agreements (BAAs)
If an attorney is performing services for a covered entity (like a healthcare provider or insurer) and has access to PHI, they may be considered what HIPAA terms “business associates”.
In this case, they must have a Business Associate Agreement (BAA) with the covered entity, which outlines how PHI will be used, disclosed, and protected. These agreements typically cover your responsibilities concerning PHI and any subcontractors you might work with.
In addition to BAAs, attorneys should also be aware that certain situations may require the use of HIPAA forms and documentation, such as consent forms for the release of medical records or authorization forms for the use of PHI in legal proceedings.
Data Protection
Attorneys with access to PHI must have physical, administrative, and technical safeguards in place. This means secured databases, encrypted communications, staff training, and protocols for handling and storing sensitive data.
Law firms working with or in relation to a covered entity will be expected to have high data protection in place. Everything from your emails to your remote desktop connection manager should be considered.
Even if an attorney is permitted to access PHI for a case, HIPAA mandates the “minimum necessary” principle. Attorneys should only request, use, or disclose the minimum amount of PHI necessary to accomplish the intended purpose.
Notification of Breaches
If there's a major or minor breach or unauthorized disclosure of PHI, attorneys must have processes to notify the covered entity and, in some cases, the affected individuals and even the Department of Health and Human Services (HHS).
BAAs should inform the covered entity without unreasonable delay and in no case later than 60 calendar days after the discovery of a breach. The notification should provide:
A description of the breach
The types of information involved in the breach
Steps taken to investigate the breach
Potential mitigative measures taken
Often, it’s then up to the covered entity to inform individuals, but this can depend on who the attorney is working with.
Document Retention
Any PHI records attorneys hold must be retained securely for the required period (often six years), and there should be clear policies about document destruction once that period expires.
Attorneys must retain documents such as:
Business Associate Agreements
Privacy and security policies and procedures specific to the firm’s handling of PHI
Risk assessment reports and results
Training materials and documentation related to HIPAA compliance training for staff
Any incident or breach documentation, including investigations, notifications, and responses
HIPAA doesn’t mandate a specific format for retaining records — they can be kept in either electronic or paper format, but they must be accessible, reproducible when required, and protected from unauthorized digital or physical access, tampering, or destruction.
Best Practices for Attorneys to Meet HIPAA Requirements
Thorough and Continuous Training
Attorneys and all staff at a legal firm should familiarize themselves with which of their clients or activities fall under HIPAA's jurisdiction, common violations, and potential risks. This should be included as part of onboarding training and flagged when new cases are accepted.
In addition, you should regularly update your staff and legal professionals on HIPAA compliance, ensuring everyone knows how to handle PHI correctly. Set a fixed annual date for refresher training for all staff.
Tip: Ask all staff to bookmark the official HHS HIPAA webpage or use online HIPAA training resources like the American Bar Association (ABA).
Use Secure Communication
Data breaches are likely if communication lines are insecure, whether email, messaging, or phone calls.
Attorneys should always use secure, encrypted email services when sending or receiving PHI electronically. You should also be wary of discussing PHI over unsecured phone lines or in public places where conversations can be overheard.
Tip: Implement email software that prompts a warning or requires an additional step when sending emails containing potential PHI.
Manage Data Storage, Access Control, and Documents with Care
Communication isn’t the only vulnerability at law firms. Your storage solutions and document management systems can be hacked too.
Store electronic files containing PHI on secure, encrypted drives or cloud storage solutions that comply with HIPAA. Limit access to PHI only to those within the firm who need it for case-related reasons. Use strong, unique passwords, and consider two-factor authentication for added security.
You should also maintain a strict protocol for document retention. Have a clear policy for document destruction, ensuring that both electronic health records and paper records containing PHI are destroyed so they can't be reconstructed.
Tip: Use software that tags and categorizes documents containing PHI and sets automated reminders for when these documents should be reviewed or securely destroyed.
Have a Response Plan for Data Breaches
It’s always best to prepare for the worst. You must develop and regularly update a response plan for any potential security incidents. This plan should outline the steps to be taken, including notifications, internal investigations, and corrective actions.
Utilizing incident alert management systems can be highly beneficial in promptly detecting and responding to breaches.
Also, familiarize yourself with the breach notification requirements under HIPAA, ensuring timely reporting if a breach does occur. Ensure all bases are covered, from information stored on sites with other domains via Only Domains to employees’ smartphones.
Tip: Conduct mock breach scenarios annually to test your firm's contingency plan. This will help familiarize everyone with the steps they must take in an actual breach situation.
Maintain Physical Security
While the above tips focus on electronic and technical safeguards, many law firms have paper records too. Keep paper documents containing Protected Health Information in locked cabinets or secure rooms.
You should also ensure office premises have adequate security measures like alarms, surveillance cameras, and controlled access to areas where sensitive information is stored.
Tip: Install a logging system for access to workstations and secure areas to trace who had access to sensitive information and when.
Regularly Audit and Review
Once you have administrative safeguards in place, don’t just forget about them indefinitely. Instead, regularly audit your firm's practices and data management tools regarding PHI to ensure ongoing compliance.
Review and update your internal policies regularly to adapt to law changes and address potential vulnerabilities.
Tip: Use a compliance checklist to ensure all areas of potential concern are audited bi-yearly.
Collaborate with IT Staff and External Consultants
IT professionals are your best friends regarding HIPAA’s technical policies. Schedule routine cybersecurity assessments, vulnerability scans, and penetration testing to uncover and address potential weaknesses. Breaches can appear in places with little human interaction too, like automated customer service software, so be sure to get IT to cover all the bases.
Finally, if you’re still unsure about meeting HIPAA requirements, it’s time to seek external advice. And even if you’re confident in your technical security measures, seeking external legal or compliance consultation periodically can help identify potential oversights or areas of improvement.
Tip: Attend seminars or webinars focused on the intersection of legal practice and HIPAA compliance.
Conclusion: Ensure your firm meets HIPAA requirements
HIPAA requirements mean any law firm should have reasonable safeguards in place to protect clients, patients, and employees. While monetary penalties are a top concern, HIPAA is also about ensuring trust across your firm and for your clients.
If your firm is dealing with any healthcare industry partners or clients, HIPAA is an essential part of day-to-day security practices, from data storage to everyday administrative actions. In addition to references this blog, please make sure you do a comprehensive research on HIPAA compliance by utilizing various available online and through credible sources.
Atlantic.Net can assist you with all your HIPAA cloud and storage hosting needs.
### Disaster Recovery vs. Business Continuity
Understanding business continuity and disaster recovery is critical to safeguard an organization's ability to maintain normal operations before, during, and after a disruptive event.
Modern businesses are heavily invested in IT and cloud systems, which provide critical and essential business functions that are needed around the clock.
Disaster Recovery and Business Continuity planning are essential business strategies designed to ensure the continuation of core business services during a disaster. Disaster Recovery focuses on the technical requirements to ensure services are fault tolerant.
Business continuity ensures the business maintains trading and includes processes encompassing the business's administrative and functional side.
This article will dive into the world of disaster recovery and business continuity as we learn how the best businesses protect their existence with tried and tested disaster recovery plans.
What Is Business Continuity and Disaster Recovery?
Business continuity is a proactive strategy that ensures critical business functions and processes remain operational during and after a catastrophic event, such as natural disasters, power outages, or cyber-attacks. The goal is to minimize disruption and maintain business operations at an optimal level.
A typical business continuity plan involves risk management strategies that focus on preventing data loss and facilitating the recovery of critical systems in the event of a disruption. Business continuity management is a comprehensive approach encompassing various aspects, including business impact analysis, which helps identify and mitigate potential business continuity risks.
On the other hand, disaster recovery is a subset of business continuity focusing specifically on IT infrastructure and data protection. The disaster recovery process involves the implementation of policies and procedures to enable the recovery or continuation of vital technology infrastructure and systems following a disaster.
A proper disaster recovery plan is essential to restore business processes with minimal downtime, ensuring data backups are utilized effectively to resume operations swiftly. Disaster recovery planning includes delineating recovery tasks and setting up emergency office locations to facilitate a quick return to normal business operations.
What Are the Key Differences Between Business Continuity and Disaster Recovery?
Though closely related, these two concepts have distinct roles to play in ensuring the seamless operation of business processes, especially in the face of unforeseen challenges. Let's dissect the critical differences between these two vital components.
Business continuity, a comprehensive strategy, is designed to ensure the uninterrupted functioning of critical business operations. It encompasses a broad spectrum of organizational facets, including personnel management and supply chain stability, aiming to mitigate risks and maintain business operations at a functional level during and after a disruptive event.
On the other hand, disaster recovery is a specialized segment within business continuity, focusing primarily on restoring IT infrastructure and data post-disruption. This strategy is centered on minimizing downtime and data loss, with a detailed plan to recover essential IT systems and data swiftly and efficiently.
It delineates a clear recovery time objective, outlining the acceptable periods for system downtime and data loss, ensuring a quick return to business operations.
Business continuity involves a meticulous risk management process and business impact analysis during the planning phase. This process identifies potential risks and develops strategies to mitigate the adverse effects of business interruptions, fostering a resilient operational framework. In contrast, disaster recovery involves crafting a technical plan that outlines steps to restore critical IT systems and data, focusing on minimal downtime and ensuring data protection.
The implementation of these strategies involves different teams within the organization. Business continuity requires a collaborative approach, with various departments working together to maintain business operations. It necessitates coordination and communication across other business sectors, including operations and human resources.
Conversely, disaster recovery is spearheaded by the IT department, working closely with a specialized team to restore critical systems and ensure data recovery, focusing on technical expertise and IT resources.
Regular testing is vital to both strategies, ensuring their effectiveness in real-time scenarios. Business continuity tests the organization's readiness to handle a disruptive event, involving drills and simulations to evaluate the plan's effectiveness.
Meanwhile, disaster recovery focuses on technical drills to test the IT infrastructure's resilience and the effectiveness of data backup solutions.
What Is BCP in Disaster Recovery?
Business Continuity Planning in disaster recovery is a blueprint that guides organizations in maintaining business operations and minimizing downtime during a disaster scenario. The strategies and protocols are designed to safeguard critical business processes and functions. A typical business continuity plan demonstrates how to resume operations swiftly, ensuring minimal disruption to business operations and facilitating a smooth transition back to normalcy.
Within the broader framework of disaster recovery, BCP plays a pivotal role. It outlines the steps necessary to restore and maintain business operations, including recovering critical systems and data, while addressing other vital areas such as supply chain management, personnel coordination, and facility restoration. Engineers will need detailed blueprints that explain how to invoke DR, the order to bring systems online, and access to the required blueprints.
Furthermore, BCP in disaster recovery involves establishing a team of specialists to implement the disaster recovery plan. This team works closely with business leaders and the IT department to coordinate recovery efforts, minimizing business interruption and restoring everyday operations as quickly as possible.
What's the Key Difference Between Business Resilience and Business Continuity?
Business resilience focuses on building a robust framework that allows an organization to anticipate, respond to, and recover from disruptions, ensuring survival and an opportunity to thrive and grow. It involves crafting strategies that promote a resilient organizational culture, one that is capable of adapting to changing circumstances swiftly.
It encompasses a broader spectrum, including financial stability, supply chain resilience, and developing a flexible business model that can withstand and adapt to changing market dynamics. Business resilience integrates continuity and disaster recovery plans into a comprehensive strategy focusing on long-term sustainability and growth.
The scope and approach are critical differences between business resilience and business continuity. While business continuity is more about maintaining critical business operations during disruptions, business resilience takes a broader view, focusing on the organization's ability to adapt and evolve in a changing environment.
Why Are Business Continuity Planning and Disaster Recovery Planning Important?
Business Continuity and Disaster Recovery (BCDR) are influential policies that impact many different types of modern businesses. Understanding what would happen to your business during a disaster is essential.
Here are some of the critical ways BCDR can safeguard the future of your business:
Lower financial risk: Disruptions can lead to immediate and long-term financial repercussions that may cause customers to leave en masse during a severe outage. BCDR strategies reduce risk by ensuring rapid recovery of operations and minimizing the duration and cost of downtime.
Guarding brand reputation and customer trust: Brand reputation is invaluable in our connected and social media-driven society. BCDR is pivotal in upholding an organization's image, demonstrating a commitment to service continuity and customer satisfaction. Customers are likely to remain loyal if they receive good service.
Ensuring Legal and Regulatory Compliance: Many sectors mandate strict disaster recovery and business continuity measures. For example, DR is a mandatory requirement of HIPAA Compliance. BCDR ensures adherence to these regulations, preventing potential legal complications and penalties.
Enhancing Organizational Resilience: Beyond recovery, BCDR promotes resilience, preparing organizations to adapt and evolve. This proactive approach strengthens the organization's capacity to face and overcome future challenges.
Facilitating Swift Recovery: Time is critical when a disaster strikes, so a recovery time objective (RTO) is crucial. Disaster recovery planning needs to be capable of hitting the RTO targets with a suitable technical solution. The good news is that when you choose Cloud Computing DR services, the RTO margins drop considerably.
Protecting Data and Intellectual Property: Data integrity and protection are vital even during a disaster. BCDR strategies must prioritize data backup and protection, ensuring the integrity and security of critical information and intellectual assets.
Promoting a Culture of Preparedness: BCDR promotes a proactive culture within businesses; with regular training and DR tests, businesses can empower employees to handle any emergency.
The Risks of Not Having Business Continuity and Disaster Recovery Plans
There are so many risks that businesses expose themselves to when there is no business continuity and disaster recovery planning in place. Such risks threaten the company's operational stability and can have far-reaching implications on the financial health and reputation of the business.
In this section, we outline the possible challenges organizations may encounter without robust business continuity strategies and disaster recovery safeguards in place:
Normal Operations Halted: If a disaster strikes, the lack of a business continuity plan can lead to a complete halt of business operations, causing significant business interruption and hampering the business operational flow.
Delayed Reaction: In the absence of a disaster recovery plan, organizations may experience lag in addressing disruptions, which can amplify the adverse effects of the disaster.
Delays are caused by not having the correct people working on the incident and no clear plan (runbooks) to resolve the issues. In the worst case scenarios, it could result in the business going under.
Increased Costs: The absence of a disaster recovery strategy can result in escalating costs due to extended downtime and the need for emergency management measures.
If your data center is destroyed by natural disasters, having no business continuity plan can be the key difference between business trading and making income.
Loss of Revenue: Without business continuity management, organizations might experience a substantial loss of revenue due to business interruption and the inability to maintain business continuity.
Effective business continuity plans and disaster planning can protect revenue streams, retain customers, and ensure business partners that key performance indicators are being met.
Client Trust: A lack of proactive strategies to manage disruptions can erode client trust, especially if the business cannot maintain a semblance of everyday operations during a critical event.
Brand Image: The absence of a disaster recovery strategy can tarnish the brand image, as it may indicate a lack of preparedness to manage crises effectively.
Non-compliance: Organizations might face legal repercussions for not adhering to industry-specific regulations that mandate the implementation of business continuity and disaster recovery plans.
Remember that fines and penalties can be incurred if your business cannot implement effective crisis management.
Penalties: The lack of adherence to risk management protocols and the absence of a risk identification process can result in hefty fines and sanctions.
The HIPAA enforcement rule is one example; healthcare providers can be fined up to $50,000 per violation.
Data Vulnerability: Without a disaster recovery plan, organizations are at a higher risk of data loss and security breaches, compromising sensitive information.
Reviewing your business continuity plan with the disaster recovery team is essential to ensure your backup strategy is fit for purpose. Also, investigate technical DR solutions such as failover, virtual site recovery systems, etc.
IT Infrastructure: The lack of a structured disaster recovery plan can put the IT infrastructure at risk, making it susceptible to unauthorized remote access and cyberattacks during data breaches.
Market Position: The absence of business continuity focuses, and emergency response plans can result in a loss of competitive advantage, as organizations might not be able to resume business running swiftly post-disruption.
Innovation Stagnation: Without contingency planning, organizations might find it challenging to innovate and grow, as resources might be diverted to manage the aftermath of disruptions.
How to Identify Business Continuity Risks
This process is integral to disaster recovery planning, ensuring that organizations are well-prepared to mitigate the impacts of disruptions and maintain operational stability.
Here, we detail a systematic approach to identifying business continuity risks:
Understanding Critical Functions: Begin by identifying the critical functions within your organization. Analyze how disruptions affect these functions and the potential consequences on business continuity.
Conduct risk assessments, implement regular audits, and develop contingency plans to mitigate potential disruptions.
Data Gathering: Collect data from various departments to understand the potential impact of disruptions on different facets of business operations.
To effectively gather data, consider utilizing surveys or questionnaires, conducting interviews with department heads, analyzing existing reports, and leveraging technology to monitor and record real-time data.
Identifying Potential Threats: List potential threats such as natural disasters, cybersecurity breaches, and other disaster scenarios. Understand how these threats can impact business continuity.
Vulnerability Assessment: Evaluate the vulnerabilities in your current system, including gaps in disaster recovery strategy and the IT infrastructure.
To conduct a comprehensive risk assessment, scrutinize elements like network security protocols, data encryption methods, firewall configurations, backup solutions, and server and storage system resilience.
Developing Mitigation Strategies: Based on the risk assessment, develop strategies to mitigate identified risks. This could involve enhancing disaster recovery processes or improving the business continuity plan.
Resource Allocation: Allocate necessary resources for risk management, ensuring sufficient recovery systems are in place to handle potential disruptions.
Drafting the Plan: Create comprehensive business continuity plans that outline the steps to restore regular operations during a disruption.
Integration with Disaster Recovery Plan: Ensure that the business continuity plan is well-integrated with the disaster recovery plan, offering a cohesive approach to managing disruptions.
Regular Drills: Conduct regular drills to test the effectiveness of business continuity plans and disaster recovery strategies. This helps in identifying areas for improvement and making necessary adjustments.
Continuous Improvement: Adopt a culture of constant improvement, where feedback from drills is used to enhance business continuity management and disaster recovery planning.
Employee Training: Train employees on the procedures outlined in the business continuity and disaster recovery plans, ensuring they are well-prepared to respond effectively during a crisis.
Creating Awareness: Develop programs to create awareness about potential risks and the importance of business continuity planning among employees.
Want to know more about Disaster Recovery Planning? Check out this detailed guide.
Why Communication Is a Critical Business Continuity Strategy
Communication is vital in business continuity and disaster recovery planning, facilitating coordinated efforts and ensuring the seamless execution of recovery strategies.
Here, we explore why communication is deemed critical during disaster situations:
Coordination of Recovery Efforts
Unified Response: Effective communication ensures a suitable response to disaster situations, fostering collaboration between various departments and teams involved in disaster recovery planning.
Efficient Execution of Disaster Recovery Plan: Communication facilitates the efficient execution of the disaster recovery plan, ensuring that all teams are aligned and aware of their respective roles and responsibilities.
Minimizing Panic and Confusion
Clear Instructions: During a disaster, clear and concise communication can help minimize panic and confusion, enabling employees to respond calmly and effectively.
Guidance and Direction: Clear guidance and direction through well-structured communication channels can help maintain order and structure, even when standard operations are disrupted.
Informing Stakeholders
Keeping Stakeholders Informed: Communication plays a vital role in maintaining stakeholders, including employees, customers, and partners, informed about the situation and the steps being taken to restore business continuity.
Maintaining Customer Trust: Transparent communication with customers can help keep trust, as organizations can provide regular updates on the recovery process and measures to restore normal operations.
Legal and Regulatory Compliance
Adherence to Regulations: In many industries, timely and accurate communication during disaster situations is mandated by regulations. Effective communication ensures compliance with these legal requirements, avoiding potential penalties.
Documentation for Risk Management: Proper documentation of communications during a disaster can be a vital tool in risk management, helping organizations analyze the response and make necessary improvements for future preparedness.
Ensuring Swift Recovery
Quick Decision Making: Effective communication facilitates quick decision-making, enabling organizations to respond swiftly to evolving situations and implement the disaster recovery plan without delays.
Resource Mobilization: Communication aids in rapidly mobilizing resources, ensuring that the necessary assets are deployed promptly to restore business continuity.
Enhancing Organizational Resilience
Learning and Adaptation: Post-disaster communication serves as a tool for learning and adaptation, helping organizations analyze the response and integrate lessons learned into business continuity planning for future resilience.
Culture of Preparedness: Regular communication about potential risks and preparedness measures fosters a culture of readiness within the organization, enhancing overall resilience.
Disaster Recovery Services from Atlantic.Net
With over three decades of experience, Atlantic.Net has the trusted expertise of a security-focused and highly redundant world-class hosting infrastructure, including the capability to failover critical systems to alternative locations during unforeseen disasters.
Our Infrastructure is meticulously designed to the stringent requirements of SOC2 and SOC 3 Type 2, HIPAA, and HITECH compliance, offering a robust disaster recovery hosting solution that safeguards critical data. Leveraging the power of Veeam backup replication software, Atlantic.Net provides always-on protection for your infrastructure, monitored and managed by a dedicated team of experts.
Atlantic.Net's disaster recovery service is robust and flexible, offering private, public, and hybrid hosting solutions. We ensure top-level RTOs and RPOs, giving clients confidence in proven disaster recovery technology. Our facilities are built to withstand even the most severe natural disasters, including hurricanes and earthquakes, ensuring the safety and accessibility of your data at all times.
To safeguard your business against unforeseen disasters and ensure smooth data recovery, contact Atlantic.Net today. Our team is ready to assist you with fast compliance, 24x7x365 support, and a world-class data center infrastructure designed to meet your needs.
Let Atlantic.Net be your trusted partner in securing a resilient and compliant business future.
### Multi-Factor Authentication Examples
Securing online accounts and safeguarding sensitive information is a fundamental protection required to protect your personal details and privacy. Multi-factor authentication (MFA) is the primary security component used in modern business and our day-to-day lives.
MFA is a proven technology that offers a robust method to verify the identity of authorized users. Through the MFA process, users are required to provide multiple authentication factors to prove their identity. Enhanced security layers like MFA minimize the risk of unauthorized access to digital assets.
This article will explore a few examples of multi-factor authentication, illustrating how it remains a secure and reliable authentication method in various online services.
How Does MFA Work?
Understanding how multi-factor authentication works is essential in grasping its effectiveness in securing online accounts. The process involves verifying the user's identity in multiple different ways. It usually requires something the user knows (like a password), something the user possesses (like a mobile device or security token), and sometimes, unique biological characteristics such as biometric data like fingerprints or facial recognition.
When users log on, they are first prompted to enter a valid username, followed by a primary authentication factor, usually a password. Following this, additional authentication factors are requested, such as a one-time password sent to the user's mobile device or a push notification through mobile apps like Google Authenticator.
A layered approach ensures that even if one factor is compromised, unauthorized users still have to bypass additional layers to gain access, thus creating much higher security controls.
Identification Through Something the User Possesses
MFA evolves around users possessing a validated item that the IT system already knows. These are elements that the user physically includes, such as mobile devices, smart cards, or hardware tokens that have been pre-configured for the system.
For example, when you start a new job, one of the first things you must do is set up IT system access. You will often be asked to scan a QR code and then authenticate a sequence of numbers displayed on your MFA devices. Most likely, this will be your cell phone. Upon entering a password, the user will receive a push notification on their mobile device, requiring them to approve the login attempt.
Security tokens and physical tokens are other common possession factors. These devices generate one-time passwords or personal identification numbers that the user must enter during authentication. By leveraging something the user possesses, it becomes exceedingly difficult for unauthorized users to gain access, as they would need physical possession of the device or token.
Three Main Types of Authentication Factors
Multi-factor authentication revolves around three primary types of authentication factors: knowledge factors, possession factors, and inherence factors. Understanding these concepts will give you a good grasp of the available MFA authentication methods.
Knowledge Factors (something you know):
Knowledge factors are pivotal as they encompass information exclusively known to the user, instantly creating a security layer to safeguard sensitive data and online assets. These factors are typically something the user knows intimately, such as passwords, personal identification numbers (PINs), or answers to security questions.
Possession Factors (something you have):
As discussed earlier, these are items that the user possesses, ranging from mobile devices to security keys and hardware tokens. These factors add an extra layer of security by requiring physical possession of a device or token. The cell phone is arguably the most commonly used device, with security tokens being reserved for specialist security needs such as getting root access to a cloud account/organization.
Inherence Factors (something you are):
These involve unique biological characteristics of the user, such as fingerprints, voice recognition, or facial recognition. Biometric authentication is becoming increasingly popular because it provides secure and quick authentication based on the user's unique biological traits.
How Does Multi-Factor Authentication Work?
This section delves deeper into the intricacies of how multi-factor authentication works. The process begins with the user initiating a login attempt, where they must provide multiple verification forms. This could involve entering a password (knowledge factor), followed by a one-time code sent to their mobile phone (possession factor), and possibly a biometric scan (inherence factor).
Adaptive multi-factor authentication takes this a step further by incorporating risk-based authentication. This method assesses the risk level of a login attempt based on various parameters such as the location of the attempt, the device used, and the user's behavior patterns. Depending on the assessed risk, the system might require additional factors to ensure the legitimacy of the attempt.
By integrating multiple layers of verification, MFA creates a robust security framework that effectively restricts access to only authorized users, safeguarding sensitive information and digital assets from unauthorized access.
Other Types of Multi-Factor Authentication
Apart from the commonly known types, other forms of multi-factor authentication are gaining traction in the security landscape. These include methods such as:
SMS-Based Authentication:
This type of MFA is used extensively with Online retailers and websites that need you to prove who you are. The users receive a one-time password (OTP) via SMS on their mobile phones; you insert this time-sensitive value when prompted, typically straight after inputting the correct username and password.
Smart Cards:
A physical token that stores user identities and grants access when inserted into a reader. You may have seen this in the workplace: employees are given a security pass with a chip embedded in many large organizations. This chip is programmed with authentication that can open doors, unlock laptops, etc.
Security Keys:
Hardware devices authorize access through USB, NFC, or Bluetooth connections. These are typically heavily encrypted devices that give superusers access to core systems. System engineers require such keys when working on sensitive systems such as military, financial, and healthcare-related platforms.
Proprietary Software:
Software solutions that integrate with business rules to create a customized MFA solution. Larger organizations may need to control their MFA authentication methods at source; as a result, custom servers are built in-house, typically with a token authentication factor. A popular example is RSA authentication.
As you can tell, various multi-factor authentication examples offer diverse ways to secure user accounts, each adding a unique layer of security to the authentication process.
How MFA Protects User's Identity
It's obvious to see the importance of MFA. If you have yet to secure your business with MFA, here are some compelling reasons to start this process today.
Enhanced Security:
The primary purpose of MFA is to bolster security. By requiring multiple forms of verification, MFA makes it more difficult for unauthorized users to gain access to an account, as they would need to bypass several layers of security.
Mitigation of Phishing Attacks:
Even if a user's password is compromised through phishing, the attacker still needs to bypass additional authentication steps, significantly reducing the chance of successful phishing attacks.
Protection Against Credential Stuffing:
In cases where usernames and passwords are stolen, MFA is an additional barrier, preventing attackers from gaining access using just the stolen credentials. Dictionary attacks are much more successful if a form of MFA is enabled. Hackers can spam your endpoint with bogus login requests.
Dynamic Codes:
Tools like Google Authenticator, Authy, and Okta can generate active codes that are valid for a short period, making it difficult for attackers to use stolen codes at a later time because they expire rapidly.
Real-Time Alerts:
Through push notifications, users receive real-time alerts for login attempts, allowing them to approve or deny access instantly and be alerted to unauthorized access attempts.
Reduced Reliance on Passwords:
MFA minimizes the reliance on passwords alone for security, which historically has been a weak point in cybersecurity due to issues with weak passwords.
Customizable Security Protocols:
Organizations can tailor MFA systems to meet their specific security needs, allowing for a flexible and robust approach to securing user identities.
Compliance with Regulatory Requirements:
Many industries, such as healthcare, have regulations that require the use of MFA, helping to ensure that organizations adhere to best practices in protecting user data.
Voice Recognition:
This innovative method capitalizes on the unique patterns in a user's voice to verify their identity. Analyzing vocal characteristics ensures that access is granted only when a verbal match is detected, adding a personalized touch to security protocols.
These approaches can be utilized singularly or in various combinations to construct a robust multi-factor authentication system. By tailoring the system to meet specific security needs, organizations can ensure a fortified and resilient security infrastructure, safeguarding sensitive user information from potential breaches.
Protect Remote Access to Company Resources
Remote working has remained a common practice in the post-COVID era. This has resulted in countless businesses investing in their network and VPN systems to create secure access to company resources. Today, remote access to company resources has become a necessity. Implementing a multi-factor authentication system ensures that only authorized users can access sensitive company data, even from remote locations. This approach uses multiple authentication factors, including mobile apps and biometric data, to verify the user's identity, thus maintaining the integrity and security of company resources.
Adaptive Authentication or Risk-Based Authentication
To bolster security, many businesses have introduced adaptive authentication to protect remote access to sensitive assets. This, also known as risk-based authentication, takes a dynamic approach to security.
The MFA system assesses the risk level of each login attempt based on various parameters, such as the user's location, time of access, and behavior patterns. Depending on the assessed risk, the system might require additional authentication factors, thus creating a flexible and responsive security framework that adapts to potential threats in real time.
Always-On Approach
The always-on approach to multi-factor authentication means that the system continually assesses and verifies the user's identity, even after the initial login. This could involve periodic requests for additional factors, such as biometric verification or one-time passwords, to ensure the account remains secure.
Identification Through Location and Time
This authentication approach considers the login attempt's geographical location and time as significant factors in the authentication process. Suppose a login attempt is made from an unusual place or at an odd hour. In that case, the system might trigger additional authentication requirements to verify the user's identity, adding an extra layer of security sensitive to the login attempt's context.
What's the Difference between MFA and Two-Factor Authentication (2FA)?
While MFA involves using two or more authentication factors, 2FA is a subset of MFA that uses precisely two factors to verify the user's identity. These factors can be any combination of knowledge, possession, or inherence factors. In contrast, MFA can involve two or more of these factors, potentially offering a higher level of security by incorporating a broader range of verification methods.
How do MFA and Single Sign-On (SSO) Differ?
While both MFA and Single Sign-On (SSO) aim to enhance security and streamline the login process, they differ significantly in their approaches. MFA focuses on verifying the user's identity through multiple layers of authentication, whereas SSO allows users to access multiple accounts or services with a single set of credentials. SSO simplifies the login process but should ideally be used with MFA to bolster security, as it can be a potential vulnerability if a single set of credentials is compromised.
Elevate Your Business Security with Atlantic.Net's Managed Multi-Factor Authentication Service
Atlantic.Net's Multi-Factor Authentication (MFA) service ensures that users prove who they are in multiple ways before they can access your server environment. Our highly secure MFA service is great at stopping different kinds of online attacks, including phishing and account hijacking, providing an extra layer of security even if someone knows your password.
But it's not just about confirming the identity of each user. The service also checks the safety of each device trying to connect, blocking high-risk or outdated software. It works smoothly with many in-house and cloud apps, offering features like easy sign-up, secure logins, and tools to help you set and enforce your own access rules. The service will help you quickly spot and manage unsafe devices and software and even help prevent attacks by identifying risky users through a phishing simulator.
With this service, you can set up stronger access rules, reduce weak spots, and protect your confidential data more effectively. You can choose from various verification methods to match your company's needs, including SMS passcodes, phone callbacks, or one-time passcodes.
Ready to boost your security? To find out more or to get started with Atlantic.Net's Managed Multi-Factor Authentication Service, call an advisor at 888-618-DATA (3282), email sales@atlantic.net, or fill out the form on our contact page. Let Atlantic.Net help you build a safer and more resilient business environment.
### How to Install DokuWiki on Fedora
DokuWiki is an open-source PHP-based wiki software developed by Andreas Gohr. It is very similar to MediaWiki and doesn’t require a database. It offers a simple yet powerful syntax that allows users to create structured texts easily. DokuWiki comes with all the necessary features to create a website along with SEO, authentication, and much more.
This post will show you how to install DokuWiki on Fedora Linux.
Step 1 - Install Apache and PHP
First, install the Apache web server package using the following command.
dnf install httpd -y
Next, add the PHP Remi repository to get the latest PHP version.
dnf install -y http://rpms.remirepo.net/fedora/remi-release-34.rpm
dnf module install php:remi-8.1
Next, install the PHP and other required dependencies using the following command.
dnf install php php-mysqlnd php-fpm php-xml php-cli php-soap php-opcache php-iconv php-pear php-bcmath php-gd php-mbstring php-json php-devel unzip wget -y
Next, start and enable the Apache service with the following command.
systemctl start httpd
systemctl enable httpd
Step 2 - Download DokuWiki
First, download the latest version of DokuWiki using the following command.
wget https://download.dokuwiki.org/src/dokuwiki/dokuwiki-stable.tgz
Next, extract the downloaded file to the Apache web root directory.
mkdir /var/www/html/dokuwiki
tar xzf dokuwiki-stable.tgz --strip-components=1 -C /var/www/html/dokuwiki/
Next, change the ownership of the DokuWiki directory.
chown -R apache:apache /var/www/html/dokuwiki
Step 3 - Create an Apache Virtual Host for DokuWiki
Next, you will need to create an Apache virtual host configuration file.
nano /etc/httpd/conf.d/dokuwiki.conf
Add the following configurations:
ServerAdmin admin@example.com
ServerName doku.example.com
DocumentRoot /var/www/html/dokuwiki
AllowOverride All
Require all denied
Order allow,deny
Deny from all
ErrorLog /var/log/httpd/dokuwiki_error.log
CustomLog /var/log/httpd/dokuwiki_access.log combined
Save and close the file then copy the .htaccess file.
cp /var/www/html/dokuwiki/.htaccess{.dist,}
Next, restart the Apache service to apply the changes.
systemctl restart httpd
Step 4 - Access DokuWiki
Now, open your web browser and access the DokuWiki web UI using the URL http://doku.example.com/install.php. You will see the following screen.
Provide all required information and click on the Save button. You will see the following screen.
Click on your new DokuWiki. You will see the DokuWiki dashboard on the following screen.
Conclusion
Congratulations! You have successfully installed DokuWiki on Fedora Linux. You can now start creating your own wiki website easily using DokuWiki. Try to host your own wiki site on VPS hosting from Atlantic.Net!
### How to Install Typo3 CMS on Fedora
TYPO3 is an open-source and platform-independent content management system that allows users to post and maintain their content on the web. It is based on PHP and used for Web Content Management (WCM) and Enterprise Content Management (ECM). It is compatible with many operating systems like Linux, Windows, macOS, and OS/2. If you are looking for an open-source digital content publishing platform, then TYPO3 is the best option for you.
This post will show you how to install TYPO3 CMS on Fedora Linux.
Step 1 - Install Apache, MariaDB, and PHP
Let's start with installing the Apache and MariaDB server on your system.
dnf install httpd mariadb-server -y
Next, add the PHP Remi repo to get the latest PHP version.
dnf install -y http://rpms.remirepo.net/fedora/remi-release-34.rpm
dnf module install php:remi-8.1
Next, install PHP with additional PHP extensions using the following command.
dnf install php php-mysqlnd php-fpm php-xml php-cli php-soap php-opcache php-iconv php-pear php-bcmath php-gd php-mbstring php-json php-devel unzip wget -y
yum --enablerepo=remi install php-intl php-zip
Next, edit the PHP configuration file.
nano /etc/php.ini
Change the following values.
memory_limit = 512M
max_execution_time = 300
max_input_vars = 2000
date.timezone = UTC
post_max_size = 30M
upload_max_filesize = 30M
Save and close the file then start and enable the Apache and MariaDB service using the following command.
systemctl start httpd mariadb
systemctl enable httpd mariadb
Step 2 - Create a Database for TYPO3
Now, connect to the MariaDB console using the command given below.
mysql
Once you are connected, create a database and user for TYPO3.
create database typo3cms CHARACTER SET utf8mb4 COLLATE utf8mb4_unicode_ci;
create user 'typo3cms'@localhost identified by 'password';
grant all privileges on typo3cms.* to 'typo3cms'@localhost;
Next, flush the privileges and exit from the MariaDB using the following command.
flush privileges;
exit;
Step 3 - Install TYPO3
First, download the latest version of TYPO3 CMS using the following command.
curl -L -o typo3_src.tgz https://get.typo3.org/12.4.4
Once the download is completed, extract the downloaded file.
tar -xvzf typo3_src.tgz
Next, move the extracted directory to the Apache web root.
mv typo3_src-12.4.4 /var/www/html/typo3
Next, change the ownership of the TYPO3 directory.
chown -R apache:apache /var/www/html/typo3
Step 4 - Configure Apache for TYPO3
Next, create an Apache virtual host configuration file for TYPO3.
nano /etc/httpd/conf.d/typo3.conf
Add the following configurations:
ServerAdmin admin@example.com
DocumentRoot /var/www/html/typo3/
ServerName typo3.example.com
Protocols h2 http/1.1
Options FollowSymlinks
AllowOverride All
Require all granted
ErrorLog /var/log/httpd/typo3-error.log
CustomLog /var/log/httpd/typo3-access.log combined
RewriteEngine on
RewriteBase /
RewriteCond %{REQUEST_FILENAME} !-f
RewriteRule ^(.*) index.php [PT,L]
Save and close the file, then restart the Apache service to apply the changes.
systemctl restart httpd
Step 5 - Access TYPO3 CMS
Before accessing the TYPO3 web installation wizard, create a blank file inside the TYPO3 CMS directory.
touch /var/www/html/typo3/FIRST_INSTALL
Next, open your web browser and access the TYPO3 CMS using the URL http://typo3.example.com. You will see the following screen.
Click on "No problem detected, continue with the installation". You will see the database setup screen.
Define your database username and password and click on the Continue button. You will see the following screen.
Select your database and click on the Continue button. You will see the TYPO3 account configuration screen.
Define your admin username, password, and email, then click on Continue. Once the installation is completed, you will see the following screen.
Select Take me to the backend and click on Open the TYPO3 Backend. You will see the TYPO3 CMS login screen.
Provide your admin username and password and click on Login. You will see the TYPO3 dashboard on the following screen.
Conclusion
Congratulations! You have successfully installed TYPO3 CMS on Fedora Linux. You can now explore the TYPO3 dashboard, test all its features, and start implementing it in your organization. You can now try TYPO3 CMS on VPS hosting from Atlantic.Net!
### How to Install MediaWiki on Fedora
MediaWiki is a free and open-source wiki system that allows you to put texts, photos, and movies on your MediaWiki page. It allows you to keep every change without deleting the previous versions. MediaWiki is simple and easy to use so any beginner user can change the text and content of the page without much training. MediaWiki uses PHP to process the data and MariaDB as a database backend.
This post will show you how to install MediaWiki on Fedora Linux.
Step 1 - Install Apache, MariaDB, and PHP
First, install the Apache and MariaDB server using the following command.
dnf install httpd mariadb-server -y
Next, add the PHP Remi repository to install the latest PHP version.
dnf install -y http://rpms.remirepo.net/fedora/remi-release-34.rpm
dnf module install php:remi-8.1
Next, install PHP and other required extensions with the following command.
dnf install php php-mysqlnd php-gd php-xml php-mbstring php-json
yum --enablerepo=remi install php-intl php-sodium php-zip
Next, start and enable the Apache and MariaDB services using the following command.
systemctl start mariadb httpd
systemctl enable mariadb httpd
Step 2 - Create a Database for MediaWiki
Next, you will need to create a database and user to store the MediaWiki data.
First, log in to the MariaDB shell.
mysql -u root -p
Once you are connected to MariaDB, create a database and user for MediaWiki.
CREATE DATABASE mediawikidb;
GRANT ALL PRIVILEGES ON mediawikidb.* TO 'mediawikiuser'@'localhost' IDENTIFIED BY 'password';
Next, flush the privileges and exit from the MariaDB shell.
FLUSH PRIVILEGES;
EXIT;
Step 3 - Download MediaWiki
First, visit the MediaWiki download page and download the latest version of MediaWiki using the following command.
wget https://releases.wikimedia.org/mediawiki/1.40/mediawiki-1.40.0.tar.gz
Once the download is completed, extract the downloaded file and copy it to the Apache web root.
tar -xvzf mediawiki-1.40.0.tar.gz
mv mediawiki-1.40.0 /var/www/html/mediawiki
Next, change the ownership of the mediawiki directory.
chown -R apache:apache /var/www/html/mediawiki
Step 4 - Configure Apache for MediaWiki
Next, you will need to create an Apache virtual host configuration file to host MediaWiki.
nano /etc/httpd/conf.d/media.conf
Add the following configurations:
ServerName media.example.com
DocumentRoot /var/www/html/mediawiki
ErrorLog /var/log/httpd/error.log
CustomLog /var/log/httpd/requests.log combined
Save and close the file then restart the Apache service to apply the changes.
systemctl restart httpd
Step 5 - Access MediaWiki
Open your web browser and access the MediaWiki installation using the URL http://media.example.com. You will see the following screen.
Click on the setup wiki. You will see the following screen.
Select your language and click on Continue. You will see the prerequisites check screen.
Click on Continue. You will see the database configuration screen.
Define your database settings and click on Continue. You will see the following screen.
Select "use the same account as for installation" and click on Continue. You will see the MediaWiki configuration screen.
Define your wiki name, admin username, and password, and click on Continue. You will see the following screen.
Click on Continue to start the installation. Once the database setup is completed, you will see the following screen.
Click on Continue. Once the installation is finished, you will see the following screen.
Now, download LocalSettings.php from the above page and copy it to the MediaWiki root directory. Then, click on the Enter your wiki. You will see the MediaWiki dashboard on the following screen.
Conclusion
In this post, we learned how to install MediaWiki with Apache on Fedora and host your own wiki site on the internet. You can now easily host MediaWiki on VPS hosting from Atlantic.Net!
### How to Install phpBB on Fedora
phpBB is a free and open-source bulletin board software solution written in the PHP scripting language. It is one of the most popular CMS platforms used by thousands of professionals around the globe. phpBB supports file attachments, full-text search, notifications, and more. Its aim is to connect groups of people to come together to have discussions, share information, and learn from each other.
This post will show you how to install phpBB forum software on Fedora Linux.
Step 1 - Install LEMP Server
First, install the Nginx and MariaDB server using the following command.
dnf install nginx mariadb-server -y
Once installed, add the PHP Remi repo to your system.
dnf install -y http://rpms.remirepo.net/fedora/remi-release-34.rpm
dnf module install php:remi-8.1
Next, install the PHP with other required packages on your server.
dnf install php php-mysqlnd php-fpm php-xml php-cli php-soap php-opcache php-iconv php-pear php-bcmath php-gd php-mbstring php-json php-devel unzip wget -y
yum --enablerepo=remi install php-intl php-sodium php-zip
Once all the packages are installed, edit the PHP configuration file and change some default settings.
nano /etc/php.ini
Change the following lines.
max_execution_time = 180
max_input_time = 90
memory_limit = 256M
upload_max_filesize = 64M
Next, edit the PHP-FPM configuration file and change the user and group from apache to nginx.
nano /etc/php-fpm.d/www.conf
Change the following lines:
user = nginx
group = nginx
Save and close the file. Then, start and enable the Nginx, MariaDB, and PHP-FPM services.
systemctl start nginx mariadb php-fpm
systemctl enable nginx mariadb php-fpm
Step 2 - Create a phpBB Database and User
phpBB uses MariaDB/MySQL as a database backend, so you will need to create a database and user for phpBB.
First, connect to the MariaDB shell.
mysql
Once you are connected, create a database and user for phpBB.
CREATE DATABASE phpbb;
CREATE USER 'phpbbuser'@'localhost' IDENTIFIED BY 'password';
GRANT ALL ON phpbb.* TO 'phpbbuser'@'localhost' IDENTIFIED BY 'password' WITH GRANT OPTION;
Next, flush the privileges and exit from the MariaDB shell.
FLUSH PRIVILEGES;
EXIT;
Step 3 - Download phpBB Software
First, download the latest version of phpBB using the following command.
wget https://download.phpbb.com/pub/release/3.3/3.3.10/phpBB-3.3.10.zip
Once the download is completed, unzip the downloaded file.
unzip phpBB-3.3.10.zip
Then, move the extracted directory to the Nginx web root directory.
mv phpBB3 /var/www/html/phpbb
Next, install the Composer PHP dependency manager using the following command.
dnf install composer
Next, navigate to the phpBB directory.
cd /var/www/html/phpbb
Then, remove the default vendor directory and install other PHP dependencies using Composer.
rm -rf vendor
composer install
Next, change the permission and ownership of the phpBB directory.
chown -R nginx:nginx /var/www/html/phpbb
chmod -R 775 /var/www/html/phpbb
Step 4 - Configure Nginx for phpBB
Next, create an Nginx virtual host configuration file.
nano /etc/nginx/conf.d/phpbb.conf
Add the following configurations:
server {
listen 80;
server_name phpbb.example.com;
root /var/www/html/phpbb;
index index.php index.html index.htm;
access_log /var/log/nginx/phpbb-access.log;
error_log /var/log/nginx/phpbb-error.log;
location / {
try_files $uri $uri/ @rewriteapp;
# Pass the php scripts to FastCGI server specified in upstream declaration.
location ~ \.php(/|$) {
include fastcgi.conf;
fastcgi_pass unix:/run/php-fpm/www.sock;
fastcgi_split_path_info ^(.+\.php)(/.*)$;
fastcgi_param PATH_INFO $fastcgi_path_info;
fastcgi_param SCRIPT_FILENAME $realpath_root$fastcgi_script_name;
fastcgi_param DOCUMENT_ROOT $realpath_root;
try_files $uri $uri/ /app.php$is_args$args;
fastcgi_intercept_errors on;
}
# Deny access to internal phpbb files.
location ~ /(config\.php|common\.php|cache|files|images/avatars/upload|includes|(?
ServerName prestashop.example.com
DocumentRoot /var/www/html/prestashop
Options -Indexes +FollowSymLinks
AllowOverride All
ErrorLog /var/log/httpd/prestashop-error.log
CustomLog /var/log/httpd/prestashop-access.log combined
Save and close the file, then restart the Apache service to apply the changes.
systemctl restart httpd
Step 5 - Access PrestaShop Web UI
Now, open your web browser and access PrestaShop using the URL http://prestashop.example.com. You will see the following screen.
Select your language and click on Next. You will see the following screen.
Agree on the license and click on Next. You will see the store configuration screen.
Define your store information and click on Next. You will see the following screen.
Select demo installation and click on Next. You will see the database configuration screen.
Define your database settings and click on Next. Once the installation is finished, you will see the following page.
Now, open your terminal and remove the Install folder before logging in to the backend.
rm -rf /var/www/html/prestashop/install
Next, click on Manage your store. You will see the PrestaShop login screen.
Provide your email and password then click on LOG IN. You will see the PrestaShop dashboard.
Conclusion
Congratulations! You have successfully installed PrestaShop with Apache on Fedora Linux. You can now deploy PrestaShop on your own server and sell the products online. You can now test PrestaShop on VPS hosting from Atlantic.Net!
### How to Install Symfony Framework on Fedora
Symfony is a free and open-source PHP web application framework for building web applications, APIs, microservices, and web services. It provides tools and features for building scalable PHP web applications with a robust caching system. It has comprehensive documentation and an active community, making it an excellent resource for Symfony developers looking to create high-quality PHP web applications.
This post will show you how to install the Symfony framework on Fedora Linux.
Step 1 - Install the LAMP Server
Symfony is based on PHP, so you will need to install the LAMP server on your server.
First, install the Apache and MariaDB server using the following command.
dnf install httpd mariadb-server -y
Next, add the PHP Remi repo to get the latest PHP version.
dnf install -y http://rpms.remirepo.net/fedora/remi-release-34.rpm
dnf module install php:remi-8.1
Next, install PHP with other required PHP extensions using the following command.
dnf install php php-cli php-common php-spl php-fpm php-hash php-ctype php-json php-mbstring php-gd php-curl php-mysqli php-xml php-gmp php-xmlrpc php-bcmath php-soap php-ldap unzip -y
Next, start and enable Apache, MariaDB, and PHP-FPM.
systemctl start httpd mariadb php-fpm
systemctl enable httpd mariadb php-fpm
Step 2 - Install Symfony
First, install Composer with the following command.
wget https://getcomposer.org/installer -O composer-installer.php
php composer-installer.php --filename=composer --install-dir=/usr/local/bin
Next, navigate to the Apache web root directory and install Symfony 6 with the following command.
cd /var/www/html
composer create-project symfony/website-skeleton symfony6
Next, set proper permission and ownership to the Symfony directory.
chown -R apache:apache /var/www/html/symfony6
chmod -R 755 /var/www/html/symfony6
Now, change the directory to Symfony and start the Symfony server with the following command.
cd /var/www/html/symfony6
php -S 0.0.0.0:8000 -t public
You will see the following output.
[Thu Aug 17 00:17:19 2023] PHP 8.1.9 Development Server (http://0.0.0.0:8000) started
Now, open your web browser and access Symfony using the URL http://your-server-ip:8000. You will see the following screen.
Next, press CTRL+C to stop the Symfony server. We will configure Apache for Symfony.
Step 3 - Configure Apache for Symfony 6
Next, you must create an Apache virtual host configuration file for Symfony.
nano /etc/httpd/conf.d/symfony.conf
Add the following configuration:
ServerAdmin admin@example.com
DocumentRoot "/var/www/html/symfony6/public"
ServerName symfony.example.com
AllowOverride All
Order Allow,Deny
Allow from All
ErrorLog "/var/log/httpd/example.com-error_log"
CustomLog "/var/log/httpd/example.com-access_log" combined
Save and close the file when you are done.
Then, restart the Apache service to apply the changes.
systemctl restart httpd
Step 4 - Access Symfony Web Interface
Now, open your web browser and access the Symfony dashboard using the URL http://symfony.example.com.
Conclusion
In this post, we showed you how to install Symfony6 on Fedora Linux. You can build and deploy a scalable PHP application using the Symfony framework. You can now try Symfony on dedicated server hosting from Atlantic.Net!
### How to Install React.js with Nginx on Fedora
React JS is a free and open-source JavaScript library used for building single-page applications, web frontends, and UI components. React is lightweight and makes your application faster to load. It has a helpful and interactive developer toolset that helps you to debug your application easily.
In this post, we will show you how to install React JS and configure Nginx as a reverse proxy on Fedora Linux.
Step 1 - Install Node.js
Before starting, you will need to install Node.js on your server. First, install all the Node.js dependencies using the following command.
dnf install -y gcc-c++ make
Then, add the Node source repo to get the latest Node.js version.
curl -sL https://rpm.nodesource.com/setup_18.x | bash -
Next, install the Node.js package with the following command.
dnf install nodejs git
Now, verify the Node.js version using the following command.
node -v
Output.
v18.19.0
Step 2 - Install React JS and Create an Application
First, you will need to install the create-react-app tool on your server. The create-react-app tool helps you create and deploy applications quickly.
You can install it via the NPM command as shown below:
npm install -g create-react-app
You can now verify the create-react-app version with the following command.
create-react-app --version
Output.
5.0.1
Now, run the following command to create your first application.
create-react-app my-app
You will see the following output.
Success! Created my-app at /root/my-app
Inside that directory, you can run several commands:
npm start
Starts the development server.
npm run build
Bundles the app into static files for production.
npm test
Starts the test runner.
npm run eject
Removes this tool and copies build dependencies, configuration files
and scripts into the app directory. If you do this, you can’t go back!
We suggest that you begin by typing:
cd my-app
npm start
Happy hacking!
Step 3 - Run the React JS Application
At this point, your React application is created on your server. Now, it's time to run it.
First, navigate inside your app directory and run the following command to start your application.
cd my-app
npm start
You will see the following output.
Compiled successfully!
You can now view my-app in the browser.
http://localhost:3000
Note that the development build is not optimized.
To create a production build, use npm run build.
webpack compiled successfully
Now, open your web browser and access your React JS app using the URL http://your-server-ip:3000. You will see your application on the following screen.
Step 4 - Create a Systemd File for React JS
Next, you will need to create a system file to manage your application service via the command line.
You can create it using the following command.
nano /lib/systemd/system/react.service
Add the following code:
[Service]
Type=simple
User=root
Restart=on-failure
WorkingDirectory=/root/my-app
ExecStart=npm start -- --port=3000
Save and close the file, then reload the systemd daemon to apply the changes.
systemctl daemon-reload
Now, start and enable the React JS service.
systemctl start react
systemctl enable react
Step 5 - Configure Nginx as a Reverse Proxy
It is a good idea to set up Nginx as a reverse proxy for the React JS app.
First, install the Nginx package using the following command.
dnf install nginx
Next, start and enable the Nginx service with the following command.
systemctl start nginx
systemctl enable nginx
Next, create an Nginx virtual server block.
nano /etc/nginx/conf.d/react.conf
Add the following configurations:
upstream react_backend {
server localhost:3000;
}
server {
listen 80;
server_name react.example.com;
location / {
proxy_pass http://react_backend/;
proxy_http_version 1.1;
proxy_set_header Upgrade $http_upgrade;
proxy_set_header Connection "upgrade";
proxy_set_header Host $http_host;
proxy_set_header X-Real-IP $remote_addr;
proxy_set_header X-Forward-For $proxy_add_x_forwarded_for;
proxy_set_header X-Forward-Proto http;
proxy_set_header X-Nginx-Proxy true;
proxy_redirect off;
}
}
Save and close the file. then edit the Nginx main configuration file.
nano /etc/nginx/nginx.conf
Add the following lines after the line http {:
server_names_hash_bucket_size 64;
Save and close the file, then restart the Nginx service to reload the changes.
systemctl restart nginx
You can now access your React JS application using the URL http://react.example.com.
Conclusion
Congratulations! You have successfully installed and deployed React JS on Fedora Linux. You can now start building your own single-page application using the React framework. You can now deploy a React JS application on dedicated server hosting from Atlantic.Net!
### How to Install Bitwarden Password Manager on Fedora
Bitwarden is a free and open-source password manager used to store sensitive information such as passwords in an encrypted vault. It can be available in a variety of client applications including mobile applications, browser extensions, web interfaces, and desktop apps. Compared to other password managers, Bitwarden is free and includes all the necessary password management features.
In this post, we will show you how to install the Bitwarden password manager on Fedora Linux.
Step 1 - Install Docker and Docker Compose
By default, the Docker and Docker Compose packages are not included in the Fedora default repo, so you will need to add a Docker repo to the Yum repository. You can add it with the following command.
dnf -y install dnf-plugins-core
dnf config-manager --add-repo https://download.docker.com/linux/fedora/docker-ce.repo
The above command will create a docker-ce.repo file in the Yum configuration directory.
Now, run the following command to install Docker, Docker Compose, and other packages to Fedora.
dnf install docker-ce docker-ce-cli containerd.io docker-compose-plugin docker-compose -y
After successful installation, start and enable the Docker service using the following command.
systemctl start docker
systemctl enable docker
You can now verify the Docker version using the following command.
docker --version
Output.
Docker version 20.10.17, build 100c701
Step 2 - Install Bitwarden
Bitwarden provides a script to install Bitwarden to your server automatically via the command line. First, download the auto installation script using the following command.
curl -Lso bitwarden.sh https://go.btwrdn.co/bw-sh
Next, set executable permissions to the script.
chmod +x bitwarden.sh
Next, run the following command to start the installation.
./bitwarden.sh install
You will be asked to provide your domain name or IP address as shown below:
_ _ _ _
| |__ (_) |___ ____ _ _ __ __| | ___ _ __
| '_ \| | __\ \ /\ / / _` | '__/ _` |/ _ \ '_ \
| |_) | | |_ \ V V / (_| | | | (_| | __/ | | |
|_.__/|_|\__| \_/\_/ \__,_|_| \__,_|\___|_| |_|
Open source password management solutions
Copyright 2015-2023, 8bit Solutions LLC
https://bitwarden.com, https://github.com/bitwarden
===================================================
bitwarden.sh version 2023.7.2
Docker version 20.10.17, build 100c701
docker-compose version 1.28.6, build unknown
(!) Enter the domain name for your Bitwarden instance (ex. bitwarden.example.com): 192.168.10.10
Provide your server IP and press the Enter key. You will be asked for SSL installation, database name, Bitwarden installation key, region, and self-signed installation as shown below:
(!) Do you want to use Let's Encrypt to generate a free SSL certificate? (y/n): n
(!) Enter the database name for your Bitwarden instance (ex. vault): vault
(!) Enter your installation id (get at https://bitwarden.com/host): 60baaac0-2c35-4b4b-80ea-b06001083c0b
(!) Enter your installation key: LfhbacCe5EYy4pn2L5if
(!) Enter your region (US/EU) [US]: US
(!) Do you have a SSL certificate to use? (y/N): N
(!) Do you want to generate a self-signed SSL certificate? (y/N): y
Provide all required information and press the Enter key. Once the Bitwarden is installed, you will see the following output.
Generating self signed SSL certificate.
Generating a RSA private key
.......................++++
............................................++++
writing new private key to '/bitwarden/ssl/self/192.168.10.10/private.key'
-----
Generating key for IdentityServer.
Generating a RSA private key
.................................................................................................................................................................++++
.........................++++
writing new private key to 'identity.key'
-----
!!!!!!!!!! WARNING !!!!!!!!!!
You are using an untrusted SSL certificate. This certificate will not be
trusted by Bitwarden client applications. You must add this certificate to
the trusted store on each device or else you will receive errors when trying
to connect to your installation.
Building nginx config.
Building docker environment files.
Building docker environment override files.
Building FIDO U2F app id.
Building docker-compose.yml.
Installation complete
If you need to make additional configuration changes, you can modify
the settings in `./bwdata/config.yml` and then run:
`./bitwarden.sh rebuild` or `./bitwarden.sh update`
Step 3 - Start Bitwarden
Next, run the following command to start Bitwarden.
./bitwarden.sh start
If everything is fine, you will get the following output.
_ _ _ _
| |__ (_) |___ ____ _ _ __ __| | ___ _ __
| '_ \| | __\ \ /\ / / _` | '__/ _` |/ _ \ '_ \
| |_) | | |_ \ V V / (_| | | | (_| | __/ | | |
|_.__/|_|\__| \_/\_/ \__,_|_| \__,_|\___|_| |_|
Open source password management solutions
Copyright 2015-2023, 8bit Solutions LLC
https://bitwarden.com, https://github.com/bitwarden
===================================================
bitwarden.sh version 2023.7.2
Docker version 20.10.17, build 100c701
docker-compose version 1.28.6, build unknown
Bitwarden is up and running!
===================================================
visit https://192.168.10.10
to update, run `./bitwarden.sh updateself` and then `./bitwarden.sh update`
Step 4 - Access Bitwarden Web UI
At this point, Bitwarden is installed and running on your server. You can now access the Bitwarden web interface using the URL https://your-server-ip. You will see the account creation page:
Provide your email address and click on Create account. You will see the following screen.
Provide all the required information and click on Create Account. You will see the Bitwarden login screen.
Provide your username and click on Continue. You will see the following screen.
Provide your password and click on Login with a master password. You will see the Bitwarden dashboard on the following screen.
Conclusion
In this guide, we explained how to install the Bitwarden password manager using Docker on Fedora Linux. Now you can explore the Bitwarden features and use Bitwarden in your company to manage all credentials from the web-based interface. Try Bitwarden on dedicated server hosting from Atlantic.Net!
### Multi-Factor Authentication vs 2FA – What Is the Best Login Security?
When securing access to sensitive IT infrastructure, professionals must consider what authentication methods are going to be implemented to protect the data and content stored within.
Why Use Two-Factor or Multi-Factor Authentication?
With the prominent and growing concerns of cybercrime and internet security in the computing industry, a simple single-factor authentication process with a standard username and password to access online accounts, computers, servers or even banking services is insufficient.
To maintain security, it is essential that only approved users or authorized personnel are granted privileged access to IT solutions and services. Most organizations choose to implement a security standard that uses either Two-Factor Authentication (2FA) or Multi-Factor Authentication (MFA).
Both 2FA and MFA are secure authentication methods that share similar security techniques that require the user to prove their user identity; however, there are fundamental differences between them, and although you may not realize it, it is quite likely that you already use these authentication solutions in your day-to-day lives.
What Is Two-Factor Authentication (2FA)?
Two-factor authentication (2FA) is a security practice wherein access is granted to a user upon provision of two different authentication factors.
What Is an Authentication Factor?
An authentication factor is a type of security credential used to verify a specific user's identity before they are granted access to a system or place, typically something only they know (also called a knowledge factor, usually a password) with a security item they have (also called a possession factor).
This item is usually a physical device provided by an organization or 3rd parties, such as a mobile phone, a PKI security card, or an RSA Secure Token. These secured items often display a changeable code or PIN. The user must enter their Username and Password, as well as the PIN code to access or log in.
As most of the population carry smartphones, many organizations opt to send SMS text codes to users when either accessing secure sites and services or when conducting sensitive transactions, such as removing funds from digital financial services like PayPal or Skrill.
Applications have also been developed, like One-Time Password (OTP) Authentication, which generates a security key that only you and the provider share. Timed One-Time Password (TOTP) apps add a further level of security, as the PIN code or security key a TOTP generates will change at a predefined timed interval.
Two-factor authentication is extremely popular on the Internet and is used by organizations like Amazon and Google services like Gmail and YouTube.
Many business compliance standards, such as Healthcare HIPAA standards, or SOC1/SOC2/SOC3 SSAE, demand that at least two-factor authentication be implemented for the protection of sensitive data and transactions. This is because it is a much more difficult authentication method to compromise. Server-side authentication devices and those of the user need to be aligned, which makes security breaches unlikely.
What Is Multi-Factor Authentication (MFA)?
Multi-factor authentication (MFA) is a security practice like two-factor authentication but with an additional layer of complexity to secure login access. A user is required to provide three authentication factors - something only they know (again usually a password) with a security item they have (a possession factor) and something unique to the user (such as a fingerprint or retina scan - a biometric factor). In extremely secure environments, there may be even more than three authentication factors required to gain access.
MFA is a favored authentication method among Managed Service Providers (MSPs), as requiring multiple authentication factors offers significant protection to enterprise files and applications.
Besides verifying the identity of each user, the systems can diagnose the health of each multi-factor authentication device. By establishing the presence of vital security controls and checking for out-of-date software, multi-factor authentication can easily block high-risk or infected machines or devices.
What Is Single-Factor Authentication?
In single-factor authentication (SFA), only a single password needs to be compromised or cracked to gain unauthorized access.
There are password-cracking tools available online that can breach low-quality or common passwords in a matter of seconds.
In SFA, it is the user’s responsibility to ensure that a strong password is created, and IT infrastructure administrators cannot always guarantee an employee is not going to use low standards or share their simple passwords.
2FA vs MFA vs SFA: What Authentication Methods Are Best?
Multi-factor authentication (MFA) is generally more secure. Adding additional authentication factors will increase the security of the system and make it harder for unauthorized users to gain access, as each additional authentication factor requires users to provide additional proof of their user identity.
However, ease of use must be balanced with security in authentication practices. While strong security is a core concern in IT, it is important to consider the user and how security impacts the user. Not everyone is technically skilled and two-factor authentication and multi-factor authentication can create barriers within a system that less savvy users will have difficulty surmounting. Best practice should achieve a balance where the system is secure while not hindering the user experience.
Both two-factor authentication and multi-factor authentication are significantly more secure than single-factor authentication. Two-factor authentication and multi-factor authentication enforce additional layers of protection which the user must adhere to in order to gain appropriate system access. Warnings can be flagged if an incorrect part of the two-factor authentication or multi-factor authentication is entered, and often IT systems will email the user stating that a failed login attempt has been monitored.
Two-factor authentication and multi-factor authentication cannot be used in every scenario and are not a foolproof answer to a good password policy; for example, consider a scenario where a user has a mobile phone device that acts as a PIN code generator to access a system. If the user has no signal or if the mobile phone is in the repair shop, then the user will not get access because they do not have the ability to provide the appropriate authentication factor.
To counteract these problems, two-factor authentication and multi-factor authentication are often only required at first log-in or when accessing sensitive data from a new terminal. Once initial trust is established through the use of cookies, single-factor authentication is often acceptable for future use for a certain period of time.
For help with VPS hosting for your organization’s data, contact Atlantic.Net today!
### What Are the HIPAA Business Continuity and Disaster Recovery Requirements?
To comply with HIPAA, healthcare companies and their business associates must formulate a robust contingency plan in case of an event that disrupts operations.
These plans have smaller component plans such as a Disaster Recovery Plan (DRP) and an Emergency Mode Operation Plan, or Contingency Plan.
This business continuity strategy requires healthcare organizations to be capable of recovering critical IT systems that handle Electronic Patient Health Information (ePHI) into a disaster recovery location while ensuring critical business functions continue in the event of a crisis.
The aim of the emergency mode operation plan and disaster recovery plan is to establish the role, responsibilities, and procedures needed in a real-world disaster recovery scenario. Disaster recovery planning will typically define 5 key specifications.
The Data Backup Plan
Essentially, all ePHI must be identified and backed up using a HIPAA compliant backup solution. The data backup schedule should be pre-defined according to the organization’s specific needs, but might typically be a daily, monthly and annual backup policy.
A number of HIPAA security safeguards should be enforced in storing ePHI backup data, such as encryption at rest and encryption for transferred data. The data backup plan must also include controls over how backup data is accessed and by whom, especially when considering restoration of data.
The HIPAA Disaster Recovery Plan (DRP)
The HIPAA disaster recovery plan is a detailed set of processes and procedures that defines how a healthcare organization and the business associate responsible for IT services will respond to a disaster scenario. A HIPAA disaster recovery plan will typically aim to answer:
What Is a Disaster Recovery Scenario? - A typical disaster scenario will be when access to electronic protected health information (ePHI) data and systems is severely interrupted for some reason, such as a technical outage, human error, terrorism, or a natural disaster. A good example to consider: what would happen if your production data center were destroyed? How would the healthcare provider continue to operate, and how would the managed service provider (MSP) recover from such a disaster? Under HIPAA requirements, the MSP must empower the healthcare organization with the ability to failover production services to a secondary disparate location, restore critical IT systems and services, and restore the electronic protected health information to a specific point in time prior to the disaster.
When to Declare a Disaster Scenario - The healthcare organization and the IT service provider will have a business agreement that will stipulate when to declare a disaster. This could be from a certain timeframe since a system outage began, or the HIPAA disaster recovery plan might be invoked by approved personnel, usually a senior manager or executive. In most managed service companies, invoking DR is a manual process that must follow a strict authorization procedure.
How to Invoke Disaster Recovery - Healthcare personnel must be aware of how to invoke the HIPAA disaster recovery plan. For example, phoning the IT Provider and providing a pre-agreed security key to approve HIPAA disaster recovery plan activation. The MSP must also have a strategy of how to escalate to on-call technical experts or stakeholders. This is usually done through a DR Lead who is responsible for communications channels. This process may also involve moving technical personnel to a remote command center if the hosting site has been compromised.
Who to Contact and How Communication Flows During a DR Scenario – Modern MSPs have automated monitoring systems that automatically notify DR personnel; however, the names and contact numbers of key persons must be published within the HIPAA disaster recovery plan. Each personnel must know who they report too, and how communication flows in a disaster recovery scenario. This is usually done via a call tree.
Description of Key Roles and Responsibilities of Anyone Assigned to the Recovery Team – All DR personnel must understand their role and where they fall within the chain of command in a DR scenario, including network engineers, server engineers, and database engineers.
Define Recovery Time Objectives – The HIPAA disaster recovery plan will state the contracted RTO objectives. This refers to how long the healthcare organization can operate without critical IT systems and the time allowed for the MSP to be able to set up new IT infrastructure in a secondary location. This may be set to 24 hours, meaning the MSP has 24 hours to get the servers and infrastructure running in DR. With today’s modern cloud failover technologies, the RTO can be as low as near zero.
Define Recovery Point Objectives – The HIPAA disaster recovery plan will state the contracted RPO objectives, which show what point in the processing cycle an organization can recover to, or what point in time data can be restored to. For example, an RPO of 15 minutes means the data cannot be more than 15 minutes old.
The Emergency Mode Operation Plan
An emergency mode operation plan must also be pre-defined and practiced, ensuring HIPAA disaster recovery plan processes are achievable while keeping electronic protected health information secure.
The MSP will be responsible for ensuring that the correct technical and management teams are available during a HIPAA disaster recovery scenario and ultimately that they are responsible for restoring the service.
It is important that the MSP work with the healthcare organization so that HIPAA specifications of the emergency mode operation plan can be met:
How to Keep the Business Running in the Event of a Disaster – This will define what critical IT infrastructure is needed to keep the healthcare organization operating. Source machines requiring restoration to the cloud during a DR scenario will be identified (meaning any server containing ePHI). Priority must be allocated to HIPAA-compliant servers and systems that are business critical, such as Active Directory services, database systems, networking hardware, and backend storage with ePHI data.
Define What the Recovery Process is and Create a Definition of Required Activities – This will be a step-by-step process from the MSP outlining how they are going to restore services to ensure minimal disruption in line with RPO and RTO specifications, sometimes referred to as service blueprints. If the system is automated, it will form a recovery plan run book of how to bring the systems back online and in what order. HIPAA compliance rules stipulate that only authorized users can perform these processes and require that all ePHI data is protected.
Conduct Post DR Activities and Review Lessons Learned – Once services have been failed over and systems are running in DR, the MSP and healthcare organization must work together to test systems and access. Any issues experienced must be resolved or captured in a “lessons learned” meeting for future reference.
Testing and Revision Procedures
The testing and any subsequent revisions of the data backup plan, disaster recovery plan, and emergency mode operation plan are a highly recommended (although not mandatory) part of HIPAA compliance.
Essentially, the healthcare organization and MSP must test all of the above plans, as well as test the technical aspects of the failover and failback process, ensuring that the process works and that the system is capable of disaster recovery in a secondary site.
Annual DR tests are advised. If during testing and revision procedures changes to the plan are required, they should be enacted immediately after testing. Recommendations and changes should be discussed and implemented under change control to ensure future tests are successful.
Application and Data Criticality Analysis
Another non-mandatory recommendation for HIPAA compliance is to identify the systems that store and manage ePHI data and ensure priority is given to data backup and continuity planning - this is called application and data criticality analysis.
Most MSPs follow this recommendation, as it forms the basis of any automated failover strategy. The MSP needs to know what systems are classed as critical and which contain ePHI. That way, the best RPO can be delivered by restoring service to critical systems and restoring critical business processes as a priority.
To summarize, HIPAA Disaster Recovery and Business Continuity Planning are a significant part of HIPAA compliance. HIPAA compliance demands the MSP can transfer critical business systems containing ePHI into a disaster recovery location.
MSPs and healthcare organizations must not overlook the importance of HIPAA Disaster Recovery, and businesses need to comprehend what may happen to them if they fail to have a working DR strategy.
By choosing a HIPAA-compliant MSP, you can have peace of mind that these rigorous criteria have been met and exceeded.
### Do I Need a HIPAA-Compliant Cloud Backup?
Why is HIPAA Compliance Required for Cloud Backup?
If you’re in charge of data operations for a HIPAA-covered entity, you may have questions about your obligations regarding data backup and disaster recovery under HIPAA compliance. In this article, we’ll explore the HIPAA requirements for data backup so that your organization can be ready with a disaster recovery plan.
The Health Insurance Portability and Accountability Act of 1996 (HIPAA) and its subsequent amendments were enacted into law to protect patient healthcare data, also known as Protected Health Information (PHI); HIPAA protections also apply to Electronic Health Records (EHR) – PHI stored on computers. Managed service providers who maintain HIPAA compliance must adhere to several stringent regulations that are designed to limit the exposure of confidential or sensitive patient information from unauthorized access.
HIPAA's Backup Retention Requirements
There are two specific criteria that relate to data backups and data retention within HIPAA legislation. These are referred to as the Data Backup Plan and Retention Period. Each of these criteria contains several physical, technical and administrative safeguards which must be in place for an MSP to qualify as HIPAA compliant. These safeguards relate to what type of data is stored, how data is stored or transferred, and how long data is retained.
HIPAA-Compliant Cloud Backup Plan
HIPAA’s data backup plan criteria are essentially the rules on how a compliant MSP will back up healthcare data. The data backup plan is part of a wider contingency plan or HIPAA compliant disaster recovery strategy which will protect the healthcare organization’s data and infrastructure in the event of a major system failure or disaster situation.
HIPAA regulations require the managed service provider to implement a full backup schedule of the entire healthcare infrastructure containing patient data as well as any systems that handle any type of electronic protected health information (ePHI). Examples of such ePHI are patient details, diagnostic images, medical records, accounting information, or any other relevant healthcare documentation stored digitally.
The MSP or healthcare organization must back up data frequently (at least daily) and maintain weekly, monthly, and annual archives. All data is stored in a secured data center location on physical media (normally disk or tape). The HIPAA-compliant backup solution must be protected by encryption and offer the following safeguards:
Data Redundancy – Data should be securely stored in at least 2 disparate locations, and it is often recommended to have at least 3 copies of current data – for example, a copy for Production, UAT, and disaster recovery. This can be achieved by using automated site-to-site disk replication technologies such as a data domain or other disk-based solutions. A like-for-like encrypted copy of the production data will be copied from site A to site B.
Data Encryption – Any data stored in a digital format and hosted on HIPAA compliant infrastructure must be encrypted with a 256bit AES encryption standard and a two-factor authentication mechanism. This ensures that only the healthcare organization has access to electronic patient information, significantly reducing the risk of unauthorized access. Common devices for encryption include PKI secure cards and RSA tokens.
Data Transfers – Any data that is transmitted over public networks, such as using a VPN over an internet connection or network traffic from a backup node to a public cloud provider, must be encrypted with 256-bit AES and two-factor authentication. This method of encryption protects network traffic and makes it extremely difficult to intercept and decipher any usable information.
Data Restoration – The Managed Service Provider must be capable of restoring backup data to its original or a new location. This process of continuous data protection (CDP) must be regularly tested, usually by performing ad hoc test restoration, thus proving to auditors that the requirements of data integrity are met. A robust and reliable backup solution is essential to meet this requirement.
Data Monitoring - Backup services must be monitored to report backup failures or replication issues, and problems may require manual intervention to resolve, but the logging of incidents should be automated.
The protection of healthcare data must be the cornerstone of a HIPAA-compliant hosting service provider. Protected health information (PHI) must be stored and transmitted with the highest level of sensitivity and security. In addition to the requirements for a HIPAA-compliant data backup plan, managed service providers (MSPs) must also adhere to the following safeguards in order to protect backup data:
HIPAA Backup Physical Safeguards
Data Center Security – Data centers must be resilient, secure compounds manned 24x7x365 by security personnel. The data center must also be protected by access control measures so that only authorized users can enter the data center. It is also recommended that all service provider employees submit to security screening prior to employment.
Access Control - The service provider must enforce strict facility access controls and workstation security policies and actively manage device and media control systems (such as mobile phones and USB sticks).
User Account Control - Local and remote access to server infrastructure must be protected by a stringent security policy applied to user accounts and groups. Policies should be created to ensure access is restricted and only available on a need-to-know basis. This affects both administrators and standard users.
HIPAA Backup Infrastructure Safeguards
Infrastructure security - The disk arrays where patient information is kept or backed up, as well as the entire server infrastructure, must be protected with strict access control measures, including actively audited user account access to the protected infrastructure. Data should also be protected with complex security algorithms to safeguard data integrity.
Geofencing - Network-level geofencing allows or denies access to infrastructure based on the requesting IP address range. This safeguard protects against unauthorized access to patient data based on the user location and can stop data from going to any unauthorized external sources. Geolocation and tracking should be enabled to discover and report on any remote devices with access to ePHI (such as laptops) in case items are lost or stolen – most AV solutions provide this feature.
Tamperproof logging – The MSP must be able to create audit trails for users and administrators. These logs should not be editable by admins. This allows for sophisticated monitoring to detect trends and patterns of data and system usage.
HIPAA Backup Retention Period
The second required criterion is the HIPAA data retention period requirement, which refers to how long data must be kept in its digital format. Retention can be a difficult and often confusing subject, as there is no specific HIPAA rule for medical records retention. That is defined by US state law only. However, retention records for action, activity, or assessment are required by HIPAA.
How Long Should HIPAA Backups Be Retained?
The HIPAA Journal sums up the retention requirements well, stating that “HIPAA compliance stipulates the documents must be retained for a minimum of six years from when the document was created, or – in the event of a policy – from when it was last in effect. Therefore, if a policy is implemented for three years before being revised, a record of the original policy must be retained for a minimum of nine years after its creation.”
The HIPAA Journal and Linford & Co both suggest that the following types of electronic documents are covered by the six-year retention policy.
Risk Assessments and Risk Analyses
Disaster Recovery and Contingency Plans
Business Associate Agreements
Information Security and Privacy Policies
Incident and Breach Notification Documentation
Physical Security Maintenance Records
Logs Recording Access to and Updating of PHI
IT Security System Reviews (including new procedures or technologies implemented)
There is no definitive list, and we recommend that you work with your business associates to determine retention requirements.
Service providers must not only adhere to these retention rules but also provide adequate plans on how data will be destroyed after the retention period has passed. Some IT service providers’ policies may keep data permanently, either in decommissioned storage LUNs or locked in a fire-safe, but HIPAA demands compliance with how data is securely erased when the time comes, whether due to hardware error (such as a failed disk) or if the retention period passes. Typically, this would require the service provider to produce certified evidence that the data has been destroyed, which can be presented to auditors.
How Can You Achieve a HIPAA-Compliant Cloud Backup Solution?
The rapid growth of data, shrinking backup windows and budgets, scaling issues, and multiplatform environments currently in place in the healthcare industry all present significant challenges for server administrators. Atlantic.Net seeks to help. Through our powerful Server Backup Manager - a fast, affordable platform for both Linux and Windows - we perform backups either daily or in real-time for each of our HIPAA clients. Incremental backups are done at the block level for advanced speed, and clients have full control over when, where, and how their data is stored. Data is by default kept in our SSAE 16 Type II Orlando data center, secured through both on-site measures and by a suite of powerful and robust security software.
In addition to a host of customization options, our backup platform is also equipped with robust monitoring tools, portable backups, point-in-time snapshots, and the ability to perform a bare-metal restore at any point in time. We support backups for the majority of virtualized platforms, as well as a wide range of SQL servers and databases.
Ready to set up a HIPAA-compliant data backup solution? Contact Atlantic.Net today to learn how we can help!
### How to Check Linux CPU Usage or Utilization
Monitoring the performance of the CPU is an essential task for any system administrator who needs to measure the performance of a system. This will help you to debug system processes, manage system resources, and make system decisions. There are several tools available for checking CPU usage in Linux.
In this post, we will demonstrate a few methods to check and monitor CPU usage in Linux. NOTE: This article assumes that your base system is updated with the latest available packages.
1. Check CPU Usage with top Command
Top is a very useful command-line tool that helps you to monitor all running processes in real-time. It will display information about the readout of users, tasks, CPU load, and memory usage in real-time. By default, the top command updates the data every 5 seconds.
Now, let's start using the top command to monitor the CPU usage:
top
You should see the all running processes on the following screen:
Type P to sort all running processes by CPU usage. You should see the following screen:
Type M to sort all running processes by Memory usage. You should see the following screen:
Type I to hide all idle processes. You should see the following screen:
Type S to sort all processes by how long the processes have been running:
Type U to view all processes owned by a specific user. You should see the following screen:
2. Check CPU Usage with mpstat Command
Mpstat is a part of the sysstat package.
For Debian or Ubuntu operating systems, you can install it using the following command:
apt-get install sysstat -y
For CentOS or RHEL operating systems, you can install it using the following command:
yum install sysstat -y
Now, run the mpstat command without any options. This will display usage for each processor:
mpstat
Sample output:
Linux 4.4.0-148-generic (newpc) Monday 23 August 2021 _x86_64_ (4 CPU)
12:28:46 IST CPU %usr %nice %sys %iowait %irq %soft %steal %guest %gnice %idle
12:28:46 IST all 18.30 0.01 3.44 8.26 0.00 0.16 0.00 0.00 0.00 69.82
To display a report for the first processor, run:
mpstat -P 0
Sample output:
Linux 4.4.0-148-generic (newpc) Monday 23 August 2021 _x86_64_ (4 CPU)
12:29:35 IST CPU %usr %nice %sys %iowait %irq %soft %steal %guest %gnice %idle
12:29:35 IST 0 18.16 0.01 3.94 8.68 0.00 0.27 0.00 0.00 0.00 68.93
To display the report of all processors, run:
mpstat -P ALL
Sample output:
Linux 4.4.0-148-generic (newpc) Monday 23 August 2021 _x86_64_ (4 CPU)
12:45:50 IST CPU %usr %nice %sys %iowait %irq %soft %steal %guest %gnice %idle
12:45:50 IST all 16.38 0.01 3.11 7.33 0.00 0.15 0.00 0.00 0.00 73.02
12:45:50 IST 0 16.28 0.01 3.58 7.76 0.00 0.25 0.00 0.00 0.00 72.12
12:45:50 IST 1 16.25 0.01 3.06 7.10 0.00 0.05 0.00 0.00 0.00 73.52
12:45:50 IST 2 16.38 0.01 2.87 7.39 0.00 0.24 0.00 0.00 0.00 73.11
12:45:50 IST 3 16.60 0.01 2.93 7.07 0.00 0.06 0.00 0.00 0.00 73.34
To display average CPU usage for 3 times at 2-second intervals:
mpstat -P ALL 2 3
Sample output:
Linux 4.4.0-148-generic (newpc) Monday 23 August 2021 _x86_64_ (4 CPU)
12:47:58 IST CPU %usr %nice %sys %iowait %irq %soft %steal %guest %gnice %idle
12:48:00 IST all 23.30 0.00 4.99 4.74 0.00 0.00 0.00 0.00 0.00 66.97
12:48:00 IST 0 29.02 0.00 5.18 6.74 0.00 0.00 0.00 0.00 0.00 59.07
12:48:00 IST 1 26.53 0.00 6.12 4.59 0.00 0.51 0.00 0.00 0.00 62.24
12:48:00 IST 2 22.96 0.00 3.57 2.04 0.00 0.00 0.00 0.00 0.00 71.43
12:48:00 IST 3 14.14 0.00 5.05 5.56 0.00 0.00 0.00 0.00 0.00 75.25
12:48:00 IST CPU %usr %nice %sys %iowait %irq %soft %steal %guest %gnice %idle
12:48:02 IST all 21.58 0.00 5.87 5.11 0.00 0.13 0.00 0.00 0.00 67.31
12:48:02 IST 0 25.13 0.00 9.23 9.23 0.00 0.51 0.00 0.00 0.00 55.90
12:48:02 IST 1 28.72 0.00 7.18 8.21 0.00 0.00 0.00 0.00 0.00 55.90
12:48:02 IST 2 18.88 0.00 3.06 1.53 0.00 0.00 0.00 0.00 0.00 76.53
12:48:02 IST 3 13.85 0.00 4.10 1.03 0.00 0.00 0.00 0.00 0.00 81.03
12:48:02 IST CPU %usr %nice %sys %iowait %irq %soft %steal %guest %gnice %idle
12:48:04 IST all 24.78 0.00 5.11 5.87 0.00 0.13 0.00 0.00 0.00 64.11
12:48:04 IST 0 30.37 0.00 3.66 10.47 0.00 0.00 0.00 0.00 0.00 55.50
12:48:04 IST 1 27.78 0.00 6.06 9.09 0.00 0.00 0.00 0.00 0.00 57.07
12:48:04 IST 2 23.23 0.00 5.56 1.01 0.00 0.00 0.00 0.00 0.00 70.20
12:48:04 IST 3 17.86 0.00 5.10 3.57 0.00 0.51 0.00 0.00 0.00 72.96
Average: CPU %usr %nice %sys %iowait %irq %soft %steal %guest %gnice %idle
Average: all 23.22 0.00 5.33 5.24 0.00 0.09 0.00 0.00 0.00 66.13
Average: 0 28.15 0.00 6.04 8.81 0.00 0.17 0.00 0.00 0.00 56.82
Average: 1 27.67 0.00 6.45 7.30 0.00 0.17 0.00 0.00 0.00 58.40
Average: 2 21.69 0.00 4.07 1.53 0.00 0.00 0.00 0.00 0.00 72.71
Average: 3 15.28 0.00 4.75 3.40 0.00 0.17 0.00 0.00 0.00 76.40
3. Check CPU Usage with sar Command
The sar command is also used for collecting and reporting system activity information.
You can use the sar command with the -u option to track CPU performance. The following command will display CPU usage every 2 seconds.
sar -u 2
Sample output:
Linux 4.4.0-148-generic (newpc) Monday 23 August 2021 _x86_64_ (4 CPU)
12:53:26 IST CPU %user %nice %system %iowait %steal %idle
12:53:28 IST all 5.30 0.00 2.02 2.52 0.00 90.16
12:53:30 IST all 2.90 0.00 1.39 1.13 0.00 94.58
12:53:32 IST all 3.57 0.00 2.04 0.76 0.00 93.63
The above command will run indefinitely. You can stop it using CTRL+C.
4. Check CPU Usage with iostat Command
The iostat displays information on device utilization and the system’s average CPU utilization since the last reboot.
Run the iostat command without any option will display the information about CPU utilization, device utilization, and network file system utilization.
iostat
You should see the following output:
Linux 4.4.0-148-generic (newpc) Monday 23 August 2021 _x86_64_ (4 CPU)
avg-cpu: %user %nice %system %iowait %steal %idle
16.41 0.01 3.31 6.83 0.00 73.44
Device: tps kB_read/s kB_wrtn/s kB_read kB_wrtn
loop0 0.01 0.04 0.00 373 0
loop1 0.01 0.04 0.00 387 0
loop2 2.59 2.62 0.00 23279 0
loop3 0.00 0.01 0.00 116 0
loop4 0.01 0.02 0.00 143 0
loop5 28.67 28.70 0.00 255344 0
loop6 0.01 0.04 0.00 385 0
loop7 0.00 0.01 0.00 121 0
sda 34.36 383.67 600.72 3413776 5345096
Use the -c option to break the CPU utilization into user processes, system processes, I/O wait, and idle time.
iostat -c
Sample output:
Linux 4.4.0-148-generic (newpc) Monday 23 August 2021 _x86_64_ (4 CPU)
avg-cpu: %user %nice %system %iowait %steal %idle
16.40 0.01 3.31 6.82 0.00 73.46
5. Check CPU Usage with vmstat Command
The vmstat command will display the information about system processes, memory, swap, I/O, and CPU performance. It will display the average details since the last reboot.
Run the vmstat command without any options as shown below:
vmstat
Sample output:
procs -----------memory---------- ---swap-- -----io---- -system-- ------cpu-----
r b swpd free buff cache si so bi bo in cs us sy id wa st
3 1 1028672 130972 124344 1212276 19 71 101 150 341 818 17 3 73 7 0
The following command will update vmstat report every 2 seconds:
vmstat 2
Sample output:
procs -----------memory---------- ---swap-- -----io---- -system-- ------cpu-----
r b swpd free buff cache si so bi bo in cs us sy id wa st
2 1 1032572 233396 125196 1129256 19 70 100 149 345 830 17 3 73 7 0
2 0 1032572 232976 125212 1129596 0 0 0 112 3051 8697 40 10 42 8 0
0 1 1032572 233040 125224 1130468 0 0 0 1510 3109 8631 43 9 41 8 0
Press CTRL+C to close the vmstat.
Conclusion
In the above guide, we explained different methods to check CPU usage in Linux. These tools can help you to track processor usage and the performance of your system. Give it a try today on your VPS from Altantic.Net.
### Top 10 MFA Providers: How to Choose an MFA Provider
Multi-factor authentication plays a critical role in securing our digital identity. From online banking and paying bills to managing work and business accounts, remote storage accounts, and cloud services, MFA provides a secure way of protecting identity access and managing it according to industry standards.
What is MFA?
MFA is used throughout most people's daily lives; it is a proven security measure that requires the user to authenticate access to a specific service using two or more forms of identity. MFA typically requires two forms of identity, but it's not uncommon for more to be needed for super-sensitive data.
Either way, you need the following authentication factors:
Something You Know - typically a password or PIN
Something You Have - usually a unique security token on a smartphone, physical hardware token, or smart card
Something You Are - this relates to biometric factors, fingerprints, facial recognition, iris scans, etc.
MFA access requires entering your username and at least one of the security factors mentioned above. Often, you need to provide two-factor authentication, but how much depends on the provider's security conditional access policies.
What Is an MFA Provider?
An MFA provider is a specialist digital security provider that offers Multi-Factor Authentication solutions to enhance the security of digital systems and user accounts. They provide specific tools and technologies that require users to provide multiple forms of identification before accessing their accounts, websites, servers, or applications.
MFA solutions typically include methods such as SMS codes, biometric scans, and software or hardware tokens. By creating user-friendly and easy-to-manage solutions, MFA providers offer security as a service embedded into your IT infrastructure and consumed on demand.
An MFA solution is typically hosted in the cloud, but local installations are still popular despite requiring on-premise servers to access applications and websites. MFA providers aim to provide you with an easy-to-use, plug-and-play security solution.
Top 10 MFA Providers
Here are our top 10 MFA providers. These providers are those that focus primarily on MFA. There are other security products and authentication apps available that incorporate MFA into their offering; however, we have opted for those businesses where Multi-factor authentication (MFA) is a core component of the service or application.
#10: Ping Identity
Why Ping Identity Stands Out
Ping Identity is a popular identity and access management provider known for its MFA solutions. The main focus here is identity management. Its MFA solution is available as a consumable cloud service or as an on-premise deployment. It has a number of neat security features built in, such as adaptive authentication that alters the type of authentication challenges based on user the behavior, their location, or the device being used.
Who Can Benefit from Ping Identity
Ping Identity is suitable for almost any size business. It scales well and is very compatible. Ping Identity is a strong choice for organizations seeking a comprehensive and adaptable MFA solution as part of a broader identity management strategy. However, for those needing a simple and cost-effective MFA solution, there are better providers available, but Ping Identity is a good starting point.
Pros
Deep focus on identity and access management
Wide range of MFA solutions that work with various platforms and directory services
Adaptive authentication for a balance between security and convenience
Strong integrations with existing security tools
Cons
Can be complex to set up and manage compared to simpler MFA solutions
Can be costlier than some basic MFA providers
#9: IBM Security Verify
Why IBM Security Verify Stands Out
IBM Security Verify is a great business tool with some great AI-powered features, including the ability to analyze login attempts for high-risk factors and adapt authentication requirements for a more secure and dynamic approach. It works with cloud deployments and on-premise. It is highly compatible with IBM hardware and offers a wide range of authentication methods, including push notifications, fingerprint recognition, and one-time passcodes. This allows users to choose a convenient yet secure authentication method anywhere.
Who Can Benefit from IBM Security Verify
IBM Security Verify is great for small, medium, and large businesses. It has a number of unique compliance standards built in, so it's a great fit if your business requires regulatory compliance. The AI features are very reliable with good automation capabilities, and IBM has nailed the UI.
Pros
AI-powered risk assessment for enhanced security
Supports hybrid cloud environments for flexible deployment
User-friendly with various authentication methods
Compliance-oriented features
Cons
May be complex to set up and manage compared to simpler MFA solutions
The cost might be a factor compared to some basic MFA providers
#8: LastPass
Why LastPass Stands Out
LastPass is famous for creating an industry-leading password management tool called LastPass. Their MFA tool is integrated into the password management tool and enables and integrates passwordless authentication. It's a very easy-to-use product, and the MFA tools are very convenient because users can access both password management and MFA through a single platform, which greatly simplifies the login processes. LastPass is available with a free tier, making it an attractive option for individuals or budget-conscious organizations.
Who Can Benefit from LastPass
LastPass targets the consumer market, startups, and smaller businesses. Its monthly fees are very reasonably priced, but it lacks many of its competitors' key features. For smaller businesses seeking a cost-effective way to add multi-factor authentication to their security posture, LastPass can be a good starting point.
Pros
Convenient integration with password management
Free tier available for basic MFA functionality
User-friendly interface available as a web app or locally installed application
Cons
Limited Features compared to dedicated MFA providers
There have been some past security incidents involving LastPass, which may raise concerns for some users.
LastPass does not cater to the complex needs of larger organizations with stricter security requirements.
#7: Authy
Why Authy Stands Out
Authy is a very popular choice in the DevOps sector. It offers mobile apps for various platforms, allowing users to gain access to their MFA tokens on various devices. Best of all, you can sync across numerous devices, so you are not tied to a single mobile phone or laptop. Authy offers a free tier with unlimited devices, making it an attractive option for personal use or small teams.
Who Can Benefit from Authy
Authy targets individual users, startups, and small businesses. It's popular because it offers a fully featured free tier, a user-friendly interface, and no annoying security questions. The mobile app is simple to use and responsive and works on Android and iOS. Authy's combination of accessibility, simplicity, and versatility makes it an ideal choice for individuals seeking reliable authentication solutions.
Pros
Free tier for personal use
Cross-platform accessibility with mobile apps for various devices
Multi-device sync for redundancy and convenience
User-friendly interface
Cons
Limited Features for Businesses such as advanced security options or administrative controls.
Some have questioned Authy's reliance on SMS verification, a method potentially vulnerable to SIM-swapping attacks.
Authy's core functionalities might not cater to the stricter compliance requirements or complex needs of large enterprises.
#6: AuthO
Why AuthO Stands Out
Auth0 provides a comprehensive suite of tools for user authentication, authorization, and access to modern identity management. The MFA provider features streamline identity management for organizations and provide a more consistent user experience. Developers love AuthO, which has really powerful API integration. It offers lots of customization out of the box for authentication workflows that can be adapted to your own security policies.
Who Can Benefit from Auth0
Auth0 is great for growing businesses like startups and for organizations with in-house development teams; Auth0's developer-friendly tools can simplify the integration of MFA into existing applications. Businesses with a growing workforce or complex security requirements can benefit from Auth0's scalability and customization options.
Pros
Comprehensive IAM platform with MFA as a core feature
Developer-friendly tools for easy integration
Scalable and customizable to fit your needs
Cons
Cost! Auth0 is an expensive solution, especially for organizations only needing basic MFA functionality.
Setting up and managing a comprehensive IAM platform can be more complex than implementing a basic MFA solution.
#5: Google Authenticator
Why Google Authenticator Stands Out
Google Authenticator is one of my personal favorite MFA tools. Its major selling point is its simplicity, its ease of installation, the app's ease of use, and, of course, it just works. You get 2FA and Time-based one-time passwordless authentication out of the box - and it works offline. It's highly compatible and works on servers and in the cloud. Best of all, it's completely free.
Who Can Benefit from Google Authenticator
Google has targeted the authenticator at absolutely everyone: anyone who uses online accounts with sensitive information (banking, email, social media) and who prioritizes online security and wants an additional verification step.
Pros
Makes your accounts more secure by adding an extra layer of protection.
Works even without internet access.
Compatible with many online services.
Free and easy to use.
Cons
Losing your phone can cause problems if you don't have backups.
Requires an extra step to log in compared to just a password.
Lacks some advanced features of other authenticator apps.
#4: Microsoft Entra ID (AzureAD)
Why Microsoft Entra ID Stands Out
I've never understood Microsoft's fascination with renaming their products. Most likely know this product as Azure AD, a cloud-based authentication service for managing user access and identities. It works at a global scale and provides access to various Microsoft Services like Microsoft 365 (Microsoft Office), the Azure cloud console, and, of course, Active Directory resources. It also works seamlessly with 3rd Parties; for example, I can log into numerous cloud apps using Entra ID. It offers multi-factor authentication, conditional access, and identity protection.
Who Can Benefit from Microsoft Entra
Azure AD [sorry], Entra ID is suitable for businesses of all sizes with features for on-premises and cloud environments. It's the perfect fit for businesses using Microsoft cloud services (Office 365, Azure) that need centralized user access identity management features; it works on-premise with other cloud providers and is superb at hybrid setups (perhaps you have on-prem Active Directory). If you are planning on migrating to the cloud, EntraID has lots of really useful tools to get you into the Microsoft cloud ecosystem.
Pros
Centralized management: simplifies user access control across multiple services.
Enhanced security: offers robust security features to prevent unauthorized access.
Scalability: adapts to businesses of various sizes and needs.
Flexibility: works with cloud and on-premises environments.
Cons
Complexity: setting up advanced features might require technical expertise.
Microsoft-centric: primarily focused on managing access to Microsoft services.
#3: Cisco Secure Access by Duo
Why Cisco Secure Access Stands Out
Cisco Secure Access by Duo is a cloud-based security solution that focuses on two-factor authentication (2FA) and access control. It's built upon the zero-trust approach; that is, every login attempt forces verification. The 2FA is one of the best in the industry and offers various authentication methods beyond passwords, like push notifications and security keys.
Who Can Benefit from Cisco Secure Access
Cisco's target Duo is small, medium, and large businesses, but it is mostly used by enterprise-size business users. It's a great tool for securing an entire business's online activity and is vital to protecting against data breaches and unauthorized access.
Pros
Enhanced security: zero-trust approach and strong 2FA minimize unauthorized access.
Improved remote access: secures access for remote workers from any device.
Device visibility: provides insights into device health for better security posture.
Simple user experience: user-friendly authentication methods like push notifications.
Cons
Cost: requires a subscription for the service.
Potential Integration Challenges: may require additional configuration for some applications.
Management Complexity: managing access policies for various users and devices might require training.
#2: RSA SecureID Access
Why RSA Secure Access Stands Out
At number two is RSA Secure ID Access, a cloud-based multi-factor authentication (MFA) solution designed to secure user access to applications and resources. RSA was one of the first providers to offer MFA and the first to widely use hardware security tokens for its users. It features risk-based authentication and adaptive authentication that changes authentication policies based on the user's behavior. RSA supports various MFA methods like software tokens, hardware tokens, and biometrics.
Who Can Benefit from RSA Secure Access
RSA Secure ID offers industry-leading protection for organizations that need tough security measures in place. Businesses that are heavily regulated will benefit from the protections on offer. The initial configuration is complicated and requires thought and consideration, but it simplifies the login process while maintaining strong security.
Pros
Intelligent security: tailored authentication based on risk level for optimal security.
Flexible authentication: offers multiple MFA options to suit user preferences.
Easy to use: streamlines the login process for a positive user experience.
Cons
Cost: requires a subscription for the service.
Potential integration complexity: may require configuration for specific applications.
Management overhead: managing user access policies and authentication methods might require training.
#1: Okta
Why Okta Stands Out
At number one is Okta, a cloud-based platform for managing user access and identities across various applications and services. Okta uses a simple-to-use, single sign-on process combined with MFA to give access to practically any application you want. Users are granted access via a control panel using group permissions; once configured, you simply assign the user to the group, and Okta then handles the automated onboarding of the user. It's such a seamless process that users love the simplicity, and administrators have a much easier task of managing new starter accounts.
Who Can Benefit from Okta
Okta is suitable for almost all businesses, but it's a great fit for medium-sized and start-ups. Businesses needing to move fast and grow quickly. If you have a diverse application set, Okta makes the whole process of authorizing access to applications simple, and it absolutely improves the user experience.
Pros
Streamlined access: SSO simplifies logins for users and reduces password management burden.
Centralized control: manages user identities and access from one location.
Robust security: offers various features to prevent unauthorized access and data breaches.
Improved user experience: reduces login hassles and allows easy access to authorized applications.
Cons
Cost: requires a subscription with pricing based on features and user count.
Complexity: setting up advanced features might require technical expertise.
Learning curve: users may need some training to adapt to new authentication methods.
Atantic.Net Multi-Factor Authentication Managed Services
Password security is a vital layer of defense in every network. Complex passwords are now standard, and Atlantic.Net's Multi-Factor Authentication service adds further protection to ensure your environment is hardened against external threats.
Our multi-factor authentication service feature integrates with most on-premise and cloud apps, such as Office 365, Salesforce, Box, Dropbox, Google, Slack, and DocuSign. Export our SDK to project management apps, including Confluence, Jira, Splunk, and Drupal, and client libraries, such as Python, Ruby, Classic ASP, and Java, to further safeguard your information.
MFA adds an extra layer of security by requiring multiple forms of validated authentication, making it more challenging for unauthorized users to break in. This service protects your sensitive information and systems behind numerous security checkpoints.
Want to know more? Contact our customer support team for more information.
### Top 10 Cloud VoIP Providers
Voice Over Internet Protocol, or VoIP, is a technology that lets you make phone calls over an internet connection instead of relying on a traditional phone system or landlines. VoIP is compatible with numerous devices, such as computers, laptops, smartphones, desk phones, and dedicated VoIP Phones.
VoIP introduces substantial cost savings for businesses and offers many new features, such as voice conferencing, video conferencing, voicemail, auto-attendants, transcription, and more.
In this top 10, we will introduce you to our favorite VoIP providers in the United States and explain why we like them. Then, it's up to you to see which fits your needs. Remember to consider your budget carefully and understand the features you need from a VoIP provider.
#10: RingCentral
Why RingCentral Stands Out
RingCentral is a unified communications provider that offers features beyond making VoIP calls. For about $20 per user per month, you get unlimited calling, SMS, MMS, Interact Voice Response (IVR), voice mail, and more.
Premium subscriptions give you access to a whiteboard, phone system insights, call recording, call center features, unlimited calls, video conferencing, unlimited cloud storage for voice and video calls, transcripts, etc.
Who Can Benefit from RingCentral
RingCentral is a global business VoIP service provider with plans suitable for businesses of all sizes and home users. Its cloud-based phone service is also ideal for a remote workforce. To install the RingCentral App, you only need a laptop or smartphone (plus a reliable internet connection).
Pros
Integrates voice calls, video conferencing, chat, faxing, voicemail
Plans for businesses of all sizes, easy to add/remove users
User-friendly interface and mobile app
Uptime guarantees, robust security features
International calling, local phone numbers in various countries
Cons
May require additional costs for advanced features
The free plan has limited features
Advanced features have a learning curve
Premium subscription is expensive
Focuses on business users, less suitable for individuals/small teams
#9: Vonage
Why Vonage Stands Out
Vonage is a budget-friendly VoIP phone service provider that offers a range of services, from basic call-only options to feature-packed premium options. Vonage also has some excellent international calling plans, which are perfect for calling overseas. Vonage users enjoy a user-friendly interface with unlimited calling plans, auto attendant, call recording, and a fully featured Vonage mobile app.
Who Can Benefit from Vonage
Vonage is ideal for businesses on a budget, startups, and those looking to streamline business communications costs. If you have a traveling workforce, Vonage features fantastic mobile integration. It allows users to make and receive calls, manage voicemail, and access other features from anywhere with an internet connection. This can be a significant benefit for companies with employees who work remotely or travel frequently.
Pros
Easy to use and manage
Reliable call quality
Feature-rich, including unlimited calling and texting
User-friendly mobile app
Scalable for businesses of all sizes
Uptime guarantee
Cons
Can be expensive compared to some competitors
Limited flexibility in plan options (e.g., contracts, month-to-month)
Customer service may not be readily available (chat only)
App functionality issues reported by some users
#8: Mitel MiCloud
Why Mitel MiCloud Stands Out
Mitel MiCloud is known for its scalability and ability to be customized to fit the needs of businesses of all sizes. It comes with loads of features, including video conferencing, call recording, voicemail transcription, and integrations with various CRM and business productivity tools. Mitel MiCloud prioritizes security and reliability, making it a good choice for businesses that handle sensitive information.
Who Can Benefit from Mite MiCloud
Mitel targets medium—and large-sized businesses that need a feature-rich business communications platform. It works great with call centers because it features detailed call routing and workflow configuration. Data can also be kept on-premise if you have enhanced compliance needs.
Pros
Ease of use
Call quality
Customer support
Scalability
Features
Cons
Cost
Limited integrations (depending on specific needs)
Complexity (for some features)
#7: DialPad
Why DialPad Stands Out
Dialpad has several innovative features that focus on artificial intelligence (AI), like real-time transcription, call analytics with sentiment detection (agent evaluation), and AI-powered voicemail summaries. It is user-friendly and easy to use, plus DialPad can integrate with Salesforce, Zendesk, Asana, Trello, and much more.
Who Can Benefit from DialPad
Businesses interested in using AI to improve communication efficiency and gain insights from your incoming calls will like DialPad. It is also highly versatile for service-driving teams; features like call recording, transcription, and analytics can be beneficial to customer relationship management.
Pros
Cloud-based and mobile friendly
User-friendly interface
Call quality and reliability
Integrations (with many popular business tools)
Advanced features (like call recording and transcription)
Cons
Cost may be expensive for small businesses
Limited free trial options no longer offers a free tier
Learning curve for some advanced features
Customer support has had some questionable reviews
#6: Zoom Phone
Why Zoom Phone Stands Out
Zoom Phone positions itself as a cloud phone system, an extension of the familiar Zoom meeting experience. It offers a cloud-based phone system that integrates seamlessly with Zoom. They target businesses of all sizes and offer great scalability, allowing you to scale your business phone system as your needs grow. It boasts an extensive global network, with enabled features like international calling and local business phone numbers.
Who Can Benefit from Zoom Phone
Zoom gained a lot of popularity during the COVID-19 pandemic, and as a result, many people are already familiar with the user interface of Zoom products. Zoom Phone's cloud-based features and mobile phone app make it ideal for businesses with remote or mobile workforces, allowing them to stay connected and make calls from anywhere.
Pros
Affordability with competitive pricing, especially for basic plans
Integration with Zoom meetings
User-friendly interface
Strong audio and video quality
Suitable for small and growing businesses
Cons
Limited collaboration features, such as no document sharing or task management
Fewer customer support options compared to some competitors
#5: OnSip
Why OnSip Stands Out
OnSip caters to a niche within the VoIP market that prioritizes simplicity, affordability, and ease of use. But you also get a massive list of features, including voicemail to email, auto attendants, call recording, blocking, music on hold, call monitoring and management, and call center queue features. OnSIP offers flexible pay-as-you-go options and unlimited calling plans, allowing you to avoid long-term commitments and adjust your service based on usage.
Who Can Benefit from OnSip
With its focus on simplicity, affordability, and scalability, OnSIP can be a good fit for small businesses and startups. Compared to some of the more prominent players, it may lack some of the more advanced features; however, it's very affordable. If you have a technical team, you can keep the cost even lower by self-hosting an open-source version of the VoIP phone system.
Pros
Customization
Reliability
Customer support
Pay-as-you-go business phone system
Ease of Use
Cons
Technical knowledge needed
Mobile app
Pricing complexity
Limited Integrations
#4: Cisco UCM
Why Cisco UCM Stands Out
Cisco UCM (Unified Communications Manager) is an enterprise VoIP platform that focuses on enhanced features, security, and reliability, including voicemail, auto attendant, call recording, video and audio conferencing, and various business tools. The UCM suite caters to the complex communication needs of large organizations. It's a dependable business communications system featuring strong security protocols and enhanced encryption standards. It accommodates a large number of users and can be customized to fit specific workflows and communication requirements.
Who Can Benefit from Cisco UCM
With its extensive features, scalability, and robust security, Cisco UCM is well-suited for large organizations with intricate communication needs, a focus on information security, and strict data privacy regulations. If you can afford the expensive licensing costs and have the technical skills to implement and manage the solution, you will get one of the very best VoIP phone services available that can scale to over 75,000 users.
Pros
Scalability
Feature-rich
Integration with Cisco ecosystem
Voice quality
Reliability
Cons
Cost
Complexity
On-premises deployment
Remote work limitations
Licensing complexity
#3:Grasshopper
Why Grasshopper Stands Out
Grasshopper is known for its intuitive interface and straightforward setup process. This makes it ideal for small businesses or those that don't require a complex communication system with many features. Grasshopper offers a good mobile app that allows users to make and receive calls, manage voicemail, and access extra smartphone features.
Grasshopper generally falls on the budget-friendly end of the business VoIP services spectrum, making it an attractive option for cost-conscious businesses. They offer various plans with features tailored to small business needs.
Who Can Benefit from Grasshopper
Grasshopper's easy setup, user-friendly interface, and focus on core functionalities make it ideal for smaller companies that are new to VoIP services and don't require a complex system with extensive features.
Pros
Ease of use
Affordability
Mobile friendly
Multiple phone number options
Professional features like greetings and call forwarding
Cons
Limited features compared to some competitors
No video conferencing
Scalability limitations may not be ideal for large teams
Customer support has mixed reviews
#2: Nextiva
Why Nextiva Stands Out
Number 2 is Nextiva, a well-rounded option that stands out in the VoIP market with a potent combination of features, user-friendliness, and customer service. It features unlimited calling, cloud-native connectivity, team messaging, free faxing service, voicemail, call routing, call analytics (reporting), and robust security built in.
It's a unified communications platform that integrates various features, such as cloud phone service, video conferencing, team messaging, and customer relationship management (CRM) tools. Nextiva is known for its user-friendly interface and straightforward setup process. They prioritize customer satisfaction and boast "Amazing Service" as a core part of their brand identity. They offer 24/7 customer support to assist you with any questions or issues.
Who Can Benefit from Nextiva
Nextiva's scalability and range of features make it suitable for small businesses, startups, and even mid-sized organizations. If you want a platform that integrates various communication channels and features, Nextiva can streamline your workflows and centralize communication data. While pricing might be slightly higher than some competitors, particularly for the most feature-rich plans, you still get a comprehensive suite of VoIP services, tools, and utilities.
Pros
Cost-effective, potentially lower per-user cost for larger teams
Unlimited domestic calling
Feature rich
User-friendly interface
Excellent customer service
Cons
Pricing tiers
Limited reporting features in basic plans
Potential scalability issues have been reported by some users
#1: 8x8
Why 8x8 Stands Out
Our number one pick is cloud-based VoIP service 8x8. They offer a comprehensive solution for VoIP business phone systems with a global reach. Featuring an uptime SLA of 99.999%, 8x8 is a reliable VoIP platform with extensive contact center features like Intelligent Customer Assistant, call recording, call routing, and agent/supervisor workspaces. You get a business phone, video conferencing, team chat, integration with teams, and a virtual front desk.
8x8 also boasts excellent security and compliance features built to OWASP security standards. Its global network enables features like international calling, local phone numbers in various countries, and potentially improved call quality for geographically dispersed teams.
Who Can Benefit from 8x8
8x8 provides a solid and reliable platform that integrates various communication channels and functionalities that improve centralized communication and collaboration. Each scalable plan is suitable for small businesses, startups, and even large enterprises. The platform is cloud-native and boasts real global reach; this is a major benefit for teams with remote workforces or those with business locations in different global regions. For all of these leading features, it's no surprise that 8x8 is not cheap, however, they offer best-in-class features and service which makes them great value for money.
Pros
A complete unified business communications package
Scalability with flexible plans
Reliability, known for great uptime and clear call quality
Strong security features
Offers competitive pricing with various plans.
Cons
The interface may require some familiarization with advanced features.
May not integrate with all desired business tools.
Some reviews mention inconsistency in customer support experiences.
That's our Top 10 best voice over internet protocol phone service and system providers for 2024. If you are still unsure which to choose you may be interested to know that you can also go down the self-hosting route. You can even combine some of the services above with our hosting options. It requires a bit more technical know-how, but Atlantic.Net has support available 24/7, and archives of detailed procedures that will show you how to create your very own VoIP service hosted on Atlantic.Net servers.
Want to find out more?
Atlantic.Net's Open-Source VoIP Solutions
It's easy to set up a VoIP Phone System on Atlantic.Net servers. Ditch traditional phone systems and upgrade your business phone system to the latest VoIP service.
Infrastructure Setup:
Start by setting up a virtual server on Atlantic.Net's cloud platform. Our user-friendly interface and extensive documentation simplify the process. Choose a server configuration that suits your business size and expected call volume.
Installation of VoIP Software:
Once your server is up, install your preferred open-source VoIP software, such as Asterisk or FreeSWITCH. Atlantic.Net supports various operating systems, ensuring compatibility with most other modern VoIP systems and solutions. While Linux is commonly chosen, you can find telephony software for almost every OS. Check out our blog for our favorite cloud-based phone system.
Configuration:
After installation, customize the VoIP phone system software to meet your business requirements. This involves setting up multiple phone numbers, extensions, voicemail, call routing, and other necessary features. Refer to the software documentation for guidance, and grab a coffee as you dive into the setup process.
Security Measures:
Atlantic.Net's virtual private servers boast top-notch security features. Utilize the built-in firewall services to safeguard your VoIP setup. Schedule regular backups to maintain data integrity and availability.
Integration and Testing:
Once configured, integrate the VoIP phone system with your other business tools. Conduct thorough testing to ensure excellent call quality, stable connections, and seamless functionality of integrated features.
Maintenance:
Use Atlantic.Net's monitoring tools to monitor server health, usage statistics, and potential threats. Also, update your VoIP software regularly and monitor the system for optimal performance.
Build Your VoIP Phone System with Atlantic.Net
Traditional phones (analog phones) fall short of today's standards. With the surge in remote work, businesses still need reliable cloud phone systems for seamless call handling and integration with desktop and mobile devices; having a robust VoIP phone system is indispensable.
Why settle for less when Atlantic.Net offers top-tier VoIP hosting services? Ensure your business phone system is efficient and HIPAA-compliant with our solutions. Benefit from unlimited calling, crystal-clear call recording, and the flexibility to receive calls on your computer or mobile device, and desktop apps.
Ditch your traditional phone systems and embrace the future with access to the best VoIP service providers. Whether you choose to integrate with Microsoft Teams, leverage session initiation protocol, or seek the very best business cloud VoIP services and hosting, Atlantic.Net has you covered.
Our VoIP technology extends beyond calls, offering advanced features like virtual fax, internet protocol-based communications, and seamless integration with your existing broadband internet connection.
Discover the Best CLOUD VOIP Services with Atlantic.Net Now!
### Vendor Management for HIPAA Business Associates
What Are HIPAA Business Associates?
HIPAA business associates are entities or individuals that perform functions or activities involving the use or disclosure of protected health information (PHI) on behalf of a HIPAA covered entity. This could include data analysis, processing or administration of claims, patient safety activities, and more. It is important to note that a business associate is not an employee of the covered entity but an independent contractor.
HIPAA business associates play an important role in the healthcare industry. They provide essential services to healthcare organizations and providers and are responsible for ensuring that the PHI is protected according to HIPAA regulations. It's a daunting task, but vital to maintain trust and security of patients and healthcare providers alike.
Understanding HIPAA Requirements for Business Associates
Business Associate Agreement (BAA) Requirements
A business associate agreement (BAA) is a legally binding document between a HIPAA covered entity and a business associate. It outlines the responsibilities of the business associate in regard to the handling and protection of PHI. In essence, it serves as a contract, stipulating the terms and conditions under which the business associate can access and use PHI.
The BAA is vital to maintaining compliance with HIPAA regulations. It outlines the rights and responsibilities of the business associate and provides a means for the covered entity to ensure that the business associate is upholding its end of the bargain. In other words, it's a way for covered entities to hold their business associates accountable for their actions.
The BAA should typically include provisions for how the business associate will use and disclose PHI, what safeguards they will implement to protect the data, as well as what they will do in the event of a data breach. It should also stipulate the terms for termination of the agreement. Getting this document right is crucial, as it forms the basis of your compliance with HIPAA regulations.
Importance of Compliance with HIPAA Regulations
Compliance with HIPAA regulations is not just a legal requirement but a fundamental aspect of doing business in the healthcare industry. The privacy and security of patient data is a top priority, and failure to uphold these standards can have severe consequences. This includes hefty fines, potential lawsuits, and damage to your business's reputation.
The Office for Civil Rights (OCR), which enforces HIPAA, has been known to issue fines reaching into the millions of dollars for violations. These can occur due to breaches but also from non-compliance with the administrative, physical, and technical safeguards outlined in the HIPAA Security Rule. Therefore, it's critical to ensure that your business is fully compliant with all aspects of HIPAA.
Moreover, compliance is not a one-time event but an ongoing process. This means regularly reviewing and updating your policies and procedures, training your employees, and conducting periodic audits to ensure your safeguards are effective. Remember, protecting the privacy and security of patient data is not just about avoiding penalties but about maintaining the trust of your clients and the individuals whose data you handle.
Vendor Selection Process for HIPAA Business Associates
Identifying Vendor Requirements
The first step in the vendor selection process is to identify your specific needs and requirements. This could include the types of services you require, the volume of data you need to handle, and any specific security or compliance requirements you have. This will help you narrow your options and focus on vendors that meet your specific needs.
Consider the vendor's reputation and track record concerning data security. Have they had any data breaches in the past? What do their current and former clients say about them? This information can provide valuable insights into the risks of using them as a HIPAA Business Associate.
Conducting Due Diligence
Once you have identified your requirements, the next step is to conduct due diligence on potential vendors. This involves researching each vendor thoroughly, checking their references, and interviewing them to understand their capabilities and reliability.
You should also review their compliance documentation, such as HIPAA risk assessment, policies and procedures, and training materials. This can help you understand how they approach compliance and whether they have the necessary safeguards to protect your data.
Moreover, consider conducting an on-site visit if possible. This will allow you to see firsthand how the vendor operates and to verify that they are following their stated policies and procedures.
Vendor Selection Criteria
Once you have conducted your due diligence, the final step is to select a vendor. This decision should be based on various factors, including their ability to meet your specific requirements, their commitment to compliance, and their track record of reliability and security.
One of the most important criteria is the vendor's understanding of and commitment to HIPAA compliance. Do they have a robust compliance program in place? Do they provide regular training to their employees? Do they conduct periodic audits to ensure compliance?
Another critical factor is the vendor's technical capabilities. Can they handle the volume of data you need to process? Do they have robust security measures in place to protect your data? Do they offer the specific services you require?
Establishing Vendor Management Policies and Procedures
Vendor Management Framework
For large organizations working with numerous HIPAA Business Associates, it can be beneficial to implement a vendor management framework. This structure forms the backbone of the strategic planning, execution, and management of all vendor relationships. A well-defined vendor management framework enhances operational efficiency and ensures regulatory compliance. A vendor management system is a technology solution often used to implement and manage vendor management frameworks.
The framework should include a clear outline of the roles and responsibilities of all parties involved. It should also define vendor selection, management, and evaluation processes. It's critical to ensure the framework is flexible enough to accommodate changes in the business environment or regulatory landscape.
Moreover, the framework should provide measures for managing and mitigating risks associated with vendor relationships.
Documentation and Record-Keeping Requirements
The HIPAA Privacy Rule mandates creating and maintaining written privacy policies and procedures, along with employee training records. These documents serve as evidence of the organization's efforts to comply with the law.
In this respect, it is vital to maintain records of all vendor contracts, agreements, and correspondences. These documents should detail the scope of services provided, the responsibilities of each party, and the terms of the business relationship.
Additionally, records of all risk assessments, incident response activities, and audit findings should be meticulously maintained.
Risk Assessment and Mitigation Strategies
Risk assessment is a critical process that identifies potential threats to the confidentiality, integrity, and availability of protected health information (PHI). It's a systematic process that involves identifying potential threats, assessing their impact, and developing mitigation strategies.
As part of HIPAA risk assessments, organizations should consider their third-party vendors, including but not limited to HIPAA Business Associates. Even after carefully vetting Business Associates, it is essential to consider the chance that a data breach or security failure at one of these vendors will negatively impact the organization.
Incident Response and Breach Notification Procedures
Despite the best efforts and safeguards, incidents can occur. Therefore, it's crucial to have well-defined incident response and breach notification procedures in place. The incident response process must consider incidents that involve, or originate from, HIPAA Business Associates.
The incident response process should include steps for identifying, containing, and eliminating the threat. It should also detail the procedures for assessing the impact of the breach and notifying the affected parties. The HIPAA Breach Notification Rule requires covered entities to notify individuals affected by a breach of their unsecured PHI, the Secretary of Health and Human Services (HHS), and, in some cases, the media.
Vendor Performance Monitoring and Auditing
Finally, it is vital to monitor and audit the performance of vendors regularly. This process involves evaluating the vendor's compliance with the agreed-upon terms and conditions, their performance against set benchmarks, and their adherence to the regulatory requirements.
Vendor audits can either be conducted internally or by third-party auditors. Regardless of who performs the audit, the process should be thorough, unbiased, and transparent. The findings of the audit should be documented, and necessary corrective measures should be implemented promptly.
Conclusion
Implementing a comprehensive vendor management program in the healthcare industry can be complex and challenging. However, with a well-defined framework, meticulous record-keeping, effective risk assessment, and mitigation strategies, robust incident response and breach notification procedures, and regular vendor performance monitoring and auditing, you can ensure your organization is compliant and mitigate vendor-related compliance risks.
### What Is Code Documentation and How It Will Affect Your Next Compliance Audit?
In software development, transparency and compliance have become integral to the process. One of the key factors facilitating these qualities is code documentation—the practice of writing explanatory comments, notes, and methodology descriptions accompanying computer code.
This article explores the concept of code documentation, its importance, and how it can impact the outcome of your next compliance audit. We will explore the different types of compliance audits prevalent in software development projects and the role code documentation plays in each.
By understanding and implementing effective code documentation strategies, software developers and organizations can enhance their software quality and ensure they are well-prepared for any compliance requirements that affect their organization.
What Is Code Documentation?
Code Documentation is the written text, notes, or comments that go hand in hand with computer code. It is intended to clarify the "what," "how," and "why" of the code for future reference. The aim is to make the code understandable for the other developers and your future self who may work on the same project later.
Code Documentation is not merely about commenting on every line or function in your code. It's about providing high-level context and explaining why certain decisions were made during development. It also serves as a guide for developers to understand the flow of the system or software.
Without proper documentation, even the most beautifully written code can become obscure. It can lead to confusion, increased development time, and ultimately, degradation of the code quality. Get more background on code documentation in this detailed blog post.
Types of Compliance Audits in Software Development
Compliance audits are becoming crucial to software development, especially in regulated industries. They ensure that the software and the development process meet specific standards and regulations. Compliance audits in software development can be broadly classified into two categories: internal and external audits.
Internal Audits
The organization's own audit team conducts internal audits. The aim is to evaluate the organization's internal controls' effectiveness and identify improvement areas. For example, an internal audit might focus on the software development process to ensure that the developers follow the organization's best practices and standards.
Internal audits also assess the quality of the code and the documentation. They check if the code is clean, maintainable, and well-documented. The internal audit team can provide feedback and recommendations to the development team, which can be used to improve the overall quality of the software.
External Audits
Conversely, external audits are conducted by an independent third-party organization. These audits are often more rigorous and formal than internal audits. They aim to ensure that the organization's software and processes comply with industry standards and regulations.
External audits can be beneficial as they provide an unbiased software assessment. They can identify potential issues and vulnerabilities that might have been overlooked during the internal audits.
Moreover, passing an external audit can boost the organization's reputation as it demonstrates its commitment to quality and compliance.
Common Compliance Standards in Software Development
There are several key compliance standards that software projects need to adhere to. These standards provide guidelines and best practices that ensure the software's quality, security, and privacy.
ISO 27001: Information Security Management
ISO 27001 is an international standard that provides a framework for information security management. It helps organizations manage and protect their information assets. In software development, ISO 27001 requires developers to implement security controls in their software to safeguard the information.
PCI DSS: Payment Card Industry Data Security Standard
If your software deals with payment card information, then PCI DSS compliance is necessary. "The PCI DSS is a set of security standards to ensure that all companies that accept, process, store or transmit credit card information maintain a secure environment," notes Zachary Jarvinen, Vice President of Exact Payments. It mandates that developers follow certain practices to ensure cardholder data security.
GDPR: General Data Protection Regulation
GDPR is a regulation in EU law that protects EU citizens' privacy and personal data. If your software collects or processes EU citizens' data, then you must ensure that it complies with GDPR. This means that you need to implement specific measures in your software to protect the personal data and provide transparency to the users about how their data is used.
Role of Code Documentation in Compliance Audits
Compliance audits are rigorous assessments that inspect an organization's adherence to regulatory guidelines. Code documentation plays a crucial role in these audits, establishing evidence of compliance, facilitating audit procedures, and demonstrating security measures.
Establishing Evidence of Compliance
Code documentation serves as a blueprint of the software development process. It details every function, method, and class within the codebase, thus providing a comprehensive overview of the software's inner workings. This, in turn, can be used as tangible evidence of complying with specific coding standards and practices.
For instance, if your code documentation clearly describes how user data is encrypted, it can establish compliance with data protection regulations.
Similarly, if the documentation outlines the software's accessibility features, it can demonstrate adherence to accessibility laws. Therefore, maintaining thorough, up-to-date code documentation can help establish evidence of compliance during audits.
Facilitating Audit Procedures
During a compliance audit, auditors need to analyze the software's code to ensure it adheres to regulatory guidelines. A comprehensive code document makes this task significantly more manageable. Instead of trawling through thousands of lines of code, auditors can refer to the documentation to understand the software's functionality and assess its compliance.
Moreover, well-documented code can expedite the audit process, as auditors can quickly identify and focus on areas relevant to the regulations being audited. It simplifies their task, ensuring a more efficient and effective audit process.
Demonstrating Security Measures
Compliance audits often include checks to ensure the software has adequate security measures. A well-maintained code document can effectively demonstrate these measures.
By detailing how the code handles user data, manages authentication and authorization, encrypts sensitive information, and responds to potential security threats, the documentation can provide auditors with the evidence they need to verify the software's security compliance. This not only aids in passing the audit but also reinforces the trust of clients and users in your software.
How to Prepare Your Code Documentation for Compliance Audits
Preparing your code documentation for compliance audits doesn't have to be daunting. By following a few key steps, you can ensure your documentation is audit-ready.
Regular Review and Update of Documentation
In the fast-paced world of software development, code changes are inevitable. As the code evolves, so should its documentation. Regularly reviewing and updating your code documentation ensures that it accurately reflects the current state of the software.
This is particularly crucial during compliance audits, as outdated or inaccurate documentation can lead to misunderstandings, non-compliance findings, and even audit failures. By establishing a routine for documentation updates, you can ensure your code documentation remains a reliable, up-to-date resource for auditors.
Integration of Documentation Process in the SDLC
The Software Development Life Cycle (SDLC) is a systematic process for developing software that ensures its quality and correctness. Integrating the documentation process into the SDLC can help ensure the documentation is as thorough and accurate as possible.
Developers can provide real-time, detailed descriptions of the software's functionality by documenting the code as it's written. This results in more accurate documentation and saves time and effort in the long run, as there's no need to document the code retroactively.
Document Security Measures
As mentioned earlier, code documentation can effectively demonstrate the software's security measures. Detailed documentation of your software's security protocols, data handling practices, and response mechanisms to potential threats can give auditors a clear picture of your software's security compliance.
In addition, documenting any security-related code changes or updates can prove your commitment to maintaining robust security measures, further boosting your chances of a successful audit.
Use Documentation Tools
In today's technologically advanced world; several tools can aid documentation. These tools can automate parts of the process, ensure consistency, and even check for errors or omissions. By leveraging these tools, you can streamline the documentation process, making it easier to maintain up-to-date, comprehensive code documentation.
Conclusion
In conclusion, code documentation is not just a nicety but a necessity in software development. It plays a crucial role in compliance audits, helping establish evidence of compliance, facilitating audit procedures, and demonstrating security measures. By regularly reviewing and updating your documentation, integrating the documentation process into the SDLC, documenting your security measures, and using documentation tools, you can ensure your code documentation is always audit-ready.
Audit readiness is particularly important for HIPAA compliance - learn more about our HIPAA-compliant hosting.
### Bard vs. ChatGPT: What's the Difference?
Artificial Intelligence has hit the mainstream recently, with two notable names emerging as the leading AI platforms: Bard and ChatGPT. Both are impressive products in their own right, but each has unique characteristics and applications that set them apart, creating a fascinating comparison.
AI is here to stay, and there is a lot of buzz in the media about our future being powered by AI. This article will discuss the critical differences between the big AI players, and we will also consider the ethical implications of an AI-driven future.
Bard and ChatGPT: Merging Creativity and AI
Bard was released on March 21, 2023, and is named after the bards of Celtic cultures, who were professional storytellers trained to remember and recite stories and poems. Bard was initially released as a limited beta in the United States and the United Kingdom. However, On May 10, 2023, Bard was released to the public and is now available in over 180 countries and territories.
Built by Alphabet Inc., Google's parent company, Bard has been turning heads with its ability to generate intriguing narratives and stories. It is estimated that Bard has 30 million monthly users. It has quickly gained recognition for its potential in the creative industries, with writers, filmmakers, and other creatives praising its capabilities.
On the other hand, we have ChatGPT, a creation from OpenAI released on November 30, 2022. The Generative Pre-trained Transformer is an extensive language model trained to simulate human-like text. ChatGPT has been instrumental in reshaping conversations about AI's place in society. From answering queries to writing essays and even generating poetry, ChatGPT's versatility has made it a household name.
Bard and ChatGPT: Empowering Expression, Elevating Communication
Bard and ChatGPT share many similarities; they are both AI tools trained using extensive source data with a technique called deep learning. Both versions can now use the internet to gain up-to-date information (although this is currently only a paid feature for ChatGPT).
While both products were developed using advanced machine-learning techniques, they each carry distinct identities. Bard's primary function is to weave compelling narratives, making it an ideal tool for creative exploration. ChatGPT is a conversational tool that excels in various tasks, from customer support to education.
Both platforms have gained instant recognition from users and industry experts as a highly positive tools for creative thinking. The impact of AI has also been discussed in Congress, further validating its effectiveness and future potential.
The impact of Bard and ChatGPT is undeniable. Bard's influence is inspiring new ways of storytelling and content creation. Meanwhile, ChatGPT's broad applicability has made it an invaluable asset across numerous industries, redefining the concept of AI assistance.
Unraveling the Main Differences Between Bard and ChatGPT
Bard can access real-time information from the internet, allowing it to stay updated with the latest developments. ChatGPT's knowledge base is static, with its data sources ending in 2021.
The language models employed by these chatbots also differ. According to TechTarget, Bard operates on Google's latest language model, PaLM 2, which is touted for its superior capabilities in common sense reasoning, logic, and mathematics. In contrast, ChatGPT operates on the GPT-3.5 language model, with the more advanced GPT-4 model available in its premium version, ChatGPT Plus. The choice of language model can significantly influence the chatbot's ability to understand and generate human-like responses.
Bard generates multiple chunks of information, providing a more detailed response to user queries. ChatGPT creates content in a single text prompt, providing a concise and direct response. This approach can be advantageous for straightforward questions.
While Bard and ChatGPT share the common goal of simulating human-like conversations and generating AI-powered content, their unique characteristics and capabilities set them apart. Understanding these differences can help users choose the chatbot that best suits their needs and preferences.
Advantages of Conversational AI
If you use AI tools, you will be well aware of the advantages they bring to the table. However, if you are new to AI, let's delve into the key advantages on offer:
Precision: GPT models consistently demonstrate remarkable accuracy in their predictions. This proficiency can be attributed to their extensive training on vast and diverse datasets, encompassing a wide range of text and code.
Quickness: One standout feature of GPT models is their exceptional speed. This remarkable swiftness can be attributed to the deep learning methodologies employed during their training, enabling them to deliver prompt and efficient responses.
Versatility: These powerful tools can seamlessly tackle a broad spectrum of tasks, encompassing various domains. From generating coherent and creative text to facilitating language translation, AI models exhibit remarkable adaptability.
Disadvantages of Conversational AI
While conversational AI presents immense potential to revolutionize human-computer interaction, it's crucial to acknowledge and address the challenges associated with these tools. Here are a few significant concerns to consider:
Bias: AI models trained on datasets created by humans can inadvertently inherit biases in the training data. It's essential to be mindful of this inherent limitation and take proactive measures to mitigate bias, ensuring fair and equitable outcomes.
Privacy: The utilization of AI models raises valid concerns about data privacy. As these models can accumulate and retain personal information, there exists a potential risk of misuse, such as identity theft or unsolicited spam. Ensuring robust privacy safeguards is imperative to protect user data.
Safety: AI models can generate content autonomously, introducing a safety concern. Despite built-in protection, there is a potential for these models to produce harmful or malicious content.
Navigating the Ethical Landscape of AI
The ethical considerations surrounding the use of AI are becoming increasingly important. These considerations span multiple issues, from data privacy and transparency to fairness and accountability.
Data privacy is a paramount concern in AI ethics. AI systems rely on vast amounts of data, some of which may be personal or sensitive. Ensuring this data is collected, stored, and used ethically to respect user privacy is crucial.
Transparency, another key ethical issue, involves communicating how an AI system works and makes decisions. Users have a right to understand the mechanisms behind the AI tools they interact with, mainly when used in high-stakes contexts, such as healthcare or finance.
Fairness in AI refers to the imperative to avoid bias in AI systems. AI models should be trained and tested on diverse datasets to ensure they don't perpetuate harmful biases. Moreover, AI applications should be designed to promote inclusivity and equal opportunity.
Accountability is also essential in AI ethics. When AI systems make mistakes or cause harm, who is responsible should be clear. This involves establishing robust mechanisms for oversight and redress.
The ethical use of AI also involves considering its societal implications, such as its impact on jobs and the digital divide. As AI continues to evolve, it's crucial that its benefits are broadly shared and do not exacerbate existing inequalities.
Next Steps
If you're interested in discovering how AI can perform in a network and help your business succeed, contact our sales team at sales@atlantic.net to learn more about how our managed services offerings can work with AI to improve your IT infrastructure!
### How To Install Cacti Monitoring Tool on Fedora
Cacti is an open-source web-based monitoring and graphing tool. It provides an extensible and fault management framework for users to monitor network applications. It is a frontend to RRDTool that stores all of the necessary information to create graphs and populate them with data in a MySQL database. Cacti uses the SNMP protocol to monitor different network devices including routers, servers, and switches. If you are looking for an open-source solution to monitor your IT infrastructure then Cacti is the best option for you.
In this post, we will show you how to install Cacti Monitoring Tool on Fedora Linux.
Step 1 - Install Required Dependencies
First, you will need to install development tools on your server. You can install all of them using the following commands.
dnf update -y
dnf groupinstall "Development Tools" -y
Next, install other required dependencies using the command given below.
dnf install -y net-snmp net-snmp-utils rrdtool -y
Once all the packages are installed, you can proceed to the next step.
Step 2 - Install Apache, MariaDB, and PHP
First, install Apache and MariaDB with the following command.
dnf install httpd mariadb-server -y
Once installed, start and enable both Apache and MariaDB services.
systemctl enable --now httpd mariadb
Next, install PHP and other required extensions using the following command.
dnf install -y php php-{mysqlnd,curl,gd,intl,pear,ldap,xmlrpc,snmp,mbstring,gettext,gmp,json,xml,common}
Next, edit the PHP configuration file and change some default settings.
nano /etc/php.ini
Change the following settings.
date.timezone = UTC
memory_limit = 512M
max_execution_time = 300
Save and close the file, then start and enable the PHP-FPM service.
systemctl enable --now php-fpm
Step 3 - Configure MariaDB Database
First, log in to your MariaDB shell with the following command.
mysql
Once you are logged in, create a database and user for Cacti.
CREATE DATABASE cacti;
GRANT ALL ON cacti.* TO 'cacti'@'localhost' IDENTIFIED BY 'password';
Next, flush the privileges and exit from the MariaDB console.
FLUSH PRIVILEGES;
exit;
Next, edit the MariaDB default configuration file and tweak some settings.
nano /etc/my.cnf.d/mariadb-server.cnf
Add the following lines below [mysqld]
character-set-server=utf8mb4
collation-server=utf8mb4_unicode_ci
max_heap_table_size=128M
tmp_table_size=128M
join_buffer_size=128M
innodb_buffer_pool_size=1024M
innodb_doublewrite=ON
innodb_flush_log_at_timeout=3
innodb_read_io_threads=32
innodb_write_io_threads=16
innodb_buffer_pool_instances=10
innodb_file_format=Barracuda
innodb_large_prefix=1
innodb_io_capacity=5000
innodb_io_capacity_max=10000
Save and close the file, then restart the MariaDB service.
systemctl restart mariadb
Step 4 - Install and Configure Cacti
First, change the directory to the Apache web root and download the latest version of Cacti.
cd /var/www/html/
wget --no-check-certificate https://www.cacti.net/downloads/cacti-latest.tar.gz
Next, extract the downloaded file.
tar -xvzf cacti-latest.tar.gz
Then, rename the extracted directory to cacti
mv cacti-1.2.24 cacti
Next, import the Cacti schema to the cacti database.
cd cacti
mysql -u root -p cacti < /var/www/html/cacti/cacti.sql
Also, import the timezone information to MySQL.
mysql_tzinfo_to_sql /usr/share/zoneinfo | mysql -u root -p mysql
Next, log in to the MariaDB shell and change the default CHARACTER SET.
mysql
GRANT SELECT ON mysql.time_zone_name TO cacti@localhost;
ALTER DATABASE cacti CHARACTER SET utf8mb4 COLLATE utf8mb4_unicode_ci;
Next, flush the privileges and exit from the MariaDB shell.
FLUSH PRIVILEGES;
EXIT;
Next, copy the Cacti configuration file and edit it with nano editor.
cp /var/www/html/cacti/include/config.php.dist /var/www/html/cacti/include/config.php
nano /var/www/html/cacti/include/config.php
Define your database settings.
$database_type = 'mysql';
$database_default = 'cacti';
$database_hostname = 'localhost';
$database_username = 'cacti';
$database_password = 'password';
$database_port = '3306';
Next, create a log file for Cacti and set proper permission on the Cacti directory.
touch /var/www/html/cacti/log/cacti.log
chown -R apache:apache /var/www/html/cacti
Finally, restart both the Apache and PHP-FPM services to apply the changes.
systemctl restart httpd php-fpm
Step 6 - Access Cacti Web Installation Wizard
Now, open your web browser and access your Cacti installation via http://your-server-ip/cacti. You will see the Cacti login screen.
Provide Cacti with the default username and password as admin/admin then click on the Login button. You will see the change password screen.
Set your new password and click on the Save button. You will see the License agreement screen.
Accept the agreement and click on Begin. You will see the MySQL setting screen.
Click on the Next button. You should see the Installation Type screen.
Select your server and click on the Next button. You will see the check directory permission screen.
Confirm all permissions and click on the Next button. You will see the verify binary location screen.
Click on the Next button. You will see the Input validation screen.
Click on the Next button. You will see the Profile setting page.
Select all required options and click on the Next button. You will see the template setup screen.
Click on the Next button. You will see the Server Collation screen.
Click on the Next button. You will see the Confirm installation screen.
Confirm the installation and click on the Install button. Once the Cacti is installed, you will see the following screen.
Click on the Get Started button. You will see the Cacti dashboard page.
Conclusion
In this guide, we showed you how to install the Cacti monitoring tool on Fedora Linux. You can now add a remote server to Cacti and start monitoring them via a web-based dashboard. You can now start using Cacti for monitoring servers hosted on a dedicated server from Atlantic.Net!
### How to Install pgAdmin on Fedora
pgAdmin is an advanced open-source database management tool that allows you to manage PostgreSQL databases via a web browser. It provides a Graphical User Interface to interact with remote and local PostgreSQL and perform database operations. pgAdmin is written in Python and jQuery and supports all the features found in PostgreSQL.
In this guide, we will show you how to install pgAdmin on Fedora Linux.
Step 1 - Install PostgreSQL
First, list all available PostgreSQL versions using the following command.
dnf module list postgresql
You will see the following output.
Last metadata expiration check: 0:05:00 ago on Thu 13 Jul 2023 06:28:07 AM EDT.
Fedora Modular 34 - x86_64
Name Stream Profiles Summary
postgresql 9.6 client, server [d] PostgreSQL module
postgresql 10 client, server [d] PostgreSQL module
postgresql 11 client, server [d] PostgreSQL module
postgresql 12 client, server PostgreSQL module
postgresql 13 client, server PostgreSQL module
Fedora Modular 34 - x86_64 - Updates
Name Stream Profiles Summary
postgresql 9.6 client, server [d] PostgreSQL module
postgresql 10 client, server [d] PostgreSQL module
postgresql 11 client, server [d] PostgreSQL module
postgresql 12 client, server PostgreSQL module
postgresql 13 client, server PostgreSQL module
postgresql 14 client, server PostgreSQL module
Hint: [d]efault, [e]nabled, [x]disabled, [i]nstalled
Next, enable the latest PostgreSQL version with the following command.
dnf module enable postgresql:14
Next, install PostgreSQL 14 on your server.
dnf install postgresql-server -y
After the successful installation, initialize the PostgreSQL database.
postgresql-setup --initdb
Output:
* Initializing database in '/var/lib/pgsql/data'
* Initialized, logs are in /var/lib/pgsql/initdb_postgresql.log
Next, start and enable the PostgreSQL service.
systemctl enable postgresql
systemctl start postgresql
To verify the PostgreSQL status, run the following command.
systemctl status postgresql
You will see the following output.
● postgresql.service - PostgreSQL database server
Loaded: loaded (/usr/lib/systemd/system/postgresql.service; disabled; vendor preset: disabled)
Active: active (running) since Thu 2023-07-13 06:34:19 EDT; 6s ago
Process: 2277 ExecStartPre=/usr/libexec/postgresql-check-db-dir postgresql (code=exited, status=0/SUCCESS)
Main PID: 2279 (postmaster)
Tasks: 8 (limit: 4666)
Memory: 15.9M
CPU: 53ms
CGroup: /system.slice/postgresql.service
├─2279 /usr/bin/postmaster -D /var/lib/pgsql/data
├─2280 postgres: logger
├─2282 postgres: checkpointer
├─2283 postgres: background writer
├─2284 postgres: walwriter
├─2285 postgres: autovacuum launcher
├─2286 postgres: stats collector
└─2287 postgres: logical replication launcher
Step 2 - Install pgAdmin
By default, pgAdmin is not included in the Fedora default repo, so you will need to install the pgAdmin repo to your server.
rpm -Uvh https://ftp.postgresql.org/pub/pgadmin/pgadmin4/yum/pgadmin4-fedora-repo-2-1.noarch.rpm
Once the repo is created, install the pgAdmin with the following command.
dnf install pgadmin4-web -y
Next, install other required packages with the following command.
dnf install policycoreutils-python-utils -y
Step 3 - Configure the pgAdmin User Account
To access the pgAdmin web interface, you will need to set up a user and password for pgAdmin. Run the following script to set up an admin account.
/usr/pgadmin4/bin/setup-web.sh
You will be asked to provide your email and password as shown below.
Setting up pgAdmin 4 in web mode on a Redhat based platform...
Creating configuration database...
NOTE: Configuring authentication for SERVER mode.
Enter the email address and password to use for the initial pgAdmin user account:
Email address: hitjethva@gmail.cpom
Password:
Retype password:
pgAdmin 4 - Application Initialisation
======================================
Creating storage and log directories...
Configuring SELinux...
/usr/pgadmin4/bin/setup-web.sh: line 100: semanage: command not found
/usr/pgadmin4/bin/setup-web.sh: line 102: semanage: command not found
The Apache web server is not running. We can enable and start the web server for you to finish pgAdmin 4 installation. Continue (y/n)? y
Created symlink /etc/systemd/system/multi-user.target.wants/httpd.service → /usr/lib/systemd/system/httpd.service.
Apache successfully enabled.
Apache successfully started.
You can now start using pgAdmin 4 in web mode at http://127.0.0.1/pgadmin4
The above command will start the Apache server automatically. You can verify it with the following command.
systemctl status httpd
Output:
● httpd.service - The Apache HTTP Server
Loaded: loaded (/usr/lib/systemd/system/httpd.service; enabled; vendor preset: disabled)
Active: active (running) since Thu 2023-07-13 06:36:50 EDT; 19s ago
Docs: man:httpd.service(8)
Main PID: 3297 (httpd)
Status: "Total requests: 0; Idle/Busy workers 100/0;Requests/sec: 0; Bytes served/sec: 0 B/sec"
Tasks: 205 (limit: 4666)
Memory: 35.0M
CPU: 305ms
CGroup: /system.slice/httpd.service
├─3297 /usr/sbin/httpd -DFOREGROUND
├─3298 /usr/sbin/httpd -DFOREGROUND
├─3299 /usr/sbin/httpd -DFOREGROUND
├─3300 /usr/sbin/httpd -DFOREGROUND
├─3301 /usr/sbin/httpd -DFOREGROUND
└─3302 /usr/sbin/httpd -DFOREGROUND
Jul 13 06:36:50 fedora systemd[1]: Starting The Apache HTTP Server...
Step 4 - Access pgAdmin Web Interface
At this point, pgAdmin is installed and listens on port 80. You can access it using the URL http://your-server-ip/pgadmin4. You should see the pgAdmin login screen.
Provide your email address and password and click on Login. You will see the pgAdmin dashboard on the following screen.
Conclusion
In this tutorial, we explained how to install pgAdmin on Fedora Linux. You can now add your remote PostgreSQL server to pgAdmin and start managing them via the central dashboard. You can now use pgAdmin to monitor a PostgreSQL server on dedicated server hosting from Atlantic.Net!
### How to Install Strapi with Nginx on Fedora
Strapi is a free, open-source, next-generation headless CMS used to develop websites, mobile applications, eCommerce sites, and APIs. It helps developers to create an API without using any database and backend. Strapi gives you the freedom to use your favorite tools and allows content editors to streamline content delivery across any device.
In this post, we will show you how to install Strapi CMS on Fedora Linux.
Step 1 - Install Node.js
Strapi is based on Node.js, so you will need to install Node.js on your server.
First, install all required dependencies using the following command.
dnf install -y gcc-c++ make git
Next, add the Node source repo with the following command.
curl -sL https://rpm.nodesource.com/setup_18.x | bash -
After that install Node.js with the following command.
dnf install nodejs
You can verify the Node.js version with the following command.
node -v
v18.19.0
Step 2 - Install PostgreSQL
Strapi uses PostgreSQL as a database backend, so you will need to install PostgreSQL on your server.
First, enable the PostgreSQL module.
dnf module enable postgresql:13
Next, install the PostgreSQL server using the following command.
dnf install postgresql-server
Then, initialize the PostgreSQL database.
postgresql-setup --initdb
After that, start and enable the PostgreSQL service.
systemctl enable postgresql
systemctl start postgresql
Next, connect to the PostgreSQL shell.
sudo -u postgres psql
Next, set the PostgreSQL password and create a Strapi database.
ALTER USER postgres PASSWORD 'password';
create database strapi;
Next, exit from the PostgreSQL shell.
\q
Step 3 - Create a Strapi Application
You can use the npx command line utility to easily create a Strapi app.
npx create-strapi-app@latest strapi --no-run
You will see the following output.
Need to install the following packages:
create-strapi-app@4.11.5
Ok to proceed? (y) y
? Choose your installation type Quickstart (recommended)
Next, navigate to the strapi directory and build the application with the following command.
cd strapi
npm run build
Output:
> strapi@0.1.0 build
> strapi build
Building your admin UI with development configuration...
✔ Webpack
Compiled successfully in 30.45s
Admin UI built successfully
Next, edit the server.js file and define your domain.
nano ./config/server.js
Change the following lines:
module.exports = ({ env }) => ({
host: env('HOST', '0.0.0.0'),
port: env.int('PORT', 1337),
url: 'http://strapiapp.example.com',
app: {
keys: env.array('APP_KEYS'),
},
webhooks: {
populateRelations: env.bool('WEBHOOKS_POPULATE_RELATIONS', false),
},
});
Save and close the file, then run Strapi in development mode.
npm run develop
If everything is fine, you will get the following output.
Project information
┌────────────────────┬──────────────────────────────────────────────────┐
│ Time │ Thu Jul 13 2023 10:06:52 GMT-0400 (Eastern Dayl… │
│ Launched in │ 2236 ms │
│ Environment │ development │
│ Process PID │ 13769 │
│ Version │ 4.11.5 (node v18.11.0) │
│ Edition │ Community │
│ Database │ sqlite │
└────────────────────┴──────────────────────────────────────────────────┘
Actions available
One more thing...
Create your first administrator 💻 by going to the administration panel at:
┌────────────────────────────────────┐
│ http://strapiapp.example.com/admin │
└────────────────────────────────────┘
Press the CTRL+C to stop the application.
Step 4 - Create a Systemd Service for Strapi
It is recommended to create a systemd file to manage the Strapi service.
nano /etc/systemd/system/strapi.service
Add the following configurations.
[Unit]
Description=Strapi Project
After=network.target
[Service]
Type=simple
WorkingDirectory=/root/strapi
User=root
ExecStart=/usr/bin/node /root/strapi/node_modules/.bin/strapi develop
[Install]
WantedBy=multi-user.target
Save and close the file, then reload the systemd daemon to apply the changes.
systemctl daemon-reload
Next, start and enable the Strapi service to start at system reboot.
systemctl start strapi
systemctl enable strapi
You can verify the Strapi service status using the following command.
systemctl status strapi
Output:
● strapi.service - Strapi Project
Loaded: loaded (/etc/systemd/system/strapi.service; disabled; vendor preset: disabled)
Active: active (running) since Thu 2023-07-13 10:12:23 EDT; 3s ago
Main PID: 14102 (node)
Tasks: 14 (limit: 4666)
Memory: 224.7M
CPU: 4.403s
CGroup: /system.slice/strapi.service
├─14102 /usr/bin/node /root/strapi/node_modules/.bin/strapi develop
└─14116 /usr/bin/node /root/strapi/node_modules/.bin/strapi develop
Jul 13 10:12:23 fedora systemd[1]: Started Strapi Project.
Step 5 - Configure Nginx for Strapi App
First, install the Nginx package with the following command.
dnf install nginx
Next, create a new Nginx virtual host configuration file.
nano /etc/nginx/conf.d/strapi.conf
Add the following configurations:
# Strapi server
upstream strapi {
server 127.0.0.1:1337;
}
server {
listen 80;
server_name strapiapp.example.com;
# Proxy Config
location / {
proxy_pass http://strapi;
proxy_http_version 1.1;
proxy_set_header X-Forwarded-Host $host;
proxy_set_header X-Forwarded-Server $host;
proxy_set_header X-Real-IP $remote_addr;
proxy_set_header X-Forwarded-For $proxy_add_x_forwarded_for;
proxy_set_header X-Forwarded-Proto $scheme;
proxy_set_header Host $http_host;
proxy_set_header Upgrade $http_upgrade;
proxy_set_header Connection "Upgrade";
proxy_pass_request_headers on;
}
}
Save and close the file, then edit the Nginx main configuration file.
nano /etc/nginx/nginx.conf
Add the following line after the line http{:
server_names_hash_bucket_size 64;
Save the file, then verify the Nginx configuration.
nginx -t
You should see the following output.
nginx: the configuration file /etc/nginx/nginx.conf syntax is ok
nginx: configuration file /etc/nginx/nginx.conf test is successful
Finally, start the Nginx service to implement the changes.
systemctl start nginx
Step 6 - Access Strapi Web UI
At this point, Strapi is installed and configured. You can now access the Strapi web interface using the URL http://strapiapp.example.com/admin. You should see the user registration page.
Provide your name, email, and password, and click on the Let's start button. You will be redirected to the Strapi dashboard.
Conclusion
In this post, we have shown you how to install Strapi on Fedora Linux. We also installed and configured Nginx as a reverse proxy for Strapi. You can now use Strapi in the production environment to create an API easily. Try to deploy the Strapi application on dedicated server hosting from Atlantic.Net!
### Atlantic.Net and mesibo Introduce World’s First One-Click Real-Time Communication-Platform-as-a-Service (CPaaS)
Atlantic.Net and mesibo released the world’s first one-click deployable real-time Communication-Platform-as-a-Service (CPaaS) for businesses and developers. This partnership brings together Atlantic.Net, a leading global cloud services provider, and mesibo, the leading and most secure CPaaS provider, to enable enterprises, solution integrators, and developers worldwide with easy access to a highly secure and robust real-time communication platform in just one click.
The partnership between Atlantic.Net and mesibo facilitates the adoption of self-hosted CPaaS for businesses covered by regulatory compliance standards, even if they lack technical expertise, thanks to Atlantic.Net’s optional cybersecurity and compliance managed services.
The collaboration marks a significant and disruptive shift in the CPaaS industry, providing businesses with seamless access to self-hosted CPaaS services through Atlantic.Net’s cloud infrastructure. This partnership empowers customers with the world’s most secure and scalable communication platform, enabling them to easily add secure end-to-end encrypted messaging, calls, conferencing, and AI-driven chatbots into their applications and websites. This will result in increased customer market penetration in today’s app-driven landscape, where 90% of apps, such as ridesharing, social media, telemedicine, financial services, customer support, multi-party games, and more, rely on real-time communication.
The CPaaS one-click messaging application will be hosted on the Atlantic.Net cloud, enabling customers to set up communication services, like messaging, calls, and conferencing, in under 30 seconds. Atlantic.Net is offering a free-to-use G3.2GB cloud server for one full year, making it even more cost-effective for businesses to host mesibo CPaaS.
### How to Install InfluxDB on Fedora
InfluxDB is a free and open-source time series database written in the Go programming language. It is designed to store time series data for operations monitoring, application metrics, IoT sensor data, and real-time analytics. It can store data ranging from hundreds of thousands of points per second. It is gaining popularity due to its fast processing and low latency features.
In this post, we will show you how to install InfluxDB on Fedora Linux.
Step 1 - Create InfluxDB Repo
By default, the InfluxDB package is not included in the Fedora default repo, so you will need to create a repo for that.
nano /etc/yum.repos.d/influxdb.repo
Add the following lines.
[influxdb]
name = InfluxDB Repository - RHEL
baseurl = https://repos.influxdata.com/rhel/8/x86_64/stable/
enabled = 1
gpgcheck = 1
gpgkey = https://repos.influxdata.com/influxdata-archive_compat.key
Save and close the file when you are finished.
Step 2 - Install InfluxDB
You can now install the InfluxDB using the following command.
dnf install influxdb2 influxdb2-cli
After installing InfluxDB, you can verify the InfluxDB version with the following command.
influx version
You will see the following output.
Influx CLI dev (git: none) build_date: 2023-04-28T14:24:14Z
You can also see the detailed information on InfluxDB with the following command.
rpm -qi influxdb2
Output.
Name : influxdb2
Version : 2.7.1
Release : 1
Architecture: x86_64
Install Date: Thu 13 Jul 2023 10:32:32 AM EDT
Group : default
Size : 103759839
License : MIT
Signature : RSA/SHA512, Fri 28 Apr 2023 01:47:08 PM EDT, Key ID d8ff8e1f7df8b07e
Source RPM : influxdb2-2.7.1-1.src.rpm
Build Date : Fri 28 Apr 2023 09:28:30 AM EDT
Build Host : ip-10-0-35-48.ec2.internal
Relocations : /
Packager : support@influxdb.com
Vendor : InfluxData
URL : https://influxdata.com
Summary : Distributed time-series database.
Description :
Distributed time-series database.
Step 3 - Start InfluxDB Service
After installing InfluxDB, start the InfluxDB service and enable it to start at system reboot.
systemctl start influxdb
systemctl enable influxdb
You can now check the status of InfluxDB with the following command.
systemctl status influxdb
You will see the following output.
● influxdb.service - InfluxDB is an open-source, distributed, time series database
Loaded: loaded (/usr/lib/systemd/system/influxdb.service; enabled; vendor preset: disabled)
Active: active (running) since Thu 2023-07-13 10:33:15 EDT; 4s ago
Docs: https://docs.influxdata.com/influxdb/
Process: 15431 ExecStart=/usr/lib/influxdb/scripts/influxd-systemd-start.sh (code=exited, status=0/SUCCESS)
Main PID: 15432 (influxd)
Tasks: 8 (limit: 4666)
Memory: 46.1M
CPU: 599ms
CGroup: /system.slice/influxdb.service
└─15432 /usr/bin/influxd
Step 4 - Access InfluxDB
At this point, InfluxDB is started and listens on port 8086. You can check it with the following command.
ss -tunelp| grep 8086
You will see the following output.
tcp LISTEN 0 4096 *:8086 *:* users:(("influxd",pid=15432,fd=9)) uid:992 ino:129931 sk:100b cgroup:/system.slice/influxdb.service v6only:0 <->
Now, open your web browser and access the InfluxDB web interface using the URL http://your-server-ip:8086. You will see InfluxDB user welcome screen.
Click on the GET STARTED button. You will see the InfluxDB setup screen.
Define your username and password and click on CONTINUE. You should see the following screen.
Click on the QUICK START button. You should see the InfluxDB dashboard on the following screen.
Conclusion
In this tutorial, we showed you how to install InfluxDB on Fedora Linux. You can now manage all your databases from the central location via a web browser. You can now deploy InfluxDB on dedicated server hosting from Atlantic.Net!
### How To Install Glances Monitoring Tool on Fedora
Glances is an open-source, cross-platform monitoring solution that allows real-time monitoring of CPU, memory, disk, and more. With Glances, you can also monitor filesystem I/O, network I/O, and sensor readouts to display CPU and other hardware temperatures. It is written in Python and can be installed on Windows and Linux operating systems.
In this post, we will show you how to install and use Glances to monitor system performance on Fedora Linux.
Step 1 - Install Required Dependencies
Glances is a Python-based application, so you will need to install Python and other required packages on your server. Run the following command to install all of them.
dnf update -y
dnf install python3 python3-pip
Also, install the bottle module using the following command.
pip3 install bottle
Once all the packages are installed, you can proceed to the next step.
Step 2 - Install Glances
By default, the Glances package is included in the Fedora default repo. You can install it using the following command.
dnf install glances -y
Once Glances is installed, you can verify it with the following command.
rpm -qi glances
You will see the Glances package information on the following output.
Name : glances
Version : 3.1.4.1
Release : 9.fc34
Architecture: noarch
Install Date: Thu 13 Jul 2023 11:43:40 PM EDT
Group : Unspecified
Size : 6644599
License : GPLv3
Signature : RSA/SHA256, Tue 26 Jan 2021 06:20:56 AM EST, Key ID 1161ae6945719a39
Source RPM : glances-3.1.4.1-9.fc34.src.rpm
Build Date : Tue 26 Jan 2021 06:08:15 AM EST
Build Host : buildvm-ppc64le-27.iad2.fedoraproject.org
Packager : Fedora Project
Vendor : Fedora Project
URL : https://github.com/nicolargo/glances
Bug URL : https://bugz.fedoraproject.org/glances
Summary : CLI curses based monitoring tool
Description :
Glances is a CLI curses based monitoring tool for both GNU/Linux and BSD.
Step 3 - Run Glances in Standalone Mode
After Glances installation, you can run the Glances in a standalone mode to show all the details in the current terminal interface.
glances
You will see your system information on the following screen.
Step 4 - Run Glances in Web Mode
You can also run Glances in web mode. In this mod, you can access the Glances web interface from the remote machine and monitor the system performance.
Let's run Glances in web mode using the -w option.
glances -w
You will see the following output.
Glances Web User Interface started on http://0.0.0.0:61208/
Now, open your web browser and access the Glances web dashboard using the URL http://your-server-ip:61208. You will see the Glances dashboard on the following screen.
Conclusion
In this post, we explained how to install the Glances monitoring tool on Fedora Linux. You can now use Glances in a production environment to monitor your server performance in real-time. You can now try to use the Glances monitoring tool on dedicated server hosting from Atlantic.Net!
### How to Install Angular on Fedora
Angular is a versatile, free, open-source web application framework developed by Google. It is used to build efficient and scalable single-page mobile and desktop applications. It is fully extensible and works well with other libraries. It is based on TypeScript and provides building blocks to quickly set up a maintainable, scalable app.
In this post, we will show you how to install Angular on Fedora Linux.
Step 1 - Install Node.js
Before starting, the Node.js package must be installed on your system. Follow the below steps to install the latest stable version of Node.js.
First, install all the required dependencies using the following commands.
dnf update -y
dnf install -y gcc-c++ make
Next, add the Node source repo with the following command.
curl -sL https://rpm.nodesource.com/setup_18.x | bash -
After that, install Node.js with the following command.
dnf install nodejs git -y
You can verify the Node.js version with the following command.
node -v
Output.
v18.19.0
Step 2 - Install Angular CLI
Angular provides a CLI utility to initialize, develop and maintain Angular applications via a command line interface. You can install it via the NPM command.
npm install -g @angular/cli
After installing Angular, you can verify its version with the following command.
ng version
Output:
Global setting: enabled
Local setting: No local workspace configuration file.
Effective status: enabled
_ _ ____ _ ___
/ \ _ __ __ _ _ _| | __ _ _ __ / ___| | |_ _|
/ △ \ | '_ \ / _` | | | | |/ _` | '__| | | | | | |
/ ___ \| | | | (_| | |_| | | (_| | | | |___| |___ | |
/_/ \_\_| |_|\__, |\__,_|_|\__,_|_| \____|_____|___|
|___/
Angular CLI: 16.1.4
Node: 18.11.0
Package Manager: npm 8.19.2
OS: linux x64
Angular:
...
Package Version
------------------------------------------------------
@angular-devkit/architect 0.1601.4 (cli-only)
@angular-devkit/core 16.1.4 (cli-only)
@angular-devkit/schematics 16.1.4 (cli-only)
@schematics/angular 16.1.4 (cli-only)
Step 3 - Create an Angular Application
You can now create an Angular application using the following command.
ng new angular-app
Once the Angular application is created, navigate inside the created application and start it using the following command.
cd angular-app
ng serve --host 0.0.0.0 --port 8080
If everything is fine, you will see the following output.
✔ Browser application bundle generation complete.
Initial Chunk Files | Names | Raw Size
vendor.js | vendor | 2.28 MB |
polyfills.js | polyfills | 333.16 kB |
styles.css, styles.js | styles | 230.46 kB |
main.js | main | 48.10 kB |
runtime.js | runtime | 6.52 kB |
| Initial Total | 2.89 MB
Build at: 2023-07-13T13:43:45.597Z - Hash: 46dc314ca09e79ec - Time: 9220ms
** Angular Live Development Server is listening on 0.0.0.0:8080, open your browser on http://localhost:8080/ **
✔ Compiled successfully.
Step 4 - Access Angular Application
At this point, your Angular application is starting and listening on port 8080. You can now access it using the URL http://your-server-ip:8080. You should see the following screen.
Step 5 - Build Angular Application for Production
If you want to use your application for production, use the "ng build" command.
ng build
You will see the following output.
✔ Browser application bundle generation complete.
✔ Copying assets complete.
✔ Index html generation complete.
Initial Chunk Files | Names | Raw Size | Estimated Transfer Size
main.034889dcd4e28a74.js | main | 204.80 kB | 56.01 kB
polyfills.da805e0bf15a1686.js | polyfills | 33.02 kB | 10.63 kB
runtime.fe3a75fab6275a44.js | runtime | 900 bytes | 514 bytes
styles.ef46db3751d8e999.css | styles | 0 bytes | -
| Initial Total | 238.69 kB | 67.14 kB
Build at: 2023-07-13T13:47:06.202Z - Hash: a0b04b4abae2d0b9 - Time: 66579ms
The above command will create a ‘dist/’ directory in your project folder with the compiled Angular application. You can check it with the following command.
ls dist/angular-app/
You will see all application files in the following output.
3rdpartylicenses.txt favicon.ico index.html main.034889dcd4e28a74.js polyfills.da805e0bf15a1686.js runtime.fe3a75fab6275a44.js styles.ef46db3751d8e999.css
Conclusion
In this post, you learned how to install Angular and create a sample application via the CLI tool. You have now an Angular environment ready to build an interactive single-page application. You can now try to deploy the Angular application on dedicated server hosting from Atlantic.Net!
### How to Install Golang on Fedora
Go is a high-level open-source programming language developed by Google. It is very similar to C and is used to build secure, scalable systems. It is a general-purpose language and is especially useful for distributed systems and cloud services. Go is known for its concurrency and ability to run multiple tasks simultaneously. If you are looking for solving complex computational problems, then Go is the best option for you.
In this post, we will show you how to install and use Golang on Fedora Linux.
Step 1 - Install Golang
By default, the Golang package is included in the Fedora default repo. You can install it using the following command.
dnf -y install go
Once Golang is installed, you can verify the Golang version using the following command.
go version
You will see the following output.
go version go1.16.15 linux/amd64
Step 2 - Create an Application with Golang
First, create an application directory using the following command.
mkdir go
Next, create another directory inside the Go directory.
cd go
mkdir -p src/helloworld
Next, create a new application named helloworld.go.
cd src/helloworld
nano helloworld.go
Add the following code.
package main
import "fmt"
func main() {
fmt.Printf("hello, world\n")
}
Save and close the file when you are done.
Step 3 - Run the Golang Application
Now, change the directory to helloworld and initialize the application using the following command.
cd /root/go/src/helloworld
go mod init
Next, build the application with the following command.
go build
Now, run your application using the following command.
./helloworld
If everything is fine, you will see the following output.
hello, world
Conclusion
In this post, we showed you how to install Golang on Fedora Linux. You can now start building your own Golang application and hosted it in the production environment. You can now use Golang on dedicated server hosting from Atlantic.Net!
### How to Install Django Web Framework on Fedora
Django is a Python-based web application framework used for developing dynamic websites and applications. It offers a set of tools that lets developers build scalable web applications. Its aim is to simplify the deployment of complex web applications and also handle the crucial part of deployment, authentication, and security.
In this post, we will demonstrate how to install and use Django on Fedora Linux.
Step 1 - Install Python
Django is a Python-based application, so Python must be installed on your system. You can install it using the following command.
dnf install python3 python3-pip -y
Once the installation is complete, you can verify the Python version with the following command.
python3 --version
You will see the Python version in the following output.
Python 3.9.5
Step 2 - Install Django
Django code is hosted on GitHub. You can install it easily using the PIP package manager.
pip3 install Django
Once Django is installed, you can verify it with the following command.
django-admin --version
You will see the following output.
4.2.3
Step 3 - Create a Django Application
Django provides a Django-admin command line utility that allows you to create a Django application via CLI.
Let's create a Django application named djangoapp.
django-admin startproject djangoapp
Next, navigate to the djangoapp directory and start the migration process using the following command.
cd djangoapp
python3 manage.py migrate
Output:
Operations to perform:
Apply all migrations: admin, auth, contenttypes, sessions
Running migrations:
Applying contenttypes.0001_initial... OK
Applying auth.0001_initial... OK
Applying admin.0001_initial... OK
Applying admin.0002_logentry_remove_auto_add... OK
Applying admin.0003_logentry_add_action_flag_choices... OK
Applying contenttypes.0002_remove_content_type_name... OK
Applying auth.0002_alter_permission_name_max_length... OK
Applying auth.0003_alter_user_email_max_length... OK
Applying auth.0004_alter_user_username_opts... OK
Applying auth.0005_alter_user_last_login_null... OK
Applying auth.0006_require_contenttypes_0002... OK
Applying auth.0007_alter_validators_add_error_messages... OK
Applying auth.0008_alter_user_username_max_length... OK
Applying auth.0009_alter_user_last_name_max_length... OK
Applying auth.0010_alter_group_name_max_length... OK
Applying auth.0011_update_proxy_permissions... OK
Applying auth.0012_alter_user_first_name_max_length... OK
Applying sessions.0001_initial... OK
Step 4 - Create a Django Superuser Account
It is recommended to secure the Django via username and password. You can create a super admin account with the following command.
python3 manage.py createsuperuser
Set your admin username and password as shown below:
Username (leave blank to use 'root'): admin
Email address: hitjethva@gmail.com
Password:
Password (again):
Superuser created successfully.
Step 5 - Run Django Application
By default, Django can be accessed only from the local host. To access Django from the outside world, you will need to edit the Django configuration file and define your server IP.
nano djangoapp/settings.py
Define your server IP address as shown below:
ALLOWED_HOSTS = ['your_server_ip']
Save and close the file, then run the Django application with the following command.
python3 manage.py runserver 0.0.0.0:8000
You will see the following output.
Watching for file changes with StatReloader
Performing system checks...
System check identified no issues (0 silenced).
July 13, 2023 - 10:31:08
Django version 4.2.3, using settings 'djangoapp.settings'
Starting development server at http://0.0.0.0:8000/
Quit the server with CONTROL-C.
Step 6 - Access Django Application
At this point, Django is installed and listens on port 8000. You can now access it using the URL http://your-server-ip:8000. If everything is fine, you will see Django on the following screen.
Conclusion
In this guide, we explained how to install Django on Fedora Linux. We also explained how to set the Django administrator password and run the Django application. You can now easily build your Python application and host using the Django framework. Now, deploy your Django application on dedicated server hosting from Atlantic.Net!
### How to Install, Configure, and Run Elasticsearch on Oracle Linux 8
Elasticsearch is an open-source search and analytic engine used to add search functionality to web-based applications. It is capable of searching and analyzing a large amount of data. It is powerful, stable, scalable, and supports RESTful with an HTTP URI to manipulate data. It is based on the Lucene library, written in Java, and is dual-licensed under the source-available Server Side Public License and the Elastic license. It has the ability to index many types of content including, a website search, application search, security analytics, enterprise search, geospatial data analysis and visualization, and more.
In this post, we will show you how to install and configure Elasticsearch on OracleLinux 8.
Step 1 - Install Java
Elasticsearch is a Java-based application, so you will need to install Java on your server. You can install it by running the following commands:
dnf update -y
dnf install java-11-openjdk-devel -y
Once Java is installed, verify the Java version using the following command:
java --version
Sample output:
openjdk 11.0.15 2022-04-19 LTS
OpenJDK Runtime Environment 18.9 (build 11.0.15+10-LTS)
OpenJDK 64-Bit Server VM 18.9 (build 11.0.15+10-LTS, mixed mode, sharing)
Step 2 - Create Elasticsearch Repository
By default, Elasticsearch is not included in the OracleLinux 8 default repository, so you will need to create a repository for it.
First, download and import the GPG key with the following command:
rpm --import https://artifacts.elastic.co/GPG-KEY-elasticsearch
Next, create an Elasticsearch repo with the following command:
nano /etc/yum.repos.d/elasticsearch.repo
Add the following lines:
[elasticsearch-7.x]
name=Elasticsearch repository for 7.x packages
baseurl=https://artifacts.elastic.co/packages/7.x/yum
gpgcheck=1
gpgkey=https://artifacts.elastic.co/GPG-KEY-elasticsearch
enabled=1
autorefresh=1
type=rpm-md
Save and close the file when you are finished.
Step 3 - Install and Configure Elasticsearch
After creating an ElasticSearch repo, install the Elasticsearch package with the following command:
dnf install elasticsearch -y
After installing Elasticsearch, edit the Elasticsearch main configuration file:
nano /etc/elasticsearch/elasticsearch.yml
Change the following lines:
cluster.name: test cluster
node.name: node-1
path.data: /var/lib/elasticsearch
network.host: 127.0.0.1
Save and close the file, then start the Elasticsearch service and enable it to start at system reboot:
systemctl start elasticsearch
systemctl enable elasticsearch
You can also check the status of Elasticsearch with the following command:
systemctl status elasticsearch
You should get the following output:
● elasticsearch.service - Elasticsearch
Loaded: loaded (/usr/lib/systemd/system/elasticsearch.service; disabled; vendor preset: disabled)
Active: active (running) since Sun 2022-05-29 12:41:40 EDT; 10s ago
Docs: https://www.elastic.co
Main PID: 3147 (java)
Tasks: 76 (limit: 23694)
Memory: 2.2G
CGroup: /system.slice/elasticsearch.service
├─3147 /usr/share/elasticsearch/jdk/bin/java -Xshare:auto -Des.networkaddress.cache.ttl=60 -Des.networkaddress.cache.negative.ttl=>
└─3355 /usr/share/elasticsearch/modules/x-pack-ml/platform/linux-x86_64/bin/controller
May 29 12:41:12 oraclelinux8 systemd[1]: Starting Elasticsearch...
May 29 12:41:40 oraclelinux8 systemd[1]: Started Elasticsearch.
You can now verify Elasticsearch using the following command:
curl -X GET 'http://localhost:9200'
If everything is fine, you should get the following output:
{
"name" : "node-1",
"cluster_name" : "test cluster#",
"cluster_uuid" : "yA5vM_azSxu4oqGWB5lk4A",
"version" : {
"number" : "7.17.4",
"build_flavor" : "default",
"build_type" : "rpm",
"build_hash" : "79878662c54c886ae89206c685d9f1051a9d6411",
"build_date" : "2022-05-18T18:04:20.964345128Z",
"build_snapshot" : false,
"lucene_version" : "8.11.1",
"minimum_wire_compatibility_version" : "6.8.0",
"minimum_index_compatibility_version" : "6.0.0-beta1"
},
"tagline" : "You Know, for Search"
}
Step 4 - How to Use Elasticsearch
At this point, ElasticSearch is installed and running. Now, we will add some data and use manual queries to test the Elasticsearch functionality.
First, add some content to the Elastisearch using the Curl command:
curl -H 'Content-Type: application/json' -X POST 'http://localhost:9200/tutorial/helloworld/1' -d '{ "message": "Hello World!" }'
You should see the following output:
{"_index":"tutorial","_type":"helloworld","_id":"1","_version":1,"result":"created","_shards":{"total":2,"successful":1,"failed":0},"_seq_no":0,"_primary_term":1}
Now, run the following command the retrieve the added comment:
curl -X GET 'http://localhost:9200/tutorial/helloworld/1'
Sample output:
{"_index":"tutorial","_type":"helloworld","_id":"1","_version":1,"_seq_no":0,"_primary_term":1,"found":true,"_source":{ "message": "Hello World!" }}
If you want to modify the existing entry, run the following command:
curl -H 'Content-Type: application/json' -X PUT 'localhost:9200/tutorial/helloworld/1?pretty' -d ' {
"message": "Welcome Back!"
}'
Sample output:
{
"_index" : "tutorial",
"_type" : "helloworld",
"_id" : "1",
"_version" : 2,
"result" : "updated",
"_shards" : {
"total" : 2,
"successful" : 1,
"failed" : 0
},
"_seq_no" : 1,
"_primary_term" : 1
}
If you want to retrieve the modified data and display it in human-readable format, run the following command:
curl -X GET 'http://localhost:9200/tutorial/helloworld/1?pretty'
Sample output:
{
"_index" : "tutorial",
"_type" : "helloworld",
"_id" : "1",
"_version" : 2,
"_seq_no" : 1,
"_primary_term" : 1,
"found" : true,
"_source" : {
"message" : "Welcome Back!"
}
}
Conclusion
In the above guide, we explained how to install and use Elasticsearch on OracleLinux 8. You can now use Elasticsearch with your application to search and analyze data. Give it a try on your dedicated server from Atlantic.Net!
### Edge Security
Edge computing is an IT framework that challenges the traditional centralized computing model. Instead of relying solely on distant data centers or the cloud to handle data processing tasks, edge computing brings computation and data storage closer to the source of data generation.
This decentralization of computing resources enables faster processing and real-time analytics, reducing latency and enhancing users' overall system performance.
In this article, we will discover the intricate world of edge security, exploring its challenges, best practices, and the cutting-edge solutions available to ensure the safety and integrity of edge computing environments.
By understanding the vital role of edge security in edge computing, organizations can confidently embrace this transformative technology while safeguarding their sensitive data and preserving their digital ecosystem's security.
This is part of an extensive series of guides about information security.
Edge Security Device Risks
Edge computing devices, like IoT sensors and mobile Internet devices, are exposed to various security risks. To give you an idea of the vast scale of edge computing, there are estimated to be around 20 billion IoT devices, and that's just IoT sensors, not to mention other edge computing devices like smart devices, smart cameras, uCPE equipment, edge servers, and edge networking infrastructure.
The vast proliferation of these devices, and their often remote or unsecured locations, make them easy targets for malicious activity. With their direct access to the network, they can be used to infiltrate and compromise the entire enterprise network infrastructure, allowing attackers to steal sensitive data or disrupt business operations.
What Makes A Good Edge Security Solution?
Very early IoT devices had very weak security policies, and these early challenges prompted the ISACA to publish information concerning the most common weaknesses:
Insecure web interface
Insufficient authentication/authorization
Insecure network services
Lack of transport encryption
Privacy concerns
Insecure cloud interface
Insecure mobile interface
Insufficient security configurability
Insecure software/firmware
Poor physical security
A robust edge security solution must blend intrusion prevention systems, access control, and web filtering. It should protect data in transit and at rest, leveraging encryption and other security tools and protocols. Security controls that provide real-time threat detection and the ability to respond quickly to potential breaches are also critical.
Cloud networks, IoT, and computing on the edge
Cloud networks and IoT are driving the growth of edge computing, bringing computation and data storage closer to the data source. However, this shift also raises new edge security challenges.
Increased attack surface:
With the expansion of edge computing, the number of entry points for potential cyberattacks increases, providing more opportunities and tools for hackers to infiltrate systems and devices. Each IoT device can potentially be used as an access point to a corporate network, resulting in a much larger attack surface for hackers to target.
Vulnerabilities in IoT devices:
IoT devices are often built with cost-efficiency in mind, sacrificing robust security measures. This makes them attractive targets for cybercriminals seeking to exploit weaknesses in these devices for unauthorized device access or data theft.
Limited computational power:
Edge devices typically have limited processing capabilities compared to traditional data centers, making implementing complex security measures across multiple devices challenging and leaving many organizations susceptible to certain attacks.
Lack of standardized security protocols:
The rapid growth of edge computing has resulted in a lack of uniform security standards across different devices, cloud services, and networks. This lack of consistency can lead to gaps in protection and difficulties in managing security effectively.
Data privacy concerns:
Data privacy concerns of IoT devices at the network edge revolve around potential vulnerabilities and unauthorized access, as sensitive information is often transmitted and processed closer to the devices themselves, increasing security risks such as data breaches and misuse.
Implementing strong encryption protocols, regularly updating firmware and software, introducing secure authentication mechanisms, and establishing robust access controls are essential measures to safeguard IoT devices at the network edge, protecting data from potential threats and unauthorized access.
Latency and availability risks:
While edge computing aims to reduce latency, if security protocols hinder the efficient flow of data, it could affect system availability and responsiveness, leading to potential disruptions in critical operations.
To protect against latency and availability risks with edge security, implementing robust data caching, edge computing capabilities, and redundant communication channels can optimize data processing, minimize delays, and ensure continuous operation even during network disruptions.
Supply chain vulnerabilities:
As the edge computing ecosystem involves various components from different manufacturers and vendors, it becomes challenging to ensure the security of the entire supply chain, making it susceptible to compromise at any point in the chain.
To safeguard against supply chain vulnerabilities, organizations can implement stringent supplier vetting processes, establish end-to-end visibility across the supply chain, and diversify sourcing options to mitigate potential disruptions and reduce the impact of security breaches or logistical challenges.
Difficulty in monitoring and management:
With a distributed perimeter computing architecture, managing security across numerous devices and locations becomes more complex, making it harder for companies to monitor and respond promptly to security threats.
Insider threats:
The proliferation of edge computing may increase the potential for insider threats as individuals with access to edge devices or access control to networks might be tempted to misuse their privileges for personal gain or to harm the organization.
To mitigate insider threats, companies can implement access controls and least privilege principles, conduct regular employee training on cybersecurity best practices, monitor user activities, and establish a culture of trust and transparency while also encouraging employees to report any suspicious activities.
Regulatory challenges:
As edge computing crosses geographical boundaries, complying with different regional data protection and privacy regulations can be daunting, requiring organizations to navigate complex legal and compliance issues.
Addressing regulatory challenges requires organizations to stay updated on relevant laws and industry standards, establish comprehensive compliance programs, conduct regular audits, and collaborate with legal experts to ensure adherence to data privacy, security, and other regulatory requirements.
The best practices for edge computing security
"Zero Trust" is the cornerstone of edge computing security best practices. According to Fortinet, there are three core principles to Zero Trust at the network core and the edge.
Enhanced device visibility and segmentation
Strong identity-based access controls
Ability to secure endpoints on and off your corporate network
To safeguard edge devices within a public cloud infrastructure effectively, implementing a Zero Trust approach becomes essential. This approach ensures the physical security of connected devices and addresses the specific edge security requirements arising in growing industries. To protect your organization against potential threats at the edge, developing a comprehensive cloud security strategy that covers all aspects of edge security is imperative.
Implement Zero Trust Edge Access with Secure Access Service Edge (SASE)
Whether access attempts originate from within or outside the network, Zero Trust ensures that trust is never assumed by default. When combined with the robust SASE framework, organizations fortify their defenses by granting network access exclusively to authenticated and authorized users or devices.
Secure Access Service Edge (SASE) is a cloud-based networking and security model that unifies WAN capabilities with cloud-native security services. It prioritizes identity-centric access, Zero Trust security, and user-centric policy enforcement to simplify management, enhance security, manage and optimize performance for modern cloud-first and mobile-centric environments.
This powerful synergy bolsters protection and safeguards the corporate network k countless potential threats.
What does edge computing security look like today?
Securing edge environments is critical; organizations must extend their security policies beyond the confines of traditional networks and data centers to encompass all edge devices.
In particular, IoT and mobile devices have faced challenges in catching up with robust security controls. Early releases often lacked adequate security measures, which fortunately changed rapidly. Nevertheless, prioritizing the security of edge devices remains imperative.
Protecting your organization against the edge
Decentralized computing introduces unique security challenges that transcend traditional enterprise security measures. To ensure comprehensive protection, organizations must diligently address the distinctive risks associated with edge devices, including physical security and potential vulnerabilities arising from their location or configuration.
Implementing a robust and all-encompassing enterprise and edge security risk strategy can effectively mitigate these risks, safeguarding your organization against potential threats.
Atlantic.Net Network Edge Protection Managed Services
Are you looking for a way to protect your network from cyberattacks and malware? Atlantic.Net's Network Edge Protection managed services and tools can help you protect your network from threats, including DDoS attacks, web application attacks, and malware. With 24/7 monitoring and support, you can be confident that your network is always secure.
With Atlantic.Net, you get:
A team of experts that monitor your network 24/7 identifies and blocks threats and keeps your data safe.
A robust Web Application Firewall (WAF) that can block unauthorized content, including cross-site scripting attacks, and SQL injections
DDoS protection that can absorb Distributed Denial of Service (DDoS) attacks
Proactive maintenance and management
Scalability to meet your business needs
Atlantic.Net's Network Edge Protection managed services are backed by a 100% uptime SLA.
We have a proven track record of protecting our customers' networks from cyberattacks.
We offer a free consultation to help you assess your network security needs.
Protect your data, protect your reputation, and protect your future with Atlantic.Net's Network Edge Protection. Stay safe, stay secure, contact us now, and experience the peace of mind you deserve.
See Additional Guides on Key Information Security Topics
Together with our content partners, we have authored in-depth guides on several other topics that can also be useful as you explore the world of information security.
Vulnerability Assessment
Authored by CyCognito
[Guide] Vulnerability Assessment: Process, Challenges & Best Practices
[Guide] Complete Guide to Vulnerability Scanning
[Product] CyCognito | Proactively Secure Your Attack Surface
Insider Threat
Authored by Exabeam
[Guide] What is an Insider Threat? 4 Defensive Strategies
[Guide] How Privilege Escalation Works and 6 Ways to Prevent It
[Whitepaper] 2024 State of the Security Team Research
[Product] Exabeam | AI-Driven Security Operations
DDoS Protection
Authored by Radware
[Guide] Anti-DDoS: 6 Techniques, Solution Types & 8 Key Considerations
[Guide] DDoS Protection: Techniques, Types & 7 Solutions to Know in 2024
[Product] Radware DDoS Attack Mitigation and Defense
### How to Install Craft CMS with Nginx on Oracle Linux 8
Craft CMS is a free and open-source content management system used for creating custom digital experiences on the web. It is flexible, extensible, and designed for website owners who want more control and more powerful performances from their CMS. Craft CMS has a user-friendly web interface and offers tons of plugins that help you to add more functionality to your website. It is an alternative to WordPress for development-oriented publishers.
In this step-by-step guide, we will show you how to install Craft CMS with Nginx on OracleLinux 8.
Step 1 - Install LEMP Server
Before starting, you will need to install the Nginx web server, MariaDB database, PHP, and other required extensions to your server.
dnf install nginx mariadb-server -y
Once both packages are installed, you will need to install PHP version 8.0 and other required extensions on your server.
First, install the EPEL and Remi PHP repositories using the following command:
dnf install epel-release -y
dnf install dnf-utils http://rpms.remirepo.net/enterprise/remi-release-8.rpm -y
Next, disable the default PHP repository and enable the Remi PHP repository using the following command:
dnf module reset php
dnf module enable php:remi-8.0
Next, install PHP with all required extensions using the following command:
dnf install php php-cli php-fpm php-bcmath php-common php-curl php-gd php-json php-mbstring php-mysqli php-pgsql php-zip php-intl php-xml php-pdo -y
After installing all the packages, edit the php.ini file and change some recommended settings:
nano /etc/php.ini
Change the following settings:
memory_limit = 256M
date.timezone = Asia/Kolkata
Save and close the file, then edit the php-fpm configuration file and change the user and group from apache to nginx:
nano /etc/php-fpm.d/www.conf
Change the following lines:
user = nginx
group = nginx
Save and close the file then start Nginx, MariaDB, and PHP-FPM service and enable them to start at system reboot:
systemctl start nginx mariadb php-fpm
systemctl enable nginx mariadb php-fpm
Step 2 - Create a Database and User
Next, you will need to create a database and user for Craft CMS. First, log in to MySQL with the following command:
mysql
Once you are logged in, create a database and user with the following command:
create database craftdb;
grant all on craftdb.* to craftuser@localhost identified by 'securepassword';
Next, flush the privileges and exit from MariaDB with the following command:
flush privileges;
quit;
Step 3 - Install Composer
Composer is a dependency manager for PHP used for resolving PHP dependencies for your project.
First, download the Composer setup PHP file with the following command:
php -r "copy('https://getcomposer.org/installer', 'composer-setup.php');"
Next, fetch the Composer Hash value and match it with the downloaded file:
HASH="$(wget -q -O - https://composer.github.io/installer.sig)"
php -r "if (hash_file('SHA384', 'composer-setup.php') === '$HASH') { echo 'Installer verified'; } else { echo 'Installer corrupt'; unlink('composer-setup.php'); } echo PHP_EOL;"
If everything is fine, you should get the following output:
Installer verified
Next, run the following command to install Composer on your system:
php composer-setup.php --install-dir=/usr/local/bin --filename=composer
Once Composer is installed, verify the Composer version using the following command:
composer -V
You should get the following output:
Composer version 2.3.5 2022-04-13 16:43:00
Step 4 - Install Craft CMS
First, navigate to the Nginx web root directory and download the latest version of Craft CMS using the Composer tool:
cd /var/www/html/
composer create-project craftcms/craft craft
During the installation, you will be asked to provide database credentials, admin username, password, and Craft URL as shown below:
> @php craft setup/welcome
______ .______ ___ _______ .___________.
/ || _ \ / \ | ____|| |
| ,----'| |_) | / ^ \ | |__ `---| |----`
| | | / / /_\ \ | __| | |
| `----.| |\ \----./ _____ \ | | | |
\______|| _| `._____/__/ \__\ |__| |__|
A N E W I N S T A L L
______ .___ ___. _______.
/ || \/ | / |
| ,----'| \ / | | (----`
| | | |\/| | \ \
| `----.| | | | .----) |
\______||__| |__| |_______/
Generating an application ID ... done (CraftCMS--be1f09c9-cd35-4bfe-a01b-d611282eea19)
Generating a security key ... done (HaBt-G01s1pwVPNXmb1iAQZDI0M1lpuh)
Welcome to Craft CMS!
Are you ready to begin the setup? (yes|no) [no]:yes
Generating an application ID ... done (CraftCMS--f06f8153-f389-4603-97b7-c683b8cd422d)
Which database driver are you using? [mysql,pgsql,?]: mysql
Database server name or IP address: [127.0.0.1]
Database port: [3306]
Database username: [root] craftuser
Database password:
Database name: craftdb
Database table prefix:
Testing database credentials ... success!
Saving database credentials to your .env file ... done
Install Craft now? (yes|no) [yes]:yes
Username: [admin]
Email: admin@example.com
Password:
Confirm:
Site name: mysite
Site URL: http://craft.example.com
Site language: [en-US]
installed Craft successfully (time: 6.230s)
Generating project config files from the loaded project config ... done
Next, change the ownership of the Craft CMS directory and PHP session directory to Nginx:
chown -R nginx:nginx /var/www/html/craft
chown -R nginx:nginx /var/lib/php/session
Step 5 - Configure Nginx for Craft CMS
Next, you will need to create an Nginx virtual host configuration file for Craft CMS. You can create it with the following command:
nano /etc/nginx/conf.d/craft.conf
Add the following configuration:
server {
listen 80;
server_name craft.example.com;
root /var/www/html/craft/web;
index index.php;
location / {
try_files $uri/index.html $uri $uri/ /index.php?$query_string;
}
location ~ [^/]\.php(/|$) {
try_files $uri $uri/ /index.php?$query_string;
fastcgi_split_path_info ^(.+\.php)(/.+)$;
fastcgi_pass unix:/run/php-fpm/www.sock;
fastcgi_index index.php;
include fastcgi_params;
fastcgi_param SCRIPT_FILENAME $document_root$fastcgi_script_name;
fastcgi_param PATH_INFO $fastcgi_path_info;
fastcgi_param HTTP_PROXY "";
}
}
Save the file, then edit the Nginx main configuration file:
nano /etc/nginx/nginx.conf
Define the hash bucket size:
http {
server_names_hash_bucket_size 64;
Next, verify Nginx for any syntax configuration error using the following command:
nginx -t
You should get the following output:
nginx: the configuration file /etc/nginx/nginx.conf syntax is ok
nginx: configuration file /etc/nginx/nginx.conf test is successful
Finally, restart the Nginx service to apply the changes:
systemctl restart nginx
Step 6 - Access Craft CMS
Now, open your web browser and access the Craft CMS website using the URL http://craft.example.com. You should see the following screen:
Click on the Go to your control panel. You will be redirected to the Craft CMS login page:
Provide your admin username, password, and click on the Login button. You should see the Craft CMS dashboard on the following screen:
Conclusion
In this post, we explained how to install Craft CMS with Nginx on OracleLinux 8. You can now explore the Craft CMS and start building your website easily from the Craft CMS dashboard. Give it a try on your dedicated server from Atlantic.Net!
### How to Install Jenkins on Oracle Linux 8
Jenkins is a powerful, free automation tool used in the software development life cycle. It is a Java-based tool that allows you to build, test and deploy code automatically. Jenkins offers many plugins built for Continuous Integration purposes. It allows developers to integrate changes to the project and send a fresh build to users. Jenkins is cross-platform so it can be installed on all major operating systems. It has more than 147,000 active installations and over 1 million users around the world.
In this post, we will show you how to install Jenkins on Oracle Linux 8.
Step 1 - Install Java
Jenkins is a Java-based tool, so Java must be installed on your server. If not installed you can install it using the following command:
dnf install java-11-openjdk -y
Once the Java is installed, verify the Java version using the following command:
java --version
Sample output:
openjdk 11.0.15 2022-04-19 LTS
OpenJDK Runtime Environment 18.9 (build 11.0.15+10-LTS)
OpenJDK 64-Bit Server VM 18.9 (build 11.0.15+10-LTS, mixed mode, sharing)
Step 2 - Add Jenkins Repository
By default, Jenkins is not included in the OracleLinux 8 default repository so you will need to create a Jenkins repo on your system. You can create it using the following command:
wget -O /etc/yum.repos.d/jenkins.repo https://pkg.jenkins.io/redhat-stable/jenkins.repo
Next, download and import the Jenkins GPG key with the following command:
rpm --import https://pkg.jenkins.io/redhat-stable/jenkins.io.key
Next, verify the Jenkins repo using the following command:
dnf repolist
Sample output:
repo id repo name
appstream Oracle Linux 8 - AppStream
baseos Oracle Linux 8 - BaseOS
extras Oracle Linux 8 - Extras
jenkins Jenkins-stable
Step 3 - Install Jenkins
Now you can install Jenkins using the following command:
dnf install jenkins --nobest
Once Jenkins is installed, start Jenkins and enable it to start at system reboot:
systemctl start jenkins
systemctl enable jenkins
You can now check the status of Jenkins using the following command:
systemctl status jenkins
Sample output:
● jenkins.service - Jenkins Continuous Integration Server
Loaded: loaded (/usr/lib/systemd/system/jenkins.service; disabled; vendor preset: disabled)
Active: active (running) since Sun 2022-05-29 13:23:56 EDT; 8s ago
Main PID: 13177 (java)
Tasks: 50 (limit: 23694)
Memory: 1.1G
CGroup: /system.slice/jenkins.service
└─13177 /usr/bin/java -Djava.awt.headless=true -jar /usr/share/java/jenkins.war --webroot=/var/cache/jenkins/war --httpPort=8080
May 29 13:23:38 oraclelinux8 jenkins[13177]: Please use the following password to proceed to installation:
May 29 13:23:38 oraclelinux8 jenkins[13177]: 000a6fdc7f9d4d05b39029d776f34fd6
May 29 13:23:38 oraclelinux8 jenkins[13177]: This may also be found at: /var/lib/jenkins/secrets/initialAdminPassword
May 29 13:23:38 oraclelinux8 jenkins[13177]: *************************************************************
May 29 13:23:56 oraclelinux8 jenkins[13177]: 2022-05-29 17:23:56.786+0000 [id=45] INFO h.m.DownloadService$Downloadable#load: O>
May 29 13:23:56 oraclelinux8 jenkins[13177]: 2022-05-29 17:23:56.787+0000 [id=45] INFO hudson.util.Retrier#start: Performed the>
May 29 13:23:56 oraclelinux8 jenkins[13177]: 2022-05-29 17:23:56.790+0000 [id=45] INFO hudson.model.AsyncPeriodicWork#lambda$do>
May 29 13:23:56 oraclelinux8 jenkins[13177]: 2022-05-29 17:23:56.963+0000 [id=29] INFO jenkins.InitReactorRunner$1#onAttained: >
May 29 13:23:57 oraclelinux8 jenkins[13177]: 2022-05-29 17:23:56.993+0000 [id=22] INFO hudson.lifecycle.Lifecycle#onReady: Jenk>
May 29 13:23:56 oraclelinux8 systemd[1]: Started Jenkins Continuous Integration Server.
By default, Jenkins listens on port 8080. You can verify it with the following command:
ss -antpl | grep 8080
Sample output:
LISTEN 0 50 *:8080 *:* users:(("java",pid=13177,fd=117))
Step 4 - Configure Nginx as a Reverse Proxy for Jenkins
It is a good idea to install and configure Nginx as a reverse proxy for Jenkins. First, install the Nginx web server with the following command:
dnf install nginx -y
After installing Nginx, create an Nginx configuration file for Jenkins:
nano /etc/nginx/conf.d/jenkins.conf
Add the following lines:
upstream jenkins {
server 127.0.0.1:8080 fail_timeout=0;
}
server {
listen 80;
server_name jenkins.example.com;
location / {
proxy_set_header Host $host:$server_port;
proxy_set_header X-Real-IP $remote_addr;
proxy_set_header X-Forwarded-For $proxy_add_x_forwarded_for;
proxy_set_header X-Forwarded-Proto $scheme;
proxy_pass http://jenkins;
# Required for new HTTP-based CLI
proxy_http_version 1.1;
proxy_request_buffering off;
proxy_buffering off; # Required for HTTP-based CLI to work over SSL
}
}
Save and close the file when you are finished. Then, edit the Nginx main configuration file:
nano /etc/nginx/nginx.conf
Define the hash bucket size as shown below:
http {
server_names_hash_bucket_size 64;
Next, verify Nginx for any syntax errors:
nginx -t
Sample output:
nginx: the configuration file /etc/nginx/nginx.conf syntax is ok
nginx: configuration file /etc/nginx/nginx.conf test is successful
Finally, start the Nginx service and enable it to start at system reboot:
systemctl start nginx
systemctl enable nginx
Step 5 - Access Jenkins Dashboard
Now, you can access the Jenkins web interface using the URL http://jenkins.example.com from the web browser. You should see the following screen:
Now, open your terminal and retrieve the Jenkins setup password using the following command:
cat /var/lib/jenkins/secrets/initialAdminPassword
Sample output:
000a6fdc7f9d4d05b39029d776f34fd6
Now, paste the above password and click on the Continue button. You should see the following screen:
Now, select ‘Install using suggested plugins‘ or ‘Select plugins to install‘. You should see the following screen:
Now, provide your admin user information and click on the Save and Continue button. You should see the following screen:
Now, provide your Jenkins URL and click on the Save and Finish button. You should see the following screen:
Click on the Start Using Jenkins. You should see the Jenkins Dashboard on the following screen:
Conclusion
In this post, we explained how to install Jenkins on OracleLinux 8 with Nginx as a reverse proxy. You can now use Jenkins in your software development environment and automate the development process with ease. Give it a try on your dedicated server from Atlantic.Net!
### How to Install WordPress on Oracle Linux 8
WordPress is a free, open-source, self-hosted CMS software solution that allows you to host a blog or website on the internet. It is very popular for beginners who don't know how to code a website. WordPress is secure, fast, customizable, and comes with tons of themes and plugins that help you to extend the functionality of your website. It is written in PHP and uses MySQL/MariaDB as a database backend. This popular platform is a great choice for getting a website up and running quickly.
commerce.
In this post, we will explain how to install WordPress using a LAMP stack on OracleLinux 8.
Step 1 - Install LAMP Stack
Before starting, install the LAMP stack components like Apache web server and MariaDB using the following command:
dnf install httpd mariadb-server -y
After installing both packages, you will need to install PHP and other PHP extensions to your system.
First, reset the default PHP 7.2 with the following command:
dnf module reset php
Next, enable PHP version 7.4 using the following command:
dnf module enable php:7.4 -y
Next, install PHP 7.4 with other extensions using the following command:
dnf install php php-fpm php-cli php-json php-gd php-mbstring php-pdo php-xml php-mysqlnd php-pecl-zip curl -y
Once all the packages are installed, start and enable Apache, PHP-FPM, and MariaDB services using the following command:
systemctl start httpd mariadb php-fpm
systemctl enable httpd mariadb php-fpm
Step 2 - Create a Database for WordPress
WordPress uses MySQL/MariaDB to store the contents, so you will need to create a database and user for WordPress:
First, connect to the MariaDB with the following command:
mysql
Once you are connected, create a database and user with the following command:
CREATE DATABASE wordpressdb;
CREATE USER `wordpressuser`@`localhost` IDENTIFIED BY 'securepassword';
Next, grant all the privileges to the WordPress database using the following command:
GRANT ALL ON wordpressdb.* TO `wordpressuser`@`localhost`;
Next, flush the privileges and exit from the MariaDB with the following command:
FLUSH PRIVILEGES;
EXIT;
Step 3 - Download WordPress
Next, change the directory to the Apache default web root directory and download the latest version of WordPress with the following command:
cd /var/www/html
curl https://wordpress.org/latest.tar.gz --output wordpress.tar.gz
Once the download is completed, extract the downloaded file with the following command:
tar xf wordpress.tar.gz
Next, change the directory to WordPress and rename the WordPress configuration file:
cd wordpress
mv wp-config-sample.php wp-config.php
Next, edit the WordPress configuration file and define your database settings:
nano wp-config.php
Change the following lines:
/** The name of the database for WordPress */
define( 'DB_NAME', 'wordpressdb' );
/** Database username */
define( 'DB_USER', 'wordpressuser' );
/** Database password */
define( 'DB_PASSWORD', 'securepassword' );
Next, set proper ownership of the WordPress directory with the following command:
chown -R apache:apache /var/www/html/wordpress
chmod -R 755 /var/www/html/wordpress
Step 4 - Configure Apache to Host WordPress
Next, you will need to create an Apache virtual host file to host the WordPress. You can create it with the following command:
nano /etc/httpd/conf.d/wordpress.conf
Add the following lines:
ServerAdmin root@localhost
ServerName wordpress.example.com
DocumentRoot /var/www/html/wordpress
Options Indexes FollowSymLinks
AllowOverride all
Require all granted
ErrorLog /var/log/httpd/wordpress_error.log
CustomLog /var/log/httpd/wordpress_access.log common
Save and close the file, then restart the Apache service to apply the configuration changes:
systemctl restart httpd
Step 5 - Access WordPress Installer
Now, open your web browser and access the WordPress installer using the URL http://wordpress.example.com. You should see the following screen:
Select your language and click on the Continue button. You will be redirected to the following screen:
Provide your site information and click on the Install WordPress button. You should see the following screen:
Click on the Log In button. You should see the following screen:
Provide your admin username and password and click on the Log In button. You should see the WordPress dashboard on the following screen:
Conclusion
In the above guide, we learned how to install WordPress with LAMP on OracleLinux 8. You can now install the necessary plugins and themes and start creating your first website from the WordPress dashboard. Give it a try on your dedicated server from Atlantic.Net!
### How to Install Apache Spark on Fedora
Apache Spark is a free and open-source analytics engine used for executing data engineering, data science, and machine learning on a single server or cluster. It is a distributed processing system that utilizes in-memory caching to perform processing tasks on very large data sets. Some of the key features of Apache Spark are shown below.
Fault tolerance.
Dynamic In Nature.
Lazy Evaluation.
Real-Time Stream Processing.
Speed.
Reusability.
Advanced Analytics.
In Memory Computing.
This post will show you how to install Apache Spark on Fedora.
Step 1 - Install Java JDK
Apache Spark is written in Java, so Java JDK must be installed on your server. You can install it with the following command.
dnf install java-11-openjdk-devel -y
Once Java is installed, you can verify the Java installation using the following command.
java --version
Output:
openjdk 11.0.15 2022-04-19
OpenJDK Runtime Environment 18.9 (build 11.0.15+10)
OpenJDK 64-Bit Server VM 18.9 (build 11.0.15+10, mixed mode, sharing)
Step 2 - Install Apache Spark
First, download the latest version of Apache Spark using the wget command.
wget https://dlcdn.apache.org/spark/spark-3.4.1/spark-3.4.1-bin-hadoop3.tgz
After the successful download, extract the downloaded file with the following command.
tar -xvf spark-3.4.1-bin-hadoop3.tgz
Next, move the extracted directory to the /opt directory.
mv spark-3.4.1-bin-hadoop3 /opt/spark
Next, add a user to run Spark then set the ownership of the Spark directory.
useradd spark
chown -R spark:spark /opt/spark
Step 3 - Create a Systemd Service File
Next, create a systemd service file to manage the Spark master service.
nano /etc/systemd/system/spark-master.service
Add the following configurations.
[Unit]
Description=Apache Spark Master
After=network.target
[Service]
Type=forking
User=spark
Group=spark
ExecStart=/opt/spark/sbin/start-master.sh
ExecStop=/opt/spark/sbin/stop-master.sh
[Install]
WantedBy=multi-user.target
Save and close the file, then create a service file for Spark slave.
nano /etc/systemd/system/spark-slave.service
Add the following configurations.
[Unit]
Description=Apache Spark Slave
After=network.target
[Service]
Type=forking
User=spark
Group=spark
ExecStart=/opt/spark/sbin/start-slave.sh spark://your-server-ip:7077
ExecStop=/opt/spark/sbin/stop-slave.sh
[Install]
WantedBy=multi-user.target
Save and close the file, then reload the systemd daemon.
systemctl daemon-reload
Next, start and enable the Spark master service.
systemctl start spark-master
systemctl enable spark-master
You can check the Spark master status using the following command.
systemctl status spark-master
Output:
● spark-master.service - Apache Spark Master
Loaded: loaded (/etc/systemd/system/spark-master.service; disabled; vendor preset: disabled)
Active: active (running) since Sat 2023-06-24 04:26:29 EDT; 4s ago
Process: 16172 ExecStart=/opt/spark/sbin/start-master.sh (code=exited, status=0/SUCCESS)
Main PID: 16184 (java)
Tasks: 34 (limit: 9497)
Memory: 209.8M
CPU: 17.803s
CGroup: /system.slice/spark-master.service
└─16184 /usr/lib/jvm/java-11-openjdk-11.0.15.0.10-1.fc34.x86_64/bin/java -cp /opt/spark/conf/:/opt/spark/jars/* -Xmx1g org.apache.spark.deploy.master.Mast>
Jun 24 04:26:25 fedora systemd[1]: Starting Apache Spark Master...
Jun 24 04:26:25 fedora start-master.sh[16178]: starting org.apache.spark.deploy.master.Master, logging to /opt/spark/logs/spark-spark-org.apache.spark.deploy.master.Ma>
Jun 24 04:26:29 fedora systemd[1]: Started Apache Spark Master.
Step 4 - Access Spark Web Interface
At this point, Spark is installed and running on port 8080. Now, open your web browser and access Apache Spark using the URL http://your-server-ip:8080. You should see the Spark dashboard on the following screen.
Now, start and enable the Spark slave service with the following command.
systemctl start spark-slave
systemctl enable spark-slave
Now, go back to the Spark web interface and reload the page. You should see that a new worker node has been added to the Spark.
Conclusion
In this tutorial, you learned how to install Apache Spark on Fedora. You can now start creating your machine learning and data science project and deploy it using Apache Spark. You can now deploy Apache Spark on dedicated server hosting from Atlantic.Net!
### How to Install and Configure Wireguard VPN Server on Fedora
WireGuard is an open-source and modern VPN solution known for its simplicity and ease of use. Initially designed for Linux, it is now also available for MacOS, BSD, IOS, and Android. Compared to other VPN software, WireGuard is simple and easy to set up. It also provides client apps for desktops and mobile devices from the platform app store. If you are looking for a simple and user-friendly VPN solution then WireGuard is the best option for you.
This post will show you how to install WireGuard VPN on Fedora.|
Step 1 - Enable IP Forwarding
Before starting, you will need to set up IP forwarding on your server. To do so, create a new file.
nano /etc/sysctl.d/99-custom.conf
Add the following line.
net.ipv4.ip_forward=1
Save and close the file, then apply the above configuration with the following command.
sysctl -p /etc/sysctl.d/99-custom.conf
Step 2 - Install WireGuard VPN
First, install the WireGuard package using the following command.
dnf install wireguard-tools -y
Next, generate a public and private key using the following command.
wg genkey | tee /etc/wireguard/privatekey | wg pubkey | tee /etc/wireguard/publickey
You will see the generated key in the following output.
LR9Sv+v+wRat5+Ui4gbfSamfNFIjce6hbG5UJATD3Tc=
Step 3 - Configure WireGuard VPN
Next, create a new configuration file with the following command.
nano /etc/wireguard/wg0.conf
Add the following configurations.
[Interface]
Address = 10.0.0.1/24
SaveConfig = true
ListenPort = 51820
PrivateKey =
PostUp = firewall-cmd --zone=public --add-port 51820/udp && firewall-cmd --zone=public --add-masquerade
PostDown = firewall-cmd --zone=public --remove-port 51820/udp && firewall-cmd --zone=public --remove-masquerade
Note: Replace the PrivateKey with your generated private key.
Now, start the firewalld service with the following command.
systemctl start firewalld
Step 4 - Enable WireGuard Interface
At this point, WireGuard is installed and configured. Now, you can bring up the WireGuard interface with the following command.
wg-quick up wg0
You will see the following output.
[#] ip link add wg0 type wireguard
[#] wg setconf wg0 /dev/fd/63
[#] ip -4 address add 10.0.0.1/24 dev wg0
[#] ip link set mtu 1420 up dev wg0
[#] firewall-cmd --zone=public --add-port 51820/udp && firewall-cmd --zone=public --add-masquerade
success
You can verify your WireGuard installation with the following command.
wg show wg0
If everything is fine, you will see the following output.
interface: wg0
public key: 0xQfsv/vwayO9aesmpD25t6DGmgF74daHXHLv4n3XW4=
private key: (hidden)
listening port: 51820
Next, enable the WireGuard interface to start at system boot.
systemctl enable wg-quick@wg0
Step 5 - Install and Configure WireGuard Client
First, install the WireGuard VPN client on the client machine.
dnf install wireguard-tools -y
Next, generate a public and private key with the following command.
wg genkey | tee /etc/wireguard/privatekey | wg pubkey | tee /etc/wireguard/publickey
Output:
SRF4C7HGesORyRhguW44OG0eSOz2u80la2QmtWAUbVU=
Next, create a WireGuard client configuration file.
nano /etc/wireguard/wg0.conf
Add the following lines.
[Interface]
PrivateKey = SRF4C7HGesORyRhguW44OG0eSOz2u80la2QmtWAUbVU=
Address = 10.0.0.2/24
[Peer]
PublicKey = LR9Sv+v+wRat5+Ui4gbfSamfNFIjce6hbG5UJATD3Tc=
Endpoint = server-ip:51820
AllowedIPs = 0.0.0.0/0
Note: Replaced PrivateKey with your client key and PublicKey with your server key.
Now, run the following command on your server machine to add your client key.
wg set wg0 peer SRF4C7HGesORyRhguW44OG0eSOz2u80la2QmtWAUbVU= allowed-ips 10.0.0.2
Note: Replaced SRF4C7HGesORyRhguW44OG0eSOz2u80la2QmtWAUbVU with your key generated on the client machine.
Finally, bring up the WireGuard interface on the client machine.
wg-quick up wg0
Output:
[#] ip link add wg0 type wireguard
[#] wg setconf wg0 /dev/fd/63
[#] ip -4 address add 10.0.0.2/24 dev wg0
[#] ip link set mtu 1420 up dev wg0
[#] wg set wg0 fwmark 51820
Now, go back to your server machine and verify your VPN connection using the following command.
wg
You should see the allocated IP address of the client machine in the following output.
interface: wg0
public key: 0xQfsv/vwayO9aesmpD25t6DGmgF74daHXHLv4n3XW4=
private key: (hidden)
listening port: 51820
peer: SRF4C7HGesORyRhguW44OG0eSOz2u80la2QmtWAUbVU=
allowed ips: 10.0.0.2/32
Conclusion
In this post, we showed you how to install the WireGuard VPN server on Fedora. You can now use VPN to protect your users by encrypting user data and masking their IP addresses. You can now try to implement WireGuard VPN on dedicated server hosting from Atlantic.Net!
### How to Install and Configure Samba Server on Fedora
Samba is an open-source implementation of SMB networking protocol used for sharing files and printers across different operating systems. It helps system administrators to share files between multiple operating systems. Samba can also be used to join a Linux machine to Windows active directory domain controller. If you are looking for an open-source file-sharing solution, then Samba is the best choice for you.
In this post, we will show you how to install the Samba server on Fedora.
Step 1 - Install Samba Server
By default, the Samba package is included in the Fedora default repository. You can install it with other packages using the following command.
dnf install samba samba-common samba-client
Once all the packages are installed, you can proceed to the next step.
Step 2 -Create a Samba User
Next, you will need to create a user and group to control access on Samba Share.
Let's create a new user using the following command.
useradd smbuser
Next, set a password for the Samba user.
smbpasswd -a smbuser
Set the password as shown below.
New SMB password:
Retype new SMB password:
Added user smbuser.
Next, create a Samba group with the following command.
groupadd smbgroup
Next, add smbuser to smbgroup.
usermod -g smbgroup smbuser
Step 3 -Create a Public Share with Samba
With Samba, you can create a public share for all users in a network. It can be accessed without providing a user or password.
First, create a directory for Public share using the following command.
mkdir -p /data/share/public
Next, set the permission and ownership to the Public share.
chmod -R 755 /data/share/public
chown -R nobody:nobody /data/share/public
Next, create some files inside the Public directory.
cd /data/share/public
touch public1 public2
Next, back up the Samba main configuration file and create a new one.
mv /etc/samba/smb.conf /etc/samba/smb.conf.bak
nano /etc/samba/smb.conf
Add the following lines to define your public share.
[global]
workgroup = WORKGROUP
server string = Samba Server %v
netbios name = sambaserver
security = user
map to guest = bad user
dns proxy = no
ntlm auth = true
[Public]
path = /data/share/public
browsable =yes
writable = yes
guest ok = yes
read only = no
Save and close the file, then test the configuration with the following command.
testparm
Next, start and enable both smb and nmb services.
systemctl start smb nmb
systemctl enable smb nmb
Step 4 -Verify Public Share
Now, you can verify your Public share using the following command.
smbclient -L samba-server-ip
Just press the enter key without providing any password to list your share.
Enter WORKGROUP\root's password:
Sharename Type Comment
--------- ---- -------
Public Disk
IPC$ IPC IPC Service (Samba Server 4.14.12)
SMB1 disabled -- no workgroup available
Next, access the Public share with the following command.
smbclient //samba-ip-address/public
You will get into the Samba share.
Enter WORKGROUP\root's password:
Try "help" to get a list of possible commands.
Run the following command to list all files inside the public share directory.
smb: \> ls
You will see both files in the following output.
. D 0 Fri Jun 23 22:45:10 2023
.. D 0 Fri Jun 23 22:49:40 2023
public1 N 0 Fri Jun 23 22:45:10 2023
public2 N 0 Fri Jun 23 22:45:10 2023
52416512 blocks of size 1024. 50410328 blocks available
Step 5 - Create a Private Share with Samba
Private share is very useful when you want to control access to the share.
Let's create a private share with the following command.
mkdir -p /data/share/private
Next, create two files inside the private share.
cd /data/share/private
touch private1 private2
Now, set permissions and ownership on the private share.
chmod -R 770 /data/share/private
chown -R root:smbgroup /data/share/private
Now, edit the Samba configuration file.
nano /etc/samba/smb.conf
Add the following configurations to define your private share.
[Private]
path = /data/share/private
valid users = @smbgroup
guest ok = no
writable = no
browsable = yes
Save and close the file, then restart both services to apply the changes.
systemctl restart smb nmb
Step 6 - Verify Private Share
Now, you can access your private share using the following command.
smbclient //samba-ip-address/private -U smbuser
Provide your smbuser password to access the share as shown below.
Enter WORKGROUP\smbuser's password:
Try "help" to get a list of possible commands.
smb: \> ls
. D 0 Fri Jun 23 22:50:26 2023
.. D 0 Fri Jun 23 22:49:40 2023
private1 N 0 Fri Jun 23 22:50:26 2023
private2 N 0 Fri Jun 23 22:50:26 2023
52416512 blocks of size 1024. 50410392 blocks available
smb: \>
To exit from the Samba shell, run the following command.
smb: \> exit
Conclusion
In this post, we explained how to install the Samba server on Fedora. We also showed you how to create a public and private share with Samba. You can now use this solution in your local network to share files between multiple systems. You can now share files and folders with Samba on dedicated server hosting from Atlantic.Net!
### How to Install Netdata Monitoring Tool on Fedora
Netdata is a scalable, distributed, real-time monitoring tool for Linux-based operating systems. It is used to monitor CPU, Memory, Processes, Network bandwidth, Database, and more via a web-based interface. It helps system administrators to find and troubleshoot system-related issues. It is written in C, Python, Javascript and can be installed on all major Linux operating systems.
This guide will show you how to install the Netdata monitoring tool on Fedora.
Step 1 - Install Netdata
Netdata package is included in the Fedora default repository. You can install it easily using the following command.
dnf install netdata -y
Once Netdata is installed, you can start the Netdata service and enable it to start at system reboot with the following command.
systemctl start netdata
systemctl enable netdata
To check the status of Netdata, use the following command.
systemctl status netdata
Output:
● netdata.service - Real time performance monitoring
Loaded: loaded (/usr/lib/systemd/system/netdata.service; disabled; vendor preset: disabled)
Active: active (running) since Fri 2023-06-23 23:57:02 EDT; 4s ago
Process: 3549 ExecStartPre=/bin/mkdir -p /var/cache/netdata (code=exited, status=0/SUCCESS)
Process: 3550 ExecStartPre=/bin/chown -R netdata:netdata /var/cache/netdata (code=exited, status=0/SUCCESS)
Process: 3551 ExecStartPre=/bin/mkdir -p /var/run/netdata (code=exited, status=0/SUCCESS)
Process: 3552 ExecStartPre=/bin/chown -R netdata:netdata /var/run/netdata (code=exited, status=0/SUCCESS)
Main PID: 3553 (netdata)
Tasks: 31 (limit: 2328)
Memory: 41.9M
CPU: 1.637s
CGroup: /system.slice/netdata.service
├─3553 /usr/sbin/netdata -P /var/run/netdata/netdata.pid -D
├─3555 /usr/sbin/netdata --special-spawn-server
├─3681 /usr/bin/bash /usr/libexec/netdata/plugins.d/tc-qos-helper.sh 1
├─3682 /usr/libexec/netdata/plugins.d/apps.plugin 1
├─3689 /usr/bin/python3 /usr/libexec/netdata/plugins.d/python.d.plugin 1
└─3690 /usr/libexec/netdata/plugins.d/nfacct.plugin 1
By default, Netdata listens on port 19999. You can check it with the following command.
ss -antpl | grep 19999
Output.
LISTEN 0 4096 127.0.0.1:19999 0.0.0.0:* users:(("netdata",pid=3553,fd=7))
LISTEN 0 4096 [::1]:19999 [::]:* users:(("netdata",pid=3553,fd=6))
Step 2 - Configure Netdata
By default, Netdata can be accessed only from the local host, so if you want to access Netdata from the remote system then you will need to edit the Netdata configuration file and bind it with the server IP.
nano /etc/netdata/netdata.conf
Find the following line.
bind to = localhost
And replace it with the following line.
bind to = your-server-ip
Save and close the file, then restart the Netdata service to apply the changes.
systemctl restart netdata
Step 3 - Monitor System Performance with Netdata
Now, open your web browser and access the Netdata web UI using the URL http://your-server-ip:19999. You should see the Netdata dashboard.
Disk
RAM
Network
Swap
Conclusion
In this post, we explained how to install the Netdata monitoring tool on Fedora. We also showed you how to enable remote access for Netdata. You can now implement Netdata on your server to monitor all major system metrics via a central dashboard. Now, use Netdata to monitor system performance on dedicated server hosting from Atlantic.Net!
### How to Install Tinyproxy on Fedora
Tinyproxy is a lightweight, free, and open-source proxy solution for the Linux operating system. It is designed for embedded devices where a full-featured HTTP proxy is required, but the system resources for a larger proxy are unavailable. It is easy to install and configure and requires a little amount of space on operating systems. It offers a filtering capability to block or allow a certain domain by creating a blacklist and whitelist.
This post will show you how to install a Tinyproxy on Fedora.
Step 1 - Install Tinyproxy
By default, the Tinyproxy package is included in the Fedora default repository. You can install it using the following command.
dnf update -y
dnf install tinyproxy -y
Once the installation is completed, you can verify the Tinyproxy version using the following command.
tinyproxy -v
Output.
tinyproxy 1.10.0
Step 2 - Configure Tinyproxy
Next, you will need to edit the Tinyproxy main configuration file and modify some default settings.
nano /etc/tinyproxy/tinyproxy.conf
Change the following configurations.
Port 8888
Listen your-server-ip
LogFile "/var/log/tinyproxy/tinyproxy.log"
PidFile "/var/run/tinyproxy/tinyproxy.pid"
BasicAuth user password
Allow client-machine-ip
Save and close the file, then create a log file for Tinyproxy.
touch /var/log/tinyproxy/tinyproxy.log
Step 3 - Start Tinyproxy Service
Now, start and enable the Tinyproxy service using the following command.
systemctl start tinyproxy
systemctl enable tinyproxy
You can now check the status of Tinyproxy with the following command.
systemctl status tinyproxy
You will see the following output.
● tinyproxy.service - small, efficient HTTP/SSL proxy daemon
Loaded: loaded (/usr/lib/systemd/system/tinyproxy.service; disabled; vendor preset: disabled)
Active: active (running) since Fri 2023-06-23 22:59:12 EDT; 3s ago
Docs: man:tinyproxy(8)
Process: 1967 ExecStart=/usr/bin/tinyproxy (code=exited, status=0/SUCCESS)
Main PID: 1969 (tinyproxy)
Tasks: 11 (limit: 2328)
Memory: 4.6M
CPU: 23ms
CGroup: /system.slice/tinyproxy.service
├─1969 /usr/bin/tinyproxy
├─1970 /usr/bin/tinyproxy
├─1971 /usr/bin/tinyproxy
├─1972 /usr/bin/tinyproxy
├─1973 /usr/bin/tinyproxy
├─1974 /usr/bin/tinyproxy
├─1975 /usr/bin/tinyproxy
├─1976 /usr/bin/tinyproxy
├─1977 /usr/bin/tinyproxy
├─1978 /usr/bin/tinyproxy
└─1979 /usr/bin/tinyproxy
By default, Tinyproxy listens on port 8888. You can check it with the following command.
ss -antpl | grep tinyproxy
Output.
LISTEN 0 1024 104.219.55.141:8888 0.0.0.0:* users:(("tinyproxy",pid=1979,fd=0),("tinyproxy",pid=1978,fd=0),("tinyproxy",pid=1977,fd=0),("tinyproxy",pid=1976,fd=0),("tinyproxy",pid=1975,fd=0),("tinyproxy",pid=1974,fd=0),("tinyproxy",pid=1973,fd=0),("tinyproxy",pid=1972,fd=0),("tinyproxy",pid=1971,fd=0),("tinyproxy",pid=1970,fd=0),("tinyproxy",pid=1969,fd=0))
Step 4 - Define Proxy Settings on Web Browser
Next, you will need to edit your browser settings and define your proxy server on the client machine. First, open your web browser and open the settings windows.
Scroll down the page and click on Settings. You should see the following screen.
Define your proxy server IP, Port, and click on the OK button to save the changes.
Now, open another tab on your web browser and try to access https://google.com. You will be asked to provide your proxy username and password as shown below.
Provide your username and password and click on the Sign in button. After successful authentication, you can able to access the Google website.
Conclusion
In this tutorial, we have explained how to install Tinyproxy on Fedora. We also showed you how to configure Tinyproxy and verify it from the client machine. You can use Tinyproxy on dedicated server hosting from Atlantic.Net!
### How to Install and Configure Memcached on Fedora
Memcached is an open-source and high-performance memory caching system used to speed up dynamic websites by caching data in memory. Generally, it is used to cache API calls, database, and page rendering chunks. It uses an in-memory data store to provide website users with cached elements quickly. Memcached is simple, lightweight, easy to use, and flexible in terms of application development.
In this tutorial, we will show you how to install Memcached on Fedora.
Step 1 - Install Memcached
By default, the Memcached package is included in the Fedora default repo. You can install it using the following commands.
dnf update -y
dnf install memcached libmemcached -y
Once Memcached is installed, start and enable the Memcached service with the following command.
systemctl start memcached
systemctl enable memcached
You can verify the status of Memcached with the following command.
systemctl status memcached
Output.
● memcached.service - memcached daemon
Loaded: loaded (/usr/lib/systemd/system/memcached.service; disabled; vendor preset: disabled)
Active: active (running) since Sat 2023-06-24 03:40:40 EDT; 3s ago
Main PID: 10494 (memcached)
Tasks: 10 (limit: 9497)
Memory: 1.6M
CPU: 29ms
CGroup: /system.slice/memcached.service
└─10494 /usr/bin/memcached -p 11211 -u memcached -m 64 -c 1024 -l 127.0.0.1,::1
Jun 24 03:40:40 fedora systemd[1]: Started memcached daemon.
By default, Memcached listens on port 11211. You can check it with the following command.
ss -antpl | grep memcached
Output.
LISTEN 0 1024 127.0.0.1:11211 0.0.0.0:* users:(("memcached",pid=10494,fd=27))
LISTEN 0 1024 [::1]:11211 [::]:* users:(("memcached",pid=10494,fd=28))
The Memcached default configuration file is located at /etc/sysconfig/memcached. You can check the default options with the following command.
cat -n /etc/sysconfig/memcached
Output:
1 PORT="11211"
2 USER="memcached"
3 MAXCONN="1024"
4 CACHESIZE="64"
5 OPTIONS="-l 127.0.0.1,::1"
You can check the above options as per your requirements.
Step 2 - Enable Memcached for PHP Application
If you want to use Memcached for PHP-based applications then you will need to install the Memcached PHP extensions to your server. You can install it with the following command.
dnf install php-pecl-memcache php-pecl-memcached -y
Step 3 - Verify Memcached for PHP
To verify Memcached, first install Nginx and PHP.
dnf install nginx php php-cli -y
Next, create a sample PHP info file.
nano /var/www/html/info.php
Add the following code.
Save and close the file, then create a symlink of the info.php file.
ln -s /var/www/html/info.php /usr/share/nginx/html/
Next, start and enable the Nginx with the following command.
systemctl start nginx
systemctl enable nginx
Now, open your web browser and access the PHP info page using the URL http://your-server-ip/info.php.
Conclusion
In this post, we explained how to install Memcached on Fedora. Then, we explained how to use Memcached with PHP and verify it. You can now use Memcached to help speed up your PHP applications. Try to use Memcached on dedicated server hosting from Atlantic.Net!
### How to Install and Configure Ansible on Fedora
Ansible is an open-source automation tool sponsored by Red Hat. It is written in Python and makes it easier to configure systems and deploy software on multiple servers from the central server. Ansible is cross-platform and primarily intended for IT professionals for application deployment, server updates, configuration management, and many day-to-day tasks.
In this post, we will show you how to install Ansible on Fedora.
Step 1 - Install Ansible
By default, the Ansible package is included in the Fedora default repo. You can install it easily using the following command.
dnf install ansible -y
Once Ansible is installed, you can verify the Ansible version using the following command.
ansible --version
Output:
ansible 2.9.27
config file = /etc/ansible/ansible.cfg
configured module search path = ['/root/.ansible/plugins/modules', '/usr/share/ansible/plugins/modules']
ansible python module location = /usr/lib/python3.9/site-packages/ansible
executable location = /usr/bin/ansible
python version = 3.9.5 (default, May 14 2021, 00:00:00) [GCC 11.1.1 20210428 (Red Hat 11.1.1-1)]
Step 2 - Setting Up SSH Key-Based Authentication
Next, you will need to set up an SSH key-based authentication between the Ansible host and a remote host. First, create an SSH key pair on the Ansible host with the following command.
ssh-keygen -t rsa
You will see the generated key in the following output.
Generating public/private rsa key pair.
Enter file in which to save the key (/root/.ssh/id_rsa):
Created directory '/root/.ssh'.
Enter passphrase (empty for no passphrase):
Enter same passphrase again:
Your identification has been saved in /root/.ssh/id_rsa
Your public key has been saved in /root/.ssh/id_rsa.pub
The key fingerprint is:
SHA256:aPKqkVGXq7wmohJ/nCCZon730+x5Wrxeo+3K091Sr4o root@fedora
The key's randomart image is:
+---[RSA 3072]----+
| |
| . |
| . o |
| . . o |
| o. . + S |
|* .+ = . .|
|o+ooo.. o o.o..o|
|+ oo=+ . o++=.o.o|
|=oo=+ ..o+E*=+.o |
+----[SHA256]-----+
Next, copy the generated SSH key to the remote host with the following command.
ssh-copy-id root@remote-host-ip
Output:
/usr/bin/ssh-copy-id: INFO: Source of key(s) to be installed: "/root/.ssh/id_rsa.pub"
The authenticity of host '192.168.200.200 (192.168.200.200)' can't be established.
ED25519 key fingerprint is SHA256:qBNfJ6Vud/6TCt9bHOa1JwouYDrVuU5g/JhfAxfu3FM.
This key is not known by any other names
Are you sure you want to continue connecting (yes/no/[fingerprint])? yes
/usr/bin/ssh-copy-id: INFO: attempting to log in with the new key(s), to filter out any that are already installed
/usr/bin/ssh-copy-id: INFO: 1 key(s) remain to be installed -- if you are prompted now it is to install the new keys
root@192.168.200.200's password:
Number of key(s) added: 1
Now try logging into the machine, with: "ssh 'root@192.168.200.200'"
and check to make sure that only the key(s) you wanted were added.
Step 3 - Configure Ansible Inventory
Next, you will need to edit the Ansible inventory file and define your remote host IP address and SSH username.
nano /etc/ansible/hosts
Add the following configuration at the end of the file.
[fedora]
server1 ansible_host=remote-host-ip ansible_user=root
[all:vars]
ansible_python_interpreter=/usr/bin/python3
Save and close the file, then verify your added configuration using the following command.
ansible-inventory --list -y
You will see the following output.
all:
children:
fedora:
hosts:
server1:
ansible_host: 192.168.200.200
ansible_user: root
ungrouped: {}
ansible --list-hosts all
hosts (1):
server1
Step 4 - Use Ansible to Manage Remote Host
At this point, Ansible is installed and configured to manage the remote host. Now, let's get our hands dirty with Ansible.
First, check the connectivity between the Ansible host and the remote host using the following command.
ansible -m ping all
If the connection is successful, you will see the following output.
server1 | SUCCESS => {
"changed": false,
"ping": "pong"
}
To verify the operating system version of the remote host, run the following command.
ansible -m shell -a "cat /etc/fedora-release" fedora
After the successful command execution, you will see the following output.
server1 | CHANGED | rc=0 >>
Fedora release 34 (Thirty Four)
To install Nginx on the remote host, run the following command.
ansible -m shell -a "dnf install nginx" fedora
To verify the Nginx installation, run the following command.
ansible -m shell -a "nginx -v" fedora
Output:
server1 | CHANGED | rc=0 >>
nginx version: nginx/1.20.2
To check the uptime of the remote host, run the following command.
ansible -m shell -a "uptime" fedora
Output:
server1 | CHANGED | rc=0 >>
04:15:35 up 3:53, 2 users, load average: 0.24, 0.14, 0.05
If you want to check the disk space of the remote host, run the following command.
ansible -m shell -a "df -h" fedora
Output:
server1 | CHANGED | rc=0 >>
Filesystem Size Used Avail Use% Mounted on
devtmpfs 3.9G 0 3.9G 0% /dev
tmpfs 3.9G 124K 3.9G 1% /dev/shm
tmpfs 1.6G 664K 1.6G 1% /run
/dev/sda1 160G 4.0G 157G 3% /
tmpfs 3.9G 168K 3.9G 1% /tmp
tmpfs 796M 0 796M 0% /run/user/0
Conclusion
In this tutorial, we showed you how to install Ansible on Fedora. Then, we explained how to configure Ansible to manage remote hosts with hands-on examples. You can now use Ansible to manage and monitor multiple servers from the central place. You can try Ansible to manage multiple servers on dedicated server hosting from Atlantic.Net!
### How to Install Fail2Ban to Secure SSH Server on Fedora
Fail2ban is an open-source intrusion prevention tool used to add firewall rules to reject IP addresses for a specified amount of time. It is written in Python and designed to protect servers from brute-force attacks. Fail2ban continuously monitors the system logs for any malicious activity and scans files for any entries matching identified patterns. If any matching pattern is found, then Fail2ban blocks the destination IP for a specified amount of time.
In this post, we will show you how to install Fail2ban to protect the SSH server on Fedora.
Step 1 - Install Fail2ban
By default, Fail2ban is included in the Fedora default repository. You can install it by running the following command.
dnf install fail2ban -y
Once the Fail2ban is installed, start and enable the Fail2ban service using the following command.
systemctl start fail2ban
systemctl enable fail2ban
Step 2 - Configure Fail2ban
Next, you will need to create a Fail2ban configuration file for SSH service. You can create it with the following command.
nano /etc/fail2ban/jail.local
Add the following lines.
[DEFAULT]
ignoreip = your-server-ip
bantime = 300
findtime = 300
maxretry = 3
banaction = iptables-multiport
backend = systemd
[sshd]
enabled = true
Save and close the file, then restart the Fail2ban to apply the changes.
systemctl restart fail2ban
You can also check the status of Fail2ban with the following command.
systemctl status fail2ban
Output.
● fail2ban.service - Fail2Ban Service
Loaded: loaded (/usr/lib/systemd/system/fail2ban.service; disabled; vendor preset: disabled)
Active: active (running) since Sat 2023-06-24 03:55:11 EDT; 7s ago
Docs: man:fail2ban(1)
Process: 12514 ExecStartPre=/bin/mkdir -p /run/fail2ban (code=exited, status=0/SUCCESS)
Main PID: 12515 (fail2ban-server)
Tasks: 5 (limit: 9497)
Memory: 11.4M
CPU: 257ms
CGroup: /system.slice/fail2ban.service
└─12515 /usr/bin/python3 -s /usr/bin/fail2ban-server -xf start
Jun 24 03:55:11 fedora systemd[1]: Starting Fail2Ban Service...
Jun 24 03:55:11 fedora systemd[1]: Started Fail2Ban Service.
Jun 24 03:55:11 fedora fail2ban-server[12515]: Server ready
Step 3 - Verify Fail2ban
At this point, Fail2ban is installed and configured to protect your SSH server. Now, it's time to verify it.
First, check the added SSH service using the following command.
fail2ban-client status
Output.
Status
|- Number of jail: 1
`- Jail list: sshd
Try to connect your SSH server from any remote machine with an incorrect password three times.
ssh root@your-server-ip
After three failed attempts you are blocked from authentication for five minutes.
Now, run the following command on your SSH server to check the IP address blocked by Fail2ban.
fail2ban-client status sshd
You will see the following output.
Status for the jail: sshd
|- Filter
| |- Currently failed: 3
| |- Total failed: 12
| `- Journal matches: _SYSTEMD_UNIT=sshd.service + _COMM=sshd
`- Actions
|- Currently banned: 1
|- Total banned: 2
`- Banned IP list: 190.1.81.12
You can also check the log file to see the blocked IP.
tail -5 /var/log/secure | grep 'Failed password'
Output:
June 24 03:15:03 fedora sshd[11196]: Failed password for invalid user root from 190.1.81.12 port 55738 ssh2
If you want to unblock the blocked IP address, run the following command.
fail2ban-client set sshd unbanip 190.1.81.12
You can also block this IP again using the following command.
fail2ban-client set sshd banip 190.1.81.12
Conclusion
In this post, we explained how to secure an SSH server with Fail2ban on Fedora. We also showed you how to monitor Fail2ban via the command line. You can now use Fail2ban to help protect your server against DDoS attacks; try implementing Fail2ban on dedicated server hosting from Atlantic.Net!
### How to Install Apache with Nginx as a Reverse Proxy on Fedora
Apache and Nginx are very popular and powerful web servers used to host websites on the internet. Each web server has its own pros and cons.
When you are planning to host multiple websites on a single server which has varied requirements, you should use Apache as a web server and use Nginx as a reverse proxy server in front of the Apache webserver to handle a large number of requests.
This post will show you how to use Nginx as a reverse proxy in front of the Apache web server on Fedora.
Step 1 - Install Apache and PHP
First, install Apache and PHP packages with the following command.
dnf install httpd php php-cli -y
Next, you will need to configure Apache to run as a backend web server on a non-standard port. You can do it by editing the Apache main configuration file.
nano /etc/httpd/conf/httpd.conf
Change the listen port from 80 to 8080 as shown below.
Listen 8080
Save and close the file, then restart the Apache service to implement the changes.
systemctl restart httpd
Next, verify the Apache listening port using the following command.
ss -antpl | grep httpd
You will see the following output.
LISTEN 0 511 *:8080 *:* users:(("httpd",pid=11652,fd=4),("httpd",pid=11651,fd=4),("httpd",pid=11650,fd=4),("httpd",pid=11648,fd=4))
Now, create a sample PHP file to test the Apache server.
nano /var/www/html/info.php
Add the following code.
Save and close the file, then open your web browser and access the PHP page using the URL http://your-server-ip:8080/info.php. You will see the following screen.
Step 2 - Configure Nginx as a Reverse Proxy
Now, you will need to configure Nginx as a reverse proxy for the Apache backend server.
First, install the Nginx server with the following command.
dnf install nginx -y
Next, start and enable the Nginx service with the following command.
systemctl start nginx
systemctl enable nginx
Next, create an Nginx virtual host configuration file.
nano /etc/nginx/conf.d/proxy.conf
Add the following lines.
server {
listen 80;
server_name test.example.com;
location ~ \.php$ {
proxy_pass http://your-server-ip:8080;
proxy_set_header Host $host;
proxy_set_header X-Real-IP $remote_addr;
proxy_set_header X-Forwarded-For $proxy_add_x_forwarded_for;
proxy_set_header X-Forwarded-Proto $scheme;
}
}
Save and close the file, then restart the Nginx service to apply the changes.
systemctl restart nginx
Step 3 - Verify Nginx Server
At this point, Nginx is installed and configured as a reverse proxy for the Apache server. You can now access your PHP page via Nginx using the URL http://test.example.com.
Conclusion
In this post, we showed you how to install Apache and configured it as a backend server. Then, we explained how to use Nginx as a reverse proxy to forward all requests to the Apache web server. Now you can implement high-performance websites on a single server. You can now try to use Nginx as a reverse proxy on dedicated server hosting from Atlantic.Net!
### How to Install and Configure Nagios on Fedora
Nagios is a free and open-source monitoring solution that helps system administrators keep an eye on network infrastructure. It allows you to add and monitor remote servers, switches, and routers from a single place. Nagios offers a lot of plugins that help you to add additional functionality to your server. Nagios makes it easier to quickly detect any issues on servers and send alerts to minimize application downtime for users.
In this tutorial, we will show you how to install the Nagios monitoring server on Fedora.
Step 1 - Install Required Dependencies
Before starting, you will need to install Apache, PHP, and additional required dependencies on your server. You can install all of them using the following command.
dnf install httpd httpd-tools php gcc glibc glibc-common gd gd-devel make net-snmp openssl-devel -y
Once all the packages are installed, you can proceed to the next step.
Step 2 - Install Nagios
By default, the Nagios package is not available in the Fedora default repo, so you will need to compile it from the source.
First, add a Nagios user and add it to the Nagios group.
useradd nagios
usermod -G nagios nagios
Also, add the Apache user to the Nagios group.
usermod -G nagios apache
Next, create a directory for Nagios.
mkdir /root/nagios
Then, navigate inside the Nagios directory and download the latest version of Nagios and Nagios plugins.
cd /root/nagios
wget https://assets.nagios.com/downloads/nagioscore/releases/nagios-4.4.9.tar.gz
wget https://nagios-plugins.org/download/nagios-plugins-2.3.3.tar.gz
Next, extract both downloaded files.
tar -xf nagios-4.4.9.tar.gz
tar -xf nagios-plugins-2.3.3.tar.gz
Next, change the directory to the extracted directory and configure it with the following command.
cd nagios-4.4.9/
./configure --with-command-group=nagios
Output:
General Options:
-------------------------
Nagios executable: nagios
Nagios user/group: nagios,nagios
Command user/group: nagios,nagios
Event Broker: yes
Install ${prefix}: /usr/local/nagios
Install ${includedir}: /usr/local/nagios/include/nagios
Lock file: /run/nagios.lock
Check result directory: /usr/local/nagios/var/spool/checkresults
Init directory: /lib/systemd/system
Apache conf.d directory: /etc/httpd/conf.d
Mail program: /bin/mail
Host OS: linux-gnu
IOBroker Method: epoll
Web Interface Options:
------------------------
HTML URL: http://localhost/nagios/
CGI URL: http://localhost/nagios/cgi-bin/
Traceroute (used by WAP): /usr/bin/traceroute
Next, install the Nagios using the following command.
make all
make install
Next, install the Init script, command mode, and sample configuration files using the following command.
make install-init
make install-commandmode
make install-config
Next, install the Nagios web interface using the following command.
make install-webconf
Next, create a user and password for Nagios.
htpasswd -s -c /usr/local/nagios/etc/htpasswd.users nagiosadmin
Set your password as shown below.
New password:
Re-type new password:
Adding password for user nagiosadmin
Next, restart the Apache service to apply the changes.
systemctl restart httpd
Step 3 - Install Nagios Plugins
First, change the directory to the Nagios plugins and configure it with the following command.
cd /root/nagios/nagios-plugins-2.3.3
./configure --with-nagios-user=nagios --with-nagios-group=nagios
Now, install it with the following command.
make
make install
Now, verify the Nagios configuration using the following command.
/usr/local/nagios/bin/nagios -v /usr/local/nagios/etc/nagios.cfg
If everything is fine, you will see the following output.
Checking objects...
Checked 8 services.
Checked 1 hosts.
Checked 1 host groups.
Checked 0 service groups.
Checked 1 contacts.
Checked 1 contact groups.
Checked 24 commands.
Checked 5 time periods.
Checked 0 host escalations.
Checked 0 service escalations.
Checking for circular paths...
Checked 1 hosts
Checked 0 service dependencies
Checked 0 host dependencies
Checked 5 timeperiods
Checking global event handlers...
Checking obsessive compulsive processor commands...
Checking misc settings...
Total Warnings: 0
Total Errors: 0
Things look okay - No serious problems were detected during the pre-flight check
Step 4 - Start Nagios Service
At this point, Nagios is installed on your server. Now, enable the Apache and Nagios service using the following command.
systemctl enable nagios
systemctl enable httpd
Then, restart the Nagios service to apply the changes.
systemctl restart nagios
You can verify the status of Nagios using the following command.
systemctl status nagios
You will see the following output.
● nagios.service - Nagios Core 4.4.9
Loaded: loaded (/usr/lib/systemd/system/nagios.service; disabled; vendor preset: disabled)
Active: active (running) since Sat 2023-06-24 06:46:41 EDT; 8s ago
Docs: https://www.nagios.org/documentation
Process: 47713 ExecStartPre=/usr/local/nagios/bin/nagios -v /usr/local/nagios/etc/nagios.cfg (code=exited, status=0/SUCCESS)
Process: 47714 ExecStart=/usr/local/nagios/bin/nagios -d /usr/local/nagios/etc/nagios.cfg (code=exited, status=0/SUCCESS)
Main PID: 47715 (nagios)
Tasks: 6 (limit: 4666)
Memory: 5.0M
CPU: 81ms
CGroup: /system.slice/nagios.service
├─47715 /usr/local/nagios/bin/nagios -d /usr/local/nagios/etc/nagios.cfg
├─47717 /usr/local/nagios/bin/nagios --worker /usr/local/nagios/var/rw/nagios.qh
├─47718 /usr/local/nagios/bin/nagios --worker /usr/local/nagios/var/rw/nagios.qh
├─47719 /usr/local/nagios/bin/nagios --worker /usr/local/nagios/var/rw/nagios.qh
├─47720 /usr/local/nagios/bin/nagios --worker /usr/local/nagios/var/rw/nagios.qh
└─47721 /usr/local/nagios/bin/nagios -d /usr/local/nagios/etc/nagios.cfg
Step 5 - Access Nagios Web Interface
At this point, Nagios is installed and running on your server. Now, open your web browser and access the Nagios web UI using the URL http://your-server-ip/nagios. You will see the Nagios login screen.
Provide your username, password and click on the Sign in button. After the successful authentication, you should see the Nagios dashboard.
Click on the Hosts in the left pane, you will see your host information on the following screen.
Conclusion
In this post, we showed you how to install Nagios from the source on Fedora. You can now add remote servers to your Nagios server and start monitoring them from the Nagios UI. Try to implement the Nagios monitoring server on dedicated server hosting from Atlantic.Net!
### How to Install GlassFish Server on Fedora
GlassFish is an open-source platform used to host Java applications. It allows web developers to easily build scalable and portable Java applications. GlassFish also enables high availability clustering and load balancing and supports different user authentication methods such as file-based, LDAP, certificate, JDBC, digest, PAM, Solaris, and custom realms.
In this post, we will show you how to install GlassFish 7 on Fedora.
Step 1 - Install Java JDK
GlassFish is a Java-based application, so you will need to install Java JDK on your server. You can install it using the following command.
dnf install java-11-openjdk
After the Java installation, you can verify the Java version using the following command.
java -version
Output.
openjdk version "11.0.15" 2022-04-19
OpenJDK Runtime Environment 18.9 (build 11.0.15+10)
OpenJDK 64-Bit Server VM 18.9 (build 11.0.15+10, mixed mode, sharing)
Step 2 - Install GlassFish
First, create a dedicated user to run GlassFish.
useradd -m -d /opt/glassfish6 -U -s /bin/false glassfish
Next, download the latest version of GlassFish using the following command.
wget https://www.eclipse.org/downloads/download.php?file=/ee4j/glassfish/glassfish-7.0.5.zip -O glassfish-7.0.5.zip
Next, unzip the downloaded file with the following command.
unzip glassfish-7.0.5.zip
Next, move the extracted directory to the /opt directory.
mv glassfish7 /opt/glassfish
Next, change the ownership of the glassfish directory.
chown -R glassfish:glassfish /opt/glassfish
Step 3 - Create a Systemd Service File
Next, you will need to create a systemd service file to manage the GlassFish service via systemctl command.
nano /lib/systemd/system/glassfish.service
Add the following configurations.
[Unit]
Description = GlassFish Server v7
After = syslog.target network.target
[Service]
User=glassfish
ExecStart=/opt/glassfish/bin/asadmin start-domain
ExecReload=/opt/glassfish/bin/asadmin restart-domain
ExecStop=/opt/glassfish/bin/asadmin stop-domain
Type = forking
[Install]
WantedBy = multi-user.target
Save and close the file, then reload the systemd daemon to apply the changes.
systemctl daemon-reload
Now, start and enable the GlassFish service.
systemctl start glassfish
systemctl enable glassfish
You can also check the GlassFish status with the following command.
systemctl status glassfish
You will see the following output.
● glassfish.service - GlassFish Server v7
Loaded: loaded (/usr/lib/systemd/system/glassfish.service; disabled; vendor preset: disabled)
Active: active (running) since Sat 2023-06-24 06:58:42 EDT; 7s ago
Process: 48226 ExecStart=/opt/glassfish/bin/asadmin start-domain (code=exited, status=0/SUCCESS)
Main PID: 48246 (java)
Tasks: 95 (limit: 4666)
Memory: 334.8M
CPU: 35.922s
CGroup: /system.slice/glassfish.service
└─48246 /usr/lib/jvm/java-11-openjdk-11.0.15.0.10-1.fc34.x86_64/bin/java -cp /opt/glassfish/glassfish/modules/glassfish.jar -DWALL_CLOCK_START=2023-06-24T>
Jun 24 06:58:24 fedora systemd[1]: Starting GlassFish Server v7...
Step 4 - Set GlassFish Admin Password
By default, the GlassFish default admin password is not set, so you will need to set it before login GlassFish via web browser. You can set the admin password using the following command.
sudo -u glassfish /opt/glassfish/bin/asadmin --port 4848 change-admin-password
You will be asked to provide the username.
Enter admin user name [default: admin]>admin
Provide the admin user and hit the Enter key. You will be asked to provide the admin password.
Enter the admin password>
Just press the Enter key. You will be asked to set a new password.
Enter the new admin password>
Enter the new admin password again>
Command change-admin-password executed successfully.
By default, GlassFish web-based login is disabled, so you will also need to enable it via command line.
sudo -u glassfish /opt/glassfish/bin/asadmin --port 4848 enable-secure-admin
Provide your admin password to enable the secure login.
Enter admin user name> admin
Enter admin password for user "admin">
You must restart all running servers for the change in secure admin to take effect.
Command enable-secure-admin executed successfully.
Finally, restart the GlassFish service to apply the changes.
systemctl restart glassfish
Step 5 - Access GlassFish Web UI
At this point, GlassFish is installed and configured. Now, open your web browser and access the GlassFish test page using the URL http://your-server-ip:8080.
You can also access the GlassFish admin panel using the URL http://your-server-ip:4848. You should see the GlassFish login screen.
Provide your admin username and password and click on Login. You should see the GlassFish dashboard on the following screen.
Conclusion
In this post, we showed you how to install GlassFish on Fedora. We also set the GlassFish admin password and enable the secure login. You can now start deploying your Java application using the GlassFish platform. You can now deploy GlassFish on dedicated server hosting from Atlantic.Net!
### How to Install Monit Monitoring Tool on Fedora
Monit is a free, lightweight, low-resource usage monitoring solution for Linux-based operating systems. It is easy to set up and can monitor different services, CPU usage, memory usage, uptime, load, and more. It also restarts any services automatically if it fails. If there are problems, one or more recipients will be informed by email. You can configure Monit to monitor server applications, network connections and services, harddisks, sha1 checksum of files, size change, timestamp, folder change, and more.
This post will show you how to install the Monit monitoring tool on Fedora.
Step 1 - Install Monit
By default, the Monit package is included in the Fedora default repo. You can install it easily using the following command.
dnf install monit
Once the Monit is installed, you can run it using the following command.
monit
Output.
New Monit id: d6c8428d05bae2b22aabf013036d2919
Stored in '/root/.monit.id'
Starting Monit 5.30.0 daemon with http interface at [localhost]:2812
You can now check basic system information using the following command.
monit status
Output.
Monit 5.30.0 uptime: 0m
System 'fedora'
status OK
monitoring status Monitored
monitoring mode active
on reboot start
load average [0.50] [0.25] [0.15]
cpu 0.0%usr 0.0%sys 0.0%nice 0.0%iowait 0.0%hardirq 0.0%softirq 0.0%steal 0.0%guest 0.0%guestnice
memory usage 282.6 MB [14.3%]
swap usage 0 B [0.0%]
uptime 15m
boot time Tue, 06 Jun 2023 12:46:10
filedescriptors 1888 [0.0% of 9223372036854775807 limit]
data collected Tue, 06 Jun 2023 13:01:05
Step 2 - Configure Monit
Next, you must edit the Monit configuration file to set an admin password, enable the web UI, and allow outside access.
nano /etc/monitrc
Change the following lines.
set httpd port 2812
#use address localhost => only accept connection from localhost (drop if you use M/Monit)
use address 0.0.0.0
allow 0.0.0.0/0
allow admin:monit
Save and close the file, then reload the Monit to apply the changes.
monit reload
Step 3 - Access Monit Web UI
At this point, Monit is installed and listens on port 2812. Now, open your web browser and access the Monit web dashboard using the URL http://your-server-ip:2812. You should see the Monit monitoring dashboard on the following screen.
Provide your Monit admin username and password and click the Sign in button. You should see the Monit dashboard on the following screen.
Step 4 - Monitor Nginx with Monit
To monitor a service, you will need to configure Monit for that service. In this section, we will configure Monit to monitor the Nginx service.
First, install the Nginx package using the following command.
dnf install nginx
Next, start and enable the Nginx service to start at system reboot.
systemctl start nginx
systemctl enable nginx
Next, create a new Monit configuration file.
nano /etc/monit.d/nginx-monitor
Add the following configurations.
check process nginx with pidfile /run/nginx.pid
start program "/usr/bin/systemctl start nginx.service"
stop program "/usr/bin/systemctl stop nginx.service"
if failed port 80 protocol http then restart
Save and close the file, then verify Monit for any syntax errors.
monit -t
Output.
Control file syntax OK
Next, reload the Monit service to implement the changes.
monit reload
Next, monitor the Nginx service via the command line.
monit status
You should see the Nginx service status in the following output.
Monit 5.30.0 uptime: 2m
Process 'nginx'
status OK
monitoring status Monitored
monitoring mode active
on reboot start
pid 2201
parent pid 1
uid 0
effective uid 0
gid 0
uptime 0m
threads 1
children 1
cpu -
cpu total -
memory 0.1% [1.2 MB]
memory total 0.3% [6.1 MB]
security attribute kernel
filedescriptors 13 [1.3% of 1024 limit]
total filedescriptors 30
read bytes 0 B/s [0 B total]
disk read bytes 0 B/s [0 B total]
disk read operations 0.0 reads/s [0 reads total]
write bytes 0 B/s [0 B total]
disk write bytes 0 B/s [0 B total]
disk write operations 0.0 writes/s [0 writes total]
port response time 0.882 ms to localhost:80 type TCP/IP protocol HTTP
data collected Tue, 06 Jun 2023 13:06:21
System 'fedora'
status OK
monitoring status Monitored
monitoring mode active
on reboot start
load average [0.78] [0.34] [0.18]
cpu 0.9%usr 0.9%sys 0.0%nice 0.0%iowait 0.1%hardirq 0.1%softirq 2.4%steal 0.0%guest 0.0%guestnice
memory usage 287.2 MB [14.5%]
swap usage 0 B [0.0%]
uptime 20m
boot time Tue, 06 Jun 2023 12:46:10
filedescriptors 1920 [0.0% of 9223372036854775807 limit]
data collected Tue, 06 Jun 2023 13:06:21
You can also open the Monit dashboard to monitor Nginx via a web browser.
Step 5 - Verify Monit Functionality
One of the best advantages of Monit is that it can start any service automatically if it stops. Let's stop the Nginx service using the following command to test it.
systemctl stop nginx
Next, verify the log file to check whether the Monit starts the Nginx service.
tail -f /var/log/messages
The following output indicates that the Nginx service is started automatically by Monit.
Jun 6 13:07:51 fedora monit[1263]: 'nginx' process is not running
Jun 6 13:07:51 fedora monit[1263]: 'nginx' trying to restart
Jun 6 13:07:51 fedora monit[1263]: 'nginx' start: '/usr/bin/systemctl start nginx.service'
Jun 6 13:07:51 fedora systemd[1]: Starting The nginx HTTP and reverse proxy server...
Jun 6 13:07:51 fedora nginx[2242]: nginx: the configuration file /etc/nginx/nginx.conf syntax is ok
Jun 6 13:07:51 fedora nginx[2242]: nginx: configuration file /etc/nginx/nginx.conf test is successful
Jun 6 13:07:51 fedora systemd[1]: Started The nginx HTTP and reverse proxy server.
Jun 6 13:07:51 fedora audit[1]: SERVICE_START pid=1 uid=0 auid=4294967295 ses=4294967295 subj=kernel msg='unit=nginx comm="systemd" exe="/usr/lib/systemd/systemd" hostname=? addr=? terminal=? res=success'
You can also check the Nginx active status with the following command.
systemctl status nginx
Output.
● nginx.service - The nginx HTTP and reverse proxy server
Loaded: loaded (/usr/lib/systemd/system/nginx.service; disabled; vendor preset: disabled)
Active: active (running) since Tue 2023-06-06 13:07:51 EDT; 22s ago
Process: 2241 ExecStartPre=/usr/bin/rm -f /run/nginx.pid (code=exited, status=0/SUCCESS)
Process: 2242 ExecStartPre=/usr/sbin/nginx -t (code=exited, status=0/SUCCESS)
Process: 2243 ExecStart=/usr/sbin/nginx (code=exited, status=0/SUCCESS)
Main PID: 2244 (nginx)
Tasks: 2 (limit: 2328)
Memory: 2.2M
CPU: 80ms
CGroup: /system.slice/nginx.service
├─2244 nginx: master process /usr/sbin/nginx
└─2245 nginx: worker process
Jun 06 13:07:51 fedora systemd[1]: Starting The nginx HTTP and reverse proxy server...
Jun 06 13:07:51 fedora nginx[2242]: nginx: the configuration file /etc/nginx/nginx.conf syntax is ok
Jun 06 13:07:51 fedora nginx[2242]: nginx: configuration file /etc/nginx/nginx.conf test is successful
Jun 06 13:07:51 fedora systemd[1]: Started The nginx HTTP and reverse proxy server.
Conclusion
This post explained how to install and configure the Monit monitoring solution on Fedora Linux. You can now add more services to Monit and start monitoring them from the central dashboard. You can deployMonit monitoring solution on VPS hosting from Atlantic.Net!
### How to Install Teamspeak 3 Server on Fedora
TeamSpeak is a popular open-source VoIP communication system for online gaming. It is very similar to a telephone conference call and is used for audio communication between users on a chat channel. It is cross-platform and allows multiple users to talk or listen to other TeamSpeak users. It offers a wide range of features including good voice quality, less bandwidth usage, in-game overlay, real-time communication, an intuitive user interface, and more.
In this post, we will show you how to install a TeamSpeak server on Fedora.
Step 1 - Install TeamSpeak Server
First, you will need to install some dependencies on your server. You can install all of them with the following command.
dnf update -y
dnf install nano wget perl tar net-tools bzip2
Next, create a dedicated user to run the TeamSpeak server.
adduser teamspeak -d /opt/teamspeak
Next, download the latest version of TeamSpeak from its official website.
wget https://files.teamspeak-services.com/releases/server/3.13.7/teamspeak3-server_linux_amd64-3.13.7.tar.bz2
Once the download is finished, extract the downloaded file.
tar -xvjf teamspeak3-server_linux_amd64-3.13.7.tar.bz2
Next, move the extracted directory to /opt and change its ownership.
mv teamspeak3-server_linux_amd64/* /opt/teamspeak/
chown -R teamspeak: /opt/teamspeak
Next, create a license file for the TeamSpeak server.
touch /opt/teamspeak/.ts3server_license_accepted
Step 2 - Create a Systemd Service File
Next, you will need to create a systemd service file to manage the TeamSpeak service. You can create it with the following command.
nano /lib/systemd/system/teamspeak.service
Add the following configurations.
[Unit]
Description=Team Speak 3 Server
After=network.target
[Service]
WorkingDirectory=/opt/teamspeak/
User=teamspeak
Group=teamspeak
Type=forking
ExecStart=/opt/teamspeak/ts3server_startscript.sh start inifile=ts3server.ini
ExecStop=/opt/teamspeak/ts3server_startscript.sh stop
PIDFile=/opt/teamspeak/ts3server.pid
RestartSec=15
Restart=always
[Install]
WantedBy=multi-user.target
Save and close the file, then reload the systemd daemon to apply the changes.
systemctl --system daemon-reload
Then, start the TeamSpeak service and enable it to start at system reboot.
systemctl start teamspeak
systemctl enable teamspeak
You can check the status of TeamSpeak using the following command.
systemctl status teamspeak
Output.
● teamspeak.service - Team Speak 3 Server
Loaded: loaded (/usr/lib/systemd/system/teamspeak.service; disabled; vendor preset: disabled)
Active: active (running) since Tue 2023-06-06 03:27:55 EDT; 4s ago
Process: 28389 ExecStart=/opt/teamspeak/ts3server_startscript.sh start inifile=ts3server.ini (code=exited, status=0/SUCCESS)
Main PID: 28396 (ts3server)
Tasks: 21 (limit: 4666)
Memory: 19.9M
CPU: 3.887s
CGroup: /system.slice/teamspeak.service
└─28396 ./ts3server inifile=ts3server.ini daemon=1 pid_file=ts3server.pid
Jun 06 03:27:55 fedora ts3server_startscript.sh[28396]: apikey= "BAB8M-HTaXJwunk8MOsGOMja4eODG-f5k0EEICI"
Jun 06 03:27:55 fedora ts3server_startscript.sh[28396]: ------------------------------------------------------------------
Jun 06 03:27:57 fedora ts3server_startscript.sh[28396]: ------------------------------------------------------------------
Jun 06 03:27:57 fedora ts3server_startscript.sh[28396]: I M P O R T A N T
Jun 06 03:27:57 fedora ts3server_startscript.sh[28396]: ------------------------------------------------------------------
Jun 06 03:27:57 fedora ts3server_startscript.sh[28396]: ServerAdmin privilege key created, please use it to gain
Jun 06 03:27:57 fedora ts3server_startscript.sh[28396]: serveradmin rights for your virtualserver. please
Jun 06 03:27:57 fedora ts3server_startscript.sh[28396]: also check the doc/privilegekey_guide.txt for details.
Jun 06 03:27:57 fedora ts3server_startscript.sh[28396]: token=yiVk2d4Kuh5NxREKL69lXw23w83L5rxTy7tDt7UG
Jun 06 03:27:57 fedora ts3server_startscript.sh[28396]: ------------------------------------------------------------------
You can check the TeamSpeak logs for more information.
cat /opt/teamspeak/logs/*
Output.
2023-06-06 07:27:55.821060|INFO |ServerLibPriv | |TeamSpeak 3 Server 3.13.7 (2022-06-20 12:21:53)
2023-06-06 07:27:55.821228|INFO |ServerLibPriv | |SystemInformation: Linux 5.12.8-300.fc34.x86_64 #1 SMP Fri May 28 15:20:54 UTC 2021 x86_64 Binary: 64bit
2023-06-06 07:27:55.826637|INFO |DatabaseQuery | |dbPlugin name: SQLite3 plugin, Version 3, (c)TeamSpeak Systems GmbH
2023-06-06 07:27:55.826714|INFO |DatabaseQuery | |dbPlugin version: 3.11.1
2023-06-06 07:27:55.827188|INFO |DatabaseQuery | |checking database integrity (may take a while)
2023-06-06 07:27:55.842195|INFO |SQL | |db_CreateTables() tables created
2023-06-06 07:27:55.888533|WARNING |Accounting | |Unable to open licensekey.dat, falling back to limited functionality
2023-06-06 07:27:55.889007|INFO |Accounting | |Licensing Information
2023-06-06 07:27:55.889049|INFO |Accounting | |licensed to : Anonymous
2023-06-06 07:27:55.889066|INFO |Accounting | |type : No License
2023-06-06 07:27:55.889088|INFO |Accounting | |starting date : Tue Feb 1 00:00:00 2022
2023-06-06 07:27:55.889105|INFO |Accounting | |ending date : Thu Jul 1 00:00:00 2027
2023-06-06 07:27:55.889120|INFO |Accounting | |max virtualservers: 1
2023-06-06 07:27:55.889134|INFO |Accounting | |max slots : 32
2023-06-06 07:27:57.249724|INFO | | |Puzzle precompute time: 1293
2023-06-06 07:27:57.250634|INFO |FileManager | |listening on 0.0.0.0:30033, [::]:30033
2023-06-06 07:27:57.251912|INFO |VirtualSvrMgr | |executing monthly interval
2023-06-06 07:27:57.252123|INFO |VirtualSvrMgr | |reset virtualserver traffic statistics
2023-06-06 07:27:57.286585|INFO |Query | |Using a query thread pool size of 2
2023-06-06 07:27:57.313059|INFO |Query | |listening for query on 0.0.0.0:10011, [::]:10011
2023-06-06 07:27:57.313285|INFO | | |creating QUERY_SSH_RSA_HOST_KEY file: ssh_host_rsa_key
2023-06-06 07:27:58.216597|INFO | | |myTeamSpeak identifier revocation list was downloaded successfully - all related features are activated
2023-06-06 07:27:58.683529|INFO |Query | |listening for ssh query on 0.0.0.0:10022, [::]:10022
2023-06-06 07:27:58.683752|INFO |Query | |listening for http query on 0.0.0.0:10080, [::]:10080
2023-06-06 07:27:58.684059|INFO |CIDRManager | |updated query_ip_allowlist ips: 127.0.0.1/32, ::1/128,
2023-06-06 07:27:57.311762|INFO |VirtualServerBase|1 |listening on 0.0.0.0:9987, [::]:9987
2023-06-06 07:27:57.312526|WARNING |VirtualServer |1 |--------------------------------------------------------
2023-06-06 07:27:57.312560|WARNING |VirtualServer |1 |ServerAdmin privilege key created, please use the line below
2023-06-06 07:27:57.312577|WARNING |VirtualServer |1 |token=yiVk2d4Kuh5NxREKL69lXw23w83L5rxTy7tDt7UG
Step 3 - Configure Firewall
The TeamSpeak server is now installed and listens on ports 10011, 9987, and 30033. You can check them using the following command.
ss -antpl | grep ts3server
Output.
LISTEN 0 128 0.0.0.0:10011 0.0.0.0:* users:(("ts3server",pid=28396,fd=55))
LISTEN 0 128 0.0.0.0:10080 0.0.0.0:* users:(("ts3server",pid=28396,fd=60))
LISTEN 0 128 0.0.0.0:10022 0.0.0.0:* users:(("ts3server",pid=28396,fd=58))
LISTEN 0 128 0.0.0.0:30033 0.0.0.0:* users:(("ts3server",pid=28396,fd=35))
LISTEN 0 128 [::]:10011 [::]:* users:(("ts3server",pid=28396,fd=56))
LISTEN 0 128 [::]:10080 [::]:* users:(("ts3server",pid=28396,fd=61))
LISTEN 0 128 [::]:10022 [::]:* users:(("ts3server",pid=28396,fd=59))
LISTEN 0 128 [::]:30033 [::]:* users:(("ts3server",pid=28396,fd=36))
Now, run the following commands to allow all TeamSpeak ports.
firewall-cmd --zone=public --add-port=9987/udp --permanent
firewall-cmd --zone=public --add-port=10011/tcp --permanent
firewall-cmd --zone=public --add-port=30033/tcp --permanent
Next, reload the firewall service to implement the changes.
firewall-cmd --reload
Conclusion
Congratulations! You have successfully installed and configured the TeamSpeak server on Fedora. You can now download the TeamSpeak client on your mobile or PC, join the TeamSpeak server and start communicating with other members. You can also install the TeamSpeak server on VPS hosting from Atlantic.Net!
### HIPAA Compliance and the Role of Technology in Healthcare Security
The Health Insurance Portability and Accountability Act (HIPAA) stands as a cornerstone in maintaining the privacy and security of patient information. Enacted in 1996, HIPAA sets the standard for protecting sensitive patient data, ensuring that any entity dealing with protected health information (PHI) does so in a manner that preserves the confidentiality and integrity of patient data.
Patient health and well-being rely on expert medical professional teams with access to modern healthcare tech. The United States is home to some of the most advanced medical technology in the world. Even the latest cutting-edge technology must be HIPAA compliant, especially when processing and managing patient data.
The Role of Technology in Healthcare Security
Technology has revolutionized healthcare, from electronic health records (EHRs) to telemedicine, wearable devices, and AI-driven diagnostics. These advancements have improved the quality of care and the efficiency of healthcare delivery. However, with these benefits come challenges, particularly in ensuring the security of the vast amounts of data generated and processed.
An Electronic Health Record (EHR) is a secure digital version of a patient's medical history. Advanced technology protects EHRs through encryption, strong authentication, regular updates, and compliance with privacy regulations like HIPAA.
Telemedicine uses technology to enable remote healthcare services, allowing patients to consult with healthcare professionals from anywhere. Robust security measures, including encryption, authentication, and adherence to privacy regulations, protect patient data during telehealth sessions, ensuring privacy and confidentiality. Telemedicine provides convenient and secure access to healthcare, improving patient experiences and expanding healthcare accessibility.
Wearable devices rely on technology to ensure the protection of user data. Advanced encryption techniques are employed to secure the transmission and storage of collected personal information. HIPAA privacy regulations, and the General Data Protection Regulation (GDPR), govern personal data collection, storage, and use.
Healthcare organizations increasingly rely on technology to store, process, and transmit PHI. This includes EHRs, cloud-based storage solutions, and digital communication platforms. While these technologies offer numerous benefits, such as improved accessibility to patient data and streamlined communication, they also present potential vulnerabilities that could be exploited, leading to data breaches.
HIPAA and Technology
HIPAA effectively addresses these concerns by providing a comprehensive framework for healthcare organizations to protect and secure patients' sensitive information, known as Protected Health Information (PHI). One crucial aspect of HIPAA is the Security Rule, which focuses explicitly on safeguarding electronic PHI (ePHI). The Security Rule establishes three distinct types of security safeguards that must be implemented to ensure compliance:
#1: Administrative safeguards:
These safeguards involve creating, selecting, implementing, and maintaining security measures that effectively safeguard ePHI. They also encompass the management of workforce behavior regarding protecting this sensitive information.
Specific examples include:
Implementing comprehensive security policies and procedures, such as access control and authentication measures, to regulate and monitor the workforce's access to ePHI.
Conducting regular risk assessments and vulnerability scans to identify potential security gaps and mitigate risks.
Providing ongoing security training and awareness programs for employees to educate them about best practices for safeguarding ePHI.
Developing and implementing incident response plans to address and mitigate security breaches or incidents effectively.
#2: Physical safeguards:
These safeguards comprise tangible measures, policies, and procedures to protect electronic information systems, infrastructure, and equipment against natural hazards, environmental threats, and unauthorized access. The objective is to create a physical barrier preventing unauthorized individuals from accessing ePHI.
Installing security cameras and access control systems to monitor and control physical access to areas where electronic information systems and equipment storing ePHI are located.
Implementing measures such as locked server rooms, secure cabinets, and biometric authentication systems to restrict physical access to ePHI.
Safely disposing of physical media (such as hard drives, CDs, or printed records) that contain ePHI through secure destruction methods like shredding or degaussing.
#3: Technical safeguards:
These safeguards encompass the utilization of technology, in conjunction with appropriate policies and procedures, to secure ePHI and control access to it. This involves implementing robust technological measures that protect electronic information from unauthorized disclosure or alteration.
Encrypting ePHI during storage and transmission protects it from unauthorized access or interception. For example, secure protocols like SSL/TLS are used for data transmission over networks.
Implementing firewalls and intrusion detection systems to monitor and control network traffic and identify potential threats or unauthorized access attempts.
Requiring strong passwords, multi-factor authentication, or biometric verification for accessing systems or applications containing ePHI.
Regularly applying security patches and updates to software, operating systems, and applications to address known vulnerabilities.
If you would like to know more, look at our HIPAA Checklist for 2023.
Conclusion
In conclusion, HIPAA compliance is critical to healthcare security, particularly in technology. As healthcare organizations continue to adopt and integrate new technologies, the importance of adhering to HIPAA regulations cannot be overstated. By doing so, healthcare organizations can ensure the privacy and security of patient data and improve the quality and efficiency of care delivery.
Navigating the complexities of HIPAA compliance can be challenging, particularly regarding technology. However, you don't have to do it alone. Atlantic.Net offers award-winning HIPAA-compliant hosting services, providing secure, reliable, and compliant solutions tailored to your organization's needs.
Contact Atlantic.Net today to learn how we can help you ensure the security and compliance of your healthcare technology systems.
### How to Install Varnish Cache with Nginx on Fedora
Varnish is a popular, free, open-source, caching solution used to speed up your web server. It saves the frequently accessed content in memory and serves it from the cache instead of being processed by the web server. Varnish is a web application accelerator and is also used as caching HTTP reverse proxy. It offers very useful features such as Gzip compression, private CDN, HTTP streaming pass & fetch, and more.
In this tutorial, we will show you how to install Varnish Cache with Apache on Fedora.
Step 1 - Install Varnish Cache
By default, the Varnish Cache is included in the Fedora default repo. You can install it easily using the following command.
dnf install varnish -y
After installing Varnish, start and enable the Varnish service using the following command.
systemctl start varnish
systemctl enable varnish
You can verify the Varnish status with the following command.
systemctl status varnish
Output.
● varnish.service - Varnish Cache, a high-performance HTTP accelerator
Loaded: loaded (/usr/lib/systemd/system/varnish.service; disabled; vendor preset: disabled)
Active: active (running) since Sat 2023-05-20 05:04:41 EDT; 6s ago
Process: 9365 ExecStart=/usr/sbin/varnishd -a :6081 -f /etc/varnish/default.vcl -s malloc,256m (code=exited, status=0/SUCCESS)
Main PID: 9366 (varnishd)
Tasks: 217
Memory: 90.5M
CPU: 750ms
CGroup: /system.slice/varnish.service
├─9366 /usr/sbin/varnishd -a :6081 -f /etc/varnish/default.vcl -s malloc,256m
└─9386 /usr/sbin/varnishd -a :6081 -f /etc/varnish/default.vcl -s malloc,256m
To verify the Varnish version, run the following command.
varnishd -V
Output.
varnishd (varnish-6.5.2 revision e7233b0ad2639043341819d19a8d2e418e94ce1b)
Copyright (c) 2006 Verdens Gang AS
Copyright (c) 2006-2020 Varnish Software
By default, Varnish listens on port 6081. You can check it with the following command.
netstat -tunlp | grep 6081
Output.
tcp 0 0 0.0.0.0:6081 0.0.0.0:* LISTEN 9366/varnishd
tcp6 0 0 :::6081 :::* LISTEN 9366/varnishd
Step 2 - Install Apache Web Server
You can install the Apache server with the following command.
dnf install httpd -y
After installing the Apache server, start and enable the Apache service with the following command.
systemctl start httpd
systemctl enable httpd
Step 3 - Change Apache Default Port
Next, you will need to change the Apache default port from 80 to 8080. You can change it with the following command.
nano /etc/httpd/conf/httpd.conf
Change the following line from 80 to 8080.
Listen 8080
Save and close the file, then restart the Apache service to apply the changes.
systemctl restart httpd
Now, verify the Apache listening port using the following command.
ss -antpl | grep httpd
Output.
LISTEN 0 511 *:8080 *:* users:(("httpd",pid=9801,fd=4),("httpd",pid=9800,fd=4),("httpd",pid=9799,fd=4),("httpd",pid=9797,fd=4))
Step 4 - Change Varnish Default Port
Next, you will also need to edit the Varnish systemd file and change the Varnish port to 80.
systemctl edit --full varnish
Change the following line as shown below:
ExecStart=/usr/sbin/varnishd -a :80 -f /etc/varnish/default.vcl -s malloc,1g
Save and close the file, then reload the systemd daemon to apply the changes.
systemctl daemon-reload
Next, restart the Varnish service to apply the changes.
systemctl restart varnish
Step 5 - Verify Varnish
At this point, Varnish is installed and configured to listen on port 80. Now, when you make any web request, it will pass via the Varnish server.
You can verify the Varnish cache with the following command.
curl -I http://localhost
If everything is fine, you will see the following output.
HTTP/1.1 403 Forbidden
Date: Sat, 20 May 2023 09:09:44 GMT
Server: Apache/2.4.53 (Fedora)
Last-Modified: Fri, 26 Mar 2021 17:49:58 GMT
ETag: "211a-5be742910bd80"
Accept-Ranges: bytes
Content-Length: 8474
Content-Type: text/html; charset=UTF-8
X-Varnish: 2
Age: 0
Via: 1.1 varnish (Varnish/6.5)
Connection: keep-alive
Conclusion
In this post, we will show you how to install Varnish with Apache on Fedora. You can now implement a Varnish cache on your web server to speed up the web page delivery. You can now deploy Varnish Cache on VPS hosting from Atlantic.Net!
### How to Install SonarQube on Fedora
SonarQube is a free, open-source, self-managed code review tool that systematically helps you deliver clean code. It is a very useful quality analysis tool to scan source code for potential bugs and vulnerabilities and generates a report. SonarQube supports up to 30 programming languages and provides reports such as duplicate code, coding standards, code complexity, and security recommendation.
This post will show you how to install the SonarQube code analysis tool on Fedora.
Step 1 - Install Java OpenJDK
SonarQube is written in Java, so Java JDK must be installed on your server. If not installed, you can install it with the following command.
dnf install java-17-openjdk -y
Once Java is installed, you can verify the Java installation using the following command.
java --version
Output:
openjdk 17.0.3 2022-04-19
OpenJDK Runtime Environment 21.9 (build 17.0.3+7)
OpenJDK 64-Bit Server VM 21.9 (build 17.0.3+7, mixed mode, sharing)
Step 2 - Install and Configure PostgreSQL Database
First, disable the default PostgreSQL repo and enable the PostgreSQL 14 repo.
dnf module reset postgresql -y
dnf module enable postgresql:14
Next, install the PostgreSQL server with the following command.
dnf install postgresql-server postgresql
Next, initialize the PostgreSQL database using the following command.
postgresql-setup --initdb
Next, start the PostgreSQL service and enable it to start at system reboot.
systemctl enable --now postgresql
Next, log in to the PostgreSQL shell with the following command.
su - postgres
psql
Next, create a database and user for SonarQube.
create user sonar;
create database sonar owner sonar;
grant all privileges on database sonar to sonar;
Next, set a password for the sonar user, then exit from the PostgreSQL shell.
ALTER USER sonar WITH ENCRYPTED password 'secure_password';
\q
exit
Next, edit the PostgreSQL configuration file.
nano /var/lib/pgsql/data/pg_hba.conf
Find the following lines:
host all all 127.0.0.1/32 ident
host all all ::1/128 ident
And, replace them with the following lines:
host all all 127.0.0.1/32 md5
host all all ::1/128 md5
Save and close the file, then reload the PostgreSQL service to implement the changes.
systemctl reload postgresql
Step 3 - Install and Configure SonarQube
First, create a dedicated user to run SonarQube.
useradd -M -d /opt/sonarqube/ -r -s /bin/bash sonar
Next, download the latest version of SonarQube.
wget https://binaries.sonarsource.com/Distribution/sonarqube/sonarqube-9.9.1.69595.zip
Next, unzip the SonarQube and move the unzipped directory to /opt
unzip sonarqube-9.9.1.69595.zip
mv sonarqube-9.9.1.69595 /opt/sonarqube
Next, change the ownership of the SonarQube directory.
chown -R sonar:sonar /opt/sonarqube
Next, edit the SonarQube configuration file.
nano /opt/sonarqube/conf/sonar.properties
Define your database settings, host, port, Java options, and data directory.
sonar.jdbc.username=sonar
sonar.jdbc.password=secure_password
sonar.jdbc.url=jdbc:postgresql://localhost/sonar
##How you will access SonarQube Web UI
sonar.web.host=0.0.0.0
sonar.web.port=9000
##Java options
sonar.web.javaOpts=-Xmx512m -Xms128m -XX:+HeapDumpOnOutOfMemoryError
sonar.search.javaOpts=-Xmx512m -Xms512m -XX:MaxDirectMemorySize=256m -XX:+HeapDumpOnOutOfMemoryError
##Also uncomment the following Elasticsearch storage paths
sonar.path.data=data
sonar.path.temp=temp
Save and close the file, then create a new wrapper.conf file and define your Java path.
nano /opt/sonarqube/conf/wrapper.conf
Add the following line.
wrapper.java.command=/usr/lib/jvm/jre-openjdk/bin/java
Save and close the file when you are done.
Step 4 - Create a Systemd Service File for SonarQube
Next, create a systemd file to manage the SonarQube service.
nano /etc/systemd/system/sonarqube.service
Add the following lines.
[Unit]
Description=SonarQube service
After=syslog.target network.target
[Service]
Type=forking
ExecStart=/opt/sonarqube/bin/linux-x86-64/sonar.sh start
ExecStop=/opt/sonarqube/bin/linux-x86-64/sonar.sh stop
LimitNOFILE=65536
LimitNPROC=4096
User=sonar
Group=sonar
Restart=on-failure
[Install]
WantedBy=multi-user.target
Save and close the file, then reload the systemd daemon to apply the changes.
systemctl daemon-reload
Next, start and enable the SonarQube service.
systemctl start sonarqube
systemctl enable sonarqube
You can verify the SonarQube status using the following command.
systemctl status sonarqube
Output.
● sonarqube.service - SonarQube service
Loaded: loaded (/etc/systemd/system/sonarqube.service; disabled; vendor preset: disabled)
Active: active (running) since Sat 2023-05-20 00:16:07 EDT; 4s ago
Process: 3092 ExecStart=/opt/sonarqube/bin/linux-x86-64/sonar.sh start (code=exited, status=0/SUCCESS)
Main PID: 3115 (java)
Tasks: 34 (limit: 4666)
Memory: 164.0M
CPU: 8.664s
CGroup: /system.slice/sonarqube.service
├─3115 java -Xms8m -Xmx32m --add-exports=java.base/jdk.internal.ref=ALL-UNNAMED --add-opens=java.base/java.lang=ALL-UNNAMED --add-opens=java.base/java.nio>
└─3140 /usr/lib/jvm/java-17-openjdk-17.0.3.0.7-1.fc34.x86_64/bin/java -XX:+UseG1GC -Djava.io.tmpdir=/opt/sonarqube/temp -XX:ErrorFile=/opt/sonarqube/logs/>
May 20 00:16:07 fedora systemd[1]: Starting SonarQube service...
May 20 00:16:07 fedora sonar.sh[3092]: /usr/bin/java
May 20 00:16:07 fedora sonar.sh[3092]: Starting SonarQube...
May 20 00:16:07 fedora sonar.sh[3092]: Started SonarQube.
May 20 00:16:07 fedora systemd[1]: Started SonarQube service.
Step 5 - Access SonarQube Web Dashboard
Now, open your web browser and access the SonarQube web UI using the URL http://server-ip:9000. You should see the SonarQube login screen.
Provide the default username and password as admin/admin then click on the Log in button. You should see the password change screen.
Set your new admin password then click on the Update button. You should see the SonarQube dashboard on the following screen.
Conclusion
In this guide, we explained how to install the SonarQube tool on Fedora. You can now add your project from Git or another repository and start analyzing your code via a web-based interface. Try to install SonarQube on VPS hosting from Atlantic.Net!
### How to Install phpIPAM on Fedora
phpIPAM is a free, open-source, PHP-based IP Address management tool. Its aim is to provide lightweight, modern, and useful IP address management via a web-based console. It is written in PHP and uses MySQL as a database backend. phpIPAM provides real-time statistics of used and unused IP addresses with subnets, status, hostname, and more information. It also offers some advanced features such as PowerDNS integration, NAT support, VLAN management, REST API, AD, LDAP, Radius authentication, and more.
In this post, we will show you how to install and configure the phpIPAM IP address management tool on Fedora.
Step 1 - Install the LAMP Server
First, you will need to install Apache, MariaDB, and PHP on your server. You can install all of them with the following command.
dnf update -y
dnf install httpd mariadb-server php
Next, install other required PHP extensions with the following command.
dnf install php-{mysqlnd,curl,gd,intl,pear,xmlrpc,mbstring,gettext,gmp,json,xml,fpm}
Next, start and enable the Apache, MariaDB, and PHP-FPM services using the following command.
systemctl enable --now httpd php-fpm mariadb
Step 2 - Create a Database and User for phpIPAM
Next, you will need to create a database and user for phpIPAM.
First, log in to MySQL shell using the following command.
mysql
Once logged in, create a database and user with the following command.
CREATE DATABASE phpipam;
GRANT ALL ON phpipam.* TO phpipam@localhost IDENTIFIED BY 'securepassword';
Next, flush the privileges and exit from the MySQL shell with the following command.
FLUSH PRIVILEGES;
EXIT;
Step 3 - Download phpIPAM
First, install the GIT package with the following command.
dnf install git -y
Next, download the latest version of phpIPAM using the following command.
git clone --recursive https://github.com/phpipam/phpipam.git /var/www/html/phpipam
Next, navigate to the phpipam directory and copy the sample configuration file.
cd /var/www/html/phpipam
cp config.dist.php config.php
Next, edit the config.php file and define your database settings.
nano config.php
Change the following lines as per your database settings.
$db['host'] = 'localhost';
$db['user'] = 'phpipam';
$db['pass'] = 'securepassword';
$db['name'] = 'phpipam';
$db['port'] = 3306;
Save and close the file, then change the ownership of the phpIPAM directory.
chown -R apache:apache /var/www/html/phpipam
Step 4 - Create an Apache Virtual Host
Next, you will need to create an Apache virtual host configuration file to define your phpIPAM.
nano /etc/httpd/conf.d/phpipam.conf
Add the following configurations.
ServerAdmin admin@example.com
DocumentRoot "/var/www/html/phpipam"
ServerName phpipam.example.com
Options Indexes FollowSymLinks
AllowOverride All
Require all granted
ErrorLog "/var/log/httpd/phpipam-error_log"
CustomLog "/var/log/httpd/phpipam-access_log" combined
Save and close the file, then restart the Apache service to apply the changes.
systemctl restart httpd
Next, import the phpIPAM schema to the phpIPAM database.
mysql -u root -p phpipam < /var/www/html/phpipam/db/SCHEMA.sql
Step 5 - Access phpIPAM Web Interface
Now, open your web browser and access the phpIPAM web interface using the URL http://phpipam.example.com. You should see the phpIPAM login screen.
Provide the default username and password as admin/admin then click on the Login button. You should see the default password reset screen.
Define your new password and click on the Save password button. You should see the following screen.
Click on the Dashboard button. You should see the phpIPAM dashboard on the following screen.
Conclusion
In this guide, we explained how to install and configure the phpIPAM IP address management tool on Fedora. phpIPAM is a very useful tool for system administrators to manage the hardware inventory of the entire infrastructure from the central place. You can now deploy the phpIPAM solution on VPS hosting from Atlantic.Net!
### How to Install OpenNMS on Fedora
OpenNMS, also called "Open Network Management System," is a free and cross-platform network management platform for Linux and Windows-based operating systems. It is a Java-based tool designed to monitor critical services on remote machines via SNMP and JMX. OpenNMS comes with a web-based console that helps you to monitor and administer networks and applications.
In this tutorial, we will show you how to install OpenNMS on Fedora.
Step 1 - Install Java JDK
OpenNMS is based on Java, so you will need to install the Java JDK on your server. You can install it with the following command.
dnf install java-11-openjdk
After the successful installation, you can verify the Java installation with the following command.
java --version
Output.
openjdk 11.0.15 2022-04-19
OpenJDK Runtime Environment 18.9 (build 11.0.15+10)
OpenJDK 64-Bit Server VM 18.9 (build 11.0.15+10, mixed mode, sharing)
Step 2 - Install and Configure PostgreSQL Database
OpenNMS uses PostgreSQL as a database backend, so you will need to install and configure PostgreSQL to your server.
First, disable the default PostgreSQL repo and enable the PostgreSQL 14 repo with the following command.
dnf module reset postgresql -y
dnf module enable postgresql:14
Next, install the PostgreSQL server with the following command.
dnf install postgresql-server postgresql
Next, initialize the PostgreSQL database using the following command.
postgresql-setup --initdb
Next, start and enable the PostgreSQL service with the following command.
systemctl enable --now postgresql
Next, log in to PostgreSQL:
su - postgres
psql
Create a database and user for OpenNMS with the following command.
create user opennms;
create database opennms owner opennms;
grant all privileges on database opennms to opennms;
Next, set OpenNMS and Postgres password with the following command.
ALTER USER opennms WITH ENCRYPTED password 'secure_password';
ALTER USER postgres WITH PASSWORD 'secure_password';
Finally, exit from the PostgreSQL shell with the following command.
\q
exit
Next, edit the PostgreSQL configuration file.
nano /var/lib/pgsql/data/pg_hba.conf
Find the following lines:
host all all 127.0.0.1/32 ident
host all all ::1/128 ident
And replace them with the following lines:
host all all 127.0.0.1/32 md5
host all all ::1/128 md5
Save and close the file, then reload PostgreSQL to implement the changes.
systemctl reload postgresql
Step 3 - Install and Configure OpenNMS
First, add the OpenNMS repo and import the GPG key using the following command.
dnf -y install https://yum.opennms.org/repofiles/opennms-repo-stable-rhel8.noarch.rpm
rpm --import https://yum.opennms.org/OPENNMS-GPG-KEY
Next, install the OpenNMS package with the following command.
dnf install opennms -y
Next, edit the OpenNMS database configuration file.
nano /opt/opennms/etc/opennms-datasources.xml
Define your database details as shown below.
Save and close the file, then run the following command to detect the Java environment.
/opt/opennms/bin/runjava -s
Output:
runjava: Looking for an appropriate JVM...
runjava: Checking for an appropriate JVM in JAVA_HOME...
runjava: Skipping... JAVA_HOME not set.
runjava: Checking JVM in the PATH: "/usr/lib/jvm/java-11-openjdk-11.0.15.0.10-1.fc34.x86_64/bin/java"...
runjava: Found an appropriate JVM in the PATH: "/usr/lib/jvm/java-11-openjdk-11.0.15.0.10-1.fc34.x86_64/bin/java"
runjava: Value of "/usr/lib/jvm/java-11-openjdk-11.0.15.0.10-1.fc34.x86_64/bin/java" stored in configuration file.
Next, complete the OpenNMS setup using the following command.
/opt/opennms/bin/install -dis
Output:
Processing SystemIDMigratorOffline: Updates OpenNMS system ID to a random UUID.
- Running pre-execution phase
- Running execution phase
- Saving the execution state
- Running post-execution phase
Finished in 0 seconds
Upgrade completed successfully!
Start OpenNMS Service
Now, start the OpenNMS service and enable it to start at system reboot with the following command.
systemctl start opennms
systemctl enable opennms
You can now check the status of OpenNMS with the following command.
systemctl status opennms
Output:
● opennms.service - OpenNMS server
Loaded: loaded (/usr/lib/systemd/system/opennms.service; disabled; vendor preset: disabled)
Active: active (running) since Sat 2023-05-20 00:44:49 EDT; 2s ago
Process: 6347 ExecStart=/opt/opennms/bin/opennms -s start (code=exited, status=0/SUCCESS)
Process: 7330 ExecStartPost=/bin/sleep 3 (code=exited, status=0/SUCCESS)
Main PID: 7329 (java)
Tasks: 44 (limit: 4666)
Memory: 313.7M
CPU: 21.271s
CGroup: /system.slice/opennms.service
├─7328 bash /opt/opennms/bin/opennms -s start
└─7329 /usr/lib/jvm/java-11-openjdk-11.0.15.0.10-1.fc34.x86_64/bin/java --add-modules=java.base,java.compiler,java.datatransfer,java.desktop,java.instrume>
Step 4 - Access OpenNMS Web UI
At this point, OpenNMS is started and listening on port 8980. You can verify it with the following command.
ss -antpl | grep 8980
Output.
LISTEN 0 50 *:8980 *:* users:(("java",pid=7329,fd=1197))
Now, open your web browser and access the OpenNMS web interface using the URL http://your-server-ip:8980/opennms. You should see the OpenNMS login page.
Provide the default username and password as admin/admin then click on the LOGIN button. You should see the OpenNMS dashboard on the following screen.
Conclusion
In this post, we explained how to install OpenNMS on Fedora. I hope you have now enough knowledge to install and set up OpenNMS in your environment easily. You can now install OpenNMS on VPS hosting from Atlantic.Net!
### How to Install Jenkins on Fedora
Open-source Jenkins is one of the most widely used automation tools for building and managing applications. It supports all major programming languages including, Python, C++, PHP, etc. Jenkins is a Java-based tool used by developers to automate tasks in the software development cycle. It offers a large plugin library that helps you to make the necessary changes to applications before going into production.
In this post, we will show you how to install Jenkins on Fedora.
Step 1 - Install Java OpenJDK
Jenkins is written in Java, so Java JDK must be installed on your server. If not installed, you can install it easily using the following command.
dnf install java-17-openjdk -y
After the installation, verify the Java installation using the following command.
java --version
Output:
openjdk 17.0.3 2022-04-19
OpenJDK Runtime Environment 21.9 (build 17.0.3+7)
OpenJDK 64-Bit Server VM 21.9 (build 17.0.3+7, mixed mode, sharing)
Step 2 - Add Jenkins Repo
By default, Jenkins is not included in the Fedora default repo, so you will need to add the Jenkins repo to your server. You can install it with the following command.
wget -O /etc/yum.repos.d/jenkins.repo https://pkg.jenkins.io/redhat-stable/jenkins.repo
Output:
--2023-05-20 00:29:02-- https://pkg.jenkins.io/redhat-stable/jenkins.repo
Resolving pkg.jenkins.io (pkg.jenkins.io)... 151.101.2.133, 151.101.194.133, 151.101.130.133, ...
Connecting to pkg.jenkins.io (pkg.jenkins.io)|151.101.2.133|:443... connected.
HTTP request sent, awaiting response... 200 OK
Length: 85
Saving to: ‘/etc/yum.repos.d/jenkins.repo’
/etc/yum.repos.d/jenkins.repo 100%[=====================================================================================>] 85 --.-KB/s in 0s
2023-05-20 00:29:02 (2.71 MB/s) - ‘/etc/yum.repos.d/jenkins.repo’ saved [85/85]
Next, import the Jenkins GPG key with the following command.
rpm --import https://pkg.jenkins.io/redhat-stable/jenkins.io-2023.key
Next, verify the added repo using the following command.
dnf repolist
Output:
repo id repo name
fedora Fedora 34 - x86_64
fedora-cisco-openh264 Fedora 34 openh264 (From Cisco) - x86_64
fedora-modular Fedora Modular 34 - x86_64
jenkins Jenkins-stable
updates Fedora 34 - x86_64 - Updates
updates-modular Fedora Modular 34 - x86_64 - Updates
Step 3 - Install Jenkins
Now, you can install Jenkins using the DNF command line utility.
dnf install jenkins -y
Once the Jenkins is installed, start and enable the Jenkins service with the following command.
systemctl start jenkins
systemctl enable jenkins
You can now verify the status of Jenkins with the following command.
systemctl status jenkins
Output:
● jenkins.service - Jenkins Continuous Integration Server
Loaded: loaded (/usr/lib/systemd/system/jenkins.service; disabled; vendor preset: disabled)
Active: active (running) since Sat 2023-05-20 00:31:56 EDT; 16s ago
Main PID: 3926 (java)
Tasks: 51 (limit: 4666)
Memory: 1.2G
CPU: 47.408s
CGroup: /system.slice/jenkins.service
└─3926 /usr/bin/java -Djava.awt.headless=true -jar /usr/share/java/jenkins.war --webroot=/var/cache/jenkins/war --httpPort=8080
May 20 00:31:38 fedora jenkins[3926]: 8c1c142cc9fd44fc8297c0e8b881fed1
May 20 00:31:38 fedora jenkins[3926]: This may also be found at: /var/lib/jenkins/secrets/initialAdminPassword
May 20 00:31:38 fedora jenkins[3926]: *************************************************************
May 20 00:31:56 fedora jenkins[3926]: 2023-05-20 04:31:56.753+0000 [id=31] INFO jenkins.InitReactorRunner$1#onAttained: Completed initialization
May 20 00:31:56 fedora jenkins[3926]: 2023-05-20 04:31:56.789+0000 [id=24] INFO hudson.lifecycle.Lifecycle#onReady: Jenkins is fully up and running
May 20 00:31:56 fedora systemd[1]: Started Jenkins Continuous Integration Server.
May 20 00:31:56 fedora jenkins[3926]: 2023-05-20 04:31:56.946+0000 [id=48] INFO h.m.DownloadService$Downloadable#load: Obtained the updated data file for>
May 20 00:31:56 fedora jenkins[3926]: 2023-05-20 04:31:56.947+0000 [id=48] INFO hudson.util.Retrier#start: Performed the action check updates server succ>
Step 4 - Access Jenkins Web Interface
At this point, Jenkins is installed and listening on port 8080. You can verify it with the following command.
ss -antpl | grep 8080
Output.
LISTEN 0 50 *:8080 *:* users:(("java",pid=3926,fd=9))
Next, retrieve the Jenkins initial admin password with the following command.
cat /var/lib/jenkins/secrets/initialAdminPassword
Output:
8c1c142cc9fd44fc8297c0e8b881fed1
Now, open your web browser and access the Jenkins web interface using the URL http://your-server-ip:8080. You should see the Jenkins initial password screen.
Provide your password and click on the Continue button. You should see the following screen.
Click on the Install suggested plugins. You should see the following screen.
Define your admin user, password, and email, and click on the Save and Finish button. You should see the following screen.
Define your Jenkins URL and click on the Start using Jenkins button. You should see the Jenkins dashboard on the following screen.
Conclusion
In this tutorial, we showed you how to install Jenkins on Fedora. You can now implement Jenkins in your development team to streamline the software development process. Try to install and implement Jenkins on VPS hosting from Atlantic.Net!
### How to Install and Use Docker on Fedora
Docker is one of the most popular tools for deploying software in containers. This free tool helps you to make your application portable and run it on any platform without installing any dependencies. It is a relatively new platform and is constantly updated by a large developer community. With Docker, you can run multiple containers on the same hardware. Docker is an alternate solution for virtual machines that are lightweight and more resource-friendly.
In this post, we will explain how to install and use Docker and Docker Compose on Fedora.
Step 1 - Add Docker Repo
By default, the Docker and Docker Compose packages are not included in the Fedora default repo, so you will need to add a Docker repo to the Yum repository. You can add it with the following command.
dnf update -y
dnf -y install dnf-plugins-core
dnf config-manager --add-repo https://download.docker.com/linux/fedora/docker-ce.repo
The above command will create a docker-ce.repo file in the Yum configuration directory.
Step 2 - Install Docker and Docker Compose
Now, run the following command to install Docker, Docker Compose, and other packages to Fedora.
dnf install docker-ce docker-ce-cli containerd.io docker-compose-plugin docker-compose -y
After the successful installation, start and enable the Docker service using the following command.
systemctl start docker
systemctl enable docker
You can now verify the Docker version using the following command.
docker --version
Output:
Docker version 20.10.17, build 100c701
To check the Docker service status, run the following command.
systemctl status docker
Output:
● docker.service - Docker Application Container Engine
Loaded: loaded (/usr/lib/systemd/system/docker.service; disabled; vendor preset: disabled)
Active: active (running) since Sat 2023-05-20 03:54:38 EDT; 8min ago
TriggeredBy: ● docker.socket
Docs: https://docs.docker.com
Main PID: 5219 (dockerd)
Tasks: 13
Memory: 41.4M
CPU: 1min 31.505s
CGroup: /system.slice/docker.service
└─5219 /usr/bin/dockerd -H fd:// --containerd=/run/containerd/containerd.sock
If you want to see more information about Docker, run the following command.
docker info
Output:
Client:
Context: default
Debug Mode: false
Plugins:
app: Docker App (Docker Inc., v0.9.1-beta3)
buildx: Docker Buildx (Docker Inc., v0.8.2-docker)
compose: Docker Compose (Docker Inc., v2.6.0)
scan: Docker Scan (Docker Inc., v0.17.0)
Server:
Containers: 0
Running: 0
Paused: 0
Stopped: 0
Images: 0
Server Version: 20.10.17
Storage Driver: overlay2
Backing Filesystem: xfs
Supports d_type: true
Native Overlay Diff: true
userxattr: false
Logging Driver: json-file
Cgroup Driver: systemd
Cgroup Version: 2
Plugins:
Volume: local
Network: bridge host ipvlan macvlan null overlay
Log: awslogs fluentd gcplogs gelf journald json-file local logentries splunk syslog
Swarm: inactive
Runtimes: io.containerd.runc.v2 io.containerd.runtime.v1.linux runc
Default Runtime: runc
Init Binary: docker-init
containerd version: 10c12954828e7c7c9b6e0ea9b0c02b01407d3ae1
runc version: v1.1.2-0-ga916309
init version: de40ad0
Security Options:
Step 3 - Verify Docker
After installing Docker, you will need to verify Docker. Let's download and run the hello-world container.
docker run hello-world
This will pull the hello-world Docker image from the Docker Hub repository and create a container for it.
Unable to find image 'hello-world:latest' locally
latest: Pulling from library/hello-world
719385e32844: Pull complete
Digest: sha256:fc6cf906cbfa013e80938cdf0bb199fbdbb86d6e3e013783e5a766f50f5dbce0
Status: Downloaded newer image for hello-world:latest
Hello from Docker!
This message shows that your installation appears to be working correctly.
To generate this message, Docker took the following steps:
1. The Docker client contacted the Docker daemon.
2. The Docker daemon pulled the "hello-world" image from the Docker Hub.
(amd64)
3. The Docker daemon created a new container from that image which runs the
executable that produces the output you are currently reading.
4. The Docker daemon streamed that output to the Docker client, which sent it
to your terminal.
To try something more ambitious, you can run an Ubuntu container with:
$ docker run -it ubuntu bash
Share images, automate workflows, and more with a free Docker ID:
https://hub.docker.com/
For more examples and ideas, visit:
https://docs.docker.com/get-started/
You can verify the downloaded image using the following command.
docker images
Output.
REPOSITORY TAG IMAGE ID CREATED SIZE
hello-world latest 9c7a54a9a43c 2 weeks ago 13.3kB
To check the status of the hello-world container, run the following command.
docker ps -a
Output.
CONTAINER ID IMAGE COMMAND CREATED STATUS PORTS NAMES
2f37b19f050d hello-world "/hello" About a minute ago Exited (0) About a minute ago flamboyant_lovelace
Step 4 - How to Use Docker
Docker allows you to pull and run any operating system inside the container.
Let's pull the Fedora image and create a container using the following command.
docker run -dit fedora:latest
You will see the following output.
Unable to find image 'fedora:latest' locally
latest: Pulling from library/fedora
86c577c44422: Pull complete
Digest: sha256:88b02539d545dcc81f1a991b06fd2a6e7c550f4192ed3625843926b56522a37c
Status: Downloaded newer image for fedora:latest
a2a919fc421cce733984fc8ed69259bcab045e50c14cbc185cd4e38efe72bcd5
You can verify the running container using the following command.
docker ps
Output:
CONTAINER ID IMAGE COMMAND CREATED STATUS PORTS NAMES
a2a919fc421c fedora:latest "/bin/bash" 10 seconds ago Up 9 seconds beautiful_euler
To connect the running container, run the following command.
docker exec -it a2a919fc421c /bin/bash
You will get into the Fedora container as shown below.
[root@a2a919fc421c /]#
Now, verify the Fedora version using the following command.
cat /etc/os-release
Output:
NAME="Fedora Linux"
VERSION="38 (Container Image)"
ID=fedora
VERSION_ID=38
VERSION_CODENAME=""
PLATFORM_ID="platform:f38"
PRETTY_NAME="Fedora Linux 38 (Container Image)"
ANSI_COLOR="0;38;2;60;110;180"
LOGO=fedora-logo-icon
CPE_NAME="cpe:/o:fedoraproject:fedora:38"
DEFAULT_HOSTNAME="fedora"
HOME_URL="https://fedoraproject.org/"
DOCUMENTATION_URL="https://docs.fedoraproject.org/en-US/fedora/f38/system-administrators-guide/"
SUPPORT_URL="https://ask.fedoraproject.org/"
BUG_REPORT_URL="https://bugzilla.redhat.com/"
REDHAT_BUGZILLA_PRODUCT="Fedora"
REDHAT_BUGZILLA_PRODUCT_VERSION=38
REDHAT_SUPPORT_PRODUCT="Fedora"
REDHAT_SUPPORT_PRODUCT_VERSION=38
SUPPORT_END=2024-05-14
VARIANT="Container Image"
VARIANT_ID=container
Finally, exit from the Fedora container using the following command.
[root@a2a919fc421c /]# exit
Step 5 - Remove Docker and Docker Compose
You can remove the Docker, Docker Compose, and other packages using the following command.
dnf remove docker-ce docker-ce-cli containerd.io docker-compose-plugin docker-compose -y
Now, clean all package caches using the following command.
dnf clean all
Conclusion
In this post, we explained how to install Docker and Docker Compose on Fedora. We also show you how to use Docker to run any container. You can now try to install Docker and Docker Compose on dedicated server hosting from Atlantic.Net!
### Building a Cloud Disaster Recovery Plan: Tips and Approaches
Cloud computing has introduced added versatility to modern disaster recovery strategies. Not only is cloud-based disaster recovery affordable, but it also introduces flexibility that was often out of reach for many small and medium-sized businesses.
This article will delve into the distinctions between Cloud Disaster Recovery (Cloud DR) and traditional disaster recovery solutions.
What Is Cloud Disaster Recovery (Cloud DR)?
Cloud Disaster Recovery (Cloud DR) is a modern approach to traditional disaster recovery methods, leveraging the power and scalability of cloud computing to safeguard business-critical servers and applications, ensuring business continuity.
Cloud DR isn't merely a data backup process but a comprehensive strategy to rapidly restore key business operations in the event of a disaster. With Cloud DR, businesses can dynamically scale their DR resources to meet their evolving needs.
This adaptability extends to the types of disasters it can handle. It provides robust solutions for large-scale disasters and minor, yet equally critical, incidents such as server failures or software glitches.
Cloud DR typically involves replicating data and applications to a cloud environment, which can be a public, private, or hybrid cloud. This strategy allows businesses to maintain access to their vital data and applications, even if their primary IT infrastructure is compromised.
Cloud DR enables faster recovery times compared to traditional DR methods, as the data and applications are readily accessible from the cloud, reducing the time and complexity associated with the recovery process.
What Is the Difference Between DR and Failover?
Failover and disaster recovery share many parallels; however, the two have crucial differences. Disaster recovery refers to the comprehensive strategy and procedures to restore and resume an organization's IT infrastructure and operations following a disaster.
Alternatively, failover is a specific process part of a broader disaster recovery plan. It refers to the automatic switching from a primary system to a redundant or standby system in the event of a failure or abnormal termination of the primary system. The goal of failover is for the secondary system to take over when the primary system fails. This failover server will be located in the cloud in a Cloud DR.
Cloud-to-Cloud Disaster Recovery Strategies
If your workloads are already in the cloud, you will need to understand cloud-to-cloud DR. There are different ways to approach multi-cloud DR; it's not uncommon for businesses to have IT infrastructure in various geographical regions. Therefore, having redundancy between regions is vital. Perhaps you will have a synchronous database or storage replication between sites A and secondary site B.
Another option is avoiding vendor lock-in and replicating your critical systems into a virtual machine replica in a different cloud provider. For example, you may have core systems running in AWS, but you use Atlantic.Net as a hot site. A hot site is a 1:1 replica of your systems using real-time replication. If you need a cold site, perhaps use an alternative site as a backup location for your production data.
Selecting a Cloud DR Provider
When choosing a cloud disaster recovery (DR) provider, several critical factors must be considered as part of your disaster recovery planning process. Research and shortlist your preferred vendors, and take careful consideration that the provider is capable of delivering:
Recovery Time and Recovery Point Objectives:
The Recovery Time Objective (RTO) is essential to disaster recovery strategies. It determines the full recovery time objective maximum duration your business can afford without its critical systems in the event of a cloud disaster. In your chosen cloud DRP, your provider should be able to restore data and resume operations within this time frame.
Data loss tolerance is another critical part of the disaster recovery strategy. It outlines the maximum age of backup data your organization must recover after a disaster to resume normal operations. In a cloud disaster recovery strategy, ensure your DR provider can meet your RPO requirements and store backup data effectively.
Scalability, Flexibility, and Security:
Rapid scalability can be a crucial component of cloud disaster recovery solutions in the event of a disaster. As your business and data storage needs grow, so will your need for disaster recovery efforts. A good cloud DR provider should be able to scale and adapt to your changing requirements. Whether handling increased data synchronization, improving performance, or providing more extensive coverage against potential disasters, your provider must be capable of evolving with you.
In the wake of a disaster, protecting your mission-critical data is vital. Look for a DR provider with strong security protocols in their cloud environments. This includes encryption, multi-factor authentication, and regular security audits. Furthermore, any provider that complies with industry-specific regulations such as GDPR, HIPAA, or SOC 2 is a good gauge of how seriously they take security.
Rigid Service Level Agreements (SLAs):
SLAs are contracts between you and your DR provider that specify the level of service you can expect. They should clearly outline the cloud vendor's responsibilities, the expected recovery times (RTO and RPO), and the consequences if these are unmet.
Accurate Testing and Validation:
A comprehensive cloud DRP is only as good as its execution. Regular testing and validation of the plan are vital to ensure it works as expected when a natural disaster or disaster strikes. Ask potential cloud providers about their testing protocols and how often they test their cloud disaster recovery strategies and workflows.
Experience and Reputation:
While new players may offer innovative cloud technologies and disaster recovery options, a provider with a solid track record can offer an extra layer of reassurance. Look for case studies, customer reviews, and independent evaluations to assess a provider's reputation.
Cost Structure:
The cost of cloud DR services and the potential for significant business costs can vary greatly. Be sure to understand the pricing structure and what it includes. Look for hidden costs like data transfer fees or costs associated with testing the recovery plan.
Customer Support:
When disaster strikes, you want to know a competent and responsive support team is ready to help. Look for a provider that offers 24/7 support, has a good response time, and communicates clearly and effectively.
Geographical Coverage:
Depending on your business, you may need a provider offering services across multiple data centers in different regions. This can help ensure business continuity even in the face of regional disasters, making it an essential component of any cloud-based disaster recovery plan.
Are Cloud DR and DRaaS the Same?
Cloud Disaster Recovery, often abbreviated as Cloud DR, encompasses various strategies and processes to secure data and ensure its swift restoration in a cloud environment when a disaster strikes. It is a critical component of modern disaster recovery strategies designed to minimize the chance of data loss during a disaster.
Cloud DR typically involves cloud-to-cloud data center replication, where data and applications are deduplicated between a primary data center (or Region) and a chosen secondary data center (or Region) hosted in the cloud. This action creates a reliable backup data store location, ready and available around the clock to be accessed on-demand.
When it's time to invoke DR after a catastrophic event, the IT operations will shift from the primary location to a dedicated facility in a cloud-based secondary data center. This transfer lets businesses restore data and promptly resume critical operations, minimizing downtime and minimizing significant business costs.
Cloud DR leverages various cloud services provided by different cloud vendors, including public, private, or hybrid models. This flexibility allows businesses to choose a disaster recovery solution that fits their needs and preferences.
In contrast, Disaster Recovery as a Service (or DRaaS) offers a uniquely different proposition. DRaaS is a specialized service provided by some third-party cloud providers with the explicit purpose of managing disaster recovery efforts. The service provider handles everything from creating data backups to restoring affected data and failing over critical servers, thus allowing businesses to focus on their core operations.
DRaaS providers typically offer a comprehensive suite of services that include cloud storage for backups, data deduplication, regular DR testing, and managed IT operations such as failover and failback. These services provide a rounded, robust approach to disaster recovery planning and execution.
DRaaS often presents an attractive option for businesses lacking the in-house resources or expertise to manage disaster recovery. Third-party providers handle all aspects of disaster recovery, from data mirroring to backup storage and even the restoration of critical files. Doing so ensures that even in the face of potential disasters, businesses can recover data and resume operations promptly.
Have a Strong Cloud Backup Solution
A robust cloud-native backup solution is the cornerstone of any effective Cloud Recovery Plan. It protects your data and ensures the business can quickly rebound in disaster. Organizations must carefully select a cloud backup solution that aligns with their specific needs and operational realities to gain these benefits.
Implementing a cloud backup solution is more cost-effective than traditional, on-premises backup solutions. There is no need for significant upfront investment in hardware and the ongoing costs associated with maintenance and upgrades.
Many cloud backup solutions offer automated backup options. This means that backups of data stored elsewhere can be scheduled regularly, ensuring that your data is always current, thus reducing the risk of data loss.
Why Is a Cloud Disaster Recovery Plan Important?
Businesses heavily depend on their information systems, making a cloud disaster recovery plan an indispensable asset. This plan is your defense mechanism against disruptions, from natural disasters to cyberattacks and anything else that could compromise your critical data and IT infrastructure.
A cloud DRP is important for several reasons. Primarily, it guarantees business continuity, which is essential in maintaining customer trust and mitigating potential revenue losses. Without a robust disaster recovery solution, businesses risk prolonged downtime, damaging their reputation and competitive standing.
Moreover, a cloud DRP protects against data loss. In the modern world, where data is valuable, losing critical data can lead to a business disaster. A cloud disaster recovery solution performs data replication and frequent backups, minimizing the risk of losing stored data when a disaster occurs.
Finally, a cloud disaster recovery plan helps meet compliance with industry regulations that mandate businesses to have a disaster recovery (DR) plan. Not adhering to these regulations could result in substantial penalties and potential legal ramifications.
Creating a Cloud-Based Disaster Recovery Plan
Writing a Cloud DRP is similar to any other disaster recovery plan. Here are some of the critical areas to highlight:
Risk Assessment: Begin with a thorough business impact analysis to understand potential risks that could disrupt your operations. Identify essential systems, applications, data, and threats that threaten day-to-day business operations.
Define Recovery Objectives: With identified risks, define your Recovery Time Objective (RTO) and Recovery Point Objective (RPO). These values are essential, so spend time making sure the recommendations are accurate; remember the entire Cloud DRP recovery objectives must be achievable.
Choose a Cloud Service Provider: Selecting a reliable cloud provider is critical. Consider the provider's reliability, security measures, compliance certifications, and the cost of their services. You can read more about Atlantic.Net DRaaS here.
Implement Backup and Replication Strategies: Backups are a vital part of any DR strategy. It's critical to utilize regular backups and a proven data replication strategy in cloud environments to ensure data availability and minimize data loss.
Plan Testing and Updates: Regularly testing and updating the DR plan is essential. This ensures the plan is effective and relevant as your business changes. Your chosen provider should perform at least one annual DR test. After each test, the DRP should be reviewed and updated as required.
Cloud Disaster Recovery Planning with Atlantic.Net
Cloud disaster recovery planning is an ongoing process involving regular review, testing, and updating of the plan. The planning process includes training staff members on their roles during a serious disaster event and how to execute the DR plan effectively.
A proactive approach not only readies your organization for unexpected events but also helps to provide a roadmap for recovery, thereby ensuring the resilience and longevity of your business operations. Cloud-based DR leverages virtual machines and cloud resources, making it possible to recover data swiftly and effectively, even if your local data center is compromised. Cloud platforms offer an off-site DR solution, ensuring your critical data is secure and readily available when needed.
Prepare for the unexpected with Atlantic.Net's Cloud Disaster Recovery (DR) services. Safeguard your critical data from system failures, cyberattacks, and natural disasters. Benefit from our reliable infrastructure, flexible customization options, and rapid recovery solutions.
Count on our expert support to ensure business continuity. Don't wait for a crisis to strike—take proactive measures now.
Visit Atlantic.Net's website to learn more and protect your data, ensuring uninterrupted operations and peace of mind. Act today with Atlantic.Net's Cloud DR services to secure your business's future.
### HIPAA and Electronic Health Records: Ensuring Patient Confidentiality
Understanding HIPAA and Electronic Health Records
The Health Insurance Portability and Accountability Act (HIPAA) is a federal law that plays a crucial role in protecting the privacy and security of patient health information. HIPAA has been a pivotal force in safeguarding the confidentiality of delicate medical data. A feature of HIPAA's significance is its applicability to Electronic Health Records (EHRs). These digital analogs of conventional paper charts encapsulate a broad spectrum of a patient's health history, encompassing symptoms, diagnoses, medications, lab results, vital signs, vaccinations, and reports generated from diagnostic tests.
The shift from paper records to EHRs has fundamentally revolutionized the healthcare industry. EHRs introduce many advantages, including enhancing care quality, efficiency of care provision, and convenience in healthcare delivery. They empower healthcare professionals to employ information more effectively, improving patient care quality and efficacy.
How HIPAA & EHR Interact
HIPAA regulations play a critical role in preserving the privacy and security of both traditional paper-based and electronic health records. As per HIPAA's stipulations, the communication of health records can only occur under specific conditions, such as through anonymized data or with the patient's consent. This implies that your privacy rights are shielded by federal law whether your health information is stored in a paper format or electronically.
The Privacy Rule under HIPAA assures that patients retain control over their health information, irrespective of its format. The HIPAA Security Rule also establishes specific measures to protect electronic health information. These measures include user access controls, typically implemented through usernames and passwords (with multi-factor authentication enabled), encryption of EHR files, and a comprehensive audit log that tracks file access, authorized changes, and the individuals involved.
Suppose a breach impacts a population exceeding 500 individuals within a particular state or jurisdiction. In that case, it becomes obligatory for the healthcare provider to notify prominent media channels catering to that state or jurisdiction. This requirement ensures transparency and holds healthcare providers accountable for protecting patient information.
Best Practices for Maintaining Patient Confidentiality in Electronic Health Records
Healthcare organizations must maintain patient confidentiality in EHRs. These practices, as outlined in the American Medical Association's Patient Records Playbook, include:
Understanding Your EHR's Capabilities: It's essential to familiarize yourself with the capabilities of your Electronic Health Records system. This includes knowing how to produce records, what methods are available for your EHR vendor to produce records, and how to handle specific requests, such as diagnostic imaging tests.
Promote Greater Use of Electronic Records Among Patients: Encourage patients to use electronic records. This facilitates better care and lower costs and empowers patients with access to their health information. Remember, electronic patient access is a right, not a privilege.
Handling Third-Party Requests: If a third party makes a request and does not seem to be in accordance with the patient's instructions, it is necessary to provide a HIPAA-compliant authorization form. If you need more clarification, it's recommended to contact the patient to confirm that the request is at their direction.
Patient Communication: Inform patients and their caregivers upon receiving their record request and, if feasible, provide an approximate timeframe for the records' delivery. This proactive communication can alleviate anxiety, foster trust, and enhance the practice's relationship with patients.
Working with Caregivers: When working with caregivers, it is essential to acknowledge that many unwell patients may rely on the support of their family members to access their medical records. Collaborating with these caregivers and respecting the patient's wishes is essential.
Atlantic.Net's HIPAA Hosting Service: A Key Player in Ensuring Patient Confidentiality
Atlantic.Net is a reputable hosting service provider specializing in ensuring compliance with HIPAA regulations. We play a crucial role in maintaining the confidentiality and security of electronic health records. Our hosting service incorporates robust security measures and cutting-edge technologies that adhere to the stringent requirements set by HIPAA.
About Atlantic.Net's HIPAA-Compliant Environment
Atlantic.Net offers a secure environment for storing and managing electronic health records. We prioritize protecting patient information and employ advanced security measures to achieve this goal. These measures collectively work to safeguard electronic health information.
We utilize access control tools such as passwords and PINs to prevent unauthorized access to patient information. By encrypting access, only authorized individuals can gain entry to the system, further bolstering the security of patient data.
Our HIPAA platform encrypts all static data at rest, such as files saved to disk, and all data in transit, such as network traffic between Atlantic.Net and the Healthcare provider. This adds an extra layer of security, making it difficult for unauthorized individuals to access the information.
Our SIEM-powered audit trail tools are another significant aspect of Atlantic.Net's HIPAA hosting service. It records who accesses patient information, what changes were made, and when. This feature provides a clear record of all activities related to a patient's electronic health record, enabling healthcare providers to monitor access and changes effectively.
In addition to these security measures, Atlantic.Net's HIPAA hosting service offers a range of features that further enhance the protection of electronic health records. These include HIPAA-compliant web and database hosting, managed HIPAA cloud and dedicated servers, and secure block storage. These solutions are designed specifically for healthcare applications, ensuring they meet and exceed the administrative, physical, and technical safeguards mandated by HIPAA regulations.
Our HIPAA-compliant hosting solutions are SOC 2 and SOC 3 certified, HIPAA and HITECH audited, demonstrating our commitment to maintaining the highest security and compliance standards. The hosting platform is secured to leading industry standards, providing a highly durable, feature-rich solution powered by the latest technology. This ensures breakneck performance in dedicated and cloud server environments, backed by a 100% uptime Service Level Agreement (SLA).
Managed HIPAA Hosting
Atlantic.Net also offers a range of managed services that can be added to the HIPAA hosting services package. These include backups, server management, intrusion prevention systems, vulnerability scans, anti-malware, and network security. These additional services can significantly enhance the security of electronic health records, providing an extra layer of protection against potential threats.
We comply with HIPAA by providing a Business Associate Agreement (BAA) with all HIPAA hosting plans. This critical requirement under HIPAA regulations ensures that any external organization handling electronic protected health information meets its HIPAA responsibilities.
If you're seeking a reliable and secure solution for your healthcare data needs, consider Atlantic.Net's HIPAA-compliant hosting. Don't just meet the standards; exceed them.
Take action today and ensure your patient data is protected with Atlantic.Net.
### Disaster Recovery Plan
What Is a Disaster Recovery Plan (DRP)?
A Disaster Recovery Plan (DRP) is a detailed, step-by-step strategy to restore the ordinary business operations of an organization's IT infrastructure following a disaster scenario that affects the primary business site.
When disaster strikes, the DRP becomes an essential playbook for restoring critical business servers, guiding the recovery team through the process to minimize disruption to operations and ensure the continuity of cloud services.
A disaster recovery plan should include the end-to-end process of how your business should respond during a crisis. It is a prepared document incorporating a clearly defined business continuity strategy. The DRP explains what strictly your business classifies as a disaster and outlines the critical in-scope assets relevant to an overall business continuity plan. The RDP documents which employees are vital to the disaster recovery strategy and explain the communication passage throughout the disaster recovery plans.
Furthermore, the DRP explains how to recover the business, such as failing over critical IT systems to a secondary location or recovering from backups. Once service is restored, it is essential to revisit the whole network disaster recovery plan, understand the lessons learned, and develop a fail-back strategy to restore services to their primary location.
This is a high-level summary of how disaster recovery plans work, but join us in this article as we delve into the fascinating world of technology recovery strategies, disaster recovery, business continuity, and disaster restoration.
Types of Disaster Recovery Plan
There are several types of disaster recovery plans, and understanding these can help businesses choose the most cost-effective solution and strategy to prevent data loss and minimize business impact analysis and downtime.
Data Backup: The simplest form of an IT disaster recovery plan involves storing business data either offsite or at a secondary location. The backup data becomes a recovery point objective to minimize the impact of catastrophic events. It's essential to ensure that all critical servers are backed up using a predefined backup schedule.
Hot Sites: These are typically facilities designed to maintain up-to-date copies of data at all times, such as a data center. Hot sites are used to maintain highly available data replicas of critical servers, using server and storage replication, and businesses can failover services to the hot site rapidly.
Cold Sites: These are secondary, less frequently used facilities with essential infrastructure that businesses can switch to in the event of a natural disaster or significant business disruption. The alternate site will typically provide office space and leased server infrastructure during a disaster. Server recovery generally is a slower process, usually from backups.
Disaster Recovery as a Service: DRaaS is a cloud-based solution capable of seamlessly migrating business services to the cloud.
Backup as a Service (BaaS): Like DRaaS, this cloud-based solution focuses on backing up an organization's data, ensuring data availability during a disaster.
Physical Fortification of Data Center: This strategy involves using physical disaster recovery tools, such as fire suppression tools and backup power sources, to protect the data center from disasters. However, this strategy is not effective against cyberattacks.
Virtualization involves backing up data or replicating an organization's entire virtual computing environment offsite. VMware vSphere replication is a standard tool used in this scenario, and it's often used in private clouds.
Point-in-Time Copies: This strategy involves taking a snapshot of a database or application at a given moment. The image can then be restored, provided it's stored offsite or on a virtual machine unaffected by the disaster.
Instant Recovery: Similar to point-in-time copies, instant recovery takes a snapshot of an entire virtual machine. This can then be restored to recover systems and data.
How Does Disaster Recovery Differ from a Simple Backup?
While backups are crucial when a disaster occurs, they are not a complete solution. Backups involve storing copies of data, which can be used to restore lost data. However, a disaster recovery plan goes beyond just data recovery.
A DRP incorporates recovery objectives, recovery time objectives, recovery point objectives, and business continuity planning. It outlines the steps to recover data and return the entire system to normal business operations, including critical systems, business processes, and other aspects of the IT infrastructure.
What to Include in a Disaster Recovery Plan
#1: Define What a Disaster Recovery Scenario Is
A Disaster Recovery (DR) scenario refers to a catastrophic event that disrupts the regular operation of critical assets of the business. These disruptive events could range from cyber attacks to power outages, natural disasters, human error, hardware failure, or equipment failure.
A DR scenario typically results in losing access to business applications, data streams, critical documents, and other system components, significantly jeopardizing your business operations.
#2: Know When to Declare a Disaster
Understanding when to declare a disaster is crucial to minimizing downtime and loss of data. A disaster should be reported when the disruption to your normal operations exceeds the acceptable threshold defined in your disaster recovery plan.
Declaring a disaster requires accurate timing and should only be declared by authorized persons predefined in the DRP.
#3: How to Invoke Disaster Recovery?
Invoking a disaster recovery plan involves activating your technology and internal disaster recovery strategies. This could include switching to a disaster recovery site, starting backup systems, or rerouting network traffic.
The disaster recovery plan should clearly define the process, and everyone involved should know the steps to take.
#4: Communication
During a DR scenario, clear and efficient communication is critical. The disaster recovery incident management plan should include a list of key personnel to be contacted, their roles and responsibilities, and the methods of communication to be used. This may involve liaising with external entities such as data security services or technology partners.
#5: Key Roles and Responsibilities
The recovery management team is the backbone of the disaster recovery process. Their roles and responsibilities should be clearly outlined in the disaster recovery plan. This includes managing communications and internal recovery strategies, overseeing the functionality of the disaster recovery site, and maintaining the continuity of business applications and services.
#6: Run Books
Your disaster recovery plan should include detailed steps to maintain business operations during a disaster. These might involve relocating to a disaster recovery center, switching to redundant systems, implementing manual processes, or utilizing cloud-based applications.
#7: Set a Recovery Time Objective
The Recovery Time Objective (RTO) is the maximum acceptable time your business or government agencies can operate without the disrupted service.
Your disaster recovery plan should detail your RTO for each critical service and the strategies to achieve these objectives.
#8: Set a Recovery Point Objective
The Recovery Point Objective (RPO) for backup data is the maximum acceptable amount of data loss measured in time. In other words, the age of the files must be recovered from backup storage for normal operations to resume if a computer, system, or network goes down.
Your disaster recovery plan should state your RPO for each critical or sensitive data set.
#9: Define the Disaster Recovery Process
Your disaster recovery plan should include clearly defined disaster recovery procedures and processes illustrated with a flowchart of activities. This will serve as a visual guide for the disaster recovery team and ensure a systematic approach to disaster recovery. Tech teams should be able to follow predefined run-books to complete the required disaster recovery tasks.
#10: Root Cause Analysis
After the immediate disaster response procedures and the disaster is under control, it's essential to conduct a root cause business impact analysis to identify what caused the disaster and how it can be prevented in the future. Lessons learned from risk analysis should be incorporated into an updated disaster recovery plan template to ensure continuous improvement.
#11: Continuously Test and Evolve the DR Plan
The disaster recovery plan should not be a static document. Regular testing and updating of the plan are necessary to account for changes in technology, personnel, and business needs after natural disasters. A disaster recovery testing strategy is critical to successful DR.
Updating your disaster recovery plan to reflect any deficiencies, errors, and omissions identified during the DR process is crucial.
What to Include in a Business Continuity Plan
Write a Mission Statement for the Plan:
Describe the business continuity plan's objectives, including when it needs to be completed and the budget for disaster and recovery preparation.
Set Up Governance:
Describe the business continuity team, including names or titles, role designations, and contact information. Define roles, lines of authority and succession, and accountability.
Write the Plan Procedures and Appendices:
This is the core of your plan and should include procedures, agreements, and resources. The goal should be specific, potentially using diagrams and illustrations. Remember to include checklists and work instructions, and note who on the team is responsible for knowing plan details.
Detail a Training Program:
Determine the curriculum and timelines for initial and refresher training. Specify which roles will actively lead training and who must receive training.
Set Procedures for Testing Recovery and Response:
Create test guidelines and schedules for testing. To review the plan, consider reaching out to people who did not write the plan. Put together the forms and checklists that attendees will use during tests.
Establish a Process for Capturing Insights:
Build debriefs into your processes; these meetings should occur after training sessions and as after-action reports for incidents.
Disaster Recovery Plan Examples
Examples of disaster recovery plans can be found in various industries. For instance, check out the Atlantic.Net DRP for healthcare workloads.
Scope and Objectives of DR Planning
The scope of disaster recovery planning is broad, encompassing all aspects of the organization's IT infrastructure. Its primary objective is to minimize the impact of a disaster on business operations and to ensure the swift recovery of critical systems and data.
Another critical objective of disaster planning is to protect sensitive data, ensuring it remains secure even during a disaster.
Business Continuity vs. Disaster Recovery Plans: Do You Need Both?
Business continuity planning and disaster recovery planning are closely related but serve different purposes. Business continuity planning is about maintaining operations during a disaster, while a cloud disaster recovery plan focuses on restoring IT infrastructure and systems after a severe disaster.
Both are critical to an organization's resilience and should be part of a comprehensive risk assessment and management strategy.
The Risks of Not Having a Business Continuity and Disaster Recovery Plan
The risks of not having Business Continuity and Disaster Recovery Plans are far-reaching. From lost revenue during downtime to reputational damage due to data loss, the impact can be catastrophic. In worst-case disaster scenarios, companies without such a plan may never recover from a significant event.
How Is Business Continuity Planning Different from Disaster Recovery Planning?
While they are often used interchangeably, business continuity planning, enterprise resource management, and disaster recovery planning are distinct but interconnected components of a comprehensive approach to dealing with disruptions.
A business continuity plan is about maintaining the essential functions of a business during and after a disaster. It encompasses everything from managing human resources to maintaining supply chains and information technology systems and ensuring that business operations continue to function.
On the other hand, disaster recovery is a more focused subset of the business continuity plan. It deals explicitly with restoring IT infrastructure and systems, such as data centers and networks, after a disruption.
This might involve strategies like data backup and disaster recovery sites, hardware and software restoration, and the implementation of alternate work sites for IT operations.
Atlantic.Net Disaster Recovery Service
Available in multiple geographically disparate locations, our advanced technology can fail servicer from a primary data center location to a secondary site, ensuring your data is protected and readily available during a disaster.
Our state-of-the-art facilities are built to withstand even the most severe natural disasters and offer unparalleled security. We can meet heavy traffic demands with facilities in eight data center locations and provide offsite storage hosting.
Take the first step towards virtualized disaster recovery plan to protect your business from the unforeseen. Contact Atlantic.Net today and give your business the disaster recovery solution it deserves.
### How to Install Node.js on Fedora
Node.js is a free, open-source, cross-platform JavaScript runtime environment. It is a backend that runs on Linux, Windows, and Mac. It is used to build scalable server-side and networking applications. It provides an event-driven and asynchronous environment to build different applications such as command line, web, chat, and more.
This post will show you how to install Node.js on Fedora.
Install Node.js Using Default Repo
By default, Node.js is available in the Fedora default repo. You can install it with the following command.
dnf install nodejs
After the installation, you can verify the Node.js version with the following command.
node -v
Output:
v14.19.0
To remove the Node.js from your server, run the following command.
dnf remove -y nodejs npm
Install Node.js Using Node Source
First, install all required dependencies using the following command.
dnf install -y gcc-c++ make
Next, add the Node source repo with the following command.
curl -sL https://rpm.nodesource.com/setup_18.x | bash -
After that, install Node.js with the following command.
dnf install nodejs
You can verify the Node.js version with the following command.
node -v
Output:
v18.19.0
Now, remove Node.js using the following command.
dnf remove -y nodejs npm
Install Node.js Using NVM
NVM provides a simple and easiest way to install multiple versions of Node.js via the command line.
First, install Node.js with the following command.
curl -o- https://raw.githubusercontent.com/nvm-sh/nvm/master/install.sh | bash
Next, activate the NVM environment with the following command.
source ~/.bashrc
Next, use the following command to install Node.js version 16.14.
nvm install v16.14
Output:
Downloading and installing node v16.14.2...
Downloading https://nodejs.org/dist/v16.14.2/node-v16.14.2-linux-x64.tar.xz...
################################################################################################################################################################# 100.0%
Computing checksum with sha256sum
Checksums matched!
Now using node v16.14.2 (npm v8.5.0)
Creating default alias: default -> v16.14 (-> v16.14.2)
You can now verify the Node.js version with the following command.
node -v
Output:
v16.14.2
Create a Sample App Using Node.js
First, create an app.js file with the following command.
nano app.js
Add the following code.
var http = require('http');
http.createServer(function (req, res) {
res.writeHead(200, {'Content-Type': 'text/plain'});
res.end('Node.js is installed on Fedora');
}).listen(3001, "0.0.0.0");
console.log('Server running at http://0.0.0.0:3001/');
Next, run the Node.js application using the following command.
node --inspect app.js
You will get the following output.
Debugger listening on ws://127.0.0.1:9229/a9c46826-65d4-4088-83ae-fbd1e917832a
For help, see: https://nodejs.org/en/docs/inspector
Server running at http://0.0.0.0:3001/
Now, open your web browser and access the Node.js application using the URL http://your-server-ip:3001. You should see your sample application on the following screen.
Conclusion
This tutorial explained how to install Node.js using different ways on Fedora. We also showed you how to create and run a Node.js application. You can now try Node.js on VPS hosting from Atlantic.Net!
### How to Setup SSH Key-Based Authentication on Fedora
SSH is a secure shell protocol that provides secure login from one machine to another. Linux system administrators use it to manage and control remote servers via the command line.
Public Key Authentication is a secure method to connect remote SSH servers using a public key instead of a password. It uses a cryptographic key pair for validation that helps prevent brute-force attacks. It helps the system administrator log in to many accounts without managing many different passwords.
This post will show you how to set up SSH public key authentication on Fedora.
Step 1 - Generate an SSH Public Key
First, you must generate an SSH key pair on your local system to authenticate your remote server. Run the following command on your local Linux system to generate an SSH key pair.
ssh-keygen -t rsa
You will be asked to define a location to save the key pair.
Generating public/private rsa key pair.
Enter file in which to save the key (/home/vyom/.ssh/id_rsa):
/home/vyom/.ssh/id_rsa already exists.
Overwrite (y/n)? y
Type Y, press the Enter key to save the key at the default location, and overwrite an existing key pair. You will be asked to set a passphrase for the key pair.
Enter passphrase (empty for no passphrase):
Enter same passphrase again:
Just press Enter to continue. You should see the following output.
Your identification has been saved in /home/vyom/.ssh/id_rsa
Your public key has been saved in /home/vyom/.ssh/id_rsa.pub
The key fingerprint is:
SHA256:i0kzweXQHdq6SjAGbvdroC8Nn601rfsEp/OnATLedJI vyom@ubuntupc
The key's randomart image is:
+---[RSA 3072]----+
| ...... |
| . +.o. |
| . o o . |
| . . o . |
| o B E S |
| ..+.X & o |
| =.+@ * |
| o +ooO .. |
| ooo=o+o |
+----[SHA256]-----+
The above command will generate SSH key pairs at /home/vyom/.ssh/id_rsa.
Step 2 - Copy SSH Key to Remote Server
Next, you must copy your generated public key to the remote server. There are many ways to copy an SSH key to the remote server.
Copy SSH Key Using ssh-copy-id
You can copy an SSH public key to the remote server using the ssh-copy-id command.
ssh-copy-id root@ssh-server
You will be asked to provide the root password of the remote machine to copy the public key.
root@104.245.35.103's password:
Number of key(s) added: 2
Now try logging into the machine, with: "ssh 'root@104.245.35.103'"
and check to make sure that only the key(s) you wanted were added.
Copy SSH Key Using SSH
You can also use the SSH and cat command to copy the public key to the remote server.
cat ~/.ssh/id_rsa.pub | ssh root@ssh-server "mkdir -p ~/.ssh && cat >> ~/.ssh/authorized_keys"
Copy SSH Key Manually
If you have not accessed the remote server via SSH, you can copy the content of the id_rsa.pub file to the ~/.ssh/authorized_keys file on a remote server.
First, run the cat command on your local system to display the content of the id_rsa.pub file.
cat ~/.ssh/id_rsa.pub
Output.
ssh-rsa AAAAB3NzaC1yc2EAAAADAQABAAABgQDO4fELhgdYFQyh6Iox65p2q4HPRRlkkuX3ReNJ6vmONPgptJTwvB1YUjK1V8BDfj9JPtEUw0nSW668OVuLI0xceDOjVmmYgNBpgt8UlIxJlIIDqFjcXx/Yk3in+cK7aVRIgyFfmjMsQ0lghnZzrO35XncGqRU3xq8n8AGzTk82ZkxccpqVXOdjLN7DqdNLWa0hvz+mGmDCXqQra5hyi36RDbY5krwqvlgg2+nEWGfjspMdjLQaFbcOucmN0EBK2pMoDfUzZ3yAmiqoJswUj1H9u9Jk7/ASIpF7JaxIUrg6A8UI5qCkskPoWPKl8/b0vQmF7+e+bAdf9bsaZbj6Gq5yMkwBED8LitlMtytxE63wSbvaVOXWU3s8ULkHXOJ2L1iF3+H8oU/qM8D4FOBQ7Je1Ujtikye/YtF0dFDx+kfv2gAYRgauCReIQXNc/2/dN3E/kW/7/EtOHATip9CWROtVVsdwPL8ayPaZ4J05UZVx74B9USCLDXbGtiCTUs5PP3k= vyom@ubuntupc
Next, copy the above content then login to your remote server, and create a .ssh directory;
mkdir -p ~/.ssh
Next, create an authorized_keys file.
nano ~/.ssh/authorized_keys
Paste the content of the id_rsa.pub file.
ssh-rsa AAAAB3NzaC1yc2EAAAADAQABAAABgQDO4fELhgdYFQyh6Iox65p2q4HPRRlkkuX3ReNJ6vmONPgptJTwvB1YUjK1V8BDfj9JPtEUw0nSW668OVuLI0xceDOjVmmYgNBpgt8UlIxJlIIDqFjcXx/Yk3in+cK7aVRIgyFfmjMsQ0lghnZzrO35XncGqRU3xq8n8AGzTk82ZkxccpqVXOdjLN7DqdNLWa0hvz+mGmDCXqQra5hyi36RDbY5krwqvlgg2+nEWGfjspMdjLQaFbcOucmN0EBK2pMoDfUzZ3yAmiqoJswUj1H9u9Jk7/ASIpF7JaxIUrg6A8UI5qCkskPoWPKl8/b0vQmF7+e+bAdf9bsaZbj6Gq5yMkwBED8LitlMtytxE63wSbvaVOXWU3s8ULkHXOJ2L1iF3+H8oU/qM8D4FOBQ7Je1Ujtikye/YtF0dFDx+kfv2gAYRgauCReIQXNc/2/dN3E/kW/7/EtOHATip9CWROtVVsdwPL8ayPaZ4J05UZVx74B9USCLDXbGtiCTUs5PP3k= vyom@ubuntupc
Next, edit the SSH configuration file on the remote machine and disable the password-based authentication.
nano /etc/ssh/sshd_config
Change the following line:
PasswordAuthentication no
Save and close the file, then restart the SSH service to apply the changes.
systemctl restart sshd
Step 3 - Verify Remote Server Login Using SSH Key
At this point, SSH public key authentication is set up between your local and remote systems. Now it's time to authenticate the remote server using the SSH key.
Run the following command on your local system to authenticate the remote server.
ssh root@ssh-server-ip
If everything is fine, you will get into the remote server, as shown below.
Last login: Sun May 7 03:20:15 2023 from 49.34.56.34
[root@fedora ~]#
Conclusion
In this post, we explained how to set up an SSH key-based authentication on the Fedora server. You can now easily use SSH key-based authentication in your local system to manage multiple servers via SSH. You can now try to set up SSH key-based authentication on VPS hosting from Atlantic.Net!
### How to Install and Use PIP Package Manager on Fedora
PIP is a Python package manager allowing you to install and manage packages not part of the Python standard library. All Python packages are hosted on an online repository called Python Package Index. PIP connects this repository, then downloads and installs Python packages to your system. PIP provides a simple and easiest way to install locally user-defined projects using a setup.py file. PIP is a command line utility that helps you to install, reinstall, or uninstall packages with a single command.
This post will show you how to install and manage Python packages using PIP on Fedora.
Install PIP on Fedora
By default, the PIP package is not installed on Fedora, so you will need to install it first. You can install it using the following command.
dnf install python3-pip
Once the PIP package is installed, you can verify the PIP version with the following command.
pip3 --version
Output.
pip 21.0.1 from /usr/lib/python3.9/site-packages/pip (python 3.9)
It is also recommended to upgrade PIP to the latest version. You can upgrade it with the following command.
pip3 install --upgrade pip
Output.
Requirement already satisfied: pip in /usr/lib/python3.9/site-packages (21.0.1)
Collecting pip
Downloading pip-23.1.2-py3-none-any.whl (2.1 MB)
|████████████████████████████████| 2.1 MB 12.6 MB/s
Installing collected packages: pip
Successfully installed pip-23.1.2
Now, verify the PIP version again with the following command.
pip3 --version
Output:
pip 23.1.2 from /usr/local/lib/python3.9/site-packages/pip (python 3.9)
To see all available options of the PIP command, run the following command.
pip3 --help
Output.
Usage:
pip3 [options]
Commands:
install Install packages.
download Download packages.
uninstall Uninstall packages.
freeze Output installed packages in requirements format.
inspect Inspect the python environment.
list List installed packages.
show Show information about installed packages.
check Verify installed packages have compatible dependencies.
config Manage local and global configuration.
search Search PyPI for packages.
cache Inspect and manage pip's wheel cache.
index Inspect information available from package indexes.
wheel Build wheels from your requirements.
hash Compute hashes of package archives.
completion A helper command used for command completion.
debug Show information useful for debugging.
help Show help for commands.
Manage Packages with PIP
PIP provides a simple and easiest way to install and manage Python packages via the command line.
For example, to install the scrapy package, run the following command.
pip3 install scrapy
To verify the package information, run the following command.
pip3 show scrapy
Output:
Name: Scrapy
Version: 2.8.0
Summary: A high-level Web Crawling and Web Scraping framework
Home-page: https://scrapy.org
Author: Scrapy developers
Author-email: pablo@pablohoffman.com
License: BSD
Location: /usr/local/lib/python3.9/site-packages
Requires: cryptography, cssselect, itemadapter, itemloaders, lxml, packaging, parsel, protego, PyDispatcher, pyOpenSSL, queuelib, service-identity, setuptools, tldextract, Twisted, w3lib, zope.interface
Required-by:
To get a list of all available packages, run the following command.
pip3 list
Output.
Package Version
------------------ ---------
argcomplete 1.12.0
attrs 23.1.0
Automat 22.10.0
certifi 2022.12.7
cffi 1.15.1
charset-normalizer 3.1.0
constantly 15.1.0
cryptography 40.0.2
cssselect 1.2.0
dbus-python 1.2.16
decorator 4.4.2
distro 1.5.0
filelock 3.12.0
gpg 1.15.1
hyperlink 21.0.0
idna 3.4
incremental 22.10.0
itemadapter 0.8.0
itemloaders 1.1.0
jmespath 1.0.1
libcomps 0.1.15
lxml 4.9.2
nftables 0.1
ntpsec 1.2.0
packaging 23.1
parsel 1.8.1
pexpect 4.8.0
To list all outdated packages, run the following command.
pip3 list --outdated
Output:
Package Version Latest Type
--------------- ------- ------------ -----
argcomplete 1.12.0 3.0.8 wheel
dbus-python 1.2.16 1.3.2 sdist
decorator 4.4.2 5.1.1 wheel
distro 1.5.0 1.8.0 wheel
libcomps 0.1.15 0.1.15.post1 wheel
ptyprocess 0.6.0 0.7.0 wheel
PyGObject 3.40.1 3.44.1 sdist
python-augeas 0.5.0 1.1.0 sdist
python-dateutil 2.8.1 2.8.2 wheel
setuptools 53.0.0 67.7.2 wheel
six 1.15.0 1.16.0 wheel
slip 0.6.4 20191113 sdist
systemd-python 234 235 sdist
To install any package, run the following command.
pip3 uninstall scrapy
Output:
Found existing installation: Scrapy 2.8.0
Uninstalling Scrapy-2.8.0:
Would remove:
/usr/local/bin/scrapy
/usr/local/lib/python3.9/site-packages/Scrapy-2.8.0.dist-info/*
/usr/local/lib/python3.9/site-packages/scrapy/*
Proceed (Y/n)? Y
Successfully uninstalled Scrapy-2.8.0
Conclusion
This post explained how to install and manage Python packages with PIP. You can now use PIP in your development environment to install any Python dependency. You can now try PIP on VPS hosting from Atlantic.Net!
### How to Install Netbox on Fedora
Netbox is an IP address management and data center infrastructure management tool developed by the DigitalOcean team. It is built on the Django Python framework and designed to address the needs of network and infrastructure engineers. It has a simple and user-friendly interface where you can manage all devices, racks, and IP addresses from a central place.
This post will show you how to install Netbox on Fedora.
Step 1 - Install and Configure PostgreSQL
Netbox uses PostgreSQL as a database backend, so you will need to install and configure PostgreSQL on your server.
First, reset the default PostgreSQL repo and enable the PostgreSQL version 14 repo using the following command.
dnf update -y
dnf module reset postgresql -y
dnf module enable postgresql:14
Next, install the PostgreSQL server using the following command.
dnf install postgresql-server postgresql
After the installation, initialize the PostgreSQL database with the following command.
postgresql-setup --initdb
Next, start and enable the PostgreSQL service with the following command.
systemctl enable --now postgresql
Next, edit the PostgreSQL configuration file:
nano /var/lib/pgsql/data/pg_hba.conf
Change the following lines:
host all all 127.0.0.1/32 md5
host all all ::1/128 md5
Save the file, then restart the PostgreSQL using the following command.
systemctl restart postgresql
Next, log in to the PostgreSQL shell.
sudo -u postgres psql
Once logged in, set the Postgres password, and create a database and user with the following command.
ALTER USER postgres WITH PASSWORD 'securepassword';
CREATE DATABASE netboxdb;
CREATE USER netbox WITH ENCRYPTED PASSWORD 'securepassword';
GRANT ALL PRIVILEGES ON DATABASE netboxdb TO netbox;
\q
Step 2 - Install Redis Server
Netbox also requires Redis to be installed on your server. You can install it with the following command.
dnf install redis -y
Once installed, start and enable the Redis service to start at system reboot.
systemctl start redis
systemctl enable redis
Step 3 - Install and Configure Netbox
First, install all the required dependencies using the following command.
dnf -y groupinstall "Development Tools"
Next, add a user for Netbox.
useradd -r -d /opt/netbox -s /usr/sbin/nologin netbox
Next, create a Netbox directory and download the latest Netbox version inside that directory.
mkdir -p /opt/netbox
cd /opt/netbox
git clone -b master --depth 1 https://github.com/netbox-community/netbox.git .
Next, change the ownership of the Netbox directory.
chown -R netbox:netbox /opt/netbox
Next, rename the Netbox configuration file and generate a secret key.
cd /opt/netbox/netbox/netbox
sudo -u netbox cp configuration_example.py configuration.py
sudo -u netbox python3 ../generate_secret_key.py
Output:
%ACU8k^7fR6Uk+aZiYfXtYmS&7cTor+tv1XB74eN#gs$%lGRu(
Next, edit the Netbox configuration file and define your database settings, allowed hosts, and secret key.
nano configuration.py
Change the following lines:
# domain and IP address
ALLOWED_HOSTS = ['0.0.0.0', 'netbox.example.com']
# database configuration
DATABASE = {
'NAME': 'netboxdb', # Database name
'USER': 'netbox', # PostgreSQL username
'PASSWORD': 'securepassword', # PostgreSQL password
'HOST': 'localhost', # Database server
'PORT': '', # Database port (leave blank for default)
'CONN_MAX_AGE': 300, # Max database connection age (seconds)
}
SECRET_KEY = '%ACU8k^7fR6Uk+aZiYfXtYmS&7cTor+tv1XB74eN#gs$%lGRu('
Next, run the following command to create a virtual environment for Netbox.
sudo -u netbox /opt/netbox/upgrade.sh
Output:
WARNING: No existing virtual environment was detected. A new one has
been created. Update your systemd service files to reflect the new
Python and gunicorn executables. (If this is a new installation,
this warning can be ignored.)
netbox.service ExecStart:
/opt/netbox/venv/bin/gunicorn
netbox-rq.service ExecStart:
/opt/netbox/venv/bin/python
After modifying these files, reload the systemctl daemon:
> systemctl daemon-reload
--------------------------------------------------------------------
Upgrade complete! Don't forget to restart the NetBox services:
> sudo systemctl restart netbox netbox-rq
Step 4 - Create a Superuser for Netbox
Next, activate the Netbox virtual environment using the following command.
source /opt/netbox/venv/bin/activate
Next, create a superuser for Netbox.
cd /opt/netbox/netbox
python3 manage.py createsuperuser
Define your Netbox admin user and password.
Username (leave blank to use 'root'): admin
Email address: hitjethva@gmail.com
Password:
Password (again):
Superuser created successfully.
Next, create a symbolic link of Netbox housekeeping.
ln -s /opt/netbox/contrib/netbox-housekeeping.sh /etc/cron.daily/netbox-housekeeping
Finally, deactivate from the virtual environment.
deactivate
Step 5 - Create a Systemd Service File for Netbox
First, cop the Gunicorn configuration file.
cp /opt/netbox/contrib/gunicorn.py /opt/netbox/gunicorn.py
Next, copy all the service files from Netbox to the systemd directory.
cp -v /opt/netbox/contrib/*.service /etc/systemd/system/
Next, reload the systemd daemon to apply the changes.
systemctl daemon-reload
Next, start and enable the Netbox service using the following command.
systemctl start netbox netbox-rq
systemctl enable netbox netbox-rq
You can now verify the status of the Netbox service with the following command.
systemctl status netbox netbox-rq
Output:
● netbox.service - NetBox WSGI Service
Loaded: loaded (/etc/systemd/system/netbox.service; disabled; vendor preset: disabled)
Active: active (running) since Sun 2023-05-07 04:39:29 EDT; 11s ago
Docs: https://docs.netbox.dev/
Main PID: 51952 (gunicorn)
Tasks: 6 (limit: 4666)
Memory: 408.1M
CPU: 13.030s
CGroup: /system.slice/netbox.service
├─51952 /opt/netbox/venv/bin/python3 /opt/netbox/venv/bin/gunicorn --pid /var/tmp/netbox.pid --pythonpath /opt/netbox/netbox --config /opt/netbox/gunicorn>
├─51954 /opt/netbox/venv/bin/python3 /opt/netbox/venv/bin/gunicorn --pid /var/tmp/netbox.pid --pythonpath /opt/netbox/netbox --config /opt/netbox/gunicorn>
├─51955 /opt/netbox/venv/bin/python3 /opt/netbox/venv/bin/gunicorn --pid /var/tmp/netbox.pid --pythonpath /opt/netbox/netbox --config /opt/netbox/gunicorn>
├─51956 /opt/netbox/venv/bin/python3 /opt/netbox/venv/bin/gunicorn --pid /var/tmp/netbox.pid --pythonpath /opt/netbox/netbox --config /opt/netbox/gunicorn>
├─51957 /opt/netbox/venv/bin/python3 /opt/netbox/venv/bin/gunicorn --pid /var/tmp/netbox.pid --pythonpath /opt/netbox/netbox --config /opt/netbox/gunicorn>
└─51958 /opt/netbox/venv/bin/python3 /opt/netbox/venv/bin/gunicorn --pid /var/tmp/netbox.pid --pythonpath /opt/netbox/netbox --config /opt/netbox/gunicorn>
May 07 04:39:29 fedora systemd[1]: Started NetBox WSGI Service.
May 07 04:39:29 fedora gunicorn[51952]: [2023-05-07 04:39:29 -0400] [51952] [INFO] Starting gunicorn 20.1.0
May 07 04:39:29 fedora gunicorn[51952]: [2023-05-07 04:39:29 -0400] [51952] [INFO] Listening at: http://127.0.0.1:8001 (51952)
May 07 04:39:29 fedora gunicorn[51952]: [2023-05-07 04:39:29 -0400] [51952] [INFO] Using worker: gthread
May 07 04:39:29 fedora gunicorn[51954]: [2023-05-07 04:39:29 -0400] [51954] [INFO] Booting worker with pid: 51954
May 07 04:39:29 fedora gunicorn[51955]: [2023-05-07 04:39:29 -0400] [51955] [INFO] Booting worker with pid: 51955
May 07 04:39:30 fedora gunicorn[51956]: [2023-05-07 04:39:30 -0400] [51956] [INFO] Booting worker with pid: 51956
May 07 04:39:30 fedora gunicorn[51957]: [2023-05-07 04:39:30 -0400] [51957] [INFO] Booting worker with pid: 51957
May 07 04:39:30 fedora gunicorn[51958]: [2023-05-07 04:39:30 -0400] [51958] [INFO] Booting worker with pid: 51958
● netbox-rq.service - NetBox Request Queue Worker
Loaded: loaded (/etc/systemd/system/netbox-rq.service; disabled; vendor preset: disabled)
Active: active (running) since Sun 2023-05-07 04:39:29 EDT; 11s ago
Docs: https://docs.netbox.dev/
Main PID: 51953 (python3)
Tasks: 3 (limit: 4666)
Memory: 137.0M
CPU: 6.628s
CGroup: /system.slice/netbox-rq.service
├─51953 /opt/netbox/venv/bin/python3 /opt/netbox/netbox/manage.py rqworker high default low
└─51961 /opt/netbox/venv/bin/python3 /opt/netbox/netbox/manage.py rqworker high default low
May 07 04:39:29 fedora systemd[1]: Started NetBox Request Queue Worker.
May 07 04:39:36 fedora python3[51953]: 08:39:36 Worker rq:worker:31d3dacea44b473cb9a5be6e63ab6480 started with PID 51953, version 1.14.1
May 07 04:39:36 fedora python3[51953]: 08:39:36 Subscribing to channel rq:pubsub:31d3dacea44b473cb9a5be6e63ab6480
May 07 04:39:36 fedora python3[51953]: 08:39:36 *** Listening on high, default, low...
Step 6 - Configure Nginx as a Reverse Proxy for Netbox
Next, you must install and configure Nginx as a reverse proxy to access the Netbox from the remote machine.
First, install the Nginx package using the following command.
dnf install nginx -y
Next, start and enable the Nginx service.
systemctl start nginx
systemctl enable nginx
Next, create a Netbox virtual host configuration file.
nano /etc/nginx/conf.d/netbox.conf
Add the following configuration.
server {
listen 80;
server_name netbox.example.com;
client_max_body_size 25m;
location /static/ {
alias /opt/netbox/netbox/static/;
}
location / {
proxy_pass http://127.0.0.1:8001;
proxy_set_header X-Forwarded-Host $http_host;
proxy_set_header X-Real-IP $remote_addr;
proxy_set_header X-Forwarded-Proto $scheme;
}
}
Next, edit the Nginx main configuration file.
nano /etc/nginx/nginx.conf
Add the following line after http{:
server_names_hash_bucket_size 64;
Save and close the file, then restart the Nginx service to apply the changes.
systemctl restart nginx
Step 7 - Access Netbox Web Interface
Now, open your web browser and access the Netbox admin interface using the URL http://netbox.example.com. You should see the following page.
Click on the login button. You should see the Netbox Login page.
Provide your admin username, password and click on the Sign IN button. You should see the Netbox dashboard on the following screen.
Conclusion
In this tutorial, we learned how to install Netbox on Fedora. We also learned to use Nginx as a reverse proxy to access the Netbox outside the network. You can now use Netbox in your organization to manage all devices from the central place. You can now try Netbox on VPS hosting from Atlantic.Net!
### How to Install WildFly Server on Fedora
WildFly, also known as JBoss, is an open-source and lightweight application server for building Java applications. It is cross-platform and offers a web-based interface that makes managing and configuring WildFly via a web browser easier. It is based on pluggable subsystems and is designed to provide users with a fast and stable Java runtime environment.
This post will show you how to install WildFly on Fedora.
Step 1 - Install Java OpenJDK
WildFly is a Java-based application, so Java JDK must be installed on your server. You can install it with the following command.
dnf install java-11-openjdk.x86_64
Once Java JDK is installed, you can verify the Java installation using the following command.
java --version
You will see the following output.
openjdk 11.0.15 2022-04-19
OpenJDK Runtime Environment 18.9 (build 11.0.15+10)
OpenJDK 64-Bit Server VM 18.9 (build 11.0.15+10, mixed mode, sharing)
Step 2 - Install WildFly and Configure
First, visit the WildFly official website, copy the URL of the latest WildFly version, and download it using the following command.
wget https://github.com/wildfly/wildfly/releases/download/28.0.0.Final/wildfly-28.0.0.Final.zip
Once WildFly is downloaded, unzip the downloaded file with the following command.
unzip wildfly-28.0.0.Final.zip
Next, move the extracted directory to /opt.
mv wildfly-28.0.0.Final /opt/wildfly
Next, create a user and group for WildFly with the following command.
groupadd --system wildfly
useradd -s /sbin/nologin --system -d /opt/wildfly -g wildfly wildfly
Next, create a WildFly configuration directory and copy all necessary files inside that directory.
mkdir /etc/wildfly
cp /opt/wildfly/docs/contrib/scripts/systemd/wildfly.conf /etc/wildfly/
cp /opt/wildfly/docs/contrib/scripts/systemd/wildfly.service /etc/systemd/system/
cp /opt/wildfly/docs/contrib/scripts/systemd/launch.sh /opt/wildfly/bin/
Next, change the permissions and ownership of the wildfly directory.
chmod +x /opt/wildfly/bin/launch.sh
chown -R wildfly:wildfly /opt/wildfly
Step 3 - Start WildFly Server
At this point, WildFly is installed and configured. Now, reload the systemd daemon using the following command.
systemctl daemon-reload
Next, start and enable the WildFly service with the following command.
systemctl start wildfly
systemctl enable wildfly
You can now check the status of WildFly using the following command.
systemctl status wildfly
You will get the following output.
● wildfly.service - The WildFly Application Server
Loaded: loaded (/etc/systemd/system/wildfly.service; disabled; vendor preset: disabled)
Active: active (running) since Sun 2023-05-07 03:40:18 EDT; 6s ago
Main PID: 35612 (launch.sh)
Tasks: 63 (limit: 4666)
Memory: 174.3M
CPU: 9.503s
CGroup: /system.slice/wildfly.service
├─35612 /bin/bash /opt/wildfly/bin/launch.sh standalone standalone.xml 0.0.0.0
├─35613 /bin/sh /opt/wildfly/bin/standalone.sh -c standalone.xml -b 0.0.0.0
└─35709 java -D[Standalone] -Xms64m -Xmx512m -XX:MetaspaceSize=96M -XX:MaxMetaspaceSize=256m -Djava.net.preferIPv4Stack=true -Djboss.modules.system.pkgs=o>
By default, WildFly listens on port 8080. You can check it with the following command.
ss -tunelp | grep 8080
Output.
tcp LISTEN 0 4096 0.0.0.0:8080 0.0.0.0:* users:(("java",pid=35709,fd=496)) uid:993 ino:56961 sk:1003 cgroup:/system.slice/wildfly.service <->
Now, open your web browser and access the WildFly test page using the URL http://your-server-ip:8080. You will see the WildFly test page on the following screen.
Step 4 - Create an Administrator User
Next, you must add an admin user to access the WildFly admin interface. You can create it with the following command.
/opt/wildfly/bin/add-user.sh
You should see the following output.
What type of user do you wish to add?
a) Management User (mgmt-users.properties)
b) Application User (application-users.properties)
(a):
Just press the Enter key to create a management user. You will be asked to define your username and password:
Enter the details of the new user to add.
Using realm 'ManagementRealm' as discovered from the existing property files.
Username : adminuser
Password recommendations are listed below. To modify these restrictions edit the add-user.properties configuration file.
- The password should be different from the username
- The password should not be one of the following restricted values {root, admin, administrator}
- The password should contain at least 8 characters, 1 alphabetic character(s), 1 digit(s), 1 non-alphanumeric symbol(s)
Password :
Re-enter Password :
What groups do you want this user to belong to? (Please enter a comma separated list, or leave blank for none)[ ]:
About to add user 'adminuser' for realm 'ManagementRealm'
Is this correct yes/no? yes
Added user 'adminuser' to file '/opt/wildfly/standalone/configuration/mgmt-users.properties'
Added user 'adminuser' to file '/opt/wildfly/domain/configuration/mgmt-users.properties'
Added user 'adminuser' with groups to file '/opt/wildfly/standalone/configuration/mgmt-groups.properties'
Added user 'adminuser' with groups to file '/opt/wildfly/domain/configuration/mgmt-groups.properties'
Step 5 - Allow WildFly Remote Access
By default, the WildFly admin interface can be accessed only from the local host, so you must edit the WildFly startup script file and enable the remote access.
nano /opt/wildfly/bin/launch.sh
Change the following lines:
if [[ "$1" == "domain" ]]; then
$WILDFLY_HOME/bin/domain.sh -c $2 -b $3
else
$WILDFLY_HOME/bin/standalone.sh -c $2 -b $3 -bmanagement=0.0.0.0
fi
Save and close the file, then restart the WildFly service to apply the changes.
systemctl restart wildfly
Step 6 - Access WildFly Admin Interface
Now, open your web browser and access the WildFly admin interface using the URL http://your-server-ip:9990. You should see the WildFly login page.
Provide your admin username, password and click on the Login button. You should see the WildFly dashboard on the following screen.
Conclusion
In this post, we explained how to install WildFly on Fedora. You can now build and deploy a Java application in the production environment. Try to install WildFly on dedicated server hosting from Atlantic.Net!
### How to Install & Configure Firewalld Firewall on Fedora
Firewalld, a firewall daemon, is a tool for Linux-based operating systems. It is an alternative to iptables and implements persistent network traffic rules. Using Firewalld, you can control network traffic flow in and out of the Linux server. It provides a command line interface where users can add, remove and manage firewall rules.
This post will show you how to install and use the Firewalld firewall tool on Fedora.
Step 1 - Install Firewalld
By default, the Firewalld package is included in the Fedora default repo. You can install it easily using the following command.
dnf install firewalld -y
After installing the Firewalld package, start the Firewalld service and enable it to start at system reboot with the following command:
systemctl start firewalld
systemctl enable firewalld
To verify Firewalld's running status, run the following command:
firewall-cmd --state
Output.
running
Step 2 - List Firewall Zones
By default, Firewalld contains some zones. Each zone contains services and ports. You will need to assign an interface to each zone.
To get a list of all available zones, run the following command.
firewall-cmd --get-zones
You will see the following output.
FedoraServer FedoraWorkstation block dmz drop external home internal nm-shared public trusted work
If you want to list default zones, run the following command.
firewall-cmd --get-default-zone
Output:
public
To see active zones, run the following command.
firewall-cmd --get-active-zones
Step 3 - Display Zone Information
If you want to see the detailed information for any zone, run the following command.
firewall-cmd --info-zone public
Output:
public
target: default
icmp-block-inversion: no
interfaces:
sources:
services: dhcpv6-client mdns ssh
ports:
protocols:
forward: no
masquerade: no
forward-ports:
source-ports:
icmp-blocks:
rich rules:
Step 4 - Set a Default Zone
You can set any zone as a default zone using the following command.
firewall-cmd --set-default-zone=home
After setting up the default zone, you can verify it using the following command.
firewall-cmd --get-default-zone
Step 5 - List All Services
There are many services available in Firewalld. You can get a list of all services using the following command.
firewall-cmd --get-services
Output:
RH-Satellite-6 RH-Satellite-6-capsule amanda-client amanda-k5-client amqp amqps apcupsd audit bacula bacula-client bb bgp bitcoin bitcoin-rpc bitcoin-testnet bitcoin-testnet-rpc bittorrent-lsd ceph ceph-mon cfengine cockpit collectd condor-collector ctdb dhcp dhcpv6 dhcpv6-client distcc dns dns-over-tls docker-registry docker-swarm dropbox-lansync elasticsearch etcd-client etcd-server finger foreman foreman-proxy freeipa-4 freeipa-ldap freeipa-ldaps freeipa-replication freeipa-trust ftp ganglia-client ganglia-master git grafana gre high-availability http https imap imaps ipp ipp-client ipsec irc ircs iscsi-target isns jenkins kadmin kdeconnect kerberos kibana klogin kpasswd kprop kshell kube-apiserver ldap ldaps libvirt libvirt-tls lightning-network llmnr managesieve matrix mdns memcache minidlna mongodb mosh mountd mqtt mqtt-tls ms-wbt mssql murmur mysql nbd nfs nfs3 nmea-0183 nrpe ntp nut openvpn ovirt-imageio ovirt-storageconsole ovirt-vmconsole plex pmcd pmproxy pmwebapi pmwebapis pop3 pop3s postgresql privoxy prometheus proxy-dhcp ptp pulseaudio puppetmaster quassel radius rdp redis redis-sentinel rpc-bind rquotad rsh rsyncd rtsp salt-master samba samba-client samba-dc sane sip sips slp smtp smtp-submission smtps snmp snmptrap spideroak-lansync spotify-sync squid ssdp ssh steam-streaming svdrp svn syncthing syncthing-gui synergy syslog syslog-tls telnet tentacle tftp tftp-client tile38 tinc tor-socks transmission-client upnp-client vdsm vnc-server wbem-http wbem-https wsman wsmans xdmcp xmpp-bosh xmpp-client xmpp-local xmpp-server zabbix-agent zabbix-server
Step 6 - Add Ports to Firewalld Zones
You can easily add or remove ports to any Firewalld zones via the command line.
For example, run the following command to add ports 8001 and 22 to the public zone.
firewall-cmd --zone=public --permanent --add-port=8001/tcp --add-port=22/tcp
Next, reload the Firewalld to implement the changes.
firewall-cmd --reload
You can verify the added ports using the following command:
firewall-cmd --info-zone public
Output:
public
target: default
icmp-block-inversion: no
interfaces:
sources:
services: dhcpv6-client mdns ssh
ports: 8001/tcp 22/tcp
protocols:
forward: no
masquerade: no
forward-ports:
source-ports:
icmp-blocks:
rich rules:
Run the following command if you want to remove port 22 from the public zone.
firewall-cmd --zone=public --permanent --remove-port=22/tcp
Step 7 - Add Services to Firewalld Zones
Run the following command to add an FTP service to the public zone.
firewall-cmd --zone=public --permanent --add-service=ftp
Next, reload the Firewalld daemon to apply the changes.
firewall-cmd --reload
To remove the added service, run the following command.
firewall-cmd --zone=public --permanent --remove-service=ftp
Step 8 - Enable IP Masquerading
IP Masquerading is a method that allows hosts with a private IP address to communicate with the Internet via an Internet gateway.
First, verify whether the IP Masquerading is enabled using the following command.
firewall-cmd --zone=public --query-masquerade
You should see the following output.
no
Next, enable the IP Masquerading for the public zone using the following command.
firewall-cmd --zone=public --add-masquerade
Next, reload the Firewalld daemon to apply the changes.
firewall-cmd --reload
To disable the IP masquerading, run the following command:
firewall-cmd --zone=public --remove-masquerade
Conclusion
In this post, we showed you how to install Firewalld on Fedora. We also explained how to add and remove ports and services to Firewalld. You can now implement Firewalld on your server to protect it from DDoS attacks. You can also try Firewalld on VPS hosting from Atlantic.Net!
### How to Install and Use SQLite on Fedora
SQLite is a free, open-source, lightweight database engine written in C. It is a library for implementing a small, fast, self-contained, high-reliability, full-featured SQL database engine. Compared to other databases, SQLite engine is not a standalone process, and you will need to link it statically or dynamically as per your requirement.
In this post, we will show you how to install SQLite from a source on Fedora.
Step 1 - Remove SQLite Default Installation
By default, SQLite is already installed on the Fedora server. However, the installed SQLite version is an outdated version, so removing the SQLite and installing it again from the source is better.
First, verify the SQLite installed version with the following command.
sqlite3 --version
Output:
3.34.1 2021-01-20 14:10:07 10e20c0b43500cfb9bbc0eaa061c57514f715d87238f4d835880cd846b9ealt1
Next, remove the SQLite package using the following command.
dnf remove sqlite
Step 2 - Install SQLite from the Source
First, install all the required packages needed to compile SQLite.
dnf -y groupinstall "Development Tools"
Next, download the latest version of SQLite from their official website.
wget https://www.sqlite.org/2023/sqlite-autoconf-3410200.tar.gz
Next, extract the downloaded file using the following command.
tar -xvzf sqlite-autoconf-3410200.tar.gz
Next, navigate to the extracted directory and configure it with the following command.
cd sqlite-autoconf-3410200
./configure
Output:
checking for zlib.h... yes
checking for library containing deflate... -lz
checking for library containing system... none required
checking that generated files are newer than configure... done
configure: creating ./config.status
config.status: creating Makefile
config.status: creating sqlite3.pc
config.status: executing depfiles commands
config.status: executing libtool commands
Next, run the following command to compile and install SQLite to your server.
make
make install
Output:
/usr/bin/mkdir -p '/usr/local/bin'
/bin/sh ./libtool --mode=install /usr/bin/install -c sqlite3 '/usr/local/bin'
libtool: install: /usr/bin/install -c sqlite3 /usr/local/bin/sqlite3
/usr/bin/mkdir -p '/usr/local/include'
/usr/bin/install -c -m 644 sqlite3.h sqlite3ext.h '/usr/local/include'
/usr/bin/mkdir -p '/usr/local/share/man/man1'
/usr/bin/install -c -m 644 sqlite3.1 '/usr/local/share/man/man1'
/usr/bin/mkdir -p '/usr/local/lib/pkgconfig'
/usr/bin/install -c -m 644 sqlite3.pc '/usr/local/lib/pkgconfig'
make[1]: Leaving directory '/root/sqlite-autoconf-3410200'
Next, create a symbolic link of SQLite binary.
ln -s /usr/local/bin/sqlite3 /usr/bin/
Then, verify the SQLite version with the following command.
sqlite3 --version
Output:
3.41.2 2023-03-22 11:56:21 0d1fc92f94cb6b76bffe3ec34d69cffde2924203304e8ffc4155597af0c191da
Step 3 - Create a Database and Table in SQLite
First, create a new database using the following command.
sqlite3 mydb.db
Output:
SQLite version 3.41.2 2023-03-22 11:56:21
Enter ".help" for usage hints.
sqlite>
Next, exit from the SQLite shell with the following command.
.exit
Next, change the database to mydb.db database and create a table named students using the following command.
sqlite3 mydb.db
CREATE TABLE students (id INTEGER PRIMARY KEY, name TEXT, position TEXT);
Next, insert some rows in the created table.
INSERT INTO students (name, position) VALUES ('Hitesh Jethva', '12th');
INSERT INTO students (name, position) VALUES ('Jay Jethva', '10th');
INSERT INTO students (name, position) VALUES ('Vyom Jethva', '5th');
You can now verify the inserted data using the following command.
SELECT * FROM students;
You will see all your data in the following output.
1|Hitesh Jethva|12th
2|Jay Jethva|10th
3|Vyom Jethva|5th
Conclusion
In this post, we showed you how to install SQLite from the source on Fedora. We also explained how to create a database and table in SQLite. You can now try SQLite on VPS hosting from Atlantic.Net!
### How to Install and Use PostgreSQL on Fedora
PostgreSQL is a powerful, free, open-source relational database management software. It is very popular due to its reliability, stability, and support for open technical standards. It is versatile and expandable so that you can use it in various specialized use cases with a powerful extension ecosystem. If you want to create highly scalable computing environments in your organization, then PostgreSQL is the best option.
This guide will show you how to install and use the PostgreSQL server on Fedora.
Step 1 - Enable PostgreSQL Repo
By default, Fedora provides a PostgreSQL version 13 via its default repo, so you must enable the PostgreSQL 14 repo in your server.
First, reset the default PostgreSQL repo with the following command.
dnf update -y
dnf module reset postgresql -y
Next, enable the PostgreSQL 14 repo with the following command.
dnf module enable postgresql:14
You will see the following output.
Last metadata expiration check: 0:02:34 ago on Sunday 07 May 2023 04:12:57 AM.
Dependencies resolved.
========================================================================================================================================================================
Package Architecture Version Repository Size
========================================================================================================================================================================
Enabling module streams:
postgresql 14
Transaction Summary
========================================================================================================================================================================
Is this ok [y/N]: y
Complete!
Step 2 - Install PostgreSQL 14
Now, run the following command to install PostgreSQL 14 on your server.
dnf install postgresql-server postgresql
After the installation, initialize the PostgreSQL database with the following command.
postgresql-setup --initdb
You will get the following output.
* Initializing database in '/var/lib/pgsql/data'
* Initialized, logs are in /var/lib/pgsql/initdb_postgresql.log
Step 3 - Start PostgreSQL Service
Now, start the PostgreSQL service and enable it to start at system reboot with the following command.
systemctl enable --now postgresql
You can now check the status of PostgreSQL with the following command.
systemctl status postgresql
You will get the following output.
● postgresql.service - PostgreSQL database server
Loaded: loaded (/usr/lib/systemd/system/postgresql.service; enabled; vendor preset: disabled)
Active: active (running) since Sun 2023-05-07 04:16:16 EDT; 8s ago
Process: 17972 ExecStartPre=/usr/libexec/postgresql-check-db-dir postgresql (code=exited, status=0/SUCCESS)
Main PID: 17975 (postmaster)
Tasks: 8 (limit: 4666)
Memory: 15.8M
CPU: 67ms
CGroup: /system.slice/postgresql.service
├─17975 /usr/bin/postmaster -D /var/lib/pgsql/data
├─18002 postgres: logger
├─18004 postgres: checkpointer
├─18005 postgres: background writer
├─18006 postgres: walwriter
├─18007 postgres: autovacuum launcher
├─18008 postgres: stats collector
└─18009 postgres: logical replication launcher
May 07 04:16:16 fedora systemd[1]: Starting PostgreSQL database server...
You can check the PostgreSQL version with the following command.
postgres --version
Output:
postgres (PostgreSQL) 14.1
By default, PostgreSQL runs on port 5432. You can check it with the following command.
ss -antpl | grep -i postmaster
Output.
LISTEN 0 244 127.0.0.1:5432 0.0.0.0:* users:(("postmaster",pid=17975,fd=7))
LISTEN 0 244 [::1]:5432 [::]:* users:(("postmaster",pid=17975,fd=6))
Step 4 - Configure PostgreSQL for Remote Access
By default, PostgreSQL is accessible only from the local system. You can allow remote access by editing the PostgreSQL configuration file.
nano /var/lib/pgsql/data/postgresql.conf
Change the following line:
listen_addresses = '*'
Save and close the file, then edit another configuration file.
nano /var/lib/pgsql/data/pg_hba.conf
Find the following lines:
# IPv4 local connections:
host all all 127.0.0.1/32 ident
# IPv6 local connections:
host all all ::1/128 ident
Replace them with the next line:
# Accept from anywhere
host all all 0.0.0.0/0 md5
Save and close the file, then restart the PostgreSQL service to reload the changes.
systemctl restart postgresql
Step 5 - Set PostgreSQL Password
By default, no password is assigned to the Postgres user. For security reasons, setting a strong password for the Postgres user is a good idea.
First, log in to PostgreSQL with the following command.
su - postgres
Once logged in, set a password for the Postgres user.
psql -c "alter user postgres with password 'securepassword'"
Finally, exit from the Postgres Shell with the following command.
exit
Conclusion
In this post, we explained how to install PostgreSQL 14 on Fedora. We also showed you how to enable PostgreSQL remote access and set a Postgres password. You can now try PostgreSQL on VPS hosting from Atlantic.Net!
### How to Install Apache Kafka on Fedora
Apache Kafka is an open-source distributed event streaming platform developed by the Apache Software Foundation. It is written in Java and Scala and used for high-performance data pipelines and streaming analytics. Apache Kafka is a distributed message broker designed to handle large volumes of data. It is highly scalable and can run on one or more servers.
This tutorial will show you how to install Apache Kafka on Fedora.
Step 1 - Install Java OpenJDK
First, install the Java JDK using the following commands.
dnf update -y
dnf install java-11-openjdk -y
After installing Java, verify the Java installation with the following command.
java --version
Output.
openjdk 11.0.15 2022-04-19
OpenJDK Runtime Environment 18.9 (build 11.0.15+10)
OpenJDK 64-Bit Server VM 18.9 (build 11.0.15+10, mixed mode, sharing)
Step 2 - Install Apache Kafka
First, visit the Kafka official download page, pick the latest Kafka version, and run the following command to download it to your server.
wget https://downloads.apache.org/kafka/3.4.0/kafka_2.13-3.4.0.tgz
Next, extract the downloaded file using the following command.
tar xzf kafka_2.13-3.4.0.tgz
Next, move the extracted directory to /usr/local directory.
mv kafka_2.13-3.4.0 /usr/local/kafka
Step 3 - Create a Systemd Service File for Kafka
Next, you must create a systemd service file to manage the Kafka service via systemd.
First, create a Zookeeper service file.
nano /etc/systemd/system/zookeeper.service
Add the following configurations.
[Unit]
Description=Apache Zookeeper server
Documentation=http://zookeeper.apache.org
Requires=network.target remote-fs.target
After=network.target remote-fs.target
[Service]
Type=simple
ExecStart=/usr/bin/bash /usr/local/kafka/bin/zookeeper-server-start.sh /usr/local/kafka/config/zookeeper.properties
ExecStop=/usr/bin/bash /usr/local/kafka/bin/zookeeper-server-stop.sh
Restart=on-abnormal
[Install]
WantedBy=multi-user.target
Save the file, then create a Kafka service file.
nano /etc/systemd/system/kafka.service
Add the following configurations.
[Unit]
Description=Apache Kafka Server
Documentation=http://kafka.apache.org/documentation.html
Requires=zookeeper.service
[Service]
Type=simple
Environment="JAVA_HOME=/usr/lib/jvm/jre-11-openjdk"
ExecStart=/usr/bin/bash /usr/local/kafka/bin/kafka-server-start.sh /usr/local/kafka/config/server.properties
ExecStop=/usr/bin/bash /usr/local/kafka/bin/kafka-server-stop.sh
[Install]
WantedBy=multi-user.target
Save and close the file, then reload the systemd daemon to apply the changes.
systemctl daemon-reload
Step 4 - Start Apache Kafka
Now, start the Apache Kafka and Zookeeper services and enable them to start at system reboot.
systemctl start zookeeper
systemctl start kafka
systemctl enable zookeeper
systemctl enable kafka
You can now check the status of Kafka using the following command.
systemctl status kafka
Output.
● kafka.service - Apache Kafka Server
Loaded: loaded (/etc/systemd/system/kafka.service; disabled; vendor preset: disabled)
Active: active (running) since Sat 2023-04-22 23:21:35 EDT; 4s ago
Docs: http://kafka.apache.org/documentation.html
Main PID: 4830 (java)
Tasks: 54 (limit: 4666)
Memory: 306.7M
CPU: 6.974s
CGroup: /system.slice/kafka.service
└─4830 /usr/lib/jvm/jre-11-openjdk/bin/java -Xmx1G -Xms1G -server -XX:+UseG1GC -XX:MaxGCPauseMillis=20 -XX:InitiatingHeapOccupancyPercent=35 -XX:+Explicit>
Apr 22 23:21:40 fedora bash[4830]: [2023-04-22 23:21:40,176] INFO [ExpirationReaper-0-Heartbeat]: Starting (kafka.server.DelayedOperationPurgatory$ExpiredOperationReap>
Apr 22 23:21:40 fedora bash[4830]: [2023-04-22 23:21:40,196] INFO [ExpirationReaper-0-Rebalance]: Starting (kafka.server.DelayedOperationPurgatory$ExpiredOperationReap>
Apr 22 23:21:40 fedora bash[4830]: [2023-04-22 23:21:40,200] INFO Successfully created /controller_epoch with initial epoch 0 (kafka.zk.KafkaZkClient)
Apr 22 23:21:40 fedora bash[4830]: [2023-04-22 23:21:40,223] INFO [GroupCoordinator 0]: Starting up. (kafka.coordinator.group.GroupCoordinator)
Apr 22 23:21:40 fedora bash[4830]: [2023-04-22 23:21:40,244] INFO [GroupCoordinator 0]: Startup complete. (kafka.coordinator.group.GroupCoordinator)
Apr 22 23:21:40 fedora bash[4830]: [2023-04-22 23:21:40,245] INFO Feature ZK node created at path: /feature (kafka.server.FinalizedFeatureChangeListener)
Apr 22 23:21:40 fedora bash[4830]: [2023-04-22 23:21:40,300] INFO [TransactionCoordinator id=0] Starting up. (kafka.coordinator.transaction.TransactionCoordinator)
Apr 22 23:21:40 fedora bash[4830]: [2023-04-22 23:21:40,309] INFO [MetadataCache brokerId=0] Updated cache from existing to latest FinalizedFeaturesAndEpoch(fe>
Apr 22 23:21:40 fedora bash[4830]: [2023-04-22 23:21:40,327] INFO [TransactionCoordinator id=0] Startup complete. (kafka.coordinator.transaction.TransactionCoordinator)
Apr 22 23:21:40 fedora bash[4830]: [2023-04-22 23:21:40,334] INFO [Transaction Marker Channel Manager 0]: Starting (kafka.coordinator.transaction.TransactionMarkerChan>
Step 5 - Create a Topic in Kafka
At this point, Kafka is installed on your server. To test Kafka, create a topic named FedoraTopic.
cd /usr/local/kafka
bin/kafka-topics.sh --create --bootstrap-server localhost:9092 --replication-factor 1 --partitions 1 --topic FedoraTopic
Next, verify your created topic using the following command.
./bin/kafka-topics.sh --bootstrap-server=localhost:9092 --list
Output:
FedoraTopic
Now, execute the producer and type a few messages into the console to send to the server.
./bin/kafka-console-producer.sh --broker-list localhost:9092 --topic FedoraTopic
>Hi
>How are you
Next, open another terminal and run the consumer to read data from the Kafka cluster and display messages to standard output.
./bin/kafka-console-consumer.sh --bootstrap-server localhost:9092 --topic FedoraTopic --from-beginning
Hi
How are you
Conclusion
In this post, we explained how to install Apache Kafka on Fedora. We also create a sample topic and show you how producer and consume work. You can now install Kafka on dedicated server hosting from Atlantic.Net!
### How to Install Apache Solr on Fedora
Apache Solr is an open-source search platform written in Java. It offers many features, including full-text search, hit highlighting, faceted search, real-time indexing, dynamic clustering, database integration, and rich document handling. It is primarily used to serve data to users based on their queries.
This post will show you how to install Apache Solr on Fedora.
Step 1 - Install Java
First, you will need to install Java JDK on your server. You can install it using the following command.
dnf install java-17-openjdk -y
Once Java is installed, you can verify the Java version with the following command.
java --version
You will get the Java version information in the following output.
openjdk 17.0.3 2022-04-19
OpenJDK Runtime Environment 21.9 (build 17.0.3+7)
OpenJDK 64-Bit Server VM 21.9 (build 17.0.3+7, mixed mode, sharing)
Step 2 - Install Apache Solr
First, download the latest version of Apache Solr from their official website.
wget https://dlcdn.apache.org/solr/solr/9.2.0/solr-9.2.0.tgz
Once the download is completed, you can extract it with the following command.
tar xzf solr-9.2.0.tgz solr-9.2.0/bin/install_solr_service.sh --strip-components=2
Next, run the Solr installation script to install Apache Solr to your server.
bash ./install_solr_service.sh solr-9.2.0.tgz
Once Solr is installed, you will get the following output.
Solr process 2001 running on port 8983
{
"solr_home":"/var/solr/data",
"version":"9.2.0 92c5515e2918c22513f7aa527d6c6db943150fea - houston - 2023-03-20 20:30:42",
"startTime":"2023-04-23T02:32:06.818Z",
"uptime":"0 days, 0 hours, 0 minutes, 15 seconds",
"memory":"66.5 MB (%13) of 512 MB"}
You can check the status of Apache Solr using the following command.
service solr status
You will see the following output.
Found 1 Solr nodes:
Solr process 2001 running on port 8983
{
"solr_home":"/var/solr/data",
"version":"9.2.0 92c5515e2918c22513f7aa527d6c6db943150fea - houston - 2023-03-20 20:30:42",
"startTime":"2023-04-23T02:32:06.818Z",
"uptime":"0 days, 0 hours, 0 minutes, 50 seconds",
"memory":"69.5 MB (%13.6) of 512 MB"}
Step 3 - Configure Apache Solr for Remote Access
At this point, Apache Solr is installed and listening on port 8983 on localhost. You can check it with the following command.
ss -antpl | grep 8983
You will see the following output.
LISTEN 0 50 [::ffff:127.0.0.1]:8983 *:* users:(("java",pid=2001,fd=48))
Next, you will need to edit the Solr configuration file and allow remote access.
nano /etc/default/solr.in.sh
Change the following line.
SOLR_JETTY_HOST="0.0.0.0"
Save and close the file, then restart the Solr service to apply the changes.
service solr restart
Step 4 - Enable Solr Authentication
By default, anyone can access Apache Solr without authentication, so it is a good idea to secure the Solr with a user and password.
To enable the authentication, create a security.json file.
nano /var/solr/data/security.json
Add the following code.
{
"authentication":{
"blockUnknown": true,
"class":"solr.BasicAuthPlugin",
"credentials":{"solr":"IV0EHq1OnNrj6gvRCwvFwTrZ1+z1oBbnQdiVC3otuq0= Ndd7LKvVBAaZIF0QAVi1ekCfAJXr1GGfLtRUXhgrF8c="},
"realm":"My Solr users",
"forwardCredentials": false
},
"authorization":{
"class":"solr.RuleBasedAuthorizationPlugin",
"permissions":[{"name":"all", "role":"admin"}],
"user-role":{"solr":"admin"}
}
}
This file creates the default admin user and password pairing of solr:SolrRocks. Finally, restart the Apache Solr service to apply the changes.
service solr restart
Step 5 - Access Apache Solr
Now, open your web browser and access Apache Solr using the URL http://your-server-ip:8983. You should see the Apache Solr login page.
Provide your admin username and password and click on the Login button. You should see the Apache Solr web interface on the following screen.
Conclusion
Congratulations! You have successfully installed Apache Solr on Fedora. You can now integrate Apache Solr with your application to serve data to all users. Try to install Apache Solr on dedicated server hosting from Atlantic.Net!
### HIPAA Compliance in the Age of Telemedicine: What You Need to Consider
The Healthcare Industry has traditionally been playing catchup in the cloud computing revolution. This is partly due to the complexities surrounding data governance, and the complexity of ensuring digitizing healthcare services align with the stringent rules of HIPAA-Compliance.
Times are changing fast, and HIPAA-Compliance hosting services are helping to drastically reshape the healthcare world, with telemedicine leading the charge. As a result, healthcare services extend beyond the physical confines of clinics and hospitals.
Although we saw during the Covid-19 pandemic how popular remote consultations and diagnosis at hospitals became, telemedicine promises unprecedented access to medical services for millions of individuals across the globe.
However, the digital transformation of healthcare brings significant data security and privacy challenges. The Health Insurance Portability and Accountability Act (HIPAA) is at the forefront of these concerns, a critical regulatory requirement for healthcare providers in the digital age.
Understanding HIPAA Compliance in Telemedicine
HIPAA compliance is a cornerstone of healthcare data management, ensuring the privacy and security of patient information. HIPAA legislation requires healthcare providers and their associates to implement adequate safeguards to uphold the data integrity of electronic protected health information (ePHI).
In telemedicine, HIPAA compliance encompasses a broad range of considerations, including the secure transmission and storage of patient data during video consultations, the management of electronic health records, and the handling of data from emerging technologies like wearable devices, IoT devices, and intelligent applications.
The Impact of Wearable Devices, Smart Apps, and Remote Patient Monitoring (RPM) on Data Security
Innovations in healthcare technology, such as wearable devices, smart apps, and RPM, are revolutionizing patient care. These tools allow healthcare providers to monitor patients' health in real-time, offering the potential for earlier intervention, better disease management, and improved patient outcomes.
However, these technologies also introduce significant data security considerations. Protecting this information becomes paramount as these devices collect, store, and transmit sensitive health data. Failure to comply with HIPAA regulations can lead to severe penalties, making it critical for healthcare providers to incorporate robust security measures into the architecture of these new technologies.
Ensuring Data Integrity and Protecting ePHI in Telemedicine
Protecting ePHI requires a multi-faceted approach. Data encryption, both during transmission and when stored, is an essential first step. Healthcare providers must also use secure communication platforms for telemedicine consultations to prevent unauthorized access to sensitive data.
Regular risk assessments are another crucial data protection component, helping identify and address potential vulnerabilities proactively. Lastly, healthcare providers must prioritize training on HIPAA regulations and data security protocols to ensure all employees understand their role in protecting patient information.
But HIPAA compliance is about more than just data security—it also requires ensuring data integrity. As a result, healthcare providers must ensure that ePHI remains accurate and consistent over its entire lifecycle. This can include implementing data validation processes, regularly backing up data to prevent loss, and creating audit trails to track any changes to information.
Best Practices for Achieving HIPAA Compliance in Telemedicine
Achieving HIPAA compliance in telemedicine is a continuous process that requires dedication to achieving best practices. These include conducting regular risk assessments to identify potential threats to data security, educating staff about HIPAA regulations and their role in data protection, and implementing robust access controls.
To ensure that only those with a legitimate need can access patient data. It's also essential to track data access and use monitoring systems to prevent data breaches. Regular updates and reviews of security policies and ongoing staff education and training are also vital in maintaining HIPAA compliance.
Working with HIPAA-compliant vendors is equally important when choosing a telehealth partner. These vendors should have robust security measures to protect PHI and be willing to sign a Business Associate Agreement (BAA), as HIPAA requires.
Beyond these, healthcare providers must also educate their patients about security best practices. Patients play an essential role in protecting their health information, especially in telemedicine, where much communication and data sharing happens outside the traditional healthcare setting. Therefore, patients should be informed about security best practices through various channels, such as videos, websites, or emails.
Atlantic.Net: Your Trusted Partner for HIPAA-Compliant Hosting Services
With the complexities of HIPAA compliance, healthcare providers often benefit from partnering with specialized service providers. Atlantic.Net is a trusted name in this domain, offering HIPAA-compliant hosting services tailored to the needs of healthcare providers.
In addition, with a commitment to data security and privacy, Atlantic.Net provides HIPAA hosting services, ensuring that your patient's data is always protected. Our engineers also conduct routine security audits to identify and address potential vulnerabilities, safeguarding your data from breaches.
Our platform team secures the hosting platform to industry standards, providing a durable and feature-rich environment powered by cutting-edge technology, delivering unrivaled performance in both dedicated and cloud server configurations, all backed by a 100% uptime Service Level Agreement (SLA).
Atlantic.Net offers HIPAA-compliant web hosting plans with ultra-fast data processing capabilities and high availability, featuring robust security measures, high performance, and guaranteed reliability for efficient health data management.
Additionally, Atlantic.Net provides HIPAA-compliant dedicated servers for both Windows and Linux platforms. These offerings ensure compliance with the HIPAA Security Rule and offer discounted pricing based on term commitment1.
In the age of telemedicine, HIPAA compliance is a critical consideration for healthcare providers. The dynamic nature of digital health technologies and the evolving threat landscape make data security a challenging yet essential task. By understanding the nuances of HIPAA compliance in telemedicine, leveraging technology wisely, and following best practices, healthcare providers can ensure the secure management of patient data, maintain the trust of their patients, and uphold their commitment to care.
### How to Install NextCloud on Fedora
Nextcloud is an open-source client-server software used for file hosting services. It is an alternate solution for DropBox, Google Drive, and IDrive. It allows you to access, share, and protect files, calendars, contacts, communication & more at home and in your enterprise. With Nextcloud, you can synchronize your data between multiple devices and exchange your information with several other users. Additionally, you have complete control over your data.
This post will show you how to install Nextcloud on Fedora.
Step 1 - Install Apache and PHP
First, install Apache web server using the following command.
dnf install httpd -y
Next, add the Repi repository to install the latest PHP version.
dnf install -y http://rpms.remirepo.net/fedora/remi-release-34.rpm
Next, reset the default PHP module and enable the Remi repository with the following command.
dnf module reset php -y
dnf module install php:remi-8.1
Next, install PHP using the following command.
dnf install php php-gd php-curl php-dom php-xml php-simplexml php-mbstring php-json -y
Next, install other required PHP extensions using the following command.
yum --enablerepo=remi install php-intl php-zip
Finally, start and enable the Apache service using the following command.
systemctl enable --now httpd
Step 2 - Install and Configure MariaDB Database
First, install MariaDB on your server.
dnf install mariadb mariadb-server -y
Next, start and enable the MariaDB service.
systemctl enable --now mariadb
Next, log in to the MariaDB shell with the following command.
mysql
Once you are connected, create a user and database for Nextcloud.
create database nextcloud;
create user 'nextcloud'@'localhost' identified by 'password';
Next, grant all the privileges on the Nextcloud database.
grant all privileges on nextcloud.* to 'nextcloud'@'localhost';
Next, flush the privileges and exit from the MariaDB shell.
flush privileges;
exit;
Step 3 - Download and Install Nextcloud
First, download the latest version of Nextcloud using the following command.
wget https://download.nextcloud.com/server/releases/latest.tar.bz2
Next, extract the downloaded file with the following command.
tar -xjf latest.tar.bz2
Next, move the extracted directory to the Apache web root.
mv nextcloud /var/www/html/nextcloud
Next, create a data directory for Nextcloud.
mkdir /var/www/html/nextcloud/data
Next, change the ownership of Nextcloud.
chown -R apache:apache /var/www/html/nextcloud
Step 4 - Configure Apache for Nextcloud
Next, create an Apache virtual server block to host Nextcloud on the web.
nano /etc/httpd/conf.d/nextcloud.conf
Add the following configurations.
ServerName nextcloud.example.com
DocumentRoot /var/www/html/nextcloud
ErrorLog /var/log/httpd/nextcloud_error.log
CustomLog /var/log/httpd/nextcloud_requests.log combined
Options +FollowSymlinks
AllowOverride All
Dav off
SetEnv HOME /var/www/html/nextcloud
SetEnv HTTP_HOME /var/www/html/nextcloud
Save and close the file, then restart the Apache service to apply the changes.
systemctl restart httpd
Step 5 - Access Nextcloud Interface
Now, open your web browser and access Nextcloud using the URL http://nextcloud.example.com. You should see the following screen.
Provide all required information and click on the Install button. Once the Nextcloud is installed, you should see the following screen.
Conclusion
In this post, we explained how to install Nextcloud with Apache on Fedora. You can now install Nextcloud client software on your desktop or mobile device and then sync and share your data with other users. Try to install Nextcloud on dedicated server hosting from Atlantic.Net!
### How to Install Tomcat on Fedora
Apache Tomcat is an open-source web server for hosting a Java-based application online. Tomcat offers a user-friendly web interface where users can easily deploy and manage Java applications. Apache Tomcat is written in Java and contributed to by developers worldwide. It is designed to handle dynamic Java-based web content using the HTTP protocol.
This post will show you how to install Apache Tomcat on Fedora.
Step 1 - Install Java JDK
Apache Tomcat is based on Java, so you will require Java to be installed on your server. You can install Java OpenJDK 11 with the following command.
dnf update -y
dnf install java-11-openjdk -y
After the installation, verify the Java version with the following command.
java --version
Output:
openjdk 11.0.15 2022-04-19
OpenJDK Runtime Environment 18.9 (build 11.0.15+10)
OpenJDK 64-Bit Server VM 18.9 (build 11.0.15+10, mixed mode, sharing)
Step 2 - Install Apache Tomcat
First, visit the Apache Tomcat official website and download the latest version of Tomcat using the following command.
wget https://dlcdn.apache.org/tomcat/tomcat-10/v10.1.8/bin/apache-tomcat-10.1.8.tar.gz
Once the download is finished, extract the downloaded file with the following command.
tar -xvzf apache-tomcat-10.1.8.tar.gz
Next, move the extracted directory to /opt with the following command.
mv apache-tomcat-10.1.8 /opt/tomcat
Next, create a group and user for Tomcat using the following command.
groupadd --system tomcat
useradd -M -d /opt/tomcat -g tomcat tomcat
Next, change the ownership of Apache Tomcat:
chown -R tomcat:tomcat /opt/tomcat
Step 3 - Create a Systemd Service File for Tomcat
Next, you must create a systemd service file to manage Tomcat via systemd.
nano /etc/systemd/system/tomcat.service
Add the following configurations.
[Unit]
Description=Apache Tomcat 10
After=network.target syslog.target
[Service]
User=tomcat
Group=tomcat
Type=oneshot
ExecStart=/opt/tomcat/bin/startup.sh
ExecStop=/opt/tomcat/bin/shutdown.sh
RemainAfterExit=yes
[Install]
WantedBy=multi-user.target
Save and close the file, then reload the systemd daemon to implement the changes.
systemctl daemon-reload
Next, start and enable the Tomcat service.
systemctl start tomcat
systemctl enable tomcat
You can now check the Tomcat status using the following command.
systemctl status tomcat
Output.
● tomcat.service - Apache Tomcat 10
Loaded: loaded (/etc/systemd/system/tomcat.service; disabled; vendor preset: disabled)
Active: active (exited) since Sat 2023-04-22 03:28:40 EDT; 4s ago
Process: 8379 ExecStart=/opt/tomcat/bin/startup.sh (code=exited, status=0/SUCCESS)
Main PID: 8379 (code=exited, status=0/SUCCESS)
Tasks: 34 (limit: 4666)
Memory: 101.6M
CPU: 5.147s
CGroup: /system.slice/tomcat.service
└─8393 /usr/bin/java -Djava.util.logging.config.file=/opt/tomcat/conf/logging.properties -Djava.util.logging.manager=org.apache.juli.ClassLoaderLogManager>
Apr 22 03:28:40 fedora systemd[1]: Starting Apache Tomcat 10...
Apr 22 03:28:40 fedora startup.sh[8379]: Tomcat started.
Apr 22 03:28:40 fedora systemd[1]: Finished Apache Tomcat 10.
Step 4 - Create an Administrative User for Tomcat
Next, you must create an admin user to access the Tomcat management interface.
nano /opt/tomcat//onf/tomcat-users.xml
Add the following lines above the last line:
Save and close the file when you are finished.
Step 5 - Allow Tomcat Remote Login
By default, Tomcat is accessible only from the local host. You will need to enable remote access by editing the Tomcat configuration file.
To allow remote access to the Manager app, edit the context.xml file.
nano /opt/tomcat/webapps/manager/META-INF/context.xml
Remove the following lines.
To allow remote access to the Host Manager app, edit the context.xml file.
nano /opt/tomcat/webapps/host-manager/META-INF/context.xml
Remove the following lines.
Save and close the file, then restart the Tomcat service to apply the changes.
systemctl restart tomcat
Step 6 - Access Tomcat Web Interface
Now, open your web browser and access the Tomcat administrative interface using the URL http://your-server-ip:8080. You should see the following screen.
Click on the Manager App. You will be asked for authentication.
Provide a Tomcat admin username and password and click on the Sign in button. You should see the Manager App dashboard.
Click on the Host Manager. You should see the Host Manager dashboard on the following screen.
Conclusion
In this tutorial, we explained how to install Tomcat 10 on Fedora. We also showed you how to enable Tomcat remote access. You can now easily create and deploy Java-based applications via the Tomcat web dashboard. You can try Tomcat on dedicated server hosting from Atlantic.Net!
### How to Install Java on Fedora
Free, open-source Java is one of the most popular programming languages in the world. It is used to build different software applications, including mobile, gaming, big data processing, embedded systems, and web-based applications. It is an object-oriented, multi-platform, and network-centric language and platform.
This post will show you how to install Java on Fedora.
Step 1 - Install Java OpenJDK
By default, Java OpenJDK is available in the Fedora default repo. You can search the list of all available Java versions using the following command.
dnf search openjdk
You should see the following output.
java-1.8.0-openjdk-openjfx-slowdebug.x86_64 : OpenJDK x OpenJFX connector for packages with debugging on and no optimisation. his package adds symliks finishing Java FX
: integration to java-1.8.0-openjdk-slowdebug
java-1.8.0-openjdk-slowdebug.x86_64 : OpenJDK 8 Runtime Environment unoptimised with full debugging on
java-1.8.0-openjdk-src.x86_64 : OpenJDK 8 Source Bundle
java-1.8.0-openjdk-src-fastdebug.x86_64 : OpenJDK 8 Source Bundle for packages with debugging on and optimisation
java-1.8.0-openjdk-src-slowdebug.x86_64 : OpenJDK 8 Source Bundle for packages with debugging on and no optimisation
java-11-openjdk.x86_64 : OpenJDK 11 Runtime Environment
java-11-openjdk.i686 : OpenJDK 11 Runtime Environment
java-11-openjdk-demo.x86_64 : OpenJDK 11 Demos
java-11-openjdk-demo-fastdebug.x86_64 : OpenJDK 11 Demos optimised with full debugging on
java-11-openjdk-demo-slowdebug.x86_64 : OpenJDK 11 Demos unoptimised with full debugging on
java-11-openjdk-devel.i686 : OpenJDK 11 Development Environment
java-11-openjdk-devel.x86_64 : OpenJDK 11 Development Environment
java-latest-openjdk-src-slowdebug.x86_64 : OpenJDK 18 Source Bundle for packages with debugging on and no optimisation
java-latest-openjdk-static-libs.x86_64 : OpenJDK 18 libraries for static linking
java-latest-openjdk-static-libs-fastdebug.x86_64 : OpenJDK 18 libraries for static linking optimised with full debugging on
java-latest-openjdk-static-libs-slowdebug.x86_64 : OpenJDK 18 libraries for static linking unoptimised with full debugging on
openjdk-asmtools-javadoc.noarch : Javadoc for openjdk-asmtools
======================================================================== Name Matched: openjdk =========================================================================
openjdk-asmtools.noarch : To develop tools create proper & improper Java '.class' files
======================================================================= Summary Matched: openjdk =======================================================================
icedtea-web.x86_64 : Additional Java components for OpenJDK - Java Web Start implementation
You can now install specific versions of Java OpenJDK to your system easily.
For example, to install Java 11, run the following command.
dnf install java-11-openjdk -y
You can verify the Java version using the following command.
java --version
Output.
openjdk 11.0.15 2022-04-19
OpenJDK Runtime Environment 18.9 (build 11.0.15+10)
OpenJDK 64-Bit Server VM 18.9 (build 11.0.15+10, mixed mode, sharing)
If you want to install Java 8, run the following command.
dnf install java-1.8.0-openjdk.x86_64 -y
To install the latest Java version, run the following command.
dnf install java-latest-openjdk -y
Step 2 - Set Java Default Version
Java allows you to switch between multiple Java versions easily. Run the following command to set a default Java version.
alternatives --config java
You will be asked to set the default Java version as shown below.
There are 3 programs which provide 'java'.
Selection Command
-----------------------------------------------
*+ 1 java-11-openjdk.x86_64 (/usr/lib/jvm/java-11-openjdk-11.0.15.0.10-1.fc34.x86_64/bin/java)
2 java-1.8.0-openjdk.x86_64 (/usr/lib/jvm/java-1.8.0-openjdk-1.8.0.332.b09-1.fc34.x86_64/jre/bin/java)
3 java-latest-openjdk.x86_64 (/usr/lib/jvm/java-18-openjdk-18.0.1.0.10-1.rolling.fc34.x86_64/bin/java)
Enter to keep the current selection[+], or type selection number: 3
Type 3 and press the Enter key to set the Java latest version as the default version.
Now, verify the newly set Java version with the following command.
java --version
You will get the following.
openjdk 18.0.1 2022-04-19
OpenJDK Runtime Environment 22.3 (build 18.0.1+10)
OpenJDK 64-Bit Server VM 22.3 (build 18.0.1+10, mixed mode, sharing)
Step 3 - Install Oracle Java
To install Oracle Java, login to the Oracle Java website and download Java 16 to your server.
After downloading Java 16, copy it to the Java directory.
cp jdk-16.0.2_linux-x64_bin.tar.gz /usr/local/java
Next, navigate to the Java directory and extract the downloaded file.
cd /usr/local/java
tar xvzf jdk-16.0.2_linux-x64_bin.tar.gz
Next, edit the profile file and define the location of Java 16.
nano /etc/profile
Add the following lines.
JAVA_HOME=/usr/local/java/jdk-16.0.2
PATH=$PATH:$HOME/bin:$JAVA_HOME/bin
export JAVA_HOME
export PATH
Save and close the file, then reload the Java environment variable using the following command.
source /etc/profile
Next, set Oracle Java 16 as the default version with the following command.
update-alternatives --install "/usr/bin/java" "java" "/usr/local/java/jdk-16.0.2/bin/java" 1
update-alternatives --set java /usr/local/java/jdk-16.0.2/bin/java
Now, check the Java version with the following command.
java --version
You should see the Java version in the following output.
java 16.0.2 2021-07-20
Java(TM) SE Runtime Environment (build 16.0.2+7-67)
Java HotSpot(TM) 64-Bit Server VM (build 16.0.2+7-67, mixed mode, sharing)
Conclusion
This post showed you how to install Java OpenJDK and Oracle JDK on Fedora. We also explained how to switch between multiple Java versions. You can now use any Java version with your application easily. You can now deploy Java applications on dedicated server hosting from Atlantic.Net!
### How to Install MySQL Server on Fedora
Free, open-source MySQL is one of the most popular database management systems. MySQL is used as a database backend for websites and web-based applications. It is very popular due to its stability, robustness, and ease of use. Also, MySQL is compatible with all major Linux operating systems, including Fedora, Debian, Ubuntu, CentOS, and more. It is primarily used with LAMP and LEMP stack to host web applications.
This post will show you how to install MySQL server on Fedora.
Step 1 - Add MySQL 8 Repository
The MySQL 8 package is not included in the Fedora official repository by default, so you will need to create a MySQL repo in your server. You can create it by running the following command.
rpm -ivh https://dev.mysql.com/get/mysql80-community-release-fc34-2.noarch.rpm
rpm --import https://repo.mysql.com/RPM-GPG-KEY-mysql-2022
Next, verify the added repo using the following command.
dnf repolist all | grep mysql | grep enabled
You should see the MySQL repo in the following output.
mysql-connectors-community MySQL Connectors Community enabled
mysql-tools-community MySQL Tools Community enabled
mysql80-community MySQL 8.0 Community Server enabled
Step 2 - Install MySQL 8
You can now install the MySQL community server package using the following command.
dnf install mysql-community-server -y
Once MySQL is installed, start and enable the MySQL service using the following command.
systemctl enable mysqld
systemctl start mysqld
Next, check the status of the MySQL service with the following command.
systemctl status mysqld
You should see the following output.
● mysqld.service - MySQL Server
Loaded: loaded (/usr/lib/systemd/system/mysqld.service; enabled; vendor preset: disabled)
Active: active (running) since Sat 2023-04-22 03:19:40 EDT; 7s ago
Docs: man:mysqld(8)
http://dev.mysql.com/doc/refman/en/using-systemd.html
Process: 7609 ExecStartPre=/usr/bin/mysqld_pre_systemd (code=exited, status=0/SUCCESS)
Main PID: 7681 (mysqld)
Status: "Server is operational"
Tasks: 38 (limit: 4666)
Memory: 455.2M
CPU: 6.985s
CGroup: /system.slice/mysqld.service
└─7681 /usr/sbin/mysqld
Apr 22 03:19:30 fedora systemd[1]: Starting MySQL Server...
Apr 22 03:19:40 fedora systemd[1]: Started MySQL Server.
Next, verify the MySQL version with the following command.
mysqld --version
You will get the following output.
/usr/sbin/mysqld Ver 8.0.28 for Linux on x86_64 (MySQL Community Server - GPL)
Step 3 - Secure MySQL Installation
The MySQL root password is set during the MySQL installation, you can retrieve it from its log file.
grep 'A temporary password is generated' /var/log/mysqld.log | tail -1
You should see the MySQL root password in the following output.
2023-04-22T07:19:33.946612Z 6 [Note] [MY-010454] [Server] A temporary password is generated for root@localhost: 3ksZatoy
Next, run the following script to secure the MySQL installation.
mysql_secure_installation
You will be asked to set a new MySQL password as shown below.
Securing the MySQL server deployment.
Enter password for user root:
Provide your existing root password and press the Enter key. You will be prompted to set a new password.
The existing password for the user account root has expired. Please set a new password.
New password:
Re-enter new password:
Set your new password and press the Enter key. You will be asked to remove the anonymous user.
Remove anonymous users? (Press y|Y for Yes, any other key for No) : Y
Type Y and press the Enter key. You will be asked to disallow root login.
Disallow root login remotely? (Press y|Y for Yes, any other key for No) : Y
Type Y and press the Enter key. You will be asked to remove the test database.
Remove test database and access to it? (Press y|Y for Yes, any other key for No) : Y
Type Y and press the Enter key. You will be asked to reload the privileges table.
Reload privilege tables now? (Press y|Y for Yes, any other key for No) : Y
Type Y and press the Enter key to finish securing MySQL.
Step 4 - Create a Database and User in MySQL
First, log in to MySQL shell using the following command.
mysql -u root -p
Provide your root password to log in, then create a database and user using the following command.
CREATE DATABASE testdb;
CREATE USER 'testuser'@'localhost' IDENTIFIED BY 'Your1_S@ecu&re*Pa(sswo)r-d';
Next, grant all the privileges to testdb database with the following command.
GRANT ALL PRIVILEGES ON testdb.* TO testuser@localhost;
Next, flush the privileges and exit from MySQL using the following command.
FLUSH PRIVILEGES;
EXIT;
Step 5 - Uninstall MySQL Server
To remove the MySQL server from your system, run the following command.
dnf remove mysql-community-server
Next, clear the package cache using the following command.
dnf clean all
Next, remove the MySQL data directory.
rm -rf /var/lib/mysql
Conclusion
This tutorial showed you how to install MySQL 8 on Fedora. We also explained how to secure the MySQL installation, set a root password and create a database and user. You can now easily install and manage MySQL on your server. Try to install MySQL server on dedicated server hosting from Atlantic.Net!
### How to Install Reveal.js on Fedora
Reveal.js is a free and open-source HTML presentation framework that helps you make a beautiful presentation via a web browser. It uses open web technologies to make a presentation, change styles with CSS, include an external web page using an iframe, and use JavaScript API to add custom behavior.
In this post, we will show you how to install Reveal.js on Fedora.
Step 1 - Install Nodejs and NPM
First, you will need to install Node.js and NPM packages on your server. You can install both packages with the following command.
dnf install nodejs npm -y
Once both packages are installed, you can verify the Node.js version with the following command.
node --version
Output.
v14.19.0
Step 2 - Install Revealjs
First, install the Git package using the following command.
dnf install git
Next, download the latest version of Reveal.js using the following command.
git clone https://github.com/hakimel/reveal.js.git
Next, navigate to the downloaded directory and install all required dependencies using the following command.
cd reveal.js
npm install
Next, run the following command to run the Reveal.js application.
npm start
You will get the following output.
> reveal.js@4.5.0 start /root/reveal.js
> gulp serve
[05:18:41] Using gulpfile ~/reveal.js/gulpfile.js
[05:18:41] Starting 'serve'...
[05:18:41] Starting server...
[05:18:41] Server started http://localhost:8000
[05:18:41] LiveReload started on port 35729
[05:18:41] Running server
Press the CTRL+C to stop the application. We will create a systemd service file to manage the application in the next section.
Step 3 - Create a Systemd Service File for Revealjs
Next, create a systemd unit file to manage the Reveal.js application.
nano /lib/systemd/system/reveal.service
Add the following code.
[Service]
Type=simple
User=root
Restart=on-failure
WorkingDirectory=/root/reveal.js
ExecStart=npm start
Save and close the file, then reload the systemd daemon to apply the changes.
systemctl daemon-reload
Next, start and enable the Reveal service with the following command.
systemctl start reveal
systemctl enable reveal
You can verify the active status of Reveal.js using the following command.
systemctl status reveal
Output.
● reveal.service
Loaded: loaded (/usr/lib/systemd/system/reveal.service; static)
Active: active (running) since Sat 2023-05-20 05:19:14 EDT; 4s ago
Main PID: 12825 (npm)
Tasks: 22 (limit: 4666)
Memory: 128.8M
CPU: 5.232s
CGroup: /system.slice/reveal.service
├─12825 npm
└─12836 gulp serve
May 20 05:19:14 fedora systemd[1]: Started reveal.service.
May 20 05:19:15 fedora npm[12825]: > reveal.js@4.5.0 start /root/reveal.js
May 20 05:19:15 fedora npm[12825]: > gulp serve
May 20 05:19:18 fedora npm[12836]: [05:19:18] Using gulpfile ~/reveal.js/gulpfile.js
May 20 05:19:18 fedora npm[12836]: [05:19:18] Starting 'serve'...
May 20 05:19:18 fedora npm[12836]: [05:19:18] Starting server...
May 20 05:19:18 fedora npm[12836]: [05:19:18] Server started http://localhost:8000
May 20 05:19:18 fedora npm[12836]: [05:19:18] LiveReload started on port 35729
May 20 05:19:18 fedora npm[12836]: [05:19:18] Running server
Step 4 - Configure Nginx for Revealjs Application
At this point, the Reveal.js application is running and listening on localhost on port 8000, so you will need to configure Nginx as a reverse proxy to access the Reveal.js application from the remote machine.
First, install the Nginx package using the following command.
dnf install nginx
Next, start and enable the Nginx service using the following command.
systemctl start nginx
systemctl enable nginx
Next, create an Nginx virtual host configuration file.
nano /etc/nginx/conf.d/reveal.conf
Add the following configuration.
upstream reveal_backend {
server localhost:8000;
}
server {
listen 80;
server_name reveal.example.com;
location / {
proxy_pass http://reveal_backend/;
proxy_http_version 1.1;
proxy_set_header Upgrade $http_upgrade;
proxy_set_header Connection "upgrade";
proxy_set_header Host $http_host;
proxy_set_header X-Real-IP $remote_addr;
proxy_set_header X-Forward-For $proxy_add_x_forwarded_for;
proxy_set_header X-Forward-Proto http;
proxy_set_header X-Nginx-Proxy true;
proxy_redirect off;
}
}
Save and close the file, then edit the Nginx main configuration file.
nano /etc/nginx/nginx.conf
Add the following line after http{:
server_names_hash_bucket_size 64;
Save the file, then restart the Nginx service to apply the changes.
systemctl restart nginx
Step 5 - Access Revealjs Web UI
Now, open your web browser and access the Reveal.js presentation using the URL http://reveal.example.com. You should see the Reveal.js default presentation on the following screen.
Conclusion
In this post, we explained how to install the Reveal.js presentation framework on Fedora. We also configured Nginx as a reverse proxy to access Reveal.js on the internet. Try to install Reveal.js on VPS hosting from Atlantic.Net!
### How to Deploy TDengine on the Atlantic.Net Cloud Platform
TDengine is a high-performance, distributed, scalable time-series database designed to handle large volumes of data in real-time. Developed by the TDengine team, this open-source software is optimized for IoT, industrial, and financial applications. TDengine provides features such as high-speed data insertion and querying, real-time data processing, SQL-based data analytics, and data compression.
This procedure will provide a detailed guide to creating a TDengine database on an Ubuntu instance running on the Atlantic.Net Cloud Platform.
Pre-requisites
To create an Atlantic.Net account, you can follow these steps:
Go to the Atlantic.Net website atAtlantic.Net and click on the "Sign Up" button in the top right corner of the page.
On the sign-up page, fill in your information, including your name, email address, and password. You will also need to select a security question and provide an answer.
Review the terms and conditions and privacy policy, and then click on the "Create Account" button to submit your registration.
Once you have submitted your registration, you will receive an email from Atlantic.Net with a link to activate your account. Click on the link in the email to activate your account.
Once your account is activated, you can log in to the Atlantic.Net Cloud Control Panel to create and manage your cloud servers and other services.
You may need to provide additional information, such as your billing information and verification documents, to complete your registration and start using Atlantic.Net services.
Step 1 - Log in to your Atlantic.Net Account
Click the following link to be directed to the Login page. Fill in your details to log in.
Step 2 - Create an Ubuntu Instance on Atlantic.Net
Now it's time to build it; in this example, we will install Ubuntu 22.04 LTS 64bit.
Click on the "Add Server" button to create a new cloud server.
On the "Add a Server" page, type a name for your server.
Scroll down to find the Ubuntu operating system and click the "Ubuntu" button to see the versions. We installed 22.04 LTS 64-bit; select it and continue.
Choose the region that you want to use for your Ubuntu instance. In this example, we will use USA-East-3 (Ashburn, VA).
Choose the payment term: on-demand, one year, or three years. Various discounts are available, but we will choose on-demand for added flexibility.
Choose the instance plan. TDengine recommends at least 4GB RAM (more for production workloads). In this demo, we will choose the G3.4GB plan.
You can also select additional options, such as backups and IPV6, and add your own SSH keys if needed.
When you have selected everything you need, click the “Create Server” button.
Wait about 30 seconds for your server to be created. Once your server is ready, you can log in to it using SSH and start using it. The credentials are provided on screen and emailed to the primary email address on your account.
Step 3 - Enable SSH on your instance
There are numerous ways to enable SSH on your server. To connect to the server, use a GUI SSH client, such as PuTTY on Windows or iTerm2 on macOS. Download and install the client on your local machine, enter the server's IP address and login credentials, and connect to the server.
In this example, I will be using iTerm2 on macOS.
ssh username@server_ip_address
Replace username with your VPS username and server_ip_address with your VPS's public IP address.
Step 4 - Update OS and Prep System for TDEngine
Update the Ubuntu package list by running the following command:
apt update -y
Install the prerequisite packages by running the following command:
apt install gcc cmake build-essential git libssl-dev libjansson-dev libsnappy-dev liblzma-dev libz-dev zlib1g pkg-config -y
Note: You will be prompted “which services should be restarted,” leave the default selected and select “ok.”
Step 5 - Download and Install the TDEngine
To keep things simple we will install TDEngine using the pre-made packages from the official documentation.
Use wget to download the latest package.
wget https://www.tdengine.com/assets-download/3.0/TDengine-server-3.0.3.0-Linux-x64.tar.gz
Untar the downloaded package.
tar -zxvf TDengine-server-3.0.3.0-Linux-x64.tar.gz
Navigate to the TDEngine folder and install.
cd TDengine-server-3.0.3.0/
./install.sh
Note: When asked for an FQDN, just hit enter. You will be prompted to enter an email address.
Start and Enable the TAOS service.
systemctl start taosd
systemctl enable taosd
Check the status of the TAOS service to ensure that it has been installed correctly.
systemctl status taosd
Step 6 - Try out the TAOS CLI
To access the command line interface, simply type:
taos
To create a database enter the following:
CREATE DATABASE atlanticdemo;
USE atlanticdemo;
CREATE TABLE t (ts TIMESTAMP, speed INT);
INSERT INTO t VALUES ('2019-07-15 00:00:00', 10);
INSERT INTO t VALUES ('2019-07-15 01:00:00', 20);
SELECT * FROM t;
You will see this output:
Conclusion
In this tutorial, we explained how to install TDengine on Ubuntu Linux. We also showed you how to create a simple database using the TAOS CLI. You can now start exploring the possibilities of this superfast database. You can try to install TDEngine on dedicated hosting from Atlantic.Net!
### How to Install OpenNMS Monitoring Solution on Fedora
OpenNMS is a free, open-source, enterprise-grade network monitoring tool for Linux systems. It is used to visualize and monitor local as well as public networks via web browsers. It offers alarm generation, comprehensive fault, performance, and traffic monitoring from a single place. OpenNMS is customizable and can be integrated easily with other applications. If you are looking for a powerful and scalable monitoring solution, then OpenNMS is the right choice for you.
In this post, we will show you how to install the OpenNMS monitoring server on Fedora.
Step 1 - Install Java JDK
OpenNMS is a Java-based application, so you will need Java installed on your server. You can install it using the following command.
dnf install java-11-openjdk-devel curl unzip -y
Once Java is installed, you can verify the Java version with the following command.
java -version
Output.
openjdk version "11.0.15" 2022-04-19
OpenJDK Runtime Environment 18.9 (build 11.0.15+10)
OpenJDK 64-Bit Server VM 18.9 (build 11.0.15+10, mixed mode, sharing)
Step 2 - Install OpenNMS Server
By default, the OpenNMS package is not included in the Fedora default repo, so you will need to install the OpenNMS repo on your server.
Run the following command to install both the OpenNMS repo and key.
rpm --import https://yum.opennms.org/OPENNMS-GPG-KEY
dnf install https://yum.opennms.org/repofiles/opennms-repo-stable-rhel8.noarch.rpm
Next, install the OpenNMS with the following command.
dnf install opennms -y
Step 3 - Configure PostgreSQL
OpenNMS uses PostgreSQL as a database backend. By default, PostgreSQL will be installed automatically during the OpenNMS installation.
First, initialize the PostgreSQL database.
postgresql-setup --initdb --unit postgresql
Output.
* Initializing database in '/var/lib/pgsql/data'
* Initialized, logs are in /var/lib/pgsql/initdb_postgresql.log
Next, start and enable the PostgreSQL service.
systemctl start postgresql
systemctl enable postgresql
Next, log in to PostgreSQL, create an OpenNMS user, and set a password.
su - postgres
createuser -P opennms
Enter password for new role:
Enter it again:
Next, create an OpenNMS database and set a Postgres password.
createdb -O opennms opennms
psql -c "ALTER USER postgres WITH PASSWORD 'password';"
exit;
Next, edit the PostgreSQL configuration file.
nano /var/lib/pgsql/data/pg_hba.conf
Find the following lines:
# IPv4 local connections:
host all all 127.0.0.1/32 ident
# IPv6 local connections:
host all all ::1/128 ident
And replace them with the following lines:
host all all 127.0.0.1/32 md5
host all all ::1/128 md5
Save and close the file, then restart the PostgreSQL service to apply the changes.
systemctl restart postgresql
Step 4 - Configure OpenNMS
Next, you will need to edit the OpenNMS configuration file and define your database.
nano /opt/opennms/etc/opennms-datasources.xml
Change the following configurations as per your database.
Save and close the file, then check the Java environment.
/opt/opennms/bin/runjava -s
Output.
runjava: Looking for an appropriate JVM...
runjava: Checking for an appropriate JVM in JAVA_HOME...
runjava: Skipping... JAVA_HOME not set.
runjava: Checking JVM in the PATH: "/usr/lib/jvm/java-11-openjdk-11.0.15.0.10-1.fc34.x86_64/bin/java"...
runjava: Found an appropriate JVM in the PATH: "/usr/lib/jvm/java-11-openjdk-11.0.15.0.10-1.fc34.x86_64/bin/java"
runjava: Value of "/usr/lib/jvm/java-11-openjdk-11.0.15.0.10-1.fc34.x86_64/bin/java" stored in configuration file.
Next, install the OpenNMS packages using the following command.
/opt/opennms/bin/install -dis
Next, start and enable the OpenNMS service.
systemctl enable --now opennms
You can now verify the OpenNMS service status using the following command.
systemctl status opennms
Output.
● opennms.service - OpenNMS server
Loaded: loaded (/usr/lib/systemd/system/opennms.service; enabled; vendor preset: disabled)
Active: active (running) since Thu 2023-06-08 04:03:09 EDT; 5s ago
Process: 4850 ExecStart=/opt/opennms/bin/opennms -s start (code=exited, status=0/SUCCESS)
Process: 5806 ExecStartPost=/bin/sleep 3 (code=exited, status=0/SUCCESS)
Main PID: 5807 (java)
Tasks: 37 (limit: 2328)
Memory: 175.7M
CPU: 15.981s
CGroup: /system.slice/opennms.service
├─5805 bash /opt/opennms/bin/opennms -s start
└─5807 /usr/lib/jvm/java-11-openjdk-11.0.15.0.10-1.fc34.x86_64/bin/java --add-modules=java.base,java.compiler,java.datatransfer,java.desktop,java.instrume>
Jun 08 04:03:11 fedora opennms[5807]: [INFO] Successfully loaded jicmp6 library.
Jun 08 04:03:12 fedora opennms[5807]: [DEBUG] System property 'opennms.library.jicmp' set to '/usr/lib64/libjicmp.so. Attempting to load jicmp library from this locat>
Jun 08 04:03:12 fedora opennms[5807]: [INFO] Successfully loaded jicmp library.
Jun 08 04:03:12 fedora opennms[5807]: [DEBUG] System property 'opennms.library.jicmp6' set to '/usr/lib64/libjicmp6.so. Attempting to load jicmp6 library from this lo>
Jun 08 04:03:12 fedora opennms[5807]: [INFO] Successfully loaded jicmp6 library.
Jun 08 04:03:12 fedora opennms[5807]: [INFO] Using ICMP implementation: org.opennms.netmgt.icmp.best.BestMatchPinger
Jun 08 04:03:12 fedora opennms[5807]: [INFO] IPv4 ICMP available? true
Jun 08 04:03:12 fedora opennms[5807]: [INFO] IPv6 ICMP available? true
Jun 08 04:03:12 fedora opennms[5807]: [INFO] Invocation doTestLoadLibraries successful for MBean OpenNMS:Name=TestLoadLibraries
Jun 08 04:03:12 fedora opennms[5807]: [INFO] Invoking init on object OpenNMS:Name=Eventd
Step 5 - Access OpenNMS Dashboard
At this point, OpenNMS is installed and listening on port 8980. You can check it with the following command.
ss -antpl | grep :8980
Output.
LISTEN 0 50 *:8980 *:* users:(("java",pid=5807,fd=1193))
Now, open your web browser and access the OpenNMS dashboard using the URL http://your-server-ip:8980/opennms. You should see the OpenNMS login page.
Provide the default username and password as admin/admin then click on the Login button. You should see the OpenNMS dashboard on the following screen.
Conclusion
Congratulations! You have successfully installed and configured the OpenNMS network monitoring tool on Fedora. You can now add your local and remote devices to the OpenNMS and start monitoring them via the OpenNMS dashboard. You can now easily install and implement OpenNMS on VPS hosting from Atlantic.Net!
### How To Install Apache Maven On Fedora
Apache Maven is an open-source project management tool used for managing Java projects. Using Maven, you can manage the project's reporting, build, and documentation from a central place. It can also manage written projects in languages such as C#, Ruby, Scala, etc. It is based on the POM model and hosted by the Apache Software Foundation.
This post will show you how to install Apache Maven on Fedora.
Step 1 - Install Java JDK
Apache Maven is a Java-based software, so Java must be installed on your server. If not installed, you can install it using the following command.
dnf install java-11-openjdk -y
After installing Java JDK, you can verify the Java installation using the following command.
java --version
You should see the Java version in the following output.
openjdk 11.0.15 2022-04-19
OpenJDK Runtime Environment 18.9 (build 11.0.15+10)
OpenJDK 64-Bit Server VM 18.9 (build 11.0.15+10, mixed mode, sharing)
Step 2 - Download and Install Apache Maven
First, visit the Apache Maven official website, pick the latest version of Maven, and download it with the following command.
wget https://dlcdn.apache.org/maven/maven-3/3.9.1/binaries/apache-maven-3.9.1-bin.tar.gz
Once the download is completed, extract the downloaded file with the following command.
tar -xvzf apache-maven-3.9.1-bin.tar.gz
Next, move the extracted directory to the /opt directory.
mv apache-maven-3.9.1 /opt/maven
Step 3 - Create an Environment Variable for Maven
Next, you will need to create an environment variable file and define the path of the Maven.
nano /etc/profile.d/maven.sh
Add the following lines.
export M2_HOME=/opt/maven
export PATH=${M2_HOME}/bin:${PATH}
Save and close the file, then activate the environment variable with the following command.
source /etc/profile.d/maven.sh
Now, verify the Apache Maven version with the following command.
mvn -version
You should see the Maven version in the following output.
Apache Maven 3.9.1 (2e178502fcdbffc201671fb2537d0cb4b4cc58f8)
Maven home: /opt/maven
Java version: 11.0.15, vendor: Red Hat, Inc., runtime: /usr/lib/jvm/java-11-openjdk-11.0.15.0.10-1.fc34.x86_64
Default locale: en_IN, platform encoding: UTF-8
OS name: "linux", version: "5.12.8-300.fc34.x86_64", arch: "amd64", family: "unix"
Step 4 - Create a Project Using Maven
First, create a directory for the Maven project.
mkdir project
Next, navigate to the project directory and create a project using the following command.
cd project
mvn archetype:generate -DgroupId=com.example.app \
-DartifactId=test-app \
-DarchetypeArtifactId=maven-archetype-quickstart \
-DinteractiveMode=false
You should see the following output.
[INFO] ----------------------------------------------------------------------------
[INFO] Using following parameters for creating project from Old (1.x) Archetype: maven-archetype-quickstart:1.0
[INFO] ----------------------------------------------------------------------------
[INFO] Parameter: basedir, Value: /root/project
[INFO] Parameter: package, Value: com.example.app
[INFO] Parameter: groupId, Value: com.example.app
[INFO] Parameter: artifactId, Value: test-app
[INFO] Parameter: packageName, Value: com.example.app
[INFO] Parameter: version, Value: 1.0-SNAPSHOT
[INFO] project created from Old (1.x) Archetype in dir: /root/project/test-app
[INFO] ------------------------------------------------------------------------
[INFO] BUILD SUCCESS
[INFO] ------------------------------------------------------------------------
[INFO] Total time: 7.381 s
[INFO] Finished at: 2023-04-22T02:53:57-04:00
[INFO] ------------------------------------------------------------------------
Next, navigate to the application directory and build a package for your project using the following command.
cd test-app
mvn package
You should see the following output.
[INFO] Building jar: /root/project/test-app/target/test-app-1.0-SNAPSHOT.jar
[INFO] ------------------------------------------------------------------------
[INFO] BUILD SUCCESS
[INFO] ------------------------------------------------------------------------
[INFO] Total time: 6.213 s
[INFO] Finished at: 2023-04-22T02:55:21-04:00
[INFO] ------------------------------------------------------------------------
Conclusion
In this post, we explained how to install Apache Maven on Fedora. You can now use Apache Maven with other programming languages and manage your project from the central location. In addition, you can now use Apache Maven on dedicated server hosting from Atlantic.Net!
### How to Install FreePBX VoIP Solution Fedora
Free and open-source FreePBX is the world's most popular communications software system for configuring, controlling, and managing Asterisk PBX software. It comes with a graphical user interface that helps beginner users to manage VOIP via a web browser. FreePBX offer includes lots of functionality including VoIP, PBX, Fax, IVR, voice-mail, and email functions. It is designed for application developers, students, hackers, systems integrators, and others who want to create custom solutions with Asterisk.
In this post, we will show you how to install FreePBX on Fedora.
Step 1 - Install Required Dependencies
Before starting, you will need to install some dependencies required to build the FreePBX system. You can install all of them using the following command.
dnf update -y
dnf -y groupinstall "Development Tools"
dnf install -y gcc-c++ libedit-devel uuid-devel libuuid-devel autoconf automake libtool ncurses-devel sendmail sendmail-cf newt-devel libxml2-devel libtiff-devel gtk2-devel subversion kernel-devel git crontabs cronie cronie-anacron wget vim sqlite-devel net-tools gnutls-devel unixODBC
Next, you will also need to install the Jansson package on your system. You can compile it with the following command.
git clone https://github.com/akheron/jansson.git
cd jansson
autoreconf -i
./configure --prefix=/usr/
make
make install
Step 2 - Install Asterisk Server
Asterisk is a core part of any VOIP software, so you will need to download and compile it in your system. First, visit the Asterisk official download page and download the latest version of Asterisk using the following command.
wget http://downloads.asterisk.org/pub/telephony/asterisk/asterisk-20-current.tar.gz
Once the download is completed, extract the downloaded file using the following command.
tar xvfz asterisk-20-current.tar.gz
Next, navigate to the Asterisk directory and configure it with the following command.
cd asterisk-20.3.0
./configure --libdir=/usr/lib64
Output:
configure: Menuselect build configuration successfully completed
.$$$$$$$$$$$$$$$=..
.$7$7.. .7$$7:.
.$$:. ,$7.7
.$7. 7$$$$ .$$77
..$$. $$$$$ .$$$7
..7$ .?. $$$$$ .?. 7$$$.
$.$. .$$$7. $$$$7 .7$$$. .$$$.
.777. .$$$$$$77$$$77$$$$$7. $$$,
$$$~ .7$$$$$$$$$$$$$7. .$$$.
.$$7 .7$$$$$$$7: ?$$$.
$$$ ?7$$$$$$$$$$I .$$$7
$$$ .7$$$$$$$$$$$$$$$$ :$$$.
$$$ $$$$$$7$$$$$$$$$$$$ .$$$.
$$$ $$$ 7$$$7 .$$$ .$$$.
$$$$ $$$$7 .$$$.
7$$$7 7$$$$ 7$$$
$$$$$ $$$
$$$$7. $$ (TM)
$$$$$$$. .7$$$$$$ $$
$$$$$$$$$$$$7$$$$$$$$$.$$$$$$
$$$$$$$$$$$$$$$$.
configure: Package configured for:
configure: OS type : linux-gnu
configure: Host CPU : x86_64
configure: build-cpu:vendor:os: x86_64 : pc : linux-gnu :
configure: host-cpu:vendor:os: x86_64 : pc : linux-gnu :
Next, run the following command to install additional modules.
make menuselect
You should see the following screen.
Core Sound Module
MOH Module
Extra Sound Module
Use the up and down arrow keys to select and install all additional modules. Once you are done, click on the Save and Exit button to save the changes.
Next, run the following command to install other required packages.
./contrib/scripts/install_prereq install
./contrib/scripts/get_mp3_source.sh
Finally, install Asterisk using the following commands.
make
make install
Next, generates an Asterisk configuration file using the following command.
make samples
make config
ldconfig
Step 3 - Configure Asterisk
First, create a dedicated user and group for Asterisk.
groupadd asterisk
useradd -r -d /var/lib/asterisk -g asterisk asterisk
Next, add the Asterisk user to the audio and dialout group.
usermod -aG audio,dialout asterisk
Next, set proper ownership to the Asterisk configuration directories.
chown -R asterisk.asterisk /etc/asterisk /var/{lib,log,spool}/asterisk /usr/lib64/asterisk
Next, edit the Asterisk configuration file.
nano /etc/sysconfig/asterisk
Uncomment and change the following line.
AST_USER="asterisk"
AST_GROUP="asterisk"
Next, edit another configuration file.
nano /etc/asterisk/asterisk.conf
Uncomment and change the following line.
runuser = asterisk ; The user to run as.
rungroup = asterisk ; The group to run as.
Save and close the file, then reload the systemd daemon to implement the changes.
systemctl daemon-reload
Next, start and enable the Asterisk service.
systemctl start asterisk
systemctl enable asterisk
Next, verify the Asterisk connection with the following command.
asterisk -rvv
If everything is fine, you will get the following output.
Asterisk 20.3.0, Copyright (C) 1999 - 2022, Sangoma Technologies Corporation and others.
Created by Mark Spencer
Asterisk comes with ABSOLUTELY NO WARRANTY; type 'core show warranty' for details.
This is free software, with components licensed under the GNU General Public
License version 2 and other licenses; you are welcome to redistribute it under
certain conditions. Type 'core show license' for details.
=========================================================================
Running as user 'asterisk'
Running under group 'asterisk'
Connected to Asterisk 20.3.0 currently running on freepbx (pid = 112072)
freepbx*CLI>
Now, exit from the Asterisk console.
exit
Step 4 - Install the LAMP Server
Next, you will need to install Apache, MariaDB, and PHP on your server. You can install all of them using the following command.
dnf install mariadb mariadb-server httpd php php-pear php-cgi php-common php-curl php-mbstring php-gd php-mysqlnd php-gettext php-bcmath php-zip php-xml php-json php-process php-snmp
Next, edit the PHP configuration file and define max_upload size.
nano /etc/php.ini
Change the following line.
upload_max_filesize = 20M
Next, modify another PHP configuration using the following command.
sed -i 's/\(^memory_limit = \).*/\1128M/' /etc/php.ini
sed -i 's/^\(User\|Group\).*/\1 asterisk/' /etc/httpd/conf/httpd.conf
sed -i 's/AllowOverride None/AllowOverride All/' /etc/httpd/conf/httpd.conf
sed -i 's/\(^user = \).*/\1asterisk/' /etc/php-fpm.d/www.conf
sed -i 's/\(^group = \).*/\1asterisk/' /etc/php-fpm.d/www.conf
sed -i 's/\(^listen.acl_users = \).*/\1apache,nginx,asterisk/' /etc/php-fpm.d/www.conf
Next, start and enable, Apache, MariaDB, and PHP-FPM services.
systemctl start php-fpm httpd mariadb
systemctl enable php-fpm httpd mariadb
Next, install Node.js and NPM using the following command.
dnf install nodejs npm
Step 5 - Install and Configure FreePBX
First, download the latest version of FreePBX from their official website.
wget http://mirror.freepbx.org/modules/packages/freepbx/freepbx-16.0-latest.tgz
Once the FreePBX is downloaded, extract the downloaded file.
tar vxfz freepbx-16.0-latest.tgz
Next, navigate to the FreePBX directory and stop the Asterisk service.
cd freepbx
systemctl stop asterisk
Next, start the Asterisk service using the following command.
./start_asterisk start
Next, install the FreePBX with the following command.
./install --webroot=/var/www/html -n
You will see the following output.
Setting Permissions...
Setting base permissions...Done in 1 seconds
Setting specific permissions...
50724 [============================]
Finished setting permissions
Generating default configurations...
Finished generating default configurations
You have successfully installed FreePBX
Next, delete Firewall and install other packages with the following command.
fwconsole ma disablerepo commercial
fwconsole ma installall
fwconsole ma delete firewall
Next, reload and restart the fwconsole with the following command.
fwconsole reload
fwconsole restart
Step 6 - Create a Systemd Service for FreePBX
Next, create a systemd service for FreePBX with the following command.
nano /etc/systemd/system/freepbx.service
Add the following configuration.
[Unit]
Description=FreePBX VoIP Server
After=mariadb.service
[Service]
Type=oneshot
RemainAfterExit=yes
ExecStart=/usr/sbin/fwconsole start -q
ExecStop=/usr/sbin/fwconsole stop -q
[Install]
WantedBy=multi-user.target
Save and close the file, then reload the systemd daemon to apply the changes.
systemctl daemon-reload
Next, start and enable FreePBX with the following command.
systemctl start freepbx
systemctl enable freepbx
You can verify the status of FreePBX using the following command.
systemctl status freepbx
Output.
● freepbx.service - FreePBX VoIP Server
Loaded: loaded (/etc/systemd/system/freepbx.service; disabled; vendor preset: disabled)
Active: active (exited) since Mon 2023-06-05 11:56:26 EDT; 6s ago
Process: 129579 ExecStart=/usr/sbin/fwconsole start -q (code=exited, status=0/SUCCESS)
Main PID: 129579 (code=exited, status=0/SUCCESS)
CPU: 19.129s
Jun 05 11:56:23 freepbx runuser[129849]: pam_unix(runuser:session): session closed for user asterisk
Jun 05 11:56:23 freepbx runuser[129860]: pam_unix(runuser:session): session opened for user asterisk(uid=992) by (uid=0)
Jun 05 11:56:24 freepbx runuser[129860]: pam_unix(runuser:session): session closed for user asterisk
Jun 05 11:56:24 freepbx runuser[129887]: pam_unix(runuser:session): session opened for user asterisk(uid=992) by (uid=0)
Jun 05 11:56:24 freepbx runuser[129887]: pam_unix(runuser:session): session closed for user asterisk
Jun 05 11:56:24 freepbx runuser[129919]: pam_unix(runuser:session): session opened for user asterisk(uid=992) by (uid=0)
Jun 05 11:56:25 freepbx runuser[129919]: pam_unix(runuser:session): session closed for user asterisk
Jun 05 11:56:25 freepbx runuser[129942]: pam_unix(runuser:session): session opened for user asterisk(uid=992) by (uid=0)
Jun 05 11:56:26 freepbx runuser[129942]: pam_unix(runuser:session): session closed for user asterisk
Jun 05 11:56:26 freepbx systemd[1]: Finished FreePBX VoIP Server.
Step 7 - Access FreePBX Web UI
Now, open your web browser and access the FreePBX web interface using the URL http://your-server-ip. You should see the FreePBX configuration page.
Set your admin user account and click on the Setup System button. You should see the following screen:
Click on the FreePBX Administration. You should see the FreePBX login screen:
Provide your admin username, password, and click on the Continue button. You should see the FreePBX dashboard on the following screen:
Conclusion
In this guide, we explained how to install FreePBX with Asterisk on Fedora. You can now deploy FreePBX in your local environment, build your own VOIP server, and start making free calls to other users. Try to install and deploy FreePBX on VPS hosting from Atlantic.Net!
### How to Install Magento on Fedora
Magento is an open-source e-commerce software platform written in PHP. It helps online merchants to create a flexible shopping cart system with ease. It is a highly customizable and resource-intensive application for medium to large stores. Magento is simple and user-friendly, so beginner users can host a fully-functional online shopping cart system without any programming knowledge.
This post will show you how to install Magento on Fedora.
Step 1 - Install the LAMP Server
First, install the Apache web server package using the following command.
dnf install httpd -y
By default, PHP 8.1 is not included in the Fedora 34 default repo, so you will need to install the PHP Remi repository on your server. You can install it with the following command.
dnf install -y http://rpms.remirepo.net/fedora/remi-release-34.rpm
Next, enable the Remi repository with the following command.
dnf module install php:remi-8.1
Next, install PHP and other required extensions using the following command.
dnf install php-mysqlnd php-xml php-cli php-soap php-opcache php-iconv php-pear php-bcmath php-gd php-mbstring php-json php-devel unzip wget -y
yum --enablerepo=remi install php-intl php-sodium php-zip
Next, edit the PHP configuration file and change some default settings.
nano /etc/php.ini
Change the following values:
memory_limit = 1024M
upload_max_filesize = 256M
zlib.output_compression = on
max_execution_time = 300
date.timezone = UTC
Save and close the file, then start and enable the Apache service using the following command.
systemctl start httpd
systemctl enable httpd
Step 2 - Install and Configure MySQL Server
First, install the MySQL server repository using the following command.
rpm -ivh https://dev.mysql.com/get/mysql80-community-release-fc34-2.noarch.rpm
rpm --import https://repo.mysql.com/RPM-GPG-KEY-mysql-2022
Next, install the MySQL server package using the following command.
dnf install mysql-community-server -y
Next, start and enable the MySQL service with the following command.
systemctl enable mysqld
systemctl start mysqld
Next, retrieve the MySQL root password.
grep 'A temporary password is generated' /var/log/mysqld.log | tail -1
You will get the root password in the following output.
2023-04-22T12:41:00.940040Z 6 [Note] [MY-010454] [Server] A temporary password is generated for root@localhost: 3ak*CpiARf3L
Next, secure the MySQL installation and change the MySQL root password.
mysql_secure_installation
You will be asked to provide your existing MySQL root password.
Securing the MySQL server deployment.
Enter password for user root:
Provide your root password and press the Enter key. You will be asked to set a new password.
The existing password for the user account root has expired. Please set a new password.
New password:
Re-enter new password:
Set your root password and press the Enter key to continue. You will be asked to remove the anonymous user, remove the test database, disallow root login, and reload the privileges table as shown below.
Remove anonymous users? (Press y|Y for Yes, any other key for No) : Y
Disallow root login remotely? (Press y|Y for Yes, any other key for No) : Y
Remove test database and access to it? (Press y|Y for Yes, any other key for No) : Y
Reload privilege tables now? (Press y|Y for Yes, any other key for No) : Y
Now, log in to your MySQL as a root user.
mysql -u root -p
Next, create a database and user for Magento using the following command.
CREATE DATABASE magento;
CREATE USER 'magento'@'localhost' IDENTIFIED BY 'Secur_&pas%3_sword';
Next, grant all the privileges to the Magento database.
GRANT ALL ON magento.* TO 'magento'@'localhost';
Next, flush the privileges and exit from the MariaDB shell:
FLUSH PRIVILEGES;
EXIT;
Step 3 - Download Magento
First, install Composer using the following command.
curl -sS https://getcomposer.org/installer | php
mv composer.phar /usr/local/bin/composer
chmod +x /usr/local/bin/composer
Next, navigate to the Apache root directory and download the latest version of Magento with the following command.
cd /var/www/html
composer create-project --repository-url=https://repo.magento.com/ magento/project-community-edition=2.4.5 magento2
You will be asked to provide your Magento key and password to download it from their website.
Next, change the ownership of the Magento directory.
chown -R apache:apache /var/www/html/magento2
Next, navigate to the Magento directory and set all necessary permissions.
cd /var/www/html/magento2
find var generated vendor pub/static pub/media app/etc -type f -exec chmod g+w {} +
find var generated vendor pub/static pub/media app/etc -type d -exec chmod g+ws {} +
chown -R apache:apache .
chmod u+x bin/magento
Step 4 - Configure Apache for Magento
Next, create an Apache virtual host configuration file for Magento.
nano /etc/httpd/conf.d/magento.conf
Add the following configurations.
ServerAdmin admin@example.com
ServerName magento.example.com
DocumentRoot /var/www/html/magento2/
DirectoryIndex index.php
Options Indexes FollowSymLinks MultiViews
AllowOverride All
Order allow,deny
allow from all
ErrorLog /var/log/httpd/magento_error.log
CustomLog /var/log/httpd/magento_access.log combined
Save and close the file then restart the Apache service to apply the changes.
systemctl restart httpd
Step 5 - Install Magento
First, navigate to the Magento directory and run the following command to install Magento on your server.
cd /var/www/html/magento2/
sudo -u apache bin/magento setup:install --admin-firstname="magento" --admin-lastname="admin" --admin-email="admin@example.com" --admin-user="admin" --admin-password="Your_Secure@Password123" --db-name="magento" --db-host="localhost" --db-user="magento" --db-password="Secur_&pas%3_sword" --language=en_US --currency=USD --timezone=UTC --cleanup-database --base-url=http://"magento.example.com"
You will get the following error.
Could not validate a connection to Elasticsearch. No alive nodes found in your cluster
You will need to disable Elasticsearch to resolve this error.
sudo -u apache bin/magento module:disable {Magento_Elasticsearch,Magento_Elasticsearch6,Magento_Elasticsearch7}
Next, run the following command again to install Magento.
sudo -u apache bin/magento setup:install --admin-firstname="magento" --admin-lastname="admin" --admin-email="admin@example.com" --admin-user="admin" --admin-password="Your_Secure@Password123" --db-name="magento" --db-host="localhost" --db-user="magento" --db-password="Secur_&pas%3_sword" --language=en_US --currency=USD --timezone=UTC --cleanup-database --base-url=http://"magento.example.com"
Once the Magento is installed, you will get the following output.
[SUCCESS]: Magento installation complete.
[SUCCESS]: Magento Admin URI: /admin_kroki9
Nothing to import.
Next, you must install the Magento cron module and disable the two-factor authentication module.
cd /var/www/html/magento2
sudo -u apache bin/magento cron:install
sudo -u apache bin/magento module:disable Magento_TwoFactorAuth
Step 6 - Access Magento Web Interface
Now, open your web browser and access the Magento web UI using the URL http://magento.example.com//admin_kroki9. You will be asked to provide a Magento admin username and password.
Type your username, password and click on the Login button. You should see the Magento dashboard on the following screen.
Conclusion
You learned how to install Magento with Apache on Fedora in this post. You can now start your online store using the Magento platform. You can now deploy Magento on dedicated server hosting from Atlantic.Net!
### How to Install PHP on Fedora
PHP, also called "PHP: Hypertext Preprocessor," is a widely-used, open-source scripting language for managing dynamic content. It is a server-side scripting language that is embedded in HTML. Generally, PHP is used with Apache and Nginx web servers to build dynamic websites, static websites, and web applications. It is also a general-purpose language that you can use to make many projects, including Graphical User Interfaces.
This post will show you how to install PHP 5.6, 7.4, 8.0, and 8.1 on Fedora 34.
Install PHP 8.1
By default, PHP 8.1 is not included in the Fedora 34 default repo, so you will need to install the PHP Remi repository on your server. You can install it with the following command.
dnf install -y http://rpms.remirepo.net/fedora/remi-release-34.rpm
Next, enable the Remi repository with the following command.
dnf module install php:remi-8.1
Next, install PHP 8.1 with other extensions with the following command.
dnf install -y php php-common php-cli
After the installation, verify the PHP version using the following command.
php -v
You should get the following output.
PHP 8.1.9 (cli) (built: Aug 2 2022 13:02:24) (NTS gcc x86_64)
Copyright (c) The PHP Group
Zend Engine v4.1.9, Copyright (c) Zend Technologies
with Zend OPcache v8.1.9, Copyright (c), by Zend Technologies
Install PHP 8.0
First, reset the PHP default module with the following command.
dnf module reset php -y
Next, install the Remi module for PHP 8.0 with the following command.
dnf module install php:remi-8.0
Next, install PHP and other extensions using the following command.
dnf install -y php php-common php-cli
Once all the packages are installed, you can verify the PHP version with the following command.
php -v
You should see the following output.
PHP 8.0.22 (cli) (built: Aug 2 2022 08:01:15) ( NTS gcc x86_64 )
Copyright (c) The PHP Group
Zend Engine v4.0.22, Copyright (c) Zend Technologies
with Zend OPcache v8.0.22, Copyright (c), by Zend Technologies
Install PHP 7.4
First, reset the PHP default module with the following command.
dnf module reset php -y
Next, install the Remi module for PHP 7.4 with the following command.
dnf module install php:remi-7.4 -y
Next, install PHP with other extensions using the following command.
dnf install -y php php-common php-cli
Finally, verify the PHP version using the following command.
php -v
You should see the following output.
PHP 7.4.30 (cli) (built: Jun 7 2022 08:38:19) ( NTS )
Copyright (c) The PHP Group
Zend Engine v3.4.0, Copyright (c) Zend Technologies
with Zend OPcache v7.4.30, Copyright (c), by Zend Technologies
Install PHP 5.6
First, reset the PHP default module with the following command.
dnf module reset php -y
Next, install PHP 5.6 with the following command.
dnf --enablerepo=remi install php56
After the installation, you can verify the PHP installation using the following command.
php56 -v
You should see the following output.
PHP 5.6.40 (cli) (built: Jun 7 2022 00:00:00)
Copyright (c) 1997-2016 The PHP Group
Zend Engine v2.6.0, Copyright (c) 1998-2016 Zend Technologies
Install PHP Extensions
You can also install some required PHP extensions with the following command.
dnf install -y php-mysqlnd php-gd php-curl php-json -y
You can verify the installed PHP extensions using the following command.
php -m | grep -i mysql
You should see the following output.
mysqli
mysqlnd
pdo_mysql
Conclusion
This tutorial showed you how to install PHP 5.6, 7.4, 8.0, and 8.1 on Fedora 34. You can now easily install any PHP version on your server as per your needs. Try to install PHP on dedicated server hosting from Atlantic.Net!
### How to Setup a Basic ELK Stack on Fedora
An ELK stack is a group of three popular open-source components: Elasticsearch, Logstash, and Kibana. An ELK stack helps you to capture logs of all your systems and applications and analyze and create a visual dashboard for application monitoring. Elasticsearch is a search engine, Logstash is a server‑side data processing pipeline and Kibana lets users visualize data with charts and graphs in Elasticsearch.
In this post, we will show you how to install the ELK stack on Fedora
Step 1 - Install Java JDK
ELK stack is based on Java, so Java JDK must be installed on your server. If not installed, you can install it with the following command.
dnf update -y
dnf install java-openjdk-devel java-openjdk
Once Java JDK is installed, you can verify it with the following command.
java -version
You will get the Java version in the following output.
openjdk version "11.0.10" 2021-01-19
OpenJDK Runtime Environment 18.9 (build 11.0.10+9)
OpenJDK 64-Bit Server VM 18.9 (build 11.0.10+9, mixed mode, sharing)
Step 2 - Install Elasticsearch
By default, the Elasticsearch package is not included in the Fedora default repo, so you will need to create an Elasticsearch repo on your server. You can create it with the following command.
nano /etc/yum.repos.d/elasticsearch.repo
Add the following configuration.
[elasticsearch-8.x]
name=Elasticsearch repository for 8.x packages
baseurl=https://artifacts.elastic.co/packages/8.x/yum
gpgcheck=1
gpgkey=https://artifacts.elastic.co/GPG-KEY-elasticsearch
enabled=1
autorefresh=1
type=rpm-md
Save and close the file, then import the Elasticsearch key using the following command.
rpm --import https://artifacts.elastic.co/GPG-KEY-elasticsearch
Next, clean all package caches with the following command.
yum clean all
yum makecache
Finally, install the Elasticsearch package with the following command.
dnf install elasticsearch
Next, start the enable the Elasticsearch service with the following command.
systemctl enable --now elasticsearch.service
You can verify the status of Elasticsearch with the following command.
systemctl status elasticsearch
Output.
● elasticsearch.service - Elasticsearch
Loaded: loaded (/usr/lib/systemd/system/elasticsearch.service; enabled; vendor preset: disabled)
Active: active (running) since Mon 2023-06-05 12:11:26 EDT; 13s ago
Docs: https://www.elastic.co
Main PID: 132617 (java)
Tasks: 75 (limit: 4666)
Memory: 2.3G
CPU: 1min 2.533s
CGroup: /system.slice/elasticsearch.service
├─132617 /usr/share/elasticsearch/jdk/bin/java -Xms4m -Xmx64m -XX:+UseSerialGC -Dcli.name=server -Dcli.script=/usr/share/elasticsearch/bin/elasticsearch ->
├─132673 /usr/share/elasticsearch/jdk/bin/java -Des.networkaddress.cache.ttl=60 -Des.networkaddress.cache.negative.ttl=10 -Djava.security.manager=allow -X>
└─132706 /usr/share/elasticsearch/modules/x-pack-ml/platform/linux-x86_64/bin/controller
Jun 05 12:10:55 freepbx systemd[1]: Starting Elasticsearch...
Jun 05 12:11:26 freepbx systemd[1]: Started Elasticsearch.
Next, you will need to set the Elasticsearch password. You can set it with the following command.
/usr/share/elasticsearch/bin/elasticsearch-reset-password -u elastic -i
Set your password as shown below.
This tool will reset the password of the [elastic] user.
You will be prompted to enter the password.
Please confirm that you would like to continue [y/N]y
Enter password for [elastic]:
Re-enter password for [elastic]:
Password for the [elastic] user successfully reset.
Next, verify Elasticsearch using the following command.
curl --cacert /etc/elasticsearch/certs/http_ca.crt -u elastic https://localhost:9200
You will be asked to provide your password to perform the query. After the successful authentication, you will get the following output.
Enter host password for user 'elastic':
{
"name" : "freepbx",
"cluster_name" : "elasticsearch",
"cluster_uuid" : "g13oMGscTzqXwHqacXMYwg",
"version" : {
"number" : "8.8.0",
"build_flavor" : "default",
"build_type" : "rpm",
"build_hash" : "c01029875a091076ed42cdb3a41c10b1a9a5a20f",
"build_date" : "2023-05-23T17:16:07.179039820Z",
"build_snapshot" : false,
"lucene_version" : "9.6.0",
"minimum_wire_compatibility_version" : "7.17.0",
"minimum_index_compatibility_version" : "7.0.0"
},
"tagline" : "You Know, for Search"
}
Step 3 - Install Kibana
You can run the following command to install Kibana on your server.
dnf install kibana
After the successful installation, you will need to edit the Kibana configuration file and define your server name and host. You can edit it with the following command.
nano /etc/kibana/kibana.yml
Change the following lines:
server.host: "0.0.0.0"
server.name: "kibana.example.com"
elasticsearch.hosts: ["http://localhost:9200"]
Save and close the file. Then, start the Kibana service and enable it to start at system reboot.
systemctl enable --now kibana
You can now check the Kibana status with the following command.
systemctl status kibana
Output:
● kibana.service - Kibana
Loaded: loaded (/usr/lib/systemd/system/kibana.service; enabled; vendor preset: disabled)
Active: active (running) since Mon 2023-06-05 12:17:15 EDT; 12s ago
Docs: https://www.elastic.co
Main PID: 133181 (node)
Tasks: 11 (limit: 4666)
Memory: 216.5M
CPU: 13.397s
CGroup: /system.slice/kibana.service
└─133181 /usr/share/kibana/bin/../node/bin/node /usr/share/kibana/bin/../src/cli/dist
Jun 05 12:17:15 freepbx systemd[1]: Started Kibana.
Jun 05 12:17:21 freepbx kibana[133181]: [2023-06-05T12:17:21.001-04:00][INFO ][node] Kibana process configured with roles: [background_tasks, ui]
Now, open your web browser and access the Kibana dashboard using the URL http://your-server-ip:5601/. You will be asked to provide a token as shown below.
Now, run the following command to generate a token for enrollment.
/usr/share/elasticsearch/bin/elasticsearch-create-enrollment-token -s kibana
Output.
eyJ2ZXIiOiI4LjguMCIsImFkciI6WyI2OS4yOC44NS4yMTY6OTIwMCJdLCJmZ3IiOiI2YzE4YjcxZDlhNjVmNDlkM2Q2NWMwOTgyNmEwMDdhZTIzODVmYmIxMDQ5NjkxMjRjYTcyYTE0YWJiY2MxNTkwIiwia2V5IjoiV21wYWpJZ0JHNkV5OE5RQmhSNTk6SEdCdWhTaWxTaWlTS0ltZTR4eXFQUSJ9
Copy and paste the above token to the browser and click on Configure Elastic. You should see the verification screen.
Now, get the verification code, open your terminal, and run the following command.
/usr/share/kibana/bin/kibana-verification-code
Output:
Your verification code is: 459 529
Paste the above code to the web browser and click on the verify button. After the successful verification, you should see the Elastic login page.
Provide your username, password and click on the Log In button. You should see the Kibana dashboard on the following screen.
Step 4 - Install Logstash
Logstash is an open-source, and server-side data processing pipeline that allows you to collect data from different sources, transform it, and send it to your desired destination. You can install it with the following command.
dnf install logstash
After the installation, start and enable the Logstash service with the following command.
systemctl start logstash
systemctl enable logstash
Conclusion
In this post, we explained how to install a complete ELK stack such as Elasticsearch, Kibana, and Logstash on Fedora. You can now implement the ELK stack in your development environment and start monitoring your application via the Kibana dashboard. Let's try to deploy and implement an ELK stack on VPS hosting from Atlantic.Net!
### How to Choose the Best Hosting Provider for Your Business
Every business needs a reliable, high-performance IT infrastructure to succeed. But behind every great company is a dedicated hosting provider ensuring your IT systems and core servers function at peak performance, diligently working to ensure your systems operate at their absolute best.
Selecting the appropriate hosting provider for your business is crucial in determining your enterprise's performance, security, and profitability. This article will explain the best hosting provider features and demonstrate how cloud computing can take your business to the next level.
What a Hosting Provider Should Offer
A hosting provider is much more than someone who keeps the lights; it is the backbone of your digital presence and your digital enabler.
But what exactly sets a leading hosting provider apart from the rest?
Hosting Types: While shared hosting is cost-effective, it involves sharing resources with other websites, potentially affecting performance. On the other hand, Virtual Private Server (VPS) hosting offers dedicated resources for your server, guaranteeing enhanced performance and security. Dedicated servers take this a step further, offering an entire server for your business, while cloud platforms provide unmatched scalability and resilience.
Performance: The speed and uptime of your IT Systems are integral to the user experience. Slow or frequently unavailable systems will deter potential customers and harm your business's reputation. A top-notch hosting provider guarantees high uptime and speedy performance.
Security: Cyber threats are a rising concern for businesses. The best hosting providers offer robust security measures, such as firewalls, SSL certificates, and regular backups, to protect your business from the latest cyber threats.
Customer Support: When problems arise, prompt and effective customer support can be a lifesaver. Look for a hosting provider with a reputation for delivering top-notch customer service.
Scalability: As your business grows, so do your IT needs. Look for a hosting provider that can scale its services according to your evolving needs.
Amplifying Your Business with Atlantic.Net
Now that you understand what to look for in a hosting provider, let's delve into the world-class hosting services offered by Atlantic.Net and why they are the ideal choice for your business.
Unparalleled Hosting Options: Atlantic.Net provides a wide range of hosting options designed to cater to the specific needs of your business. We offer VPS hosting, cloud hosting, and dedicated servers, allowing you to select the ideal hosting solution for your requirements. So whether you need the flexibility and scalability of VPS hosting, the power and resources of dedicated servers, or the agility and efficiency of cloud hosting, Atlantic.Net has options to suit your business needs.
Exceptional Performance: Atlantic.Net guarantees a 100% uptime guarantee and utilizes state-of-the-art technology to ensure your website runs quickly and smoothly. With Atlantic.Net, your website's performance is never a concern.
Impeccable Security: With Atlantic.Net, your website's security is paramount. They offer advanced security measures, including Managed Firewall, Intrusion Detection services, and Automated Backups. With Atlantic.Net, you can rest easy knowing your business is in safe hands.
24/7/365 Customer Support: We actively focus on delivering exceptional customer service, backed by our experienced US-based support team that remains available 24/7/365 to assist with any issues that may arise promptly
Scalable Solutions: Atlantic.Net understands that your business's needs may change. Therefore, we offer scalable hosting solutions to accommodate your growing business.
Choosing the right hosting provider for your business is a significant decision that can shape your digital presence's trajectory. With its impressive range of hosting options, guaranteed performance, robust security, exceptional customer service, and scalable solutions, Atlantic.Net is the hosting provider your business needs to thrive in the digital era.
Don't settle for less when it comes to your business. Experience the Atlantic.Net difference today and empower your business to achieve unprecedented success.
Whether you're looking for cloud, VPS, dedicated server, colocation, or managed hosting, Atlantic.Net has you covered. The ACP cloud platform is designed for unparalleled performance and maximum flexibility, offering blazing-fast speeds for servers and applications with a 100% uptime guarantee. On the other hand, if you're seeking fault-tolerant and ultra-fast performance, look no further than Atlantic.Net's VPS hosting, backed by an expert support team available round the clock.
For businesses with complex security, compliance, and privacy requirements, Atlantic.Net's dedicated server hosting provides dizzying speeds of large data transfers while assuring optimum server performance. In addition, with colocation hosting, you can place your server infrastructure in a secure data center environment, offering maximum control while leasing power, space, and bandwidth.
Moreover, Atlantic.Net's managed services help save time, effort, and resources by handling data containment, flow, and security on a dedicated or cloud environment, allowing you to focus more on your core business.
With a legacy stretching back to 1994, Atlantic.Net has built a reputation as a trusted hosting solutions provider, always putting customer satisfaction at the forefront of its operations. You're not just choosing a hosting provider; you're choosing a partner committed to your business's growth and prosperity.
Switch to Atlantic.Net today and give your business the digital presence it deserves. Unlock your business's potential and experience the power of world-class hosting. Begin your journey today.
### How to Install Drupal on Fedora
Drupal is an open-source CMS that allows users to build the versatile, structured content needed for dynamic web experiences. It is an alternate solution to other CMSes like WordPress and Joomla. It offers great features like reliability, high performance, excellent security, easy content authoring, and more. Drupal offers more than 30000 modules that help users to create blogs, forums, polls, and any kind of website.
This post will explain how to install Drupal CMS on Fedora 34.
Step 1 - Install Apache and MariaDB Server
First, install the Apache and MariaDB server with the following command.
dnf update -y
dnf install httpd mariadb-server -y
Once both packages are installed, start and enable both Apache and MariaDB services with the following command.
systemctl start httpd mariadb
systemctl enable httpd mariadb
Step 2 - Install PHP
Next, you will need to install the latest version of PHP on your server.
First, install the Remi PHP repository using the following command.
dnf install -y http://rpms.remirepo.net/fedora/remi-release-34.rpm
Next, enable the Remi PHP module with the following command.
dnf module enable -y php:remi-8.1
Next, install PHP with other required extensions using the following command.
dnf install php php-fpm php-mysqlnd php-opcache php-gd php-xml php-mbstring php-curl php-pecl-imagick php-pecl-zip libzip
Once PHP is installed, you can verify the PHP version with the following command.
php -v
You should see the following output.
PHP 8.1.9 (cli) (built: Aug 2 2022 13:02:24) (NTS gcc x86_64)
Copyright (c) The PHP Group
Zend Engine v4.1.9, Copyright (c) Zend Technologies
with Zend OPcache v8.1.9, Copyright (c), by Zend Technologies
Next, edit the PHP configuration file and change the default settings:
nano /etc/php.ini
Change the following lines:
max_execution_time = 300
max_input_time = 300
memory_limit = 512M
post_max_size = 256M
upload_max_filesize = 256M
Save and close the file, then start and enable the PHP-FPM service to implement the changes.
systemctl start php-fpm
systemctl enable php-fpm
Step 3 - Create a Database for Drupal
Next, you will need to create a database and user for Drupal.
First, log in to the MariaDB shell with the following command.
mysql
Once logged in, create a database and user with the following command.
MariaDB [(none)]> CREATE DATABASE drupaldb;
MariaDB [(none)]> GRANT ALL PRIVILEGES ON drupaldb.* TO 'drupaluser'@'localhost' IDENTIFIED BY 'password';
Next, flush the privileges and exit from the MariaDB shell with the following command.
MariaDB [(none)]> FLUSH PRIVILEGES;
MariaDB [(none)]> EXIT;
Step 4 - Download Drupal
First, download the latest version of Drupal with the following command.
wget https://www.drupal.org/download-latest/tar.gz
Next, extract the downloaded file with the following command.
tar -zxf tar.gz
Next, move the extracted directory to the Apache web root:
mv drupal-10.0.7 /var/www/html/drupal
Next, navigate to the Drupal site directory and copy the default setting file.
cd /var/www/html/drupal/sites/default
cp -p default.settings.php settings.php
Next, create a files directory.
mkdir files
Next, change the ownership and permissions of the Drupal directory.
chown -R apache:apache /var/www/html/drupal
chmod -R 755 /var/www/html/drupal
Step 5 - Configure Apache for Drupal
Next, create an Apache virtual host configuration file for Drupal.
nano /etc/httpd/conf.d/drupal.conf
Add the following configurations:
ServerAdmin admin@example.com
ServerName drupal.example.com
DocumentRoot /var/www/html/drupal
Allowoverride all
Save and close the file, then restart the Apache service to apply the changes.
Step 6 - Access Drupal Web UI
Now, open your web browser and access the Drupal web installation wizard using the URL http://drupal.example.com. You should see the language selection page:
Select your language and click on the Save and Continue button. You should see the select installation profile page:
Select your installation profile and click on the Save and Continue button. You should see the database configuration page.
Provide your Drupal database username, password, and database name, and click on the Save and Continue button. You should see the Site configuration page.
Provide all required information and click on the Save and Continue button. You should see the Drupal dashboard on the following page.
Conclusion
This post explained how to install Drupal with Apache on Fedora 34. You can now use Drupal to host your own website on the web. Try to host a Drupal website on dedicated server hosting from Atlantic.Net!
### How to Install Gatsby.js Node Framework on Fedora
Gatsby is an open-source framework based on React. It designed for performance, with scalability and security in mind. It helps you to build a fast, secure, and powerful website within minutes. Gatsby uses the most recent web technologies, such as React, GraphQL, and Webpack. This will help developers build blazing-fast websites and apps. It offers 2500+ plugins to create static sites based on sources such as Markdown documents, MDX, images, and numerous Content Management Systems such as WordPress, Drupal, and more.
In this post, we will show you how to install Gatsby.js framework on Fedora.
Step 1 - Install Node.js and NPM
First, install the required dependencies using the following command.
dnf update -y
dnf install -y gcc-c++ make
Gatsby requires Node.js version 18.0.0 or greater to be installed on your server. By default, Node.js latest version is not included in the Fedora repo, so you will need to install Node.js via NVM.
First, run the following script to install NVM.
curl https://raw.githubusercontent.com/creationix/nvm/master/install.sh | bash
Next, run the following command to load the environment variable.
source ~/.bashrc
Next, install Node.js with the following command.
nvm install v18.0.0
Output:
Downloading and installing node v18.0.0...
Downloading https://nodejs.org/dist/v18.0.0/node-v18.0.0-linux-x64.tar.xz...
################################################################################################################################################################# 100.0%
Computing checksum with sha256sum
Checksums matched!
Now using node v18.0.0 (npm v8.6.0)
Creating default alias: default -> v18.0.0
Next, verify the Node.js version with the following command.
node --version
Output:
v18.0.0
Step 2 - Install Gatsby CLI
Gatsby offers a command line tool to create a website easily via command line. You can install it with the NPM command.
npm -g install gatsby-cli
After successful installation, verify the Gatsby version with the following command.
gatsby --version
Output:
Gatsby CLI version: 5.10.0
Step 3 - Create a Website with Gatsby
First, install the Git package with the following command.
dnf install git
Next, create a new website using the following command.
gatsby new
You will be asked several questions to create a website. Once the website is created, you will see the following output.
create-gatsby version 3.10.0
Welcome to Gatsby!
This command will generate a new Gatsby site for you in /root with the setup you select. Let's answer some questions:
What would you like to call your site?
✔ · My Gatsby Site
What would you like to name the folder where your site will be created?
✔ root/ my-gatsby-site
✔ Will you be using JavaScript or TypeScript?
· JavaScript
✔ Will you be using a CMS?
· No (or I'll add it later)
✔ Would you like to install a styling system?
· No (or I'll add it later)
✔ Would you like to install additional features with other plugins?
Thanks! Here's what we'll now do:
🛠 Create a new Gatsby site in the folder my-gatsby-site
🔌 Install gatsby-transformer-remark
✔ Created site from template
▸ Installing Gatsby...
✔ Created site from template
✔ Installed Gatsby
✔ Installed plugins
✔ Created site in my-gatsby-site
🔌 Setting-up plugins...
info Adding gatsby-transformer-remark
info Adding gatsby-source-filesystem
info Installed gatsby-transformer-remark in gatsby-config
success Adding gatsby-transformer-remark to gatsby-config - 0.326s
info Installed gatsby-source-filesystem in gatsby-config
success Adding gatsby-source-filesystem (pages) to gatsby-config - 0.341s
Author identity unknown
*** Please tell me who you are.
Run
git config --global user.email "you@example.com"
git config --global user.name "Your Name"
to set your account's default identity.
Omit --global to set the identity only in this repository.
Initial git commit failed - removing git support
🎉 Your new Gatsby site My Gatsby Site has been successfully created
at /root/my-gatsby-site.
Start by going to the directory with
cd my-gatsby-site
Start the local development server with
npm run develop
See all commands at
https://www.gatsbyjs.com/docs/reference/gatsby-cli/
Step 4 - Run a Gatsby Website
At this point, the Gatsby website is created in the my-gatsby-site directory. Now, it's time to run it.
First, change the directory to the Gatsby website.
cd my-gatsby-site
Next, run the Gatsby website with the following command.
gatsby develop -H your-server-ip
You will see the following output.
⠀
http://69.28.88.130:8000/
⠀
View GraphiQL, an in-browser IDE, to explore your site's data and schema
⠀
http://69.28.88.130:8000/___graphql
⠀
Note that the development build is not optimized.
To create a production build, use gatsby build
⠀
success Building development bundle - 27.035s
success Writing page-data.json and slice-data.json files to public directory - 0.179s - 3/4 22.30/s
Step 5 - Access Gatsby Web UI
At this point, the Gatsby website is created and listens on port 8000.
Now, open your web browser and access the Gatsby website using the URL http://your-server-ip:8000. You should see the following screen.
You can also access the Gatsby graph using the URL http://your-server-ip:8000/___graphql. You should see the following screen.
Step 6 - Create a Systemd Service for Gatsby
At this point, Gatsby is installed and running. However, you will need to run it manually after the system reboot, so you will need to create a systemd service file to manage the Gatsby website via systemctl.
First, create a symbolic link of the Node.js binary using the following command.
ln -s /root/.nvm/versions/node/v18.0.0/bin/node /usr/bin/
Next, create a systemd service file for Gatsby:
nano /etc/systemd/system/gatsby.service
Add the following configuration.
[Unit]
Description=Github webhook
After=network.target
[Service]
Environment=PATH=/root/my-gatsby-site
Type=simple
User=root
ExecStart=/usr/local/bin/gatsby develop -H your-server-ip
Restart=on-failure
[Install]
WantedBy=multi-user.target
Save and close the file, then reload the systemd service to apply the changes.
systemctl daemon-reload
Next, start and enable the Gatsby service.
systemctl start gatsby
systemctl enable gatsby
You can now verify the status of Gatsby with the following command.
systemctl status gatsby
Output:
● gatsby.service
Loaded: loaded (/etc/systemd/system/gatsby.service; disabled; vendor preset: disabled)
Active: active (running) since Tue 2023-06-06 04:42:30 EDT; 14s ago
Main PID: 33717 (node)
Tasks: 27 (limit: 4666)
Memory: 489.5M
CPU: 20.422s
CGroup: /system.slice/gatsby.service
├─33717 node /usr/local/bin/gatsby develop -H 69.28.88.130
├─33728 /root/.nvm/versions/node/v18.0.0/bin/node /root/my-gatsby-site/.cache/tmp-33717-yOMn7pP7ifjY
└─33761 /root/.nvm/versions/node/v18.0.0/bin/node /root/my-gatsby-site/node_modules/gatsby-worker/dist/child.js
Conclusion
Congratulations! You have successfully installed the Gatsby.js framework and created a sample website using the Gatsby.js. You can now build a fast and scalable website easily using the Gatsby framework. Try to install the Gatsby framework on VPS hosting from Atlantic.Net!
### How to Install Vue.JS on Fedora
Vue.js is an open-source, lightweight, and progressive JavaScript framework that offers intuitive API and world-class documentation. It provides an easier way to build user interfaces and single-page applications. It offers a lot of features, such as a range of tools, virtual DOM modeling, adoptable DOM manipulation benefits, and more.
In this post, we will show you how to install the Vue.js framework on Fedora.
Step 1 - Install Nodejs and NPM
First, you will need to install Node.js and NPM on your server. By default, Node.js and NPM are included in the Fedora default repo. You can install both using the following command.
dnf install -y nodejs npm
Once both packages are installed, you can verify the Node version using the following command.
node --version
Output.
v14.19.0
To verify the NPM version, run the following command.
npm --version
Output.
6.14.16
Step 2 - Install Vue CLI
Vue.js provides a CLI tool to create and manage the Vue.js website via the command line. First, install the Vue.js CLI with the NPM command.
npm install -g @vue/cli
After the successful installation, you can verify the Vue.js version with the following command.
vue --version
Output.
@vue/cli 5.0.8
Step 3 - Create a Website Using Vuejs
Let's create a simple website named examplesite with the following command.
vue create examplesite
Once the website is created, you will see the following output.
Vue CLI v5.0.8
✨ Creating project in /root/examplesite.
⚙️ Installing CLI plugins. This might take a while...
> yorkie@2.0.0 install /root/examplesite/node_modules/yorkie
> node bin/install.js
setting up Git hooks
can't find .git directory, skipping Git hooks installation
> core-js@3.30.2 postinstall /root/examplesite/node_modules/core-js
> node -e "try{require('./postinstall')}catch(e){}"
added 862 packages from 463 contributors and audited 863 packages in 119.173s
93 packages are looking for funding
run `npm fund` for details
found 0 vulnerabilities
🚀 Invoking generators...
📦 Installing additional dependencies...
added 100 packages from 63 contributors and audited 963 packages in 17.628s
106 packages are looking for funding
run `npm fund` for details
found 0 vulnerabilities
⚓ Running completion hooks...
📄 Generating README.md...
🎉 Successfully created project examplesite.
👉 Get started with the following commands:
$ cd examplesite
$ npm run serve
Next, navigate to the examplesite directory and run the website using the following command.
cd examplesite
npm run serve
You will get the following output.
DONE Compiled successfully in 11251ms 4:05:29 am
App running at:
- Local: http://localhost:8080/
- Network: unavailable
Note that the development build is not optimized.
To create a production build, run npm run build.
Step 4 - Access Vuejs Website
At this point, Vue.js is installed and running on port 8080. Now, open your web browser and access the Vue.js website using the URL http://your-server-ip:8080. You should see the Vue.js sample test page on the following screen.
Conclusion
In this guide, we explained how to install Vue.js and create a simple website using Vue CLI. You can now use Vue.js. You can now explore the VUe.js features and start building a fast and user-friendly website quickly. Try to install Vue.js on VPS hosting from Atlantic.Net!
### How HIPAA Compliance Impacts Your Reputation as a Healthcare Provider
In the healthcare sector, your reputation is paramount. Patients entrust you with their most personal information, expecting it to remain secure and confidential. Sadly, data breaches and HIPAA violations have become increasingly prevalent in recent years.
This article will explore how maintaining your business to the best possible HIPAA compliance standards is vital in safeguarding your reputation. But before that, let's quickly revisit the essentials of HIPAA and understand its significance.
Safeguarding Sensitive Health Data
HIPAA is an acronym for the Health Insurance Portability and Accountability Act. This federal legislation establishes a binding framework of guidelines to ensure the privacy and security of protected health information (PHI). PHI encompasses an individual's name, address, social security number, or medical records; the provisions under HIPAA solidify its inviolable safeguarding nature.
Adhering to HIPAA regulations is mandatory for healthcare providers across the United States. This legal requirement necessitates safeguarding patient privacy and maintaining the confidentiality of sensitive information. Non-compliance carries substantial repercussions, as elaborated in the following section. It is crucial to emphasize that all healthcare providers, including doctors, dentists, hospitals, insurance companies, and business associates, must abide by HIPAA regulations.
It's important to note that HIPAA compliance is not optional. All healthcare providers, including doctors, dentists, hospitals, insurance companies, and all business associates, must follow HIPAA regulations.
Repercussions of HIPAA Violations
There are strict rules that legally enforce the reporting of all significant HIPAA violations to the United States Department of Health and Human Services ( HHS). All violations are investigated and reported on the HIPAA Wall of Shame.
Let's look at some of the most significant repercussions that may happen in the event of a severe breach of patient confidentiality.
Negative Impact on Patient Trust
HIPAA violations harm patient trust. Patients place immense trust in healthcare providers to ensure the safety and security of their personal information. A breach of this trust can have devastating consequences on the reputation of your healthcare business.
Patients may experience feelings of violation, embarrassment, or anger when their protected health information (PHI) is compromised. Additionally, they may be concerned about potential repercussions, including the risk of fraud and identity theft. It is not uncommon for patients to switch healthcare providers or avoid seeking medical care altogether immediately after a breach.
Rebuilding patient trust after a HIPAA violation is a long and challenging process, but you will likely lose patients forever.
Impact on Healthcare Provider's Reputation
HIPAA violations that affect over 500 patients must be reported to the local or national news. Before too long, your business may be all over the headlines for the wrong reasons.
The reputation of a healthcare provider hinges on their adeptness in safeguarding patient privacy and upholding confidentiality. Patients who feel their sensitive information is unsafe with a particular provider may seek care elsewhere, resulting in the healthcare provider losing patients and revenue.
Moreover, violations lead to negative publicity and potential legal action, further damaging a healthcare provider's reputation. Therefore, it's essential to take HIPAA compliance seriously and to prioritize patient privacy and security.
Legal Consequences of HIPAA Violations
Noncompliance with HIPAA regulations carries legal ramifications, such as fines and potential legal action. The Office for Civil Rights (OCR) enforces HIPAA and can impose substantial penalties on healthcare providers found in violation. These fines vary from $100 to $50,000 per violation, and for repeated offenses, healthcare providers may face a maximum penalty of $1.5 million annually.
In addition to fines, healthcare providers can also face legal action from patients whose PHI has been compromised. Patients can sue for damages, including emotional distress, lost wages, and medical expenses. Legal action can be costly and time-consuming and can further damage a healthcare provider's reputation.
Steps to Ensure HIPAA Compliance
Becoming HIPAA compliant is a significant undertaking requiring a comprehensive HIPAA compliance program that documents the policies and procedures required to protect PHI. In addition, you will need a digital IT infrastructure capable of adhering to HIPAA's physical, technical, and administrative safeguards.
Healthcare providers must undertake regular risk assessments to identify PHI, plus any potential vulnerabilities in their systems and processes. This can help them proactively prevent data breaches and privacy violations. In addition, all employees must be trained, and ongoing monitoring must be done to ensure everyone follows the rules.
The Positive Impact of HIPAA Compliance on Healthcare Providers and Patients
Although achieving HIPAA compliance can present challenges, it brings numerous advantages for both healthcare providers and patients. Healthcare providers who comply with HIPAA regulations experience enhanced patient trust, increased satisfaction, and protection against potential legal and financial ramifications.
For patients, HIPAA compliance ensures the safety and security of their personal information, resulting in greater peace of mind and improved health outcomes. By trusting compliant healthcare providers, patients feel empowered to actively pursue medical care and openly share sensitive information, fostering a robust patient-provider relationship.
Ultimately, HIPAA compliance is a win-win for everyone involved.
Maintaining Your Business Reputation with Atlantic.Net's HIPAA Hosting
If your healthcare organization needs help with managed healthcare hosting. Atlantic.Net is an expert in HIPAA compliance. We will help your business maintain its excellent reputation through HIPAA-compliant hosting.
This is how we do it:
Certified and Audited: Atlantic.Net's state-of-the-art data centers have achieved rigorous certification in SOC 2 and SOC 3, making us compliant with HIPAA regulations. Our unwavering commitment to security and protection extends to critical health data, ePHI, and health records. To reinforce our dedication, we subject our managed services to thorough audits conducted by reputable third-party firms.
Comprehensive Solutions: Our offerings include high-performance Dedicated Servers and Cloud-based environments designed to ensure HIPAA compliance for your websites, databases, and storage. With our 100% uptime Service Level Agreement (SLA), you can trust us to deliver reliable and secure HIPAA-compliant hosting solutions.
Fast and Reliable Hosting: All Atlantic.Net HIPAA hosting servers are backed by SSD storage, ultrafast networking, and Intel's latest hardware. The infrastructure is highly available, and we offer a suite of managed services that relieve the headaches of managing your servers.
HIPAA-Compliant Servers: Servers are available in various Windows and Linux offerings. You can access our 1-click applications that spin up a fully configured server or application in about 30 seconds. Pricing for these HIPAA-compliant dedicated servers is discounted based on term commitment.
Advanced Security Features: Our hosting services come with a range of security features, including a Firewall for HIPAA Compliant Web Hosting, HIPAA-Compliant Encrypted VPN, HIPAA-Compliant Offsite Backups, SSL certificates for HIPAA Compliance, SOC 2 and SOC 3 Certifications, Business Associate Agreement (BAA), Multi-Factor Authentication, Trend Micro Anti-Malware Service, Intrusion Prevention Service, and Network Edge Protection.
HIPAA-Compliant Cloud Hosting and Storage: Our Cloud Hosting and Storage solution undergoes thorough audits and certification to meet the stringent standards of the HIPAA Security Rule, conducted by an independent third party. With a design that prioritizes privacy and implements robust access controls, our service offers a perfect blend of speed, security, and reliability. It excels in securely storing vast datasets, facilitating file transfers, accommodating online storage needs, supporting imaging tasks, and safeguarding highly encrypted health records.
Secure Block Storage (SBS): Atlantic.Net’s user-friendly, highly redundant, easily accessible, and scalable SBS is ideal for a mission-critical HIPAA-compliant application platform requiring robust block storage.
As a healthcare provider, your reputation is everything. HIPAA compliance is essential for protecting patient privacy and maintaining patient trust. Failure to comply can result in severe consequences, including legal and financial penalties, loss of patients, and damage to your reputation.
By taking proactive steps to ensure HIPAA compliance, healthcare providers can protect their patient's privacy and security, as well as their reputations and financial well-being. It's a small price to pay for the peace of mind that comes with knowing you're doing everything possible to protect your patients' sensitive information.
### Best Cloud Automation Solution in 2025
Cloud automation solutions enable IT admins and Cloud engineers to automate manual processes and speed up the delivery of infrastructure resources. The modern way of managing resources automatically using code has produced numerous cloud automation tools, each catering to various use cases and technical abilities.
The best cloud automation solutions for 2025 will offer a comprehensive suite of capabilities that covers the entire lifecycle of cloud resource deployment and management. The best cloud automation solutions will also be deeply integrated with public cloud provider APIs, such as the one provided by Atlantic.Net.
This article will explore the key features and capabilities the best cloud automation solutions must offer to succeed in 2025.
1. Hashicorp Terraform
Terraform is an open-source infrastructure as code tool created by HashiCorp. Terraform can manage practically any cloud resource from any provider, including the Atlantic.Net API. In addition, its cloud-agnostic capabilities allow cloud engineers to develop, manage and delete infrastructure components such as instances, storage volumes, networks, and web applications.
Terraform is hugely popular, free to use, and capable of managing anything that uses an API. There is a steep learning curve to master Terraform, but it empowers users to create complex infrastructure at scale in a controlled and auditable environment.
2. Kubernetes (K8s)
Kubernetes is quickly becoming one of the most popular ways to deploy cloud resources at scale. As a result, many providers are offering Kubernetes-managed services that help to remove the technical complexity of using K8s. A Kubernetes cluster is a logical collection of Kubernetes objects typically made up of nodes with a minimum of 1 worker and a control plane. K8s provides the capability to schedule and run containers across a group of machines, instances, or virtual machines. Clusters can be run locally, in the Cloud, or span both on-premise and offsite, making them highly flexible and dynamic.
3. CloudBolt
CloudBolt is a hybrid cloud management platform designed to make it easy for enterprise users to unify orchestration and accelerate their hybrid cloud strategies. The software is simple, powerful, and includes access to resources through its self-service catalog. In addition, it has over 200 special plug-ins that can easily integrate with existing technologies, including DevOps tools, container orchestrators, infrastructure-as-code tools, and more.
Some of the features of Cloudbolt include self-service IT, hypervisor management, and cost transparency - so users know exactly how much they spend on their technology stack. Other notable benefits of CloudBolt include its extensibility to future as well as legacy technology, support for multiple languages making it easier for global enterprises seeking localization, capabilities across different regions/languages, and continuous infrastructure testing which ensures optimal performance.
4. Cloudify
Cloudify is an open-source toolset and orchestration platform that supports many cloud providers. Its core features allow businesses to deploy, automate, and manage the application platforms; this includes cloud migration capabilities. As a result, Cloudify gives businesses an easy transition to cloud-native, public-cloud, and edge architecture. In addition, it automates their existing infrastructure, enabling them to create and pull new services.
5. Morpheus
The Morpheus data company is a rapidly growing cloud company that provides an extensive range of cloud automation solutions. These include middleware that deploys infrastructure, containers, and Kubernetes clusters, provides self-service provisioning of cloud resources, and a role-based governance toolset to encapsulate the service. Essentially they provide all the components to build your Hybrid-Cloud hosting solution. Licensing is expensive, but the solution is compelling, especially for small and medium-sized managed service providers.
6. Salt Stack
The Salt project is a large-scale, open-source community-supported infrastructure management toolset. It's great for multitasking and was founded on the principle that high-speed communication with large numbers of systems can open up new capabilities. It works similarly to tools like Ansible. What makes Salt stand out is the speed of managing many resources; it's really quick! Perfect if you manage multiple servers, whether Linux, Solaris, AIX, or Windows.
Why Care About Cloud Automation?
There's no escaping from automation - the technology is here to stay. Being productive and efficient in today's multi-platform, agile, and customer-oriented nature is expected. Technology is moving faster than ever, and those with cloud automation skills have a natural advantage. Cloud solutions have changed everything, and there's no reason not to take advantage of them in your business operations.
Ready to Find Out More?
Atlantic.Net is ready to help you integrate the best cloud automation solution into your managed service. Our global data centers stand ready to host your next project. With various certifications, such as SOC 2 and SOC 3, HIPAA, and HITECH, with 24x7x365 support, monitoring, and world-class data center infrastructure, we are here to help you achieve the next level in your VPS hosting journey.
For faster application deployment, free IT architecture design, and assessment, visit us at Atlantic.Net, call 888-618-DATA (3282), or email us at sales@atlantic.net.
### Best Cloud Business Intelligence or Analytics Solution in 2025
With a challenging economic climate and a growing focus on data-driven decision-making, businesses across the globe are turning to cloud technology. Cloud-based solutions can help enterprises to keep up with the demand for real-time insights that cut through conventional boundaries, helping companies make better decisions, grow, and improve efficiency.
Business intelligence (BI) and business analytics (BA) are essential for today's businesses. They allow companies to make better decisions, improve operational efficiency, and compete more effectively. The problem is that BI and BA can be expensive and complex to deploy and use. As a result, many businesses are turning to the cloud to provide these capabilities. This article will look at the top 10 cloud business intelligence or analytics solutions on the market and help you decide which is the best for your business. We'll base our rankings on several factors, including features, ease of use, pricing, customer support, and scalability.
What Are Cloud-Based Business Intelligence and Analytics Solutions?
Business intelligence platforms help businesses store, manage, analyze, and report on their data to gain insights. The best BI or BA platforms are robust, easy to use, offer easy-to-understand interfaces, work with a large variety of data types, and can present complex data formatting.
Top 10 Cloud-Based Business Intelligence and Analytics Solutions
1. Domo
At the top of our list is Domo, a comprehensive cloud analytics software platform that promises to combine your data, business intelligence, and workflows into one cloud-based location. Thanks to its customizable, real-time, and easy-to-use interactive dashboards, unparalleled data integration, and world-class centralized data governance tools, it heads our list.
Domo's BI solutions are tailored to specific industries, for example, retail, healthcare, life sciences, and manufacturing, providing solutions to industry-specific problems. Pricing is based on your company's requirements, but you can take advantage of a free trial to discover if Domo is right for you.
2. Zoho Analytics
Zoho Analytics, previously Zoho Reports, is a modern self-service and cloud-based BI platform established in 2009 that supports millions of users across the globe. Zoho provides a comprehensive suite of reporting tools to allow in-depth data analysis and generate informative and actionable insights.
Zoho users can visually analyze their data and create powerful reports using the simple drag-and-drop interface. The output is a visually attractive and informative report produced via an intuitive online interface.
3. QlikSense
The cloud-based BI platform QlikSense stands ahead of its competitors by offering 'active intelligence' capabilities using real-time, AI-driven, collaborative and actionable analytics. While QlikSense's user interface is optimized for touchscreen, you can use QlikSense at any time, on any device. In addition, its intuitive 'search & conversational analysis' tool provides a quick and easy way to query data and discover actionable insights using natural, conversational language.
4. Tableau
Tableau is a Business Intelligence tool that produces interactive and sharable data visuals and has been around since 2003. It helps users quickly find patterns and insights in data. Notably, Tableau was acquired by Salesforce, the leading CRM platform, in August 2019.
Tableau Cloud allows businesses to make intelligent and informed decisions more quickly. Data security remains a priority for the platform, with Tableau adhering to best-in-class security certification standards like SOC 2 and ISO.
5. Yellowfin
Yellowfin is an integrated analytics platform that can either be deployed on-premise or in the cloud. It is an affordable, elastic, and scalable business intelligence solution designed to help organizations make informed and actionable decisions to engage customers and employees at the right time effectively. Yellowfin successfully combines interactive dashboards with easy-to-use and robust data analysis features.
Yellowfin also offers predictable and scalable pricing, with the option for a free 30-day trial to test out their services.
6. SAS Visual Analytics
SAS Visual Analytics provides a single platform for reporting, data exploration, and analytics. Available on-premise or in the cloud, SAS Visual Analytics allows users to visually identify and recognize patterns and automatically spot outliers and clusters. Core features of SAS Visual Analytics include interactive data discovery, chat-enabled analytics, augmented analytics, and machine learning and natural language capabilities.
SAS Visual Analytics is highly scalable and allows easy and efficient reporting via customizable interactive reports and dashboards.
7. HubSpot
HubSpot is an all-in-one marketing analytics and dashboard software solution that helps businesses analyze the success and performance of their marketing campaigns. HubSpot can filter analytics based on geographic location or specific URLs to provide more meaningful insights. In addition, key website metrics provide you with the necessary information to optimize your company's website.
8. Integrate.io
Integrate.io is a cloud-based big data analytics platform that allows businesses to process, integrate and analyze data within a coding and jargon-free cloud environment. This leading platform offers sales, marketing, customer support, and development solutions. Integrate.io caters to the advertising, hospitality, and retail industries.
Integrate.io operates using a subscription-based pricing structure, and potential clients can benefit from a free 7-day trial.
9. Sisense
Another widely popular end-to-end BI and analytics solution is Sisense, which currently supports over 2,000 global companies, including Rolls-Royce, Phillips Healthcare, and GitLab. Sisense is also recognized as a leading cloud analytics platform by experts like Gartner, G2, and Dresner.
Sisense provides drag-and-drop tools for technical developers and business analysts to process and visualize their data. The platform has a unique "In-Chip technology,” which produces 10–100x better computation, significantly improving computation speed. While some users complain that Sisense has a steep learning curve, their comprehensive product tutorials can help with this.
10. Microsoft Power BI
Falling within the central Microsoft ecosystem, Power BI is an all-encompassing toolkit designed for business insights; it allows users to generate results using interactive dashboards. As downloadable software, users can opt to run Power BI either locally or in the cloud. Power BI's stand-out features include integration and connectivity with many sources, powerful and intuitive data visualization, easy-to-use functionality, intuitive and informative reports, and mobile compatibility.
Microsoft Power BI offers end-to-end encryption, real-time access monitoring, built-in AI capabilities, and Excel interoperability. Clients can take advantage of a generous 60-day free trial. A fully functional free version of the software is available for a single user, after which the pricing is tiered.
How Can Atlantic.Net Help?
Are you looking for a leading hosting provider to host your cloud-based Business Intelligence and Analytics solution?
Since Atlantic.Net was established in 1994, it has become one of the most experienced and successful providers of dedicated and VPS hosting services in the US. The Atlantic.Net Cloud Platform can support all the BI and analytics solutions discussed here, and we will be happy to discuss your company's individual data analysis needs. In addition, our sales personnel are available to answer your questions and advise on the right solutions for your businesses, financial services, or organization.
Atlantic.Net also fully understands its customers' compliance needs, with certifications including SOC 2, SOC 3, HIPAA, and HITECH, and we can help to achieve faster compliance, deployment, and assessment. Atlantic.Net also provides 24x7x365 monitoring, support, and world-class data center services.
You can find out more details by contacting our sales team today.
### How to Install WordPress on Fedora
WordPress is the most popular content management system in the world. This open-source CMS offers a simple, easy-to-use web interface where users can create and manage blogs and websites. WordPress is written in PHP and uses MariaDB as a database backend. It helps beginners create a website and blog without coding knowledge. WordPress is gaining popularity due to its simplicity, flexibility, extendability, customizable and large community.
This post will show you how to install WordPress with Apache on Fedora 34.
Step 1 - Install Apache and PHP
First, install the Apache server with the following command.
dnf update -y
dnf install httpd -y
Once installed, verify the Apache version using the following command.
httpd -v
You will get the Apache version in the following output.
Server version: Apache/2.4.53 (Fedora)
Server built: Mar 17 2022 00:00:00
Next, start and enable the Apache service with the following command.
systemctl start httpd
systemctl enable httpd
Next, install PHP with other required extensions using the following command.
dnf install php php-fpm php-mysqlnd php-opcache php-gd php-xml php-mbstring php-curl php-pecl-imagick php-pecl-zip libzip -y
Next, edit the PHP configuration file and change the default settings suitable to your needs:
nano /etc/php.ini
Change the following settings:
max_execution_time = 300
max_input_time = 300
memory_limit = 512M
post_max_size = 256M
upload_max_filesize = 256M
Save and close the file, then start and enable the PHP-FPM service with the following command.
systemctl start php-fpm
systemctl enable php-fpm
Step 2 - Install and Configure MariaDB Database
First, install the MariaDB server with the following command.
dnf install mariadb-server -y
Next, start the MariaDB service and enable it to start at system reboot.
systemctl start mariadb
systemctl enable mariadb
Next, log in to the MariaDB shell with the following command.
mysql
Once you are connected to MariaDB, create a database and user for WordPress:
MariaDB [(none)]> CREATE DATABASE wpdb;
MariaDB [(none)]> GRANT ALL PRIVILEGES ON wpdb.* TO 'wpuser'@'localhost' IDENTIFIED BY 'password';
Next, flush the privileges and exit from the MariaDB shell with the following command.
MariaDB [(none)]> FLUSH PRIVILEGES;
MariaDB [(none)]> EXIT;
Step 3 - Download WordPress
First, navigate to the Apache web root directory and download the latest version of WordPress with the following command.
cd /var/www/html/
wget https://www.wordpress.org/latest.tar.gz
Next, extract the downloaded file using the tar command.
tar -xvf latest.tar.gz
Next, rename the default WordPress configuration file.
cd wordpress
cp wp-config-sample.php wp-config.php
Next, edit the WordPress configuration file:
nano wp-config.php
Define your database settings as shown below:
/** The name of the database for WordPress */
define( 'DB_NAME', 'wpdb' );
/** Database username */
define ('DB_USER', 'wpuser');
/** Database password */
define( 'DB_PASSWORD', 'password' );
/** Database hostname */
define( 'DB_HOST', 'localhost' );
Save and close the file, then change the permission and ownership of the WordPress directory.
chown -R apache:apache /var/www/html/wordpress
chmod -R 755 /var/www/html/wordpress
Step 4 - Create an Apache Virtual Host for WordPress
Next, you will need to create an Apache virtual host to define your WordPress directory and domain.
nano /etc/httpd/conf.d/wp.conf
Add the following configurations:
ServerAdmin admin@example.com
ServerName wp.example.com
DocumentRoot /var/www/html/wordpress
Allowoverride all
Save and close the file, then restart the Apache service to apply the changes.
systemctl restart httpd
Step 5 - Perform WordPress Web-based Installation
Now, open your web browser and access the WordPress installation wizard using the URL http://wp.example.com. You should see the following screen:
Provide your WordPress site name, admin username, and password, and click the Install button. You should see the following screen.
Click on the Login button. You should see the WordPress administrative login page:
Provide your admin username and password and click on the Login button. You should see the WordPress dashboard on the following screen.
Conclusion
This post showed you how to install WordPress with Apache on Fedora 34. You can now explore WordPress and start creating your own website from the WordPress dashboard. You can also try to deploy WordPress on dedicated server hosting from Atlantic.Net!
### How to Install Prometheus Server on Fedora
Prometheus is a free, open-source software solution that provides monitoring and alerting functionality for cloud-native environments. It gathers metrics from different target sources, organizes them, displays the results, and can trigger alerts when specified conditions are matched. It is designed for monitoring, recording, and processing any purely numeric time series in the Kubernetes environment. If you are looking for an open-source and web-based monitoring solution, then Prometheus is your best option.
This post will show you how to install the Prometheus server on Fedora.
Step 1 - Install Prometheus
First, install some required dependencies using the following command.
dnf install curl wget nano
Next, visit the Prometheus official website and download the latest version of Prometheus using the following command.
wget https://github.com/prometheus/prometheus/releases/download/v2.44.0/prometheus-2.44.0.linux-amd64.tar.gz
Once the download is completed, extract the downloaded file with the following command.
tar -xvf prometheus-2.44.0.linux-amd64.tar.gz
Next, rename the extracted directory using the following command.
mv prometheus-2.44.0.linux-amd64 prometheus-files
Step 2 - Configure Prometheus
First, create a dedicated user to run Prometheus.
useradd --no-create-home --shell /bin/false prometheus
Next, create the required directories for Prometheus.
mkdir /etc/prometheus
mkdir /var/lib/prometheus
Next, change the ownership of the Prometheus directory.
chown prometheus:prometheus /etc/prometheus
chown prometheus:prometheus /var/lib/prometheus
Next, copy Prometheus tools to the system location.
cp prometheus-files/prometheus /usr/local/bin/
cp prometheus-files/promtool /usr/local/bin/
Then, change the ownership of the Prometheus tools binary.
chown prometheus:prometheus /usr/local/bin/prometheus
chown prometheus:prometheus /usr/local/bin/promtool
Next, copy other required configuration files to the Prometheus directory and change their ownership.
cp -r prometheus-files/consoles /etc/prometheus
cp -r prometheus-files/console_libraries /etc/prometheus
chown -R prometheus:prometheus /etc/prometheus/consoles
chown -R prometheus:prometheus /etc/prometheus/console_libraries
Next, create a Prometheus configuration file using the following command.
nano /etc/prometheus/prometheus.yml
Add the following configuration.
global:
scrape_interval: 10s
scrape_configs:
- job_name: 'prometheus'
scrape_interval: 5s
static_configs:
- targets: ['localhost:9090']
Save and close the file, then change the file ownership.
chown prometheus:prometheus /etc/prometheus/prometheus.yml
Step 3 - Create a Systemd Service File
Creating a systemd service file to manage the Prometheus service is a good idea. You can make it using the following command.
nano /etc/systemd/system/prometheus.service
Add the following lines.
[Unit]
Description=Prometheus
Wants=network-online.target
After=network-online.target
[Service]
User=prometheus
Group=prometheus
Type=simple
ExecStart=/usr/local/bin/prometheus \
--config.file /etc/prometheus/prometheus.yml \
--storage.tsdb.path /var/lib/prometheus/ \
--web.console.templates=/etc/prometheus/consoles \
--web.console.libraries=/etc/prometheus/console_libraries
[Install]
WantedBy=multi-user.target
Save and close the file, then reload the systemd daemon to apply the configuration changes.
systemctl daemon-reload
Next, restart the Prometheus service.
systemctl start prometheus
You can now verify the Prometheus active status using the following command.
systemctl status prometheus
Output:
● prometheus.service - Prometheus
Loaded: loaded (/etc/systemd/system/prometheus.service; disabled; vendor preset: disabled)
Active: active (running) since Tue 2023-06-06 03:33:07 EDT; 4s ago
Main PID: 28510 (prometheus)
Tasks: 7 (limit: 4666)
Memory: 67.7M
CPU: 497ms
CGroup: /system.slice/prometheus.service
└─28510 /usr/local/bin/prometheus --config.file /etc/prometheus/prometheus.yml --storage.tsdb.path /var/lib/prometheus/ --web.console.templates=/etc/prome>
Jun 06 03:33:07 fedora prometheus[28510]: ts=2023-06-06T07:33:07.985Z caller=head.go:669 level=info component=tsdb msg="On-disk memory mappable chunks replay completed>
Jun 06 03:33:07 fedora prometheus[28510]: ts=2023-06-06T07:33:07.985Z caller=head.go:677 level=info component=tsdb msg="Replaying WAL, this may take a while"
Jun 06 03:33:07 fedora prometheus[28510]: ts=2023-06-06T07:33:07.985Z caller=head.go:748 level=info component=tsdb msg="WAL segment loaded" segment=0 maxSegment=0
Jun 06 03:33:07 fedora prometheus[28510]: ts=2023-06-06T07:33:07.985Z caller=head.go:785 level=info component=tsdb msg="WAL replay completed" checkpoint_replay_duratio>
Jun 06 03:33:07 fedora prometheus[28510]: ts=2023-06-06T07:33:07.988Z caller=main.go:1037 level=info fs_type=XFS_SUPER_MAGIC
Jun 06 03:33:07 fedora prometheus[28510]: ts=2023-06-06T07:33:07.988Z caller=main.go:1040 level=info msg="TSDB started"
Jun 06 03:33:07 fedora prometheus[28510]: ts=2023-06-06T07:33:07.988Z caller=main.go:1220 level=info msg="Loading configuration file" filename=/etc/prometheus/promethe>
Jun 06 03:33:08 fedora prometheus[28510]: ts=2023-06-06T07:33:08.028Z caller=main.go:1257 level=info msg="Completed loading of configuration file" filename=/etc/promet>
Jun 06 03:33:08 fedora prometheus[28510]: ts=2023-06-06T07:33:08.028Z caller=main.go:1001 level=info msg="Server is ready to receive web requests."
Jun 06 03:33:08 fedora prometheus[28510]: ts=2023-06-06T07:33:08.028Z caller=manager.go:995 level=info component="rule manager" msg="Starting rule manager..."
Step 4 - Access Prometheus Web UI
At this point, Prometheus is installed and listening on port 9090. Now, open your web browser and access the Prometheus dashboard using the URL
http://prometheus-server-ip:9090/graph. You should see the Prometheus dashboard on the following screen.
Conclusion
In this post, we learned how to install the Prometheus monitoring solution on Fedora. You can now explore Prometheus and start monitoring your cloud-native applications using Prometheus. Try to install and deploy Prometheus monitoring on VPS hosting from Atlantic.Net!
### How to Install phpMyAdmin on Fedora
phpMyAdmin is an open-source tool used to manage databases via the web interface. It is written in PHP and was built to handle the administration of MySQL over the Internet. Creating and managing a database manually is very difficult for any beginner user. In that case, phpMyAdmin helps users to create and manage databases and execute database queries via a GUI interface.
This tutorial will show you how to install phpMyAdmin on Fedora 34.
Step 1 - Install the LAMP Server
First, install the Apache and MariaDB server with the following command.
dnf install httpd mariadb-server -y
Once both packages are installed, start and enable the MariaDB service with the following command.
systemctl start httpd mariadb
systemctl enable httpd mariadb
Next, install the PHP Remi repository with the following command.
dnf install -y http://rpms.remirepo.net/fedora/remi-release-34.rpm
Next, enable the PHP Remi repo with the following command.
dnf module enable -y php:remi-8.1
Then, install PHP with other required extensions using the following command.
dnf install php php-fpm php-mysqlnd php-opcache php-gd php-xml php-mbstring php-curl php-pecl-imagick
Step 2 - Secure the MariaDB Installation
Next, you must set the MariaDB root password and secure the installation. You can do it with the following command.
mysql_secure_installation
Answer all the questions as shown below:
Change the root password? [Y/n] Y
New password:
Re-enter new password:
Remove anonymous users? [Y/n] Y
Disallow root login remotely? [Y/n] Y
Remove test database and access to it? [Y/n] Y
Reload privilege tables now? [Y/n] Y
Step 3 - Install phpMyAdmin
By default, the phpMyAdmin package is not included in the Fedora 34 default repo, so you will need to install it from the Remi repo. Run the following command to install the phpMyAdmin to your server.
dnf --enablerepo=remi,remi-test install phpMyAdmin
Once the phpMyAdmin is installed, you can verify the phpMYAdmin package information with the following command.
rpm -qi phpMyAdmin
You will get the following output.
Name : phpMyAdmin
Version : 5.2.0
Release : 1.fc34.remi
Architecture: noarch
Install Date: Thursday 13 April 2023 11:52:18 PM
Group : Unspecified
Size : 46210128
License : GPLv2+ and MIT and BSD and LGPLv3 and MPLv2.0
Signature : RSA/SHA256, Thursday 12 May 2022 01:30:06 AM, Key ID b19527f1478f8947
Source RPM : phpMyAdmin-5.2.0-1.fc34.remi.src.rpm
Build Date : Thursday 12 May 2022 01:27:46 AM
Build Host : builder.remirepo.net
Packager : Remi Collet
Vendor : Remi's RPM repository
URL : https://www.phpmyadmin.net/
Bug URL : https://forum.remirepo.net/
Summary : A web interface for MySQL and MariaDB
Description :
phpMyAdmin is a tool written in PHP intended to handle the administration of
MySQL over the Web. Currently it can create and drop databases,
create/drop/alter tables, delete/edit/add fields, execute any SQL statement,
manage keys on fields, manage privileges,export data into various formats and
is available in 50 languages
Step 4 - Configure Apache for phpMyAdmin
By default, phpMYAdmin is accessible only from the local machine. To access the phpMyAdmin from the remote machine, you will need to edit the phpMYAdmin configuration file and make some changes.
nano /etc/httpd/conf.d/phpMyAdmin.conf
Find the following line:
Require local
And replace it with the following line:
Require all granted
Save and close the file, then restart the Apache service to apply the changes.
systemctl restart httpd
Step 5 - Access phpMyAdmin
Now, open your web browser and access the phpMyAdmin using the URL http://your-server-ip/phpmyadmin. You should see the phpMyAdmin login page.
Type your MariaDB root username and password and click on the Login button. You should see the phpMyAdmin dashboard on the following screen.
Conclusion
In this tutorial, we explained how to install phpMyAdmin with Apache on Fedora 34. You can now create and manage the MariaDB database via the phpMyAdmin dashboard. Try to deploy phpMyAdmin on dedicated server hosting from Atlantic.Net!
### Unleashing the Power of AI: Transforming Business Operations Today
Artificial Intelligence (AI) has transitioned from being a mere buzzword to headline news as a powerful tool that's starting to fundamentally reshape the contours of the world. Moreover, the transformative prowess of AI is no longer confined to the realms of science fiction.
It is an absolute force driving efficiency and innovation in today's business landscape—AI introduces vast and varied capabilities, from automating tedious tasks to refining intricate business processes.
This article will serve as a comprehensive guide, shedding light on the diverse applications of AI in the business world. We will explore how AI automates routine tasks, enhances processes, and revolutionizes customer service. We'll explore real-world examples of AI implementation, demonstrating its potential to drive productivity and innovation.
AI at Work: Real-World Success Stories and Innovations
Artificial Intelligence (AI) is being utilized innovatively to solve everyday business problems. Here are some real-world examples of industries thriving with AI.
Manufacturing and Robotics: AI is helping to automate tasks in the global manufacturing industry. For example, Miso Robotics has developed Flippy 2, an AI-equipped robot that helps automate kitchen tasks like frying food. Similarly, iRobot has created Roomba, an intelligent vacuum that uses AI to scan room sizes, identify obstacles, and remember the most efficient routes for cleaning your house.
Intelligent Assistants: AI is the backbone of the smart assistant, integrated into phones, cars, and home devices. Siri, Alexa, Cortana, and Bixby are household names that work by using natural language processing, machine learning, and cloud computing to respond to user requests.
Healthcare Management: Artificial Intelligence plays a significant role in healthcare by diagnosing and managing diseases, predicting patient outcomes, and analyzing medical images. For instance, the Renal Research Institute utilizes deep learning, a subset of AI, to evaluate a patient's arterio-venous vascular access (a type of blood vessel access for dialysis) using images taken from smartphones or tablets.
Financial Services: AI powers the financial industry, especially automated investing. You may have heard of robo-advisors, AI routines that use algorithms to manage and optimize a person's investment portfolio.
Travel and Hospitality: AI is already extensively used by virtual travel booking agents. Companies like Expedia and Booking.com use AI to provide personalized travel recommendations based on users' known behaviors and preferences.
Eliminating the Mundane: AI's Role in Automating Repetitive Tasks
Using AI to automate repetitive tasks is already hugely popular, freeing time for employees to focus on creative endeavors. AI-driven software already manages data entry and invoice processing automation, minimizing errors and saving time. Its ability to learn from data and improve accuracy boosts business productivity and efficiency.
AI enhances robotics and automation in manufacturing by enabling machine learning algorithms to learn and adapt. This adaptability empowers robots to handle complex tasks and make informed decisions, revolutionizing manufacturing.
AI is also transforming customer service. For example, AI-powered chatbots are increasingly prevalent, providing round-the-clock support and efficiently handling basic inquiries on websites and social media platforms. This automation enables businesses to offer faster and more efficient customer service 24/7.
Revitalizing Customer Engagement: The Emergence of AI Chatbots
Chatbots are revolutionizing not only customer service but also making a significant impact on marketing and sales. AI can actively guide customers toward products of interest and provide personalized recommendations. Moreover, chatbots actively gather valuable customer feedback and data, contributing to improving products and services.
AI drives Natural Language Processing (NLP) advancements, empowering computers to understand and interpret human language. NLP enables businesses to analyze customer feedback, social media posts, and reviews, extracting insights into customer behavior and preferences.
Amplify Sales and Marketing with Predictive Analytics
Predictive analytics uses data, statistical algorithms, and machine learning to predict future outcomes based on historical data. For example, predictive analytics can identify potential customers, forecast sales, and optimize marketing campaigns in sales and marketing. This powerful tool enables businesses to make data-driven decisions, increasing their likelihood of success.
The retail industry is heavily influenced by customer behavior. For the leading online retailers, AI is driving sales, creating reliable predictive habits to push other sales while building an accurate data profile of their customers.
Smarter Supply Chains
Supply chain management is a complex process with many moving parts. AI-powered solutions can streamline this process, optimizing inventory management by predicting demand and adjusting stock levels accordingly. AI can also identify bottlenecks in the supply chain and suggest solutions, ensuring smooth operations.
Reimagining HR: Streamlining Processes with Innovative AI-based Tools
HR is vital to any business operation, but it can be resource-intensive. AI-based tools can streamline HR processes, assisting with resume screening and onboarding tasks and any bulk tasks such as updating all employee tax codes. AI can also help businesses identify potential issues before they escalate, such as high-risk employees considering leaving the company.
For instance, IBM's AI tool, Watson, can analyze employees' feedback and sentiments, helping identify high-risk staff, reducing the burden on HR teams, and making the HR processes more efficient and effective.
Enhancing Cybersecurity through Machine Learning
With the rise in cyber-attacks, cybersecurity is a growing concern for businesses. AI-powered solutions can help companies to protect their networks and data. For example, machine learning algorithms can analyze network traffic and identify potential threats, keeping businesses ahead of cybercriminals.
Machine learning can predict future attack patterns based on past data, allowing businesses to proactively defend themselves against cyber threats.
Leveraging AI for Financial Foresight
Financial planning and analysis are crucial but can be complex and time-consuming. AI-powered solutions can streamline these processes, providing deeper insights into economic trends and enabling more accurate forecasting. AI can also identify potential risks and opportunities, equipping businesses with the information they need to make informed decisions.
Utilizing Natural Language Processing to Enhance Business Communication
Natural Language Processing (NLP) is revolutionizing customer interactions and business operations. For example, NLP can extract insights from unstructured data like emails or customer feedback, assist with compliance by analyzing legal documents, and identify potential risks. NLP also impacts research and development, helping businesses identify breakthroughs and patent opportunities.
AI is reshaping business operations across industries, offering increased efficiency, insights, and cost savings. By leveraging AI-powered solutions, businesses can unlock their full potential and achieve unprecedented success.
Revolutionize your business with Atlantic.Net's AI-ready cloud platform! Seamlessly integrate, scale, and secure your AI applications. Experience high performance and expert support. Embrace the future of AI today.
Related Guides:
HIPAA Compliant Hosting Solutions
PCI-Compliant Hosting Solutions
What Are Managed Services?
Related Products:
Atlantic.Net Dedicated Server Hosting
Atlantic.Net HIPAA Compliant Hosting
Atlantic.Net GPU Hosting
### What is the Future of AI, ChatGPT, and Bard?
The rise of artificial intelligence (AI) is transforming the world as we know it. AI technology has revolutionized various industries, from self-driving cars to intelligent virtual assistants.
In this article, we will explore the future of AI, the Generative Pretraining Transformer (better known as ChatGPT), and Bard, discussing their potential applications, integration with human creativity, and the ethical challenges they pose.
Navigating the AI Controversy
If you have been watching the news in the last six months, you will know there has been a lot of noise surrounding AI. Many countries have banned AI tools like ChatGPT, including Italy and China, and business leaders have called for AI development to be paused for six months to be ethically reviewed and discussed in Congress.
Despite all the uproar, AI tools like ChatGPT and Bard are hugely popular. As of April 2023, ChatGPT has approximately 173 million monthly users. In comparison, Google Bard, released in March 2023, has around 30 million monthly visits.
Advancements in AI and Machine Learning
AI and machine learning have come a long way since their inception. Recently, AI has become more sophisticated and capable of performing complex tasks and has found its way into various industries, including finance, healthcare, and education. One of the most significant advancements in AI and machine learning has been the development of chat GPT.
Impact of ChatGPT
GPT-4.0 is the latest version of chat GPT from OpenAI for paid users. Free users must stick with version 3.5. However, both are extremely capable of natural language generation and understanding. In addition, GPT can generate human-like text, making it useful for content creation, writing, and translation.
With GPT-4, businesses can generate content quickly and easily, freeing time for other tasks. However, it can generate biased or offensive content, and there are significant concerns about its impact on the job market. Despite these challenges, GPT-3.5 and 4.0 have significant potential in various industries, including journalism, marketing, and education.
Bard - A New Tool for Creative Writing and Storytelling
Bard is an AI-based tool for creative writing and storytelling. However, Bard lacks emotional intelligence and creativity. Therefore, writers must balance automation and human ingenuity.
Integration of AI and Human Creativity
AI has yet to be ready to replace humans; many users see it as a valuable tool to enhance creativity. However, as AI technology advances, there is a growing interest in integrating it into everyday life.
Although AI can provide writers, artists, and musicians with valuable tools, it can only partially replace human creativity. Therefore, there is a need to balance automation and human ingenuity to produce the best results.
Additionally, the integration of AI and human creativity raises ethical concerns surrounding the ownership of creative works generated by AI tools and how AI impacts the job market. Therefore, it is essential to consider the ethical implications of AI and human creativity integration.
Challenges in AI Ethics and Responsibility
The rise of AI has presented significant ethical challenges, and there are concerns about the misuse of AI. For example, using facial recognition technology for surveillance can perpetuate biases and discrimination. Furthermore, as the technology is still very new, there is a need to develop responsible AI practices.
Here are some of the ethical concerns surrounding the future of AI:
Bias in AI: AI models are trained on large datasets, sometimes including biased data. This can lead to discriminatory outcomes, like an AI system that differentiates based on race, gender, or other factors. Avoiding bias in AI is a significant challenge that requires careful dataset curation and model testing.
Transparency and explainability: AI models, particularly deep learning models, are often called "black boxes" because it can be challenging to understand how they make decisions. However, this lack of transparency can be problematic when understanding why an AI system made a particular decision.
Data privacy: AI systems often need large amounts of data to train and operate effectively. This can raise privacy concerns, particularly when sensitive personal data is involved. Ensuring that AI systems respect privacy and comply with data protection regulations is a significant challenge.
Accountability: If an AI system makes a mistake or causes harm, it can be challenging to determine who is responsible. Is it the creators of the AI, the users, or the people who provided the data? This issue of accountability is a crucial ethical question.
Fairness and equity: Ensuring that AI systems are fair and don't disproportionately harm or benefit specific groups of people is a critical ethical challenge. This ties in with the issue of bias but also includes questions about access to AI technology and the impacts of AI on employment and economic inequality.
Autonomy: As AI systems become more capable, there are concerns about the potential for AI to infringe on human freedom. This can be persuasive AI technologies that influence human behavior or more speculative concerns about superintelligent AI systems that act beyond human control.
The moral and legal status of AI: As AI systems become more advanced, questions arise about their moral and legal status. Should sophisticated AI systems be granted some form of legal personhood or rights? This is a contentious issue and a challenging area of AI ethics.
Future of AI in Education and Healthcare
Two industries that benefit substantially from AI implementation are education and healthcare. AI can personalize learning, provide feedback, and assess student progress in education. In addition, AI can be used in healthcare for disease diagnosis, treatment recommendations, and drug development.
Emerging Trends in AI
AI integration propels the advancement of emerging trends, with one notable focus being on intelligent robotics. These robots can undertake intricate and hazardous tasks while engaging with humans.
In the realm of customer support, businesses leverage AI chatbots to offer round-the-clock assistance, addressing customer inquiries, resolving complaints, and aiding in troubleshooting. Furthermore, content creators benefit from AI-powered tools that automate content generation for blogs, social media, and various other platforms.
Businesses are seamlessly incorporating AI models to streamline tasks like scheduling and email management. A prime example of this integration can be observed in Microsoft's Office products, where AI technology is used to summarize your upcoming week as well as visualize previous working weeks.
The influence of AI extends to the realm of video games as well, where it plays a crucial role in generating dynamic dialogues and narratives. Additionally, AI infuses non-player characters with lifelike personalities and creates procedural content, including generic landscapes and awe-inspiring vistas.
Conclusion
AI, ChatGPT, and Bard have significant potential to transform various industries. Therefore, it is essential to consider the ethical implications of AI and develop responsible practices. Furthermore, as AI technology advances, finding the balance between automation and human creativity is crucial to produce the best results.
### What Are IT Managed Services?
Managed services are IT solutions a third-party organization delivers to a customer, ranging from network and system monitoring to security management, data backup, and disaster recovery.
In today's digital age, businesses rely on technology more than ever. From managing customer data to facilitating seamless communication and collaboration, technology plays a vital role in the success of modern organizations.
However, managing IT services has become increasingly complex and time-consuming as technology evolves. Previously, companies often developed an in-house IT team to handle all technology needs. But with the rapid pace of cloud computing and technological advancements, plus the associated costs, this approach is no longer practical or cost-effective for many businesses.
Fortunately, managed IT services offer an answer to these challenges.
Managed Services Providers
With a managed service provider (MSP), businesses can offload the administrative headache of managing their IT infrastructure to experts in the field. This allows them to focus on their core business operations and helps to guarantee their own IT service providers' needs are offloaded to experienced professionals.
In this post, we will explore the benefits of client costs when using managed IT services and the various available services. We will also discuss the factors businesses must consider when choosing an MSP to ensure they find the right partner to meet their unique needs.
Whether you're a small business owner looking to offload your IT responsibilities or a larger organization needing comprehensive IT support, managed IT services can provide the solutions you need to stay competitive in today's digital workplace.
Types of Managed IT Services
Managed IT services come in many different flavors. Here are some of the most common types of managed services:
Managed Networking
Managed network services are outsourced IT services that involve remote monitoring, managing, and maintaining a company network infrastructure. This typically includes installing, configuring, and maintaining network hardware and software components such as routers, switches, firewalls, servers, and storage devices.
By using managed network services, companies can leverage the expertise and resources of a third-party service provider to ensure their network is operating efficiently and securely. This, under vendor management, can help reduce costs, increase network performance, help guarantee the availability of network connections and improve overall productivity.
Managed IT services can also include proactive maintenance and support to prevent network issues from occurring, reducing downtime and minimizing the impact of any issues that do occur. Overall, managed network services can be an effective way for companies to improve their network infrastructure while focusing on their core business objectives.
Server Monitoring
Your server infrastructure is the lifeblood of your business, be it virtual private servers, dedicated servers, or even physical tin. Network and system monitoring involves scrutinizing your company's IT infrastructure to detect and troubleshoot issues before they become significant problems.
Standard monitoring metrics include server performance (CPU, Disk, and Memory), network traffic and availability, SNMP traps, infrastructure alerts, and automating security threats.
For example, if a server goes down, your MSP will be alerted immediately and can work to resolve the issue before it even impacts your business; when your managed IT company is contracted to monitor systems proactively, they often resolve the problem before you even knew you had one.
Persistent issues may require hardware maintenance; your MSP can arrange for an engineer to resolve more complicated issues within a service-level agreement.
Managed Security platform
Security management protects your company's sensitive information from various cybersecurity threats. This includes firewall management, antivirus and antispyware protection, and intrusion detection.
With cyber-attacks on your private networks rising, having a dedicated team of IT professionals to manage your cyber security is becoming increasingly important.
Data Backup and Disaster Recovery
Data backup and disaster recovery involve creating backups of your company's critical data and planning to recover that data quickly in the event of a disaster. Businesses should follow the 3-2-1 rule of backups which involves creating three copies of your data, storing them on two different types of media, and keeping one copy offsite.
Whether a natural disaster like a hurricane or a cyber attack such as ransomware, having a solid disaster recovery plan in place can mean the difference between quickly getting back to business as usual and being out of commission for days or weeks.
The Managed Service Provider Strategic Advantage: Why Your Business Should Consider IT Managed Services
Now that we have a grasp on the different types of managed IT services let's explore the benefits of utilizing managed IT services:
Reduced IT Spending
Outsourcing your IT systems to managed services providers can lead to significant cost savings in the real world. By entrusting your technology needs to a team of experts, you can reduce the time and resources required to manage your IT infrastructure in-house. Here are some of the specific ways that outsourcing to a managed services provider can save you money:
Reduced Labor Costs:
By outsourcing your IT systems to a managed services provider, you can avoid the need to hire and train a full-time IT staff. This can save your business significant money on salaries, benefits, and other overhead costs.
Scalable Costs:
Managed services and managed service providers typically offer a range of pricing plans based on your specific needs, allowing you to scale up or down as your business requirements change. This can help you avoid the cost of investing in additional hardware, software, or personnel that may be necessary to manage your IT infrastructure as a service only.
Improved Efficiency:
IT support companies can help optimize your IT systems for maximum efficiency, reducing the likelihood of downtime, errors, and other issues that can cost your business time and money. Additionally, a team of experts can often identify and resolve IT issues more quickly than an in-house team, reducing the time and cost required to resolve problems.
Access to Advanced Technology:
A managed cloud services provider can often provide access to advanced business technology services that may be too expensive or complex for your business to manage independently. This can help your business stay competitive by leveraging cutting-edge cloud technology without the high cost of ownership.
Enhanced Security:
IT outsourcing managed service providers are security experts, helping to protect your IT systems from cyber threats that can be costly to recover from. By outsourcing your IT security needs to a managed services and security provider, you can avoid the costs associated with data breaches, system downtime, and other security challenges.
Dependable Service
Managed IT services offer a valuable benefit in the form of dependable support. With a team of skilled professionals on hand 24/7, MSPs can promptly resolve any IT-related issues, keeping your operations running smoothly and minimizing disruptions.
Leverage Expert Knowledge
As we mentioned earlier, MSPs bring a high level of expertise. By outsourcing your IT needs to an MSP, you can tap into that expertise and ensure your company's internal IT team and infrastructure runs smoothly and efficiently.
Growth of Cyber Attacks
Cyber threats are a reality that businesses cannot ignore. The risks are numerous and constantly evolving, from data breaches to ransomware attacks. As such, businesses must proactively safeguard their sensitive information and prevent potential cyber-attacks.
When a business outsources its IT systems to an MSP, it can benefit from various security measures, including firewalls, intrusion detection systems, and antivirus software. MSPs continuously monitor systems to detect and respond to real-time security breaches.
Help Achieving Compliance
Managed IT services can help ensure compliance with hosting solutions that meet and exceed GDPR, PCI-DSS, ISO, Hitech, and HIPAA regulatory requirements. In addition, choosing a compliant managed service provider reduces the risk of breaching compliance which can result in financial penalties and legal action.
The best-managed IT services include training and awareness programs to educate employees on best practices for compliance, cybersecurity, and legislation, minimizing human error risk and strengthening most business owners' overall security posture.
Together, these measures help prevent cyber attacks and data loss while improving the overall security of a business's IT systems.
Professional Services
IT service providers typically have in-house teams of seasoned IT professionals available for projects and ad-hoc technical needs, such as system design upgrades or technical expertise.
Whether implementing a new technology solution or upgrading an existing one, an MSP can help ensure a seamless transition and that your company's IT infrastructure runs efficiently.
Experience the Power of Atlantic.Net's IT Managed Service
Are you tired of dealing with unreliable IT systems that hinder your business's growth and productivity? Look no further than Atlantic.Net's IT-managed services provider. Our comprehensive suite of services provides organizations with the scalability, security, and reliability they need to succeed in today's digital landscape.
With Atlantic.Net, you can use various cloud hosting services, including Virtual Private Cloud (VPC), public and private cloud, and hybrid cloud solutions. Our cloud hosting services offer increased scalability, reduced costs, and enhanced uptime, allowing your business to operate efficiently.
Unleash Your Business Potential with IT Managed Services
In addition to cloud hosting, Atlantic.Net offers various managed services to protect your business's critical data and assets. Our Managed Security Services include the following:
firewall management
Our experienced network engineers have designed a logical and robust network service to secure client data and your business. Here's what our Managed Firewall Service includes:
Fully managed firewall stack connected to the Atlantic.Net network
Redundant firewall stack configuration upon request
Proprietary stateful firewall for customized solutions
NETWORK EDGE PROTECTION
Our Managed IT services include additional Edge Services to shield your environment further:
DDoS Protection: Automatically thwart unwanted network requests.
Content Delivery Networks (CDN): to reduce your website's attack surface and speed up global content delivery.
Web Application Firewall (WAF): monitor and filter traffic via the network edge.
Intrusion Prevention System (IPS): Real-time threat monitoring and prevention
vulnerability scanning
As part of the managed cloud services offering, the service checks for vulnerabilities on the client's network and internal IT systems:
Expertise: Scans are conducted by an experienced team of security professionals
Detailed Verbose Reporting: Reports are generated with detailed information on identified vulnerabilities
Scalable: The service is scalable and customizable to meet the specific needs of each client
Identification: The scanning service helps clients identify and address vulnerabilities before they can be exploited
Improved Security Posture: Regular vulnerability scanning can reduce the risk of data breaches and other security incidents
Compliance: vulnerability scanning service helps clients maintain compliance with industry regulations and standards.
Migration Services
Our managed migration services are the ideal solution to get you started. The three critical steps in the migration process are assessment, migration, and optimization.
Three migration packages are available: Standard, Advanced, and Enterprise
Expert Migration: handle the migration process seamlessly and disruption-free
Cost Savings: Increases efficiency and reduces costs
Fast: Gets workloads running in the Atlantic.Net cloud quickly and easily
Managed Backup and Disaster Recovery
Managed Backups: Daily, weekly, or monthly backups are taken automatically and stored offsite in secure Atlantic.Net data centers to your retention requirements.
Disaster Recovery: Atlantic.Net provides disaster recovery services to ensure business continuity in the event of a disaster, with options for managed or self-managed solutions
Replication: Data is replicated in real-time to a secondary location for disaster recovery purposes
RPO and RTO: Recovery Point Objective (RPO) and Recovery Time Objective (RTO) can be tailored to meet specific business needs
Looking for a dedicated cloud environment? Atlantic.Net's Managed Private Cloud services offer dedicated resources, secure connectivity, and a range of management and support services to meet the unique needs of your business. We also offer these platform services:
Managed Database Services
Offers a range of managed database services, including MySQL, PostgreSQL, MariaDB, and MongoDB
Provides highly available and scalable database solutions
Offers database administration, monitoring, backups, and disaster recovery
Optimizes database performance to ensure efficient operations
Managed Hosting Services
Provides fully managed hosting services for websites and applications
Offers a variety of hosting solutions, including cloud hosting, VPS hosting, and dedicated hosting
Provides 24/7 monitoring, support, and management
Ensures high availability, reliability, and security for the hosted environment
Choose Atlantic.Net IT Managed Services
Atlantic.Net is a leading managed service provider offering a comprehensive selection of managed services to global businesses across various sectors. With over three decades of experience, Atlantic.Net has established itself as a dependable managed services provider that offers 24/7 technical support, remote monitoring, and remote application hosting services, among many others.
We specialize in remote support from our specialist in-house teams from our Orlando-based network operations center (NOC). All managed IT services deliver comprehensive service-level agreements to ensure each client receives a dependable service.
Say Goodbye to IT Headaches with Managed Services
Our experts took remote monitoring and managed IT services further by offering various services, such as managed security services, mobile device management, backup services, mobile device management, and cloud computing solutions.
Atlantic.Net managed cloud services model is built around proactively monitoring systems, allowing businesses to focus on their core operations. You can rest easy knowing that your network infrastructure and other computer infrastructure are in safe hands, and you can depend on our U.S based technical support teams whenever needed.
Control your costs with our pay-as-you-go service tier, allowing businesses to pay only for the services they use. This option is attractive for small businesses that still require dependable IT support but also desire to help to avoid extensive overhead costs and the administrative headaches associated with managed services being kept in-house.
As a global market leader with channel partners in various locations, we are constantly looking for new business development opportunities to expand our services and meet the needs of both IT and non-IT businesses. With Atlantic.Net, you can be confident that you receive top-of-the-line services from a dependable service provider.
Managed Services are Essential for Business Continuity and Growth
Are you tired of managing your IT infrastructure and struggling with the latest cybersecurity threats? Look no further than Atlantic.Net!
As a top-tier managed service provider, we offer a comprehensive suite of managed IT and cloud services to help you streamline your operations and keep your business running smoothly.
Our managed services model allows us to provide end-to-end solutions tailored to your unique needs. From cybersecurity services to network monitoring, our service offerings are designed to help you maximize your resources and minimize risk.
Discover the Power of IT Managed Services for Your Organization
We partner with the best application service providers and offer cutting-edge services tools to ensure that your IT services are always up to date.
Our team of experts has the skills and experience to manage your IT infrastructure, so you can focus on growing your business. We offer utility services, internal IT, desk services, managed platform services, and more to meet your IT needs. Plus, we work with third-party organizations and SaaS platforms to ensure that you have access to the latest technology and software.
When you choose Atlantic.Net as your next managed IT services company, you'll benefit from our industry-leading service providers typically provide. In addition, we pride ourselves on our ability to deliver high-quality managed services that help businesses like yours thrive. For example, we use a managed platform to provide reliable and secure cloud services, and our agent software helps us detect and prevent social engineering attacks.
Our centralized platform makes it easy to manage your IT infrastructure from one place, and our team of experts is available 24/7 to provide support whenever needed. We also offer server space on our cloud platform, so you can use the latest technology without investing in your platforms.
Whether you're a small or medium-sized business, we have the expertise to help you succeed. So why wait?
Contact us today to learn more about our managed IT and cloud services, and let us help you take your business to the next level!
### Supply Chain Risk Management: Operational and Compliance Aspects
Understanding Supply Chain Risk Management (SCRM)Supply Chain Risk Management (SCRM) is a methodical process for recognizing, evaluating, and alleviating risks within a supply chain. SCRM aims to reduce disruptions and maintain business continuity by addressing potential vulnerabilities across the entire supply chain lifecycle, from procuring raw materials to delivering finished goods or services. Key elements of SCRM include:Risk identification: Recognizing potential risks that may impact the supply chain through techniques like risk assessments, audits, and supplier evaluations.Risk assessment: Estimating the likelihood and severity of identified risks, considering factors such as probability, operational impact, financial consequences, and potential damage to reputation.Risk mitigation: Creating strategies to lessen or eliminate identified risks by implementing actions like supplier diversification, quality control processes, improved information sharing among supply chain stakeholders, or investing in advanced technologies for real-time data visibility.Risk monitoring and reporting: Constantly tracking risk levels within the supply chain using tools like Key Performance Indicators (KPIs), dashboards, or scorecards, and routinely reporting findings to relevant stakeholders, including senior management.The Significance of SCRMSupply chain risks have multiple causes, including natural disasters, geopolitical events, cyber-attacks, or pandemics like COVID-19. These disruptions can lead to production or delivery delays, resulting in financial losses for businesses:Financial losses: When an organization faces supply chain disruption for any of the reasons as mentioned earlier, it incurs financial losses in the form of inventory costs and revenue loss from delayed deliveries or canceled orders.Damaged reputation: A company's reputation may suffer if it fails to deliver products or services on time due to supply chain issues. This failure can lead customers to seek alternatives elsewhere, negatively impacting sales.Lack of flexibility: Organizations without adequate contingency plans cannot react quickly when confronted with unforeseen situations, such as supplier bankruptcy or sudden demand spikes, resulting in further delays in delivery times.Supply Chain Risk Management: Operational and Compliance AspectsSCRM involves identifying, assessing, and mitigating risks associated with the procurement, production, and distribution of goods and services. It includes operational and compliance aspects, essential for a comprehensive approach to minimizing vulnerabilities. Operational aspects include:Supplier risk assessment: Evaluate suppliers based on their financial stability, quality of goods and services, delivery performance, and overall reliability. This helps to identify potential issues early and establish contingency plans. Furthermore, optimizing delivery operations through strategic supplier partnerships can enhance efficiency and mitigate potential risks in the supply chain.Inventory management: Implement inventory control measures to reduce the likelihood of stockouts, overstocking, or obsolescence. This includes using just-in-time (JIT) inventory systems, safety stock management, and demand forecasting.Automated software testing: For software-based products, use CI/CD pipelines to automate the testing process, including unit tests, integration tests, and performance tests to ensure that potential bugs or vulnerabilities are detected and addressed early in the development process. Automate software deployment to ensure high reliability and repeatability.Business continuity planning: Develop plans to address potential disruptions, such as natural disasters, geopolitical events, or supplier bankruptcies. This involves identifying critical processes, creating backup plans, and conducting regular simulations to ensure preparedness.Transportation and logistics: Optimize transportation routes and modes, and maintain visibility into the shipping process to minimize delays and disruptions. Establish relationships with multiple carriers and consider using a transportation management system (TMS) to streamline logistics.Information sharing and collaboration: Foster collaboration among supply chain partners to enable real-time visibility into operations, improve communication, and facilitate joint risk management initiatives.Compliance aspects:Regulatory compliance: Ensure compliance with applicable local, national, and international regulations, such as import/export controls, customs requirements, and environmental regulations. This can help avoid fines, penalties, and disruptions to operations.Ethical sourcing and labor practices: Implement policies to ensure responsible sourcing and adherence to labor standards, such as fair wages, working conditions, and human rights. This can protect brand reputation and minimize the risk of boycotts or negative publicity.Data security and privacy: Establish robust data protection measures to prevent unauthorized access, data breaches, and potential legal liabilities, both in the physical and software supply chain. This includes adhering to relevant data protection regulations like GDPR or CCPA.Quality management: Implement quality management systems (QMS) to ensure the quality of goods and services and compliance with relevant industry standards, such as ISO 9001. This helps to maintain customer satisfaction and prevent product recalls or legal issues.Corporate social responsibility (CSR): Integrate CSR principles into the supply chain management strategy, including environmental sustainability, community engagement, and ethical business practices. This can enhance brand reputation, customer loyalty, and long-term success.Effective supply chain risk management requires a holistic approach addressing operational and compliance aspects. Organizations that implement robust strategies and processes can minimize disruptions, maintain operational efficiency, and protect their brand reputation.ConclusionSupply chain risk management is an essential component of an organization's operations, encompassing identifying potential risks and applying strategies to mitigate them, ensuring a seamless supply chain. To enhance efficiency and reduce disruptions, consider adopting the best practices mentioned in this article to develop a robust supply chain risk management strategy. Doing so can minimize interruptions and guarantee that your business maintains smooth operations even during challenging circumstances.Make Atlantic.Net Part Of Your Cloud StrategyAtlantic.Net provides world-class VPS hosting services and compliant hosting solutions. Contact us today, and let us help you achieve operational and compliance excellence.
### What Is a Managed Services Agreement (MSA)?
Managed Services Agreements (MSA) are legal contracts between a managed services provider (MSP) and their client outlining the technical requirements and responsibilities necessary to ensure that experts manage and monitor their IT systems regularly.
As modern businesses increasingly rely on technology to streamline their operations, efficient and dependable IT support has become increasingly vital.
This article will provide an in-depth overview of Managed Services Agreements, including their key features, benefits, and how to craft a bespoke managed service agreement that perfectly fits your business needs.
Why Your Business Needs a Managed Services Agreement
Given that every business has unique IT requirements, it is crucial to develop tailored Managed Services Agreements that cater to your specific needs.
Below, we've outlined the most typical features of MSAs and the factors to consider when drafting a customized agreement.
Managed Services Provider Term of Agreement
The term of the agreement is a crucial aspect of a Managed Services Agreement. The term refers to the duration of the agreement, which can range from a few months to several years, depending on the agreement's nature.
The term of the agreement is an essential component of consideration because it determines the level of commitment between the Managed Service Provider (MSP) and the client.
MSPs typically offer a discounted rate for longer agreement terms. Consider your IT system requirements over the next 12 - 36 months and try to determine where you want to be as a business during that time. A reputable provider will work with you to determine the most suitable terms.
Managed Services Contract Service Level Agreement (SLA)
A critical component of the MSC is the SLA, or service level agreement, which sets the minimum standards for delivering IT solutions. The SLA typically includes provisions for minimum response time, escalation procedures, and problem-resolution processes.
The payment structure, including monthly fees and any additional consultation, is also outlined in the contract. An IT support and maintenance model clearly explains the configuration covered, costs, and potential risks associated with delivering support.
By including a liability protection clause, the service provider limits their responsibility for any breach of contract beyond reasonable control, ensuring customer satisfaction while protecting both parties from unforeseen circumstances and additional costs that may affect service delivery.
This contractual language safeguards against any potential issues and helps establish a mutually beneficial relationship between the service provider and the customer.
The SLA in a Managed Services Contract should include a termination provision, allowing either party to terminate the service agreement with a minimum number of days' written notice, if there is a breach.
The effective date of the contract and the due date for payment should also be specified. The force majeure clause in an MSP contract should outline any events that may prevent the service provider from delivering services and absolve them of any liability in such circumstances.
The MSP should also include provisions for client information protection and business practices that comply with applicable laws and regulations. The contract should specify the minimum amount of software code, substitute equipment, and lost data required to render services.
Escalation procedures and problem-resolution processes should be in place to ensure timely and effective service delivery.
What Managed Services Agreements Do for Clients and Companies
A Managed Services Agreement (MSA) is essential for businesses looking to streamline IT operations, reduce costs, and improve efficiency. Here are some ways in which an MSA can benefit your business:
Enhanced Cost Savings:
A well-crafted MSA can save businesses by improving productivity, reducing downtime, and preventing costly IT failures. MSPs will make reasonable efforts to identify areas of inefficiency in the client's IT infrastructure and implement cost-effective solutions that improve operations.
Proactive IT Support:
A managed service agreement can provide proactive IT support by regularly monitoring and maintaining your IT systems and identifying and addressing issues before they become significant problems. This can help your business avoid costly downtime and improve overall system performance.
Access to Expertise:
A managed services contract provides businesses access to skilled IT professionals who can provide guidance and support on IT-related matters. These professionals offer valuable insights and knowledge about the latest IT trends and technologies, which can help businesses stay ahead of the competition.
Scalability and Flexibility:
These are crucial features that allow businesses to scale their IT resources up or down as needed. This can be particularly beneficial for businesses with fluctuating IT needs, such as seasonal businesses.
Improved Security:
Contracted services ensure your IT systems are secure, protecting them from cyber-attacks and data breaches. With the increasing threat of cybercrime, ensuring the security of your IT infrastructure has quickly become the number one critical concern for businesses of all sizes.
What Does a Managed Services Agreement Usually Contain?
A Managed Services Agreement (MSA) is a legally binding contract that outlines the vital aspects of the business relationship between a Managed Service Provider (MSP) and their client. It establishes a clear understanding of each party's roles, responsibilities, and expectations.
To ensure a mutually beneficial and transparent partnership, it is crucial to incorporate several critical clauses within the MSA.
Scope of Services:
Defining the specific services rendered by the MSP to the client is pivotal. It encompasses details such as the types of devices or systems covered under the agreement, the designated service hours, and the expected response time for resolving any issues that may arise.
This clause can outline the software and hardware that the MSP will utilize, as well as any supplementary services that may be available. By formulating a comprehensive scope of services, potential misunderstandings or disputes can be minimized.
Service Level Agreement (SLA):
The SLA is a vital component of the MSA as it establishes the performance metrics the MSP commits to delivering. These metrics typically include uptime, response time, and issue resolution time. By clearly defining the agreed-upon service levels, both parties can have a shared understanding of the expected quality of service. Moreover, the SLA should also outline the consequences or remedies that will be implemented if the MSP fails to meet the established service levels.
Payment Terms:
The payment clause within the MSA should provide detailed information regarding the financial aspects of the agreement. It should specify the total cost of the services rendered, including any additional fees or charges applicable during the agreement term.
The payment terms should clearly outline the payment schedule, including the frequency and basis of payments (e.g., monthly). Additionally, this clause may address any late payment fees or penalties to ensure both parties know the financial obligations of the services provided.
Confidentiality and Security:
As data protection and privacy are of utmost importance, the MSA should include a section that addresses confidentiality and security. This clause should highlight the measures the MSP will undertake to protect the client's sensitive data and ensure its confidentiality.
It may encompass elements such as encryption protocols, access controls, and data backup procedures. Furthermore, the clause should also outline the client's responsibilities in safeguarding any confidential information from the MSP.
Intellectual Property Rights:
In the managed services model context, intellectual property may be created or utilized. Therefore, it is essential to include a clause outlining the ownership and rights associated with any intellectual property developed during the agreement. This clause clarifies the respective rights of the MSP and the client and ensures that intellectual property matters are properly addressed.
Liability Clause:
The liability clause establishes the responsibilities and obligations of both the MSP and the client regarding any damages or losses that may occur during the provision of services. It should outline the circumstances under which each party may be held liable and the extent of their liability. Additionally, the clause should address indemnification obligations and include any exclusions or limitations of liability the parties have agreed upon.
Termination and Exit:
This agreement section outlines the conditions under which either party can terminate the contract before its designated end date. It should include the notice period required for termination, the specific reasons for termination, and any associated fees or penalties that may apply.
Clear Understanding:
The MSA should ensure a clear understanding between the MSP and the client by providing concise and unambiguous terms. This ensures that both parties comprehend their obligations, expectations, and rights as outlined in the document.
Duly Authorized Representatives:
Throughout the MSA, it is important to specify that all actions and agreements undertaken by the parties are executed by their authorized delegates, ensuring that the individuals signing the agreement have the required authority.
Valid Exemption Certificate:
If relevant, the MSA can include a provision stating that the client must provide a valid exemption certificate for any applicable taxes or fees, relieving the MSP from any responsibility or liability regarding such taxes or fees.
Unauthorized Use:
The agreement should address the unauthorized use of the MSP's services or materials, outlining the consequences and potential liabilities for such breaches.
Other Costs and Lost Profits:
The MSA should clarify any other costs or lost profits that may arise from the provision of services, ensuring that both parties are aware of their potential financial implications.
Ensure Profitability:
The MSA may include provisions or clauses that aim to ensure the profitability of both the MSP and the client. This could involve mutual cooperation, performance milestones, or other mechanisms to support achieving financial goals.
Cost of Managed IT Services
The cost of IT Service Management can vary depending on several factors, with cost considerations such as the scope of services, the duration of the agreement, and the MSP's expertise.
Additionally, the cost of Proactive IT Management can vary by geographic location and business size.
Typically, MSPs charge a monthly fee that covers all IT services provided, ranging from a few hundred dollars to several thousand dollars depending on the complexity of the IT infrastructure and required services.
Some MSPs may also charge additional fees for specific services or projects.
Service Outside Normal Working Hours
Most MSPs provide IT support during normal working and regular business hours, typically 8 am to 5 pm, Monday to Friday.
However, some managed service providers can offer 24/7 support as part of managed services contract for an additional fee.
Businesses with service calls should consider their IT needs and determine whether they require round-the-clock support.
The service provider should clarify the process for raising after-hours support and the associated fees within the service agreement.
Service Provider Potential Contract Issues
When drafting a managed services contract, include clear language outlining the services covered by the entire agreement and the payment structure. The managed services contract should also include a termination clause and an unforeseeable circumstances clause that outlines the actions to be taken in case of unforeseen circumstances that prevent the MSP from delivering services.
The managed services contract should also include liability protection and valid exemption certificates to protect both parties.
It is also essential to clarify the responsibilities of both parties, including the client's obligation to provide necessary client information and the MSP's obligation to render services to the problem client in a timely manner and efficient manner.
The contract should also include a hierarchy of escalation and a minimum response time to resolve issues promptly.
In case of early termination, the contract should outline the consequences of such failure for both parties and include language that holds one party or both parties liable for any breach of the contract.
How Does A MSA Differ From A Statement of Work?
A Managed Services Agreement is a comprehensive agreement that outlines all aspects of the MSP's services, including the scope of services, the payment schedule, terms, and SLA.
In contrast, the scope of work (SOW) or statement of work (SOW) outlines a specific project or task that the MSP will complete.
While an MSA provides ongoing IT support, an SOW or SOW is a one-off project that the MSP will complete.
Atlantic.Net Managed Services
Are you tired of managing your IT infrastructure alone? Are you tired of impossible contract language? Then look no further than Atlantic.Net's Managed Services Agreement.
With Atlantic.Net as your IT Managed Solutions provider, you can trust that your IT environment is in expert hands. Our team of experienced professionals will manage everything from monitoring and managing your servers to keeping your data secure and ensuring maximum uptime.
Choosing Atlantic.Net as your Outsourced IT Services provider means you'll have access to our state-of-the-art data centers, advanced security solutions, and cutting-edge technology. We provide 24/7/365 support to resolve any issues quickly and efficiently.
By partnering with Atlantic.Net, you can focus on your business goals and leave the IT management to the experts. Don't let IT issues hold you or your clients back; choose Atlantic.Net as your MSP today.
### What Is a Cloud Managed Service Provider and What Do They Do?
Modern businesses are shifting towards cloud-based solutions for their IT infrastructure in today's digital transformation landscape. However, while public cloud services offer numerous benefits to clients, managing them can prove to be a complex and challenging process.
To address this obstacle, cloud managed service providers have emerged as expert service providers by offering various services and technical solutions designed to help businesses offload cloud infrastructure's complex management and maintenance to a team of dedicated professionals.
What is a Managed Cloud Services Provider?
A managed cloud service provider is a third-party company offering technical services to help organizations manage their own cloud environments, resources, and IT systems. When approached by their customer, a managed services provider proposes a range of management services to support hybrid cloud environments, public cloud services, and private cloud services to their customers.
They specialize in providing managed cloud services that help organizations drive their day-to-day business cloud operations well. This might include initiatives for cloud migration, cloud deployments, database management, helping with business processes, business continuity (disaster recovery), development of cloud-native applications, and data protection guarantees.
Clients expect help with cloud operations, integration services, centralized services, cloud integration, cloud engineering, cloud adoption best practice, and cloud environment recommendations. These recommendations could cover enterprise networks, digital transformation, cloud apps, application services, cloud and transformation services, machine learning, managed security, ongoing management, infrastructure management, and above all else, a reliable and robust infrastructure.
A managed cloud service provider delivers diverse services, including professional services, cloud migration services, cloud deployment services, business process management, business continuity management, cloud-native application management, and data protection services such as snapshots, backups, and restores.
Cloud managed service providers deliver the ongoing management of cloud resources, integration services, and centralized services to help organizations manage their cloud applications.
The range of managed services is extensive and intricate, with each business requiring dynamic access to meet evolving needs.
Why Are Cloud Managed Services Important?
With the increasing importance of cloud technology, the demand for Cloud MSPs is rising. The global cloud-managed services market is projected to reach a whopping $160 billion by 2027, according to a report by MarketsandMarkets.
This growth is driven by the many benefits that Cloud MSPs offer, such as cost savings, improved security, and increased efficiency. All businesses have realized that the cloud is the future, and the majority already have cloud migration projects in flight.
Cloud managed services are important for several reasons; some of the most important are:
Expertise On-Hand
Managed service providers (MSPs) have experts who understand the technical aspects of cloud computing addition; they have experience handling different cloud platforms, applications, and technologies, making them ideal for managing cloud services for organizations.
Experts can help organizations select the appropriate cloud services that meet their specific requirements, such as storage, computing power, security, and compliance.
MSPs experts manage the day-to-day operations of cloud services, including monitoring, maintenance, and troubleshooting. Including managing the hardware and software platforms, patching, security updates, and upgrades, ensuring customers get the most value from their cloud investments.
Cost-Effective Solutions
Cloud managed services can help organizations save money by reducing the need for in-house IT staff and infrastructure. In addition, within managed services, organizations can avoid the costs of maintaining servers, hardware, and software.
Managed Service Providers (MSPs) introduce cost-effectiveness in several ways, including:
Reduced IT staffing costs
Reduce the costs associated with hiring and managing in-house IT staff. MSPs provide a team of experts who can handle all aspects of managing the cloud environment, including maintenance, security, and troubleshooting, allowing you to free up resources and focus on core business objectives.
Financial Scalability:
Public cloud providers enable organizations to scale their cloud services up or down as needed based on changes in demand or business requirements. This can help organizations avoid over or under-provisioning resources, reducing the risk of unnecessary costs.
Predictable pricing
Cloud providers offer predictable pricing models, such as monthly or annual subscriptions, which can help organizations manage their cloud adoption costs better. There is no need for upfront investments in hardware and software, which can reduce costs for organizations.
Access to advanced technologies
A managed service provider gives access to advanced cloud technologies and environments that might be too expensive or complex to implement in-house. This can help organizations stay competitive without investing significant resources into new technologies, hardware, and expensive licensing.
Managed Security
Cloud managed service providers offer advanced security features to protect organizations' data and systems from cyber threats. Multiple physical, technical, and administrative security measures are required to ensure client data confidentiality, integrity, and availability.
Physical Security:
Physical security measures are put in place to protect the data center's physical infrastructure from unauthorized access, theft, and damage.
Tier 1 data centers are typically equipped with the following:
Biometric access controls: allow only authorized personnel to enter the data center. The data centers also have multiple layers of access controls, including badge readers, proximity sensors, and biometric scanners.
Video surveillance: Data centers must have 24/7 video surveillance which monitors all the activity inside the data center.
Environmental controls: Data centers should have sophisticated HVAC systems to ensure optimal equipment temperature and humidity levels.
Fire suppression systems: The data centers have advanced fire suppression systems that can detect and extinguish any fire that might occur.
Technical Security
Technical security measures are implemented to prevent unauthorized access, data breaches, and cyber-attacks.
Look for technical security measures, such as:
Network security: The company employs firewalls, intrusion detection and prevention systems, and VPNs to protect its network from unauthorized access.
Encryption: Data and network encryption protect sensitive data in transit and at rest. Look for a managed service provider that uses SSL/TLS encryption for website traffic and data encryption for stored data.
Anti-malware protection: Good security comes from highly secure endpoints; look for managed services that offer cloud services for anti-malware protection that detect and remove malware automatically.
Administrative Security
It's critical to know that behind the scenes, your managed service provider has the administrative security measures in place to ensure that relevant policies and procedures are followed and that their employees are trained to handle your data correctly.
Employee background checks: The provider's employees should be background checked to ensure a clean record.
Access controls: Software access controls restrict access to sensitive data to only authorized personnel.
Security policies: A comprehensive set of security policies and procedures that are regularly reviewed and updated ensures that your business is safe.
Employee training: Cybersecurity is a serious business. Regular security training must be provided to the MSPs employees, ensuring they know the latest security threats and how to prevent them.
Scalability
Managed services allow organizations to scale their cloud resources up or down as needed easily. This means that organizations can quickly adapt to changing business needs without worrying about the technical details of adding or removing resources from the cloud.
Reliability
Cloud managed service providers ensure high uptime and reliability for to cloud services offered to their clients. They use redundancy and failover mechanisms, providing their clients' services are always available, even during an outage or hardware failure.
What Is Included in Cloud Managed Services?
Cloud MSPs provide services encompassing cloud infrastructure management, security, and compliance management, big data analytics, backup, recovery, and round-the-clock technical support.
This allows businesses to focus on their core business operations while leaving the management of their cloud infrastructure in the capable hands of experts.
So, whether you're a small business looking to move your IT infrastructure to the cloud or a large enterprise looking to optimize your already existing servers with cloud systems, a Cloud MSP can provide the support and expertise you need to succeed in today's fast-paced digital world.
Managed Cloud Services
Organizations can delegate the management of their cloud infrastructure to third-party providers, who offer a comprehensive set of services collectively known as managed cloud services. These services include the management of enterprise networking, server hosting, server management, backup, security, and consulting agreements, among others.
Below are some of the critical services provided by managed cloud services:
Managed Enterprise Networking
Third-party providers offering managed enterprise networking services can help organizations guarantee their network infrastructure's security, reliability, and performance optimization. These services often include routing, switching, firewalling, load balancing, and virtual private networking (VPN).
Intrusion Protection Systems
Intrusion protection systems are designed to detect and prevent unauthorized access to an organization's network. Managed cloud service providers offer intrusion protection systems as part of their security services.
An IPS is a security tool designed to monitor and prevent unauthorized access to a network or system; it analyzes network traffic, identifies potential security threats, and takes action to prevent them.
Multi-Factor Authentication (MFA)
Multi-Factor Authentication (MFA) is becoming increasingly popular as a security mechanism for protecting online accounts from unauthorized access. MFA requires users to provide two or more forms of authentication before they can access their accounts.
This is typically accomplished by requiring something the user knows, such as a password or PIN, something the user has, such as a smart card or security token, or something the user is, such as a fingerprint or facial recognition.
By requiring multiple forms of authentication, MFA makes it much more difficult for hackers to gain unauthorized access to an account, even if they have obtained the user's password through a data breach or other means.
Managed cloud services can provide MFA solutions to improve the security of an organization's cloud environment. MFA can be implemented for all users or those with access to sensitive data or critical systems.
MFA can be used with other security measures, such as firewalls, intrusion detection and prevention systems, and data encryption, to provide a layered approach to security that makes it more difficult for attackers to breach the system.
Managed Server Hosting
Managed server hosting services allow organizations to host their applications and data on servers managed by third-party providers. This includes services like server deployment, configuration, monitoring, and maintenance.
Network Edge Protection/DDoS
Network edge protection services help organizations defend against Distributed Denial of Service (DDoS) attacks by monitoring incoming traffic and blocking suspicious requests.
Network Edge Protection services are a powerful tool for defending against DDoS attacks. By monitoring incoming traffic and blocking suspicious requests, these services can help to reduce the impact of attacks and improve the overall security posture of an organization's network.
If your organization is at risk of DDoS attacks, it may be worth considering a Network Edge Protection service as part of your cybersecurity strategy.
Trend Micro Security
Trend Micro is a leading provider of cloud security solutions, including endpoint protection, network security, and cloud security. In addition, managed cloud services can provide Trend Micro security solutions to enhance the security of an organization's cloud environment.
Trend Micro also offers a range of network security solutions, including firewalls, intrusion prevention systems, and advanced threat detection and response tools. These solutions help organizations protect their networks from cyber attacks, including DDoS attacks, malware infections, and other threats.
In addition to endpoint and network security, Trend Micro offers cloud security solutions designed to help organizations protect their cloud-based systems and applications. This includes cloud workload protection, container security, and cloud security posture management tools.
By providing comprehensive security solutions specifically designed for the cloud, Trend Micro can help organizations take full advantage of the benefits of cloud computing while minimizing the risk of security incidents.
Managed Private Cloud
Managed private cloud services provide organizations with dedicated cloud infrastructure third-party provider managers. This includes services like server deployment, configuration, monitoring, and maintenance.
Unlike public cloud services, a private cloud is a dedicated environment designed to meet an organization's unique needs. Managed private cloud services offer a range of benefits for organizations, including enhanced security, reliability, and flexibility.
With a private cloud, organizations can quickly scale their resources up or down as needed, allowing them to respond to changing business needs without costly hardware purchases or upgrades.
This full cloud transformation can help organizations to improve their agility and adaptability, enabling them to stay competitive in a rapidly-evolving business landscape.
Server Management
Server management services help organizations ensure that their servers run efficiently, securely, and reliably. This includes services like server patching, backup and recovery, and performance monitoring.
Server management services ensure an organization's servers run efficiently, securely, and reliably. These services include server patching, backup and recovery, and performance monitoring.
They are critical to minimizing downtime, optimizing performance, and ensuring the security of an organization's data and systems.
Organizations can benefit from expert support and guidance by outsourcing server management to a third-party provider while focusing their resources on more strategic initiatives.
Consulting Agreements
Managed cloud service providers can offer consulting services to help organizations plan, design, and implement their cloud infrastructure. This includes services like cloud readiness assessments, migration planning, and architecture design.
Managed Backup
Managed services often include a managed backup service like Veeam Backup, a popular backup and recovery solution for virtualized environments. Managed cloud services can provide Veeam backup solutions to ensure an organization's data is backed up and recoverable during a disaster.
Organizations can leverage their expertise and resources to improve their cloud environment's performance, security, and reliability by partnering with a managed cloud service provider.
How Do I Choose a Cloud Managed Service Provider?
Atlantic.Net is the top choice when choosing the best-managed cloud services provider. The company has over 28 years of experience within the cloud industry, providing secure and reliable cloud solutions to clients worldwide.
In addition, our expertise in cloud hosting, virtualization, disaster recovery, and compliance management sets it apart from other managed cloud service providers.
Range of Services
Atlantic.Net offers a comprehensive range of cloud services to meet the unique needs of businesses across various industries. The company's managed cloud services include server management, monitoring, security, backup, and disaster recovery.
Additionally, Atlantic.Net provides private and public cloud, hybrid cloud, and cloud migration services to help businesses modernize their IT infrastructure.
Reputation and Customer Satisfaction Rating
Atlantic.Net has a proven track record of delivering exceptional cloud solutions to its clients, with a 100% uptime SLA. The company has received numerous industry awards and accolades for its cloud services, including the 2020 Cloud Hosting Service Provider of the Year Award by Acquisition International.
Pricing Structure
Atlantic.Net offers flexible pricing models to suit different business needs, including pay-as-you-go and fixed-fee pricing. The company's pricing is transparent, with no hidden costs or setup fees. This makes it easier for businesses to plan and budget their cloud computing expenses.
Level of Support
Atlantic.Net provides 24/7 customer support to its clients, with a dedicated team of cloud experts available to address any issues or concerns. In addition, the company offers proactive monitoring and management of its clients' enterprise-grade cloud technologies, ensuring optimal performance and security.
This level of support ensures that businesses can focus on their core operations while our professional services teams manage the complexities of the hyper-scale cloud environment.
Atlantic.Net is committed to delivering exceptional reliability and performance to our clients as a cloud managed service provider.
Our 100% uptime SLA sets us apart from competitors like Google Cloud Platform, Oracle Cloud, Alibaba Cloud, Tata Consultancy Services, AWS Cloud, and Microsoft Azure.
Atlantic.Net: The Managed Cloud Service Provider
Looking for a cloud managed service provider to help you optimize your cloud resources, secure your cloud infrastructure, and meet your business objectives? Look no further than our team of experienced professionals!
As a leading provider of managed cloud services, we offer various infrastructure management services, including managed services, cloud security, and data protection.
Atlantic.Net is a leading managed cloud service provider that offers a range of cloud solutions to help organizations optimize their IT infrastructure, enhance security, and improve business performance.
With a strong focus on customer service and satisfaction, Atlantic.Net offers various services, including managed private cloud, intrusion protection systems, network edge protection, server management, and multi-factor authentication solutions.
With a team of experienced IT professionals and a commitment to innovation and excellence, Atlantic.Net is dedicated to helping organizations leverage the power of cloud technology to drive business success.
Whether an organization wants to migrate to the cloud, enhance security, or optimize server performance, Atlantic.Net has the expertise in IT services and solutions to meet its needs.
In today's fast-paced and ever-evolving business landscape, having a reliable and secure IT infrastructure is essential to success. By partnering with Atlantic.Net, organizations can benefit from expert support, guidance, and customized solutions, tailored to their specific needs, helping them stay ahead of the competition and achieve their business objectives.
### How to Install a LEMP Stack on Fedora
LEMP is an open-source web application stack from Linux, Nginx, MariaDB/MySQL, and PHP. LEMP represents L for Linux, E for Nginx, M for MariaDB/MySQL, and P for PHP/Perl/Python. All components are used together to host a web application on the internet. LEMP is popular due to its scalability, high performance, open-source, flexibility, and security. If you are looking for an open-source stack for website deployment, then LEMP is your best choice.
This post will show you how to install a LEMP stack on Fedora 34.
Step 1 - Install Nginx
Nginx is the first component of the LEMP stack. You can install it by running the following command.
dnf install nginx -y
Once installed, start and enable the Nginx service with the following command.
systemctl start nginx
systemctl enable nginx
Next, check the active status of Nginx with the following command.
systemctl status nginx
You will get the following output.
● nginx.service - The nginx HTTP and reverse proxy server
Loaded: loaded (/usr/lib/systemd/system/nginx.service; disabled; vendor preset: disabled)
Drop-In: /usr/lib/systemd/system/nginx.service.d
└─php-fpm.conf
Active: active (running) since Thu 2023-04-13 23:11:45 EDT; 32s ago
Process: 6342 ExecStartPre=/usr/bin/rm -f /run/nginx.pid (code=exited, status=0/SUCCESS)
Process: 6343 ExecStartPre=/usr/sbin/nginx -t (code=exited, status=0/SUCCESS)
Process: 6344 ExecStart=/usr/sbin/nginx (code=exited, status=0/SUCCESS)
Main PID: 6345 (nginx)
Tasks: 3 (limit: 4666)
Memory: 3.3M
CPU: 102ms
CGroup: /system.slice/nginx.service
├─6345 nginx: master process /usr/sbin/nginx
├─6346 nginx: worker process
└─6347 nginx: worker process
Step 2 - Install PHP and PHP-FPM
You will need to install PHP, PHP-FPM, and other PHP extensions to host PHP-based applications on your Nginx server. You can install all of them with the following command.
dnf install php php-fpm php-common php-mysqlnd php-json php-curl -y
Next, exit the PHP-FPM configuration file:
nano /etc/php-fpm.d/www.conf
Replace apache with nginx as shown below:
user = nginx
group = nginx
Save and close the file, then start and enable the PHP-FPM service:
systemctl start php-fpm
systemctl enable php-fpm
You can also verify the PHP version with the following command.
php -v
You should see the PHP version in the following output.
PHP 7.4.28 (cli) (built: Feb 15 2022 13:23:10) ( NTS )
Copyright (c) The PHP Group
Zend Engine v3.4.0, Copyright (c) Zend Technologies
with Zend OPcache v7.4.28, Copyright (c), by Zend Technologies
Step 3 - Install MariaDB Database Server
You will also need to install MariaDB server as a database backend to your server. You can install it with the following command.
dnf install mariadb-server -y
Next, start and enable the MariaDB service using the following command.
systemctl start mariadb
systemctl enable mariadb
Next, secure the MariaDB installation with the following command.
mysql_secure_installation
You will be asked to provide your current password:
Enter current password for root (enter for none):
Just press the Enter key. You will be asked to change the root password.
OK, successfully used password, moving on...
Setting the root password or using the unix_socket ensures that nobody
can log into the MariaDB root user without the proper authorisation.
You already have your root account protected, so you can safely answer 'n'.
Switch to unix_socket authentication [Y/n] n
... skipping.
You already have your root account protected, so you can safely answer 'n'.
Change the root password? [Y/n] Y
New password:
Re-enter new password:
Set your new password and press the Enter key. You will be asked to remove the anonymous users:
Password updated successfully!
Reloading privilege tables..
... Success!
By default, a MariaDB installation has an anonymous user, allowing anyone
to log into MariaDB without having to have a user account created for
them. This is intended only for testing, and to make the installation
go a bit smoother. You should remove them before moving into a
production environment.
Remove anonymous users? [Y/n] Y
Type Y and press the Enter key. You will be asked to disallow root login remotely.
... Success!
Normally, root should only be allowed to connect from 'localhost'. This
ensures that someone cannot guess at the root password from the network.
Disallow root login remotely? [Y/n] Y
Type Y and press the Enter key. You will be asked to remove the test database.
... Success!
By default, MariaDB comes with a database named 'test' that anyone can
access. This is also intended only for testing, and should be removed
before moving into a production environment.
Remove test database and access to it? [Y/n] Y
Type Y and press the Enter key. You will be asked to reload the privilege tables.
- Dropping test database...
... Success!
- Removing privileges on test database...
... Success!
Reloading the privilege tables will ensure that all changes made so far
will take effect immediately.
Reload privilege tables now? [Y/n] Y
Type Y and press the Enter key to finish the process.
... Success!
Cleaning up...
All done! If you've completed all of the above steps, your MariaDB
installation should now be secure.
Thanks for using MariaDB!
Step 4 - Host a PHP Website with Nginx
Next, create a simple info.php file inside the Nginx web root directory.
nano /var/www/html/info.php
Add the following code:
Save and close the file, then create an Nginx virtual server block to define the info.php file.
nano /etc/nginx/conf.d/phpinfo.conf
Add the following configurations:
server {
listen 80;
server_name phpinfo.example.com;
root /var/www/html/;
index info.php;
location ~ \.php$ {
fastcgi_pass unix:/run/php-fpm/www.sock;
fastcgi_param SCRIPT_FILENAME $document_root$fastcgi_script_name;
fastcgi_index index.php;
include fastcgi_params;
}
}
Save and close the file, then edit the Nginx main configuration file.
nano /etc/nginx/nginx.conf
Add the following line below the line http{:
server_names_hash_bucket_size 64;
Save and close the file, then verify the Nginx configuration:
nginx -t
If everything is fine, you should see the following output.
nginx: the configuration file /etc/nginx/nginx.conf syntax is ok
nginx: configuration file /etc/nginx/nginx.conf test is successful
Finally, restart the Nginx service to apply the changes.
systemctl restart nginx
Step 5 - Access PHP Website Page
Now, open your web browser and access the PHP page using the URL http://phpinfo.example.com. You should see the PHP page on the following screen.
Conclusion
In this post, you learned how to install the LEMP stack on Fedora 34. You also learned how to host a PHP-based website using the LEMP server. You can now easily host any PHP-based website with LEMP. Try to host a website with a LEMP stack on dedicated server hosting from Atlantic.Net!
### How to Install a LAMP Stack on Fedora
A LAMP stack is made from four open-source software components: Linux, Apache, MariaDB/MySQL, and PHP. LAMP uses Apache as a web server, Linux as an operating system, MariaDB as a database backend, and PHP as a processing language. Developers and web hosting owners use LAMP to host a website online. It is customizable, so users can replace any component with another open-source solution per their needs.
This post will show you how to install a LAMP stack on Fedora 34.
Step 1 - Install Apache Web Server
Apache web server is the first and most important component of the LAMP server. You can install it using the following commands.
dnf update -y
dnf install httpd -y
Once installed, start and enable the Apache service using the following command.
systemctl start httpd
systemctl enable httpd
Next, verify the Apache status using the following command.
systemctl status httpd
You will get the following output.
● httpd.service - The Apache HTTP Server
Loaded: loaded (/usr/lib/systemd/system/httpd.service; disabled; vendor preset: disabled)
Active: active (running) since Thu 2023-04-13 23:01:38 EDT; 1s ago
Docs: man:httpd.service(8)
Main PID: 1995 (httpd)
Status: "Started, listening on: port 80"
Tasks: 177 (limit: 4666)
Memory: 14.1M
CPU: 100ms
CGroup: /system.slice/httpd.service
├─1995 /usr/sbin/httpd -DFOREGROUND
├─1996 /usr/sbin/httpd -DFOREGROUND
├─1997 /usr/sbin/httpd -DFOREGROUND
├─1998 /usr/sbin/httpd -DFOREGROUND
└─1999 /usr/sbin/httpd -DFOREGROUND
Step 2 - Install MariaDB Database Server
MariaDB is a database server used as a database backend for any web application. You can install the MariaDB server with the following command.
dnf install mariadb-server -y
Next, start and enable the MariaDB server with the following command.
systemctl start mariadb
systemctl enable mariadb
By default, the MariaDB server listens on port 3306. You can check it with the following command.
ss -antpl | grep 3306
You will get the following output.
LISTEN 0 80 *:3306 *:* users:(("mariadbd",pid=4542,fd=20))
Next, run the following script to secure the MariaDB installation.
mysql_secure_installation
You will be asked to provide your current password:
Enter current password for root (enter for none):
Just press the Enter key. You will be asked to change the root password.
OK, successfully used password, moving on...
Setting the root password or using the unix_socket ensures that nobody
can log into the MariaDB root user without the proper authorisation.
You already have your root account protected, so you can safely answer 'n'.
Switch to unix_socket authentication [Y/n] n
... skipping.
You already have your root account protected, so you can safely answer 'n'.
Change the root password? [Y/n] Y
New password:
Re-enter new password:
Set your new password and press the Enter key. You will be asked to remove the anonymous users:
Password updated successfully!
Reloading privilege tables..
... Success!
By default, a MariaDB installation has an anonymous user, allowing anyone
to log into MariaDB without having to have a user account created for
them. This is intended only for testing, and to make the installation
go a bit smoother. You should remove them before moving into a
production environment.
Remove anonymous users? [Y/n] Y
Type Y and press the Enter key. You will be asked to disallow root login remotely.
... Success!
Normally, root should only be allowed to connect from 'localhost'. This
ensures that someone cannot guess at the root password from the network.
Disallow root login remotely? [Y/n] Y
Type Y and press the Enter key. You will be asked to remove the test database.
... Success!
By default, MariaDB comes with a database named 'test' that anyone can
access. This is also intended only for testing, and should be removed
before moving into a production environment.
Remove test database and access to it? [Y/n] Y
Type Y and press the Enter key. You will be asked to reload the privilege tables.
- Dropping test database...
... Success!
- Removing privileges on test database...
... Success!
Reloading the privilege tables will ensure that all changes made so far
will take effect immediately.
Reload privilege tables now? [Y/n] Y
Type Y and press the Enter key to finish the process.
... Success!
Cleaning up...
All done! If you've completed all of the above steps, your MariaDB
installation should now be secure.
Thanks for using MariaDB!
Step 3 - Install PHP
By default, PHP 7.4 is included in the Fedora 34 default repo. You can install PHP with other extensions using the following command.
dnf install php php-common php-mysqlnd php-curl php-xml php-json php-gd php-mbstring -y
After the successful installation, verify the PHP version with the following command.
php -v
You should see the PHP version in the following output.
PHP 7.4.28 (cli) (built: Feb 15 2022 13:23:10) ( NTS )
Copyright (c) The PHP Group
Zend Engine v3.4.0, Copyright (c) Zend Technologies
with Zend OPcache v7.4.28, Copyright (c), by Zend Technologies
Step 4 - Verify PHP Installation
To verify the PHP installation, create an info.php file.
nano /var/www/html/info.php
Add the following code.
Save and close the file, then create an Apache virtual host.
nano /etc/httpd/conf.d/phpinfo.conf
Add the following configuration:
ServerName phpinfo.example.com
DocumentRoot /var/www/html/
DirectoryIndex info.php
ErrorLog /var/log/httpd/example.com_error.log
CustomLog /var/log/httpd/example.com_requests.log combined
Save and close the file, then restart the Apache service to apply the changes.
systemctl restart httpd
Now, open your web browser and verify the PHP installation using the URL http://phpinfo.example.com. You should see your PHP information on the following screen.
Conclusion
In this post, we explained how to install Apache, MariaDB, and PHP on Fedora 34. We also showed you how to verify the PHP version using the Apache server. You can now try to deploy the LAMP server on dedicated server hosting from Atlantic.Net!
### How to Install Nginx Web Server on Fedora
Nginx, also called engine-ex, is an open-source, high-performance web server used to host a website on the Internet. Nginx is also used as a reverse proxy, load-balancer, caching, and media streaming. It is lightweight, high-performance, and specially used to serve static files. It has an HTTPS capability and is designed for maximum performance and to handle the high-loaded website.
In this post, we will show you how to install the Nginx web server on Fedora 34.
Step 1 - Install Nginx Web Server
By default, the Nginx package is included in the Fedora 34 default repo. You can install it with the following command.
dnf update -y
dnf install nginx
Once Nginx is installed, run the following command to see detailed information about the Nginx package:
rpm -qi nginx
You will get the following output.
Name : nginx
Epoch : 1
Version : 1.22.0
Release : 1.fc34
Architecture: x86_64
Install Date: Thursday 13 April 2023 11:08:55 PM
Group : Unspecified
Size : 154661
License : BSD
Signature : RSA/SHA256, Wednesday 25 May 2022 08:56:23 AM, Key ID 1161ae6945719a39
Source RPM : nginx-1.22.0-1.fc34.src.rpm
Build Date : Wednesday 25 May 2022 08:36:04 AM
Build Host : buildhw-x86-05.iad2.fedoraproject.org
Packager : Fedora Project
Vendor : Fedora Project
URL : https://nginx.org
Bug URL : https://bugz.fedoraproject.org/nginx
Summary : A high performance web server and reverse proxy server
Description :
Nginx is a web server and a reverse proxy server for HTTP, SMTP, POP3 and
IMAP protocols, with a strong focus on high concurrency, performance and low
memory usage.
Step 2 - Manage the Nginx Service
Nginx service is managed by systemd in Fedora 34. You can use the systemctl command to start, stop, restart, and enable the Nginx service.
To start the Nginx service, run the following command.
systemctl start nginx
To enable the Nginx service, run the following command.
systemctl enable nginx
To stop the Nginx service, run the following command.
systemctl stop nginx
To verify the Nginx status, run the following command.
systemctl status nginx
You will get the Nginx status in the following output.
● nginx.service - The nginx HTTP and reverse proxy server
Loaded: loaded (/usr/lib/systemd/system/nginx.service; disabled; vendor preset: disabled)
Drop-In: /usr/lib/systemd/system/nginx.service.d
└─php-fpm.conf
Active: active (running) since Thu 2023-04-13 23:08:59 EDT; 5s ago
Process: 6314 ExecStartPre=/usr/bin/rm -f /run/nginx.pid (code=exited, status=0/SUCCESS)
Process: 6315 ExecStartPre=/usr/sbin/nginx -t (code=exited, status=0/SUCCESS)
Process: 6316 ExecStart=/usr/sbin/nginx (code=exited, status=0/SUCCESS)
Main PID: 6317 (nginx)
Tasks: 3 (limit: 4666)
Memory: 3.2M
CPU: 95ms
CGroup: /system.slice/nginx.service
├─6317 nginx: master process /usr/sbin/nginx
├─6318 nginx: worker process
└─6319 nginx: worker process
Step 3 - Access the Nginx Test Page
At this point, Nginx is installed and listens on port 80. You can check it with the following command.
ss -antpl | grep :80
You will get the following output.
LISTEN 0 511 0.0.0.0:80 0.0.0.0:* users:(("nginx",pid=6319,fd=10),("nginx",pid=6318,fd=10),("nginx",pid=6317,fd=10))
LISTEN 0 511 [::]:80 [::]:* users:(("nginx",pid=6319,fd=11),("nginx",pid=6318,fd=11),("nginx",pid=6317,fd=11))
Now, open your web browser and access the Nginx test page using the URL http://your-server-ip. You should see the Nginx test page on the following screen.
Step 4 - Create a Sample Website
Next, create a website directory with the following command.
mkdir /var/www/html/nginxsite
Next, create a simple HTML file inside the website directory.
nano /var/www/html/nginxsite/index.html
Add the following configurations:
Welcome to Nginx!
Success! The Nginx server block is working!
Save and close the file, then set the ownership to the website directory.
chown -R nginx:nginx /var/www/html/nginxsite
Step 5 - Create an Nginx Virtual Host
Next, create an Nginx virtual host to host your website on the web.
nano /etc/nginx/conf.d/nginxsite.conf
Add the following configurations:
server {
listen 80;
server_name nginx.example.com;
root /var/www/html/nginxsite/;
index index.html index.htm;
location / {
try_files $uri $uri/ =404;
}
}
Save and close the file, then edit the Nginx main configuration file.
nano /etc/nginx/nginx.conf
Add the following line below the line http{:
server_names_hash_bucket_size 64;
Save and close the file, then verify the Nginx for any syntax error.
nginx -t
You will get the following output.
nginx: the configuration file /etc/nginx/nginx.conf syntax is ok
nginx: configuration file /etc/nginx/nginx.conf test is successful
Finally, restart Nginx to apply the changes.
systemctl restart nginx
Step 6 - Verify Nginx Website
Now, open your web browser and access the Nginx website using the URL http://nginx.example.com. You should see the following screen.
Conclusion
Congratulations! You have successfully installed the Nginx web server on Fedora 34. You can now host your own website on the internet using the Nginx web server. You can also deploy Nginx on dedicated server hosting from Atlantic.Net!
### What Is a PCI Compliance Manager, and Does Your Organization Need One?
What Is PCI Compliance?
PCI compliance refers to adherence to the PCI DSS—Payment Card Industry Data Security Standard—which includes several security standards devised to ensure that companies that handle payment card data keep their data environment secure. They apply to any organization that processes, transmits, or stores debit or credit card information. A group of leading credit card companies, including Visa, American Express, Mastercard, JCB International, and Discover developed the standards.
To achieve PCI compliance, businesses must implement a series of security measures that protect against data breaches, including maintaining a secure network, regularly monitoring and testing security systems, and restricting access to cardholders’ data. PCI compliance is essential for businesses that handle credit card transactions, as failure to comply can result in costly fines, legal action, and damage to the company's reputation.
PCI DSS standards are regulated by the PCI SSC (Payment Card Industry Security Standards Council). The council continues developing and maintaining the PCI DSS and additional security standards to help protect cardholders’ data from theft and fraud. The PCI SSC is also responsible for ensuring that all entities that handle payment card data comply with the requirements of PCI DSS.
What Is a PCI Audit?
A PCI audit aims to evaluate the company's security measures, policies, procedures, and systems to ensure they comply with the PCI DSS. The audit is conducted by a PCI SSC-certified Qualified Security Assessor (QSA) who has been trained to assess an organization’s compliance level.
The auditor typically reviews the company's security controls to identify any vulnerabilities or weaknesses and provides recommendations for remediation. The PCI audit process usually involves several steps, including reviewing the company's documentation, evaluating the company's systems and processes, and submitting a final report to the PCI SSC. This is similar to a traditional IT audit process but adapted to the specific requirements of PCI DSS.
PCI audits are mandatory for any company that handles credit card data, including merchants, service providers, and payment processors. PCI audits help ensure that companies are properly protecting sensitive credit card data and can help prevent data breaches and associated financial losses.
What Is a Compliance Manager?
A compliance manager is a professional ensuring that a company or organization complies with relevant laws, regulations, policies, and standards. Compliance managers work across different industries and sectors, including finance, healthcare, technology, and manufacturing.
A compliance manager must have strong analytical and communication skills and a thorough understanding of relevant laws and regulations. They must be able to work collaboratively with other departments and stakeholders and have the ability to develop and implement effective compliance strategies that mitigate risk and ensure organizational success.
What Do PCI Compliance Managers Do?
PCI compliance managers work with stakeholders across the organization to develop and implement policies and procedures that ensure PCI DSS compliance and help to protect credit card data from theft and fraud. A PCI compliance manager might perform some specific tasks:
Developing and implementing procedures and policies to ensure PCI DSS compliance.
Conduct regular risk assessments to identify vulnerabilities and potential areas of non-compliance.
Managing the PCI compliance program and overseeing the work of other employees involved in compliance efforts.
Monitoring compliance performance and ensuring corrective actions are taken to address any issues.
Working with external auditors to conduct PCI compliance assessments and audits.
Providing training to employees on PCI compliance issues and best practices for protecting credit card data.
Staying up-to-date on changes to the PCI DSS and ensuring that the organization complies with any new requirements.
Who Is Qualified to Be a PCI Compliance Manager?
To be qualified as a PCI compliance manager, one should possess a combination of relevant education, work experience, and professional certifications. Generally, a PCI compliance manager must have a deep understanding of the PCI DSS and the ability to apply its requirements in practice.
Here are some qualifications that can help one become a PCI compliance manager:
Education: A bachelor's degree in a relevant field such as computer science, information systems, or cybersecurity is typically required. Advanced degrees such as a Master's in information systems security or cybersecurity are highly valued.
Work experience: Candidates for a PCI compliance manager role should have at least 5 years of experience working in a related field such as information security, risk management, or compliance. Candidates with experience in the payments industry, such as merchants, payment processors, or banks, are highly valued.
Professional certifications: Professional certifications such as CISSP (Certified Information Systems Security Professional), CISM (Certified Information Security Manager), or PCIP (Payment Card Industry Professional) can help to demonstrate knowledge and expertise in the PCI DSS and related areas.
Does Your Organization Need a Dedicated PCI Compliance
Manager?
Regardless of what your organization does, if it processes credit or debit card transactions, it is obligated to comply with the PCI standards. Having a PCI compliance manager can be extremely beneficial. Here are some reasons why your organization may need a dedicated PCI compliance manager:
Ensuring compliance: The PCI DSS is a complex and evolving standard, and it can be difficult to stay up-to-date on the latest requirements and changes. A PCI compliance manager can help ensure that your organization complies with the standard and can avoid penalties and other consequences of non-compliance.
Managing risk: Processing payment card transactions carry inherent risks, including the risk of security incidents such as data breaches. A PCI compliance manager can help identify and manage these security compliance risks by conducting regular risk assessments and implementing appropriate controls to mitigate potential threats.
Protecting customer data: Protecting customers' sensitive payment card data is essential for maintaining their trust and confidence in your organization. A PCI compliance manager can help ensure that your organization's payment card processing systems are secure and that customer data is properly protected.
Streamlining processes: Compliance with the PCI DSS can be a complex and time-consuming process involving multiple departments and stakeholders. A PCI compliance manager can help streamline the compliance process by coordinating efforts across departments and ensuring everyone is on the same page.
Responding to incidents: In the event of a security incident or data breach, a PCI compliance manager can help coordinate incident response and ensure that appropriate remediation measures are taken.
Conclusion
In conclusion, a PCI compliance manager is a professional responsible for ensuring that a company or organization complies with the PCI DSS. They develop and implement policies and procedures, conduct risk assessments, monitor compliance performance, and train employees on compliance issues.
The need for a PCI compliance manager depends on several factors, such as the organization's size, the scope of credit card transactions, and the organization's level of PCI compliance expertise. Ultimately, organizations that handle credit card data must take PCI compliance seriously to protect themselves and their customers from the risks of data theft and fraud.
### How to Install Apache Web Server on Fedora
Free, open-source Apache is one of the most popular web server software solutions available. It is developed and maintained by the Apache Foundation. It is used by approximately 47% of websites all over the world. It's easy to use, customizable, and designed to host dynamic websites. It is cross-platform software and can be installed on Windows, macOS, and Linux.
In this guide, we will show you how to install the Apache web server on Fedora 34.
Step 1 - Install Apache Web Server
By default, the Apache package is included in the Fedora 34 default repo. You can install it with the following command.
dnf update -y
dnf install httpd -y
After the successful installation, you can see detailed information about Apache with the following command.
rpm -qi httpd
You will get the following output.
Name : httpd
Version : 2.4.53
Release : 1.fc34
Architecture: x86_64
Install Date: Thursday 13 April 2023 10:58:31 PM
Group : Unspecified
Size : 4932592
License : ASL 2.0
Signature : RSA/SHA256, Thursday 17 March 2022 01:00:49 PM, Key ID 1161ae6945719a39
Source RPM : httpd-2.4.53-1.fc34.src.rpm
Build Date : Thursday 17 March 2022 12:43:53 PM
Build Host : buildvm-x86-27.iad2.fedoraproject.org
Packager : Fedora Project
Vendor : Fedora Project
URL : https://httpd.apache.org/
Bug URL : https://bugz.fedoraproject.org/httpd
Summary : Apache HTTP Server
Description :
The Apache HTTP Server is a powerful, efficient, and extensible
web server.
Step 2 - Manage Apache Service
By default, the Apache service is managed by systemd. You can easily start, stop and enable the Apache service via systemctl command.
To start the Apache service, run the following command.
systemctl start httpd
To enable the Apache service, run the following command.
systemctl enable httpd
To check the status of the Apache service, run the following command.
systemctl status httpd
You will get the following output.
● httpd.service - The Apache HTTP Server
Loaded: loaded (/usr/lib/systemd/system/httpd.service; disabled; vendor preset: disabled)
Active: active (running) since Thu 2023-04-13 22:58:51 EDT; 4s ago
Docs: man:httpd.service(8)
Main PID: 1539 (httpd)
Status: "Started, listening on: port 80"
Tasks: 177 (limit: 4666)
Memory: 14.2M
CPU: 99ms
CGroup: /system.slice/httpd.service
├─1539 /usr/sbin/httpd -DFOREGROUND
├─1540 /usr/sbin/httpd -DFOREGROUND
├─1541 /usr/sbin/httpd -DFOREGROUND
├─1542 /usr/sbin/httpd -DFOREGROUND
└─1543 /usr/sbin/httpd -DFOREGROUND
Apr 13 22:58:51 fedora systemd[1]: Starting The Apache HTTP Server...
To stop the Apache service, run the following command.
systemctl stop httpd
Step 3 - Access the Apache Test Page
At this point, the Apache web server is started and listening on port 80. You can verify it with the following command.
ss -antpl | grep :80
You should see the Apache listening port in the following output.
LISTEN 0 511 *:80 *:* users:(("httpd",pid=1543,fd=4),("httpd",pid=1542,fd=4),("httpd",pid=1541,fd=4),("httpd",pid=1539,fd=4))
Now, open your web browser and access the Apache test page using the URL http://your-server-ip.
Step 4 - Create and Host a Simple Website with Apache
First, create an Apache website directory using the following command.
mkdir /var/www/html/website
Next, create an index.html file:
nano /var/www/html/website/index.html
Add the following content:
Welcome to Apache Web Server
Success! Apache server on Fedora is working!
Next, set the permissions and ownership to the Apache website directory.
chown -R apache:apache /var/www/html/website
chmod -R 755 /var/www/html/website
Next, create an Apache virtual host configuration file.
nano /etc/httpd/conf.d/web.conf
Add the following configuration:
ServerName web.example.com
DocumentRoot /var/www/html/website
DirectoryIndex index.html
ErrorLog /var/log/httpd/example.com_error.log
CustomLog /var/log/httpd/example.com_requests.log combined
Save and close the file, then restart the Apache service to apply the changes.
systemctl restart httpd
Step 5 - Access Apache Website
At this point, the Apache web server is configured to serve HTML websites. You can now access it using the URL http://web.example.com. You should see your website on the following screen.
Conclusion
In this post, we showed you how to install the Apache web server on Fedora 34. We also created a simple website and host it using an Apache web server. You can now easily use Apache to host your own website on the internet. You can try Apache on dedicated server hosting from Atlantic.Net!
### Do You Need To Be HIPAA-Compliant When Selling Medical Supplies Online and Collecting Insurance Information?
The rules of HIPAA-Compliance apply to any business entity when protected health information is involved. For example, when PHI is electronically processed, stored, and managed, the physical, administrative, and technical safeguards of HIPAA compliance must apply. When it comes to selling medical supplies online or collecting insurance information, the same rules apply; if it involves PHI, the entity must be HIPAA-Compliant.
The article will break down these situations, discover when HIPAA-Compliance is needed, and learn if HIPAA applies in all circumstances. Unfortunately, these types of businesses often confuse medical professionals because the distinction between what rules apply is often unclear and difficult to comprehend in some cases.
Do You Need to Be HIPAA-Compliant When Selling Medical Supplies?
Countless online medical supply distributors sell everything you need for a hospital or medical practice. Everyday items include medical equipment such as EKG machines, Ventilators, and Dopplers. They also sell consumables like bandages, facemasks, and everyday medical kits.
Some medical devices fall under HIPAA compliance; however, if the equipment is brand new and straight from the factory, then HIPAA compliance does not apply because the equipment is brand new and has never been in touch with a patient. The complexities arise when medical supplies are traded or resold.
Nearly all medical equipment requires the healthcare professional to log on to the device; the patient's details are often required, and the equipment may locally store medical imagery, doctor's notes, and potentially various touch points for protected health information. In addition, the devices usually have an internal memory slot and often hard drives built to save vital information.
Any medical devices that transmit, receive, or record health information need to be HIPAA compliant. In addition, any data saved onto the instrument must do so with the patient's consent. The required HIPAA-compliant safeguards must involve:
Privileged Access: Only authorized and privileged should be able to log onto the medical device. Use Multi-Factor Authentication to protect it, and no shared or automated logins. All sessions must be traceable, and users should automatically log off after a few minutes.
Encryption: All data saved to the medical device must be encrypted to at least AES256 encryption standards. This will protect the data if the hard drive is removed after the medical supplier has sold it. In addition, encrypt all email communications, mainly if the email contains PHI.
Manage Patient Data: If the medical device is being resold, it is the device owner's responsibility to ensure that patient data is removed before being sold. If you cannot remove the data, regretfully, the device will need to be professionally destroyed, and a certificate of destruction is required.
NPI Number: A valid National Provider Identifier (NPI) is needed on all reseller medical devices; covered healthcare providers must use the NPIs in the administrative and financial transactions adopted under HIPAA.
FDA Approval: Many medical supplies offer specialist equipment containing laser products or other cutting-edge technology. A license is required to sell Class 1 equipment online that can be bought online, but any equipment above Class 3 requires FDA approval.
Do You Need to Be HIPAA-Compliant When Collecting Insurance Information?
The requirements of HIPAA compliance are much clearer when collecting insurance information because if any protected health information is included in the claim, then its imperative to abide by the HIPAA legislation. PHI is any information about health status, provision of health care, or payment for health care that is created or collected by a Covered Entity and can be linked to a specific individual.
Protected Information includes over 18 identifiers. These include:
Name
Address
Date of Birth
Specific Dates related to healthcare including birthdate, admission date, discharge date, date of death, and exact age if over 89
Telephone numbers
Fax number / Email address
Social Security Number
Medical record number
Health plan beneficiary number
Account numbers such as Insurance Account details
Certificate or license number
Vehicle identifiers and serial numbers, including license plate numbers
Device identifiers and serial numbers
Internet Protocol (IP) Address
Biometrics (fingerprints or optics)
Photographic image - Photographic images are not limited to pictures of the face.
Any other characteristic that could uniquely identify the individual
When collecting insurance information, almost all identifiers are used. Therefore, HIPAA compliance must apply.
How to Become HIPAA-Compliant
The best way to uphold the integrity of PHI is to outsource critical IT systems to host your Medical supply business or provide the platform for collecting insurance information. HIPAA regulations are extensive and require significant investment to be achieved. Outsourcing removes the overwhelming majority of these concerns.
To summarize the complexity of becoming HIPAA compliant, here are some of the mandatory and advisory requirements of HIPAA.
Network layer encryption to NIST cryptographic standards.
Centrally managed access controls with MFA.
Identity and authenticate all sources of PHI.
Encrypt all endpoint devices, including medical devices.
Detailed activity auditing, such as SEIM
All touchpoints must feature automated logoff
The hosting location (data center) requires controlled access measures.
All user workstations must limit access to health data.
Mobile devices must restrict access to health data.
All items must be traceable (inventory)
A risk assessment is needed to identify weak touchpoints.
Risk assessment is an ongoing process.
Train employees on all PHI access protocols.
Employees must know what can and cannot be shared.
Achieve ongoing business continuity.
Test your contingency planning.
Block unauthorized access.
Document all security incidents.
Respond promptly to patient access requests.
An NPP is required to inform patients of data-sharing policies.
Atlantic.Net is an award-winning HIPAA-compliant hosting provider with over 25 years of experience, providing world-class hosting solutions to leading healthcare clients.
Atlantic.Net operates SSAE 18 SOC 2 and SOC2 audited and certified hosting solutions to meet the advanced IT needs of businesses. In addition, we are proud of our HIPAA-compliant hosting, HITECH, and PCI-ready options.
Contact our sales team today to find out how Atlantic.Net can help your organization meet and exceed HIPAA requirements with a managed or unmanaged hosting solution customized to meet your business's needs.
Learn more about our HIPAA-compliant web hosting and HIPAA cloud hosting solutions.
### Best Use of the Cloud in a Multi-Cloud Environment
Large enterprise businesses sometimes invest and develop a multi-cloud strategy that spans cloud services across multiple providers and often on-premises infrastructure.
A multi-cloud setup might be considered a romantic idea that is hard to achieve, so businesses often choose relevant services from various cloud providers to create a resilient service mesh.
Why Choose Multi-Cloud?
Multi-cloud is adopted to improve infrastructure resilience, meet compliance demands, reduce the chances of downtime, and diminish any concerns around vendor lock-in.
Although your multi-cloud journey may include backups, disaster recovery, or isolating applications, every business uses multi-cloud differently.
Multi-cloud environments introduce significant challenges surrounding their management and implementation. For example, data governance has added complexity because data is located at various touch points within different cloud providers. In addition, multi-cloud is expensive, and it requires having experienced technical teams that are skilled in multiple cloud vendors.
There are numerous pros and cons to having a multi-cloud strategy. This article will discover the best use of the cloud in a multi-cloud environment.
More Than Just Public and Private: What Is Multi-Cloud?
Multi-cloud is precisely what it sounds like; it is when businesses leverage multiple public and private clouds. But what exactly does that mean? Of course, the public cloud is any publicly available cloud provider, including the heavyweight providers AWS, Google Cloud, and Azure. But other providers, including Atlantic.Net, are a genuine alternative to the hyper-scale providers.
“Private cloud” is a name often given to non-public shared hosting environments. For businesses, this is hosting at a colocation; perhaps it is a virtual cloud running on VMware or OpenStack. On the other hand, it may be an on-premise hybrid stack that connects directly to the cloud, such as AWS Outposts, Azure Stack, and Google Anthos.
A multi-cloud configuration is desirable for many reasons:
Introduce Low Latency: It doesn't matter how big the cloud provider is; not all cloud providers have a point of presence in the parts of the world where your customers are located. A good example might be a European or American company serving customers in China, the Middle East, Australasia, and regions of East Asia. Customers may choose to leverage providers with a strong presence in these areas.
Offer A Better User Experience: Being closer to your customers will result in a much faster connection and response for the customer, improving the user experience dramatically.
Keep Sensitive Data On-Premise: Many businesses have compliance requirements that enforce data sovereignty because some personal data is too important to be allowed in the public realm, typically information the government keeps on you. To combat this problem, a multi-cloud configuration enables you to use the power of the cloud while keeping sensitive data onsite.
Automate Tasks: To be an efficient and influential player in a multi-cloud world, automation must be embedded within your organization. It's much easier to manage and secure a multi-cloud platform using infrastructure as code than attempting to manage manually. Combining IAC and having some control plane allows engineers, operators, and developers to have a simple way to deploy resources throughout every cloud ecosystem.
Increase Visibility: It's critical to have a holistic view of the multi-cloud infrastructure; this is commonly achieved using Grafana and Prometheus. Monitoring tools like these are vendor agnostic and widely used.
Multi-Cloud Use Cases
How multi-cloud configurations are used varies from customer to customer. Multi-cloud helps businesses reuse infrastructure assets they have already procured and provides cost-effective options. But there are five everyday use cases Atlantic.Net engineers witness.
Tiered/Layered Applications: This approach is used by businesses looking for global-scale resilience. Applications, particularly those running in containers or Kubernetes, are the scale between providers. A Kubernetes stack will happily scale across service providers by providing rapid and resilient networking.
Partitioned Application: Partitioned apps are usually servers that operate independently but as part of a stack. You might run the frontend in AWS and the backend and midtier in Atlantic.Net. This approach lowers the risk of downtime.
Edge Computing: Multi-cloud users can create a central control plane at the network edge that reduces application load and improves performance.
Analytics: A Multi-cloud setup is perfect for data analytics; heavy transactions are processed on-premises to improve performance and lower costs, and cloud-native services, such as AI and managed data lakes, are offloaded to the cloud.
Bursting: Bursting happens when a business uses private servers; however, workloads are burst to run in the cloud to improve processing time. This setup is popular with Big Pharma businesses that need intense CPU cycles to process massive datasets quickly.
Obstacles to Overcome
Multi-cloud is still reserved for the most prominent companies with deep pockets, and there are several obstacles to overcome even to consider multi-cloud as a viable option. First, to avoid an administration headache, the business should have single sign-on (SSO) enabled; this allows users and engineers to log into all environments with a single username, password, and MFA credential.
Unified cloud security posture management (CSPM) is needed for multi-cloud environments. Tools like CloudStrike and Checkpoint are designed to identify misconfiguration issues and compliance risks. Additionally, infrastructure as code is required for security compliance and infrastructure deployment across vendors to manage everything.
Make Atlantic.Net Part Of Your Multi-Cloud Strategy
Atlantic.Net provides world-class hosting services, including virtual private servers, dedicated hosting, HIPAA hosting, and more. Our custom cloud platform is robust and user-friendly. Why not experiment with it as part of your multi-cloud strategy? You can spin our 1-click applications in under 30 seconds from the intuitive cloud management portal.
### How to Install Apache with Nginx as a Reverse Proxy on Arch Linux
A reverse proxy is an intermediate server that sits between clients and web servers. It serves as a front-end and is responsible for handling all client requests and forwarding them to the backend server. For better privacy and security, you may need to implement a reverse proxy in front of a web server.
Apache and Nginx both are very popular open-source web servers used by thousands of users worldwide. Nginx hosts static websites, proxy servers, and caching servers. While Apache is used to host dynamic websites, you can also configure Nginx as a reverse proxy for Apache webserver to get advantages of both web servers.
In this post, we will show you how to configure Nginx as a reverse proxy for the Apache web servers on Arch Linux.
Step 1 - Configure Repository
By default, the default repository is outdated in Arch Linux, so you will need to modify the default mirror list. You can do it by editing the mirror list configuration file:
nano /etc/pacman.d/mirrorlist
Remove all lines and add the following lines:
## Score: 0.7, United States
Server = http://mirror.us.leaseweb.net/archlinux/$repo/os/$arch
## Score: 0.8, United States
Server = http://lug.mtu.edu/archlinux/$repo/os/$arch
Server = http://mirror.nl.leaseweb.net/archlinux/$repo/os/$arch
## Score: 0.9, United Kingdom
Server = http://mirror.bytemark.co.uk/archlinux/$repo/os/$arch
## Score: 1.5, United Kingdom
Server = http://mirrors.manchester.m247.com/arch-linux/$repo/os/$arch
Server = http://archlinux.dcc.fc.up.pt/$repo/os/$arch
## Score: 6.6, United States
Server = http://mirror.cs.pitt.edu/archlinux/$repo/os/$arch
## Score: 6.7, United States
Server = http://mirrors.acm.wpi.edu/archlinux/$repo/os/$arch
## Score: 6.8, United States
Server = http://ftp.osuosl.org/pub/archlinux/$repo/os/$arch
## Score: 7.1, India
Server = http://mirror.cse.iitk.ac.in/archlinux/$repo/os/$arch
## Score: 10.1, United States
Server = http://mirrors.xmission.com/archlinux/$repo/os/$arch
Save and close the file, then update all the package indexes with the following command:
pacman -Syu
Step 2 - Install Apache Web Server
First, open your terminal and install the Apache package with the following command.
pacman -S apache
After successful installation, start and enable the Apache service with the following command.
systemctl start httpd
systemctl enable httpd
You can also verify the Apache status using the following command.
systemctl status httpd
Output.
● httpd.service - Apache Web Server
Loaded: loaded (/usr/lib/systemd/system/httpd.service; disabled; preset: disabled)
Active: active (running) since Sun 2023-03-26 05:46:34 UTC; 3min 7s ago
Main PID: 14223 (httpd)
Tasks: 9 (limit: 4685)
Memory: 45.5M
CPU: 207ms
CGroup: /system.slice/httpd.service
├─14223 /usr/bin/httpd -k start -DFOREGROUND
├─14224 /usr/bin/httpd -k start -DFOREGROUND
├─14225 /usr/bin/httpd -k start -DFOREGROUND
├─14226 /usr/bin/httpd -k start -DFOREGROUND
├─14227 /usr/bin/httpd -k start -DFOREGROUND
├─14228 /usr/bin/httpd -k start -DFOREGROUND
├─14231 /usr/bin/httpd -k start -DFOREGROUND
├─14232 /usr/bin/httpd -k start -DFOREGROUND
└─14233 /usr/bin/httpd -k start -DFOREGROUND
Mar 26 05:46:34 archlinux systemd[1]: Started Apache Web Server.
Step 3 - Configure Apache as a Backend Server
By default, Apache listens on port 80. To configure Apache as a backend server, you will need to change the Apache default port. You can change it by editing the Apache main configuration file.
nano /etc/httpd/conf/httpd.conf
Change the following line.
Listen 8000
Save and close the file, then restart the Apache service to implement the changes.
systemctl restart httpd
You can now check the Apache listening port using the following command.
ss -antpl | grep httpd
You should see the new Apache port in the following output.
LISTEN 0 511 *:8000 *:* users:(("httpd",pid=14233,fd=4),("httpd",pid=14232,fd=4),("httpd",pid=14231,fd=4),("httpd",pid=14228,fd=4),("httpd",pid=14227,fd=4),("httpd",pid=14226,fd=4),("httpd",pid=14225,fd=4),("httpd",pid=14224,fd=4),("httpd",pid=14223,fd=4))
Step 4 - Create a Simple Page for Apache
Next, you will need to create a simple HTML page to test the Apache server. You can create it with the following command.
nano /srv/http/index.html
Add the following code:
Welcome
Welcome to Apache Web Server
Save and close the file when you are done.
Step 5 - Install and Configure Nginx as a Reverse Proxy
First, install the Nginx package using the following command.
pacman -S nginx-mainline
After installing Nginx, start and enable the Nginx service using the following command.
systemctl start nginx
systemctl enable nginx
Next, create a directory to store Nginx virtual host.
mkdir /etc/nginx/sites-enabled
Next, create an Nginx configuration file to forward traffic to the Apache backend server.
nano /etc/nginx/sites-enabled/apache.conf
Add the following configuration.
upstream apache_backend {
server localhost:8000;
}
server {
listen 80;
server_name apache.example.com;
location / {
proxy_pass http://apache_backend/;
proxy_http_version 1.1;
proxy_set_header Upgrade $http_upgrade;
proxy_set_header Connection "upgrade";
proxy_set_header Host $http_host;
proxy_set_header X-Real-IP $remote_addr;
proxy_set_header X-Forward-For $proxy_add_x_forwarded_for;
proxy_set_header X-Forward-Proto http;
proxy_set_header X-Nginx-Proxy true;
proxy_redirect off;
}
}
Save and close the file, then edit the Nginx configuration file.
nano /etc/nginx/nginx.conf
Add the following lines after http{:
server_names_hash_bucket_size 64;
include sites-enabled/*;
Save the file when you are done. Then, verify the Nginx configuration.
nginx -t
You will see the following output.
nginx: the configuration file /etc/nginx/nginx.conf syntax is ok
nginx: configuration file /etc/nginx/nginx.conf test is successful
Next, restart the Nginx service to implement the changes.
systemctl restart nginx
Step 6 - Verify Nginx Proxy
At this point, Nginx is installed and configured to forward traffic to the Apache backend server. You can test it using the URL http://apache.example.com in your web browser. You should see the Apache backend page on the following screen.
Conclusion
In this tutorial, you learned how to configure Nginx as a reverse proxy for the Apache web server. You can use this guide to implement this setup in the production environment. Try this setup on dedicated server hosting from Atlantic.Net!
### Top 9 Best Software as a Service Solutions Based Outside the USA in 2025
The software as a Service (SaaS) industry is booming and shows no signs of slowing down. By 2032, Precedence Research predicts that the SaaS market will reach $1 trillion. Are you looking for the best software as a service? There are countless available cloud-based SaaS solutions available to your business.
The United States leads the way in SaaS technology businesses and startups, and all major enterprise-scale SaaS solutions are American companies. However, what else is out there? Europe, Asia, and the rest of the world have some outstanding tech companies making waves in the industry.
So who are the best SaaS companies outside of the USA in 2025? This article will look at the most exciting and innovative SaaS platforms to keep an eye on over the next few years.
1. Seedata.io (London, United Kingdom)
Seedata.io is a software-as-a-service company that offers a wide range of cybersecurity products and services designed to protect cloud workloads. Their products include a cloud-based platform for managing projects, a marketplace for selling software applications, and a suite of cybersecurity developer tools.
Seedata.io is headquartered in London, England, and has a team of over 80 employees. Their products have been praised for their ease of use and ability to streamline development. Some advantages of using Seedata.io include that their products are cloud exclusive and have a customer base comprising some of the world's largest companies.
Seedata is a platform that integrates with existing cloud services and can detect data leakage, provide control assurances over your data, and send notifications to alerts if 3rd Parties mishandle sensitive data.
2. BCN3D (Barcelona, Spain)
BCN3D is a product development SaaS startup that helps users plan, build and ship their products. It provides a centralized platform connecting the different product lifecycle parts. In addition, you can manage your contracts and access third-party design, manufacturing, or outsourcing tools.
BCN3D specializes in robotics and 3D printing at scale, but also provides two SaaS platforms that manage the entire ecosystem, BCN3D Cloud and BCN3D Stratos. Their SaaS tools manage digital libraries and print queues, categorizing 3D printing resources and taking automated actions based on usage or alerts.
3. Campaign Monitor (Sydney, Australia)
Campaign Monitor is a leading software-as-a-service (SaaS) provider that ensures effective digital marketing campaigns. With a strong focus on Australia and supporting local languages, Campaign Monitor offers a variety of products and services to help businesses of all sizes achieve their marketing objectives.
Some key benefits of using Campaign Monitor include easy-to-use tools and templates, comprehensive reporting, and a wide range of integrations with other popular software. As a result, businesses can save time and money while still achieving high levels of success with their marketing campaigns.
4. Aditus (Porto, Portugal)
Aditus provides a SaaS platform that helps businesses to manage their websites and ad campaigns but does it with customer accessibility at the forefront of the design decision. There are more than one billion people with disabilities worldwide, and Aditus was created to provide simple yet detailed accessibility testing for the disabled audience.
It helps you to perform advanced campaigns, accurate advertisement targeting, and website optimization. Aditus is also helpful for all types of traders by allowing you to manage all your campaigns in a single platform. Besides, it offers bid management, ad creation, audience management, campaign management, and data segmentation.
5. Payvoice (Vancouver, Canada)
Payvoice is a platform that allows you to accept payments from your clients using your own website and the global stripe payment system. It is popular with eCommerce and online store owners that need quotes and invoice service, pricing pages, and detailed information about sales conversions.
Alternatively, with Payvoice, you can even accept payments from your clients through mobile apps and websites, and Payvoice is quickly becoming a viable alternative to the market leader, PayPal.
6. FreshBooks (Canada)
FreshBooks is one of the Top 10 SaaS Companies in the world. This Canadian company offers a cloud-based accounting system that works in real-time so that you can access your data anytime and anywhere. It has over 10 million customers worldwide, with over 60,000 companies and over 400,000 US businesses using its cloud accounting solution.
FreshBooks is a subscription-based SaaS platform that features invoicing, accounts payable, expense tracking, time tracking, retainers, fixed asset depreciation, purchase orders, payroll integrations, mileage tracking, double-entry accounting, and many more.
7. Mable (Melbourne, Australia)
Mable is an online software-as-a-service company based in Melbourne, Australia. They offer a wide range of products, including a CRM and email marketing platform, as well as a range of business tools that allow users to search for caregivers, book appointments, and take payments.
Mable targets users who need domestic help, nursing, social support, personal care, travel assistance, independent living, therapy support, and work support. Support workers can create their profiles on the platform to get appointments.
8. Authlete (Tokyo, Japan)
Authlete is a highly respected software-as-a-service provider based in Japan. They offer a wide range of products, including a cloud-based platform for managing and collaborating on projects and a suite of tools for managing and tracking customer data. Their flagship product is a middleware that controls SSO sign-on to any application that supports OAuth authorization servers and OpenID Connect identity providers.
Any application you run can integrate with your company directory service and remain compliant with MFA authentication. This is useful because only some people use Azure AD, on-premise Active Directory, or LDAP. The advantages of using Authlete's products include the company's experience and expertise in the SaaS market, its global reach, and its commitment to customer service and support.
9. Babbel (Berlin, Germany)
Babbel is a software-as-a-service company that provides language learning tools to students, businesses, and professionals. It was founded in Berlin, Germany, in 2007 and has since expanded to offer various products, including a translation service, a transcription service, and a learning platform.
Babbel's language learning tools are some of the best in the market, and its translation service is particularly valued. The transcription service is also popular, citing its accuracy and speed as advantages. Babbel's learning platform is also well-regarded, with users citing its ease of use and comprehensive features as advantages. Best of all, Babbel offers a subscription plan that makes it highly affordable.
How Can Atlantic.Net Help?
Implementing an effective SaaS platform will help your business streamline its efficiency, boosting productivity and sales and improving customer service. Once you have chosen a leading cloud SaaS solution, you should consider partnering with an industry-leading web hosting provider, such as Atlantic.Net.
As a leading cloud computing provider, Atlantic.Net is uniquely capable of meeting your company's or organization's needs. We have more than 30 years of experience in the industry and are driven to provide a customized solution to meet your requirements. Contact our sales team today for more information on the solutions we offer!
### How to Install AzuraCast Radio Management Suite on Arch Linux
AzuraCast is a free, open-source, and self-hosted radio station suite that lets you get a web radio station up and running in minutes. It comes with a powerful and intuitive interface that helps you manage every aspect of your radio station via a web browser. You can perform several tasks such as uploading media, managing playlists, and creating local mount points and remote relays via a web-based interface. AzureCast supports remote relays that broadcast your radio signal to any remote server on Icecast.
In this post, we will show you how to install AzuraCast Web Radio Management Suite on Arch Linux.
Step 1 - Configure Repository
By default, the default repository is outdated in Arch Linux, so you will need to modify the default mirror list. You can do it by editing the mirror list configuration file:
nano /etc/pacman.d/mirrorlist
Remove all lines and add the following lines:
## Score: 0.7, United States
Server = http://mirror.us.leaseweb.net/archlinux/$repo/os/$arch
## Score: 0.8, United States
Server = http://lug.mtu.edu/archlinux/$repo/os/$arch
Server = http://mirror.nl.leaseweb.net/archlinux/$repo/os/$arch
## Score: 0.9, United Kingdom
Server = http://mirror.bytemark.co.uk/archlinux/$repo/os/$arch
## Score: 1.5, United Kingdom
Server = http://mirrors.manchester.m247.com/arch-linux/$repo/os/$arch
Server = http://archlinux.dcc.fc.up.pt/$repo/os/$arch
## Score: 6.6, United States
Server = http://mirror.cs.pitt.edu/archlinux/$repo/os/$arch
## Score: 6.7, United States
Server = http://mirrors.acm.wpi.edu/archlinux/$repo/os/$arch
## Score: 6.8, United States
Server = http://ftp.osuosl.org/pub/archlinux/$repo/os/$arch
## Score: 7.1, India
Server = http://mirror.cse.iitk.ac.in/archlinux/$repo/os/$arch
## Score: 10.1, United States
Server = http://mirrors.xmission.com/archlinux/$repo/os/$arch
Save and close the file, then update all the package indexes with the following command:
pacman -Syu
Step 2 - Install Docker
The AzuraCastsuite is available as a Docker container, so Docker and Docker Compose packages must be installed on your server. If not installed, you can install both by running the following command.
pacman -S docker docker-compose
Once Docker is installed, enable the Docker service to start at system reboot.
systemctl enable docker
Next, restart your system to apply the system.
reboot
After the successful restart, you can verify the Docker status using the following command.
systemctl status docker
Step 3 - Install AzuraCast
First, create a directory to store AzuraCast configuration files.
mkdir -p /var/azuracast
Next, navigate to the AzuraCast directory and download the AzuraCast installation script.
cd /var/azuracast
curl -fsSL https://raw.githubusercontent.com/AzuraCast/AzuraCast/main/docker.sh > docker.sh
Next, set executable permissions on the downloaded file.
chmod a+x docker.sh
Next, start the AzuraCast installation using the following command.
./docker.sh install
You will be asked to switch to the stable release channel.
Checking installation requirements for AzuraCast...
[PASS] Operating System: Linux
[PASS] Architecture: x86_64
[PASS] Command Present: curl
[PASS] Command Present: awk
[PASS] User Permissions
[PASS] Installation Directory
[PASS] All requirements met!
Docker is already installed! Continuing...
Docker Compose is already installed. Continuing...
Your current release channel is 'Rolling Release'. Switch to 'Stable' release channel? [y/N] N
Type N and press the Enter key. You will be asked to select the language.
Select Language [English (Default)]:
[en_US] English (Default)
[cs_CZ] čeština
[de_DE] Deutsch
[es_ES] Español
[fr_FR] Français
[el_GR] ελληνικά
[it_IT] Italiano
[hu_HU] magyar
[nl_NL] Nederlands
[pl_PL] Polski
[pt_PT] Português
[pt_BR] Português do Brasil
[ru_RU] Русский язык
[sv_SE] Svenska
[tr_TR] Türkçe
[zh_CN] 簡化字
[ko_KR] 한국어
>
Just press the Enter key to select the English language. You will be asked to use a custom port.
AzuraCast Installer
===================
Welcome to AzuraCast! Complete the initial server setup by answering a few questions.
AzuraCast is currently configured to listen on the following ports:
* HTTP Port: 80
* HTTPS Port: 443
* SFTP Port: 2022
* Radio Ports: 8000,8005,8006,8010,8015,8016,8020,8025,8026,8030,8035,8036,8040,8045,8046,8050,8055,8056,8060,8065,8066,8070,8075,8076,8090,8095,8096,8100,8105,8106,8110,8115,8116,8120,8125,8126,8130,8135,8136,8140,8145,8146,8150,8155,8156,8160,8165,8166,8170,8175,8176,8180,8185,8186,8190,8195,8196,8200,8205,8206,8210,8215,8216,8220,8225,8226,8230,8235,8236,8240,8245,8246,8250,8255,8256,8260,8265,8266,8270,8275,8276,8280,8285,8286,8290,8295,8296,8300,8305,8306,8310,8315,8316,8320,8325,8326,8330,8335,8336,8340,8345,8346,8350,8355,8356,8360,8365,8366,8370,8375,8376,8380,8385,8386,8390,8395,8396,8400,8405,8406,8410,8415,8416,8420,8425,8426,8430,8435,8436,8440,8445,8446,8450,8455,8456,8460,8465,8466,8470,8475,8476,8480,8485,8486,8490,8495,8496
Customize ports used for AzuraCast? (yes/no) [no]:
>
Just press the Enter key to use the default ports. You will be asked to enable the custom plugins.
Enable Custom Code Plugins (yes/no) [no]:
>
Press the Enter key to enable the default plugins. You will be asked to enable the web-based Docker image updates.
Enable web-based Docker image updates (yes/no) [yes]:
>
Press the Enter key to use the default option. Once the installation has been completed, you should see the following output.
Writing configuration files...
Restarting all radio stations...
--------------------------------
0 [▓░░░░░░░░░░░░░░░░░░░░░░░░░░░]
[OK] AzuraCast installation complete!
Visit http://209.23.10.234 to complete setup.
[+] Running 2/2
✔ Container azuracast_updater Started 0.7s
✔ Container azuracast Started 4.7s
Step 4 - Access AzuraCast Web UI
Now, open your web browser and access AzuraCast using the URL http://your-server-IP. You should see the AzuraCast Setup page.
Set your email address, and password then click on the CREATE ACCOUNT. You should see the"Create a radio station" page.
Provide your radio station information and click on the CREATE AND CONTINUE. You should see the "Customize AzuraCast" page.
Define all settings and click on SAVE AND CONTINUE. You should see the following page.
Click on the MANAGE button. You should see the following page.
Click on the Music Files. You should see the following page.
Click on the SELECT FILES to upload any MP3 file to AzuraCast. Once the file is added, you should see the following page.
You can now add these uploaded files to your playlist and start playing it via a web browser.
Conclusion
In this post, we explained how to install the AzuraCast radio station management tool on Arch Linux. You can now easily set up your own online radio station using AzuraCast. You can now try to set up AzuraCast on dedicated server hosting from Atlantic.Net!
### How to Install Bitwarden Password Manager on Arch Linux
Bitwarden is a fast, open-source password management solution trusted by millions of users worldwide. It stores all your passwords and sensitive information in an encrypted vault. You can store and manage all your login credentials in a central location and sync them across all devices. Bitwarden offers a client application for mobile, desktop, browser extensions, command line interface, and web interface.
In this post, we will show you how to install the Bitwarden password manager on Arch Linux.
Step 1 - Configure Repository
By default, the default repository is outdated in Arch Linux, so you will need to modify the default mirror list. You can do it by editing the mirror list configuration file:
nano /etc/pacman.d/mirrorlist
Remove all lines and add the following lines:
## Score: 0.7, United States
Server = http://mirror.us.leaseweb.net/archlinux/$repo/os/$arch
## Score: 0.8, United States
Server = http://lug.mtu.edu/archlinux/$repo/os/$arch
Server = http://mirror.nl.leaseweb.net/archlinux/$repo/os/$arch
## Score: 0.9, United Kingdom
Server = http://mirror.bytemark.co.uk/archlinux/$repo/os/$arch
## Score: 1.5, United Kingdom
Server = http://mirrors.manchester.m247.com/arch-linux/$repo/os/$arch
Server = http://archlinux.dcc.fc.up.pt/$repo/os/$arch
## Score: 6.6, United States
Server = http://mirror.cs.pitt.edu/archlinux/$repo/os/$arch
## Score: 6.7, United States
Server = http://mirrors.acm.wpi.edu/archlinux/$repo/os/$arch
## Score: 6.8, United States
Server = http://ftp.osuosl.org/pub/archlinux/$repo/os/$arch
## Score: 7.1, India
Server = http://mirror.cse.iitk.ac.in/archlinux/$repo/os/$arch
## Score: 10.1, United States
Server = http://mirrors.xmission.com/archlinux/$repo/os/$arch
Save and close the file, then update all the package indexes with the following command:
pacman -Syu
Step 2 - Install Docker
Bitwarden can be installed using Docker, so Docker and Docker Compose packages must be installed on your server. If not installed, you can install both by running the following command.
pacman -S docker docker-compose
Once Docker is installed, enable the Docker service to start at system reboot.
systemctl enable docker
Next, restart your system to apply the system.
reboot
Step 3 - Install Bitwarden
First, download the Bitwarden installation script using the following command.
curl -Lso bitwarden.sh https://go.btwrdn.co/bw-sh
Next, set executable permissions on the downloaded file.
chmod +x bitwarden.sh
Now, run the downloaded script to start the installation.
./bitwarden.sh install
You will be asked to define your domain or IP address, select Let's Encrypt SSL and database as shown below:
_ _ _ _
| |__ (_) |___ ____ _ _ __ __| | ___ _ __
| '_ \| | __\ \ /\ / / _` | '__/ _` |/ _ \ '_ \
| |_) | | |_ \ V V / (_| | | | (_| | __/ | | |
|_.__/|_|\__| \_/\_/ \__,_|_| \__,_|\___|_| |_|
Open source password management solutions
Copyright 2015-2023, 8bit Solutions LLC
https://bitwarden.com, https://github.com/bitwarden
===================================================
bitwarden.sh version 2023.3.0
Docker version 23.0.1, build a5ee5b1dfc
Docker Compose version 2.17.0
(!) Enter the domain name for your Bitwarden instance (ex. bitwarden.example.com): 104.219.55.77
(!) Do you want to use Let's Encrypt to generate a free SSL certificate? (y/n): n
(!) Enter the database name for your Bitwarden instance (ex. vault): vault
Answer all the questions then press the Enter key. You will be asked to provide your Bitwarden installation id and key:
2023.3.0: Pulling from bitwarden/setup
3f9582a2cbe7: Pull complete
d866aec6058e: Pull complete
11332129480d: Pull complete
9f9b514859b0: Pull complete
b709e83c5e9e: Pull complete
1f8900615ea1: Pull complete
47137b35c8bf: Pull complete
b7b87e36a4d9: Pull complete
223d50917a39: Pull complete
23ee09621502: Pull complete
Digest: sha256:e09da2acdedd62819dd1fe774935d1a215058244cc6e1c18203bb65cf845f70c
Status: Downloaded newer image for bitwarden/setup:2023.3.0
docker.io/bitwarden/setup:2023.3.0
(!) Enter your installation id (get at https://bitwarden.com/host): Installation ID
(!) Enter your installation key: Installation Key
Provide your installation ID and key and press the Enter key. You will be asked for SSL certificates.
(!) Do you have a SSL certificate to use? (y/n): n
(!) Do you want to generate a self-signed SSL certificate? (y/n): y
Choose your preferred options and press the Enter key. Once the installation is completed, you will get the following output.
Generating self signed SSL certificate.
Generating a RSA private key
....................................++++
.................................................++++
writing new private key to '/bitwarden/ssl/self/104.219.55.77/private.key'
-----
Generating key for IdentityServer.
Generating a RSA private key
..............................++++
........++++
writing new private key to 'identity.key'
-----
Building nginx config.
Building docker environment files.
Building docker environment override files.
Building FIDO U2F app id.
Building docker-compose.yml.
Installation complete
If you need to make additional configuration changes, you can modify
the settings in `./bwdata/config.yml` and then run:
`./bitwarden.sh rebuild` or `./bitwarden.sh update`
Next steps, run:
`./bitwarden.sh start`
Step 4 - Start the Bitwarden
After successful installation, you can start the Bitwarden using the following command.
./bitwarden.sh start
If everything is fine, you will get the following output.
[+] Running 89/11
✔ events 5 layers [⣿⣿⣿⣿⣿] 0B/0B Pulled 28.3s
✔ identity 5 layers [⣿⣿⣿⣿⣿] 0B/0B Pulled 41.9s
✔ icons 5 layers [⣿⣿⣿⣿⣿] 0B/0B Pulled 39.2s
✔ notifications 5 layers [⣿⣿⣿⣿⣿] 0B/0B Pulled 31.7s
✔ web 11 layers [⣿⣿⣿⣿⣿⣿⣿⣿⣿⣿⣿] 0B/0B Pulled 30.5s
✔ nginx 15 layers [⣿⣿⣿⣿⣿⣿⣿⣿⣿⣿⣿⣿⣿⣿⣿] 0B/0B Pulled 10.2s
✔ mssql 9 layers [⣿⣿⣿⣿⣿⣿⣿⣿⣿] 0B/0B Pulled 82.1s
✔ api 9 layers [⣿⣿⣿⣿⣿⣿⣿⣿⣿] 0B/0B Pulled 11.2s
✔ sso 5 layers [⣿⣿⣿⣿⣿] 0B/0B Pulled 17.7s
✔ attachments 4 layers [⣿⣿⣿⣿] 0B/0B Pulled 27.5s
✔ admin 5 layers [⣿⣿⣿⣿⣿] 0B/0B Pulled 40.0s
[+] Running 13/13
✔ Network docker_default Created0.0s
✔ Network docker_public Created0.1s
✔ Container bitwarden-attachments Started2.4s
✔ Container bitwarden-sso Started4.9s
✔ Container bitwarden-mssql Started1.0s
✔ Container bitwarden-web Started1.8s
✔ Container bitwarden-identity Started4.0s
✔ Container bitwarden-notifications Started4.2s
✔ Container bitwarden-api Started4.9s
✔ Container bitwarden-events Started4.8s
✔ Container bitwarden-icons Started4.7s
✔ Container bitwarden-admin Started4.7s
✔ Container bitwarden-nginx Started6.6s
2023.3.0: Pulling from bitwarden/setup
Digest: sha256:e09da2acdedd62819dd1fe774935d1a215058244cc6e1c18203bb65cf845f70c
Status: Image is up to date for bitwarden/setup:2023.3.0
docker.io/bitwarden/setup:2023.3.0
Bitwarden is up and running!
===================================================
visit http://104.219.55.77
to update, run `./bitwarden.sh updateself` and then `./bitwarden.sh update`
You can now verify the Bitwarden container status with the following command.
docker ps
You should see the following output.
CONTAINER ID IMAGE COMMAND CREATED STATUS PORTS NAMES
158a32601c48 bitwarden/nginx:2023.3.0 "/entrypoint.sh" 24 seconds ago Up 17 seconds (health: starting) 80/tcp, 0.0.0.0:80->8080/tcp, :::80->8080/tcp, 0.0.0.0:443->8443/tcp, :::443->8443/tcp bitwarden-nginx
ff726721653e bitwarden/admin:2023.3.0 "/entrypoint.sh" 24 seconds ago Up 19 seconds (health: starting) 5000/tcp bitwarden-admin
82165ad0a2fb bitwarden/attachments:2023.3.0 "/entrypoint.sh" 24 seconds ago Up 22 seconds (health: starting) bitwarden-attachments
b066cc257c91 bitwarden/web:2023.3.0 "/entrypoint.sh" 24 seconds ago Up 22 seconds (health: starting) bitwarden-web
3556668964b6 bitwarden/notifications:2023.3.0 "/entrypoint.sh" 24 seconds ago Up 20 seconds (health: starting) 5000/tcp bitwarden-notifications
4d283de21017 bitwarden/identity:2023.3.0 "/entrypoint.sh" 24 seconds ago Up 20 seconds (health: starting) 5000/tcp bitwarden-identity
e46b0bc8fbf5 bitwarden/api:2023.3.0 "/entrypoint.sh" 24 seconds ago Up 19 seconds (health: starting) 5000/tcp bitwarden-api
50409251986e bitwarden/mssql:2023.3.0 "/entrypoint.sh" 24 seconds ago Up 23 seconds (health: starting) bitwarden-mssql
83b214e36cd7 bitwarden/events:2023.3.0 "/entrypoint.sh" 24 seconds ago Up 19 seconds (health: starting) 5000/tcp bitwarden-events
e5090c0b53e2 bitwarden/sso:2023.3.0 "/entrypoint.sh" 24 seconds ago Up 19 seconds (health: starting) 5000/tcp bitwarden-sso
cc449cb26fb8 bitwarden/icons:2023.3.0 "/entrypoint.sh" 24 seconds ago Up 19 seconds (health: starting) 5000/tcp
Step 5 - Access Bitwarden Web UI
At this point, Bitwarden is started and listening on port 80. You can access it using the URL https://your-server-ip. You should see the Bitwarden login page.
Click on the Create account page. You should see the following page.
Define your email, username, and password, and click on the Create account button. You should see your login screen.
Provide your master password and click on Login with master password. You should see the Bitwarden dashboard on the following screen.
Conclusion
In this post, you learned how to install the Bitwarden password manager on Arch Linux. You can now implement Bitwarden in your organization and start managing all credentials from a central location. You can try to install Bitwarden password manager on dedicated server hosting from Atlantic.Net!
### How to install GitLab with Docker and Docker Compose on Arch Linux
GitLab is an open-source DevOps and DevSecOps platform and code repository. It is designed for large DevOps and DevSecOps projects and offers online code storage and capabilities for issue tracking and CI/CD. GitLab helps organizations speed up software development by delivering software faster and more efficiently. One of the significant advantages of GitLab is that it allows developers to collaborate in every project phase, automate the entire DevOps lifecycle, and achieve the best possible results.
This post will show you how to install GitLab with Docker on Arch Linux.
Step 1 - Configure Repository
By default, the default repository is outdated in Arch Linux, so you will need to modify the default mirror list. You can do it by editing the mirror list configuration file:
nano /etc/pacman.d/mirrorlist
Remove all lines and add the following lines:
## Score: 0.7, United States
Server = http://mirror.us.leaseweb.net/archlinux/$repo/os/$arch
## Score: 0.8, United States
Server = http://lug.mtu.edu/archlinux/$repo/os/$arch
Server = http://mirror.nl.leaseweb.net/archlinux/$repo/os/$arch
## Score: 0.9, United Kingdom
Server = http://mirror.bytemark.co.uk/archlinux/$repo/os/$arch
## Score: 1.5, United Kingdom
Server = http://mirrors.manchester.m247.com/arch-linux/$repo/os/$arch
Server = http://archlinux.dcc.fc.up.pt/$repo/os/$arch
## Score: 6.6, United States
Server = http://mirror.cs.pitt.edu/archlinux/$repo/os/$arch
## Score: 6.7, United States
Server = http://mirrors.acm.wpi.edu/archlinux/$repo/os/$arch
## Score: 6.8, United States
Server = http://ftp.osuosl.org/pub/archlinux/$repo/os/$arch
## Score: 7.1, India
Server = http://mirror.cse.iitk.ac.in/archlinux/$repo/os/$arch
## Score: 10.1, United States
Server = http://mirrors.xmission.com/archlinux/$repo/os/$arch
Save and close the file, then update all the package indexes with the following command:
pacman -Syu
Step 2 - Install Docker
In this post, we will use Docker to install GitLab, so you must install both Docker and Docker Compose packages on your server. Run the following command to install both packages.
pacman -S docker docker-compose
Once installed, enable the Docker service to start at system reboot.
systemctl enable docker
Next, restart your system to apply the system.
reboot
Step 3 - Create a Docker-Compose File for GitLab
First, create a directory storing GitLab configurations.
mkdir gitlab
Next, export the directory path using the following command.
export GITLAB_HOME=$(pwd)/gitlab
Next, navigate to the GitLab directory and create a docker-compose.yml file.
cd gitlab
nano docker-compose.yml
Add the following configurations:
version: '3.7'
services:
web:
image: 'gitlab/gitlab-ce:latest'
restart: always
hostname: 'localhost'
container_name: gitlab-ce
environment:
GITLAB_OMNIBUS_CONFIG: |
external_url 'http://localhost'
ports:
- '8080:80'
- '8443:443'
volumes:
- '$GITLAB_HOME/config:/etc/gitlab'
- '$GITLAB_HOME/logs:/var/log/gitlab'
- '$GITLAB_HOME/data:/var/opt/gitlab'
networks:
- gitlab
gitlab-runner:
image: gitlab/gitlab-runner:alpine
container_name: gitlab-runner
restart: always
depends_on:
- web
volumes:
- /var/run/docker.sock:/var/run/docker.sock
- '$GITLAB_HOME/gitlab-runner:/etc/gitlab-runner'
networks:
- gitlab
networks:
gitlab:
name: gitlab-network
Save and close the file when you are done.
Step 4 - Launch GitLab Container
At this point, the docker-compose.yml file is ready to start the GitLab container. Run the following command inside the GitLab directory to launch the GitLab container.
docker-compose up -d
You should see the following output.
[+] Running 13/13
✔ gitlab-runner 3 layers [⣿⣿⣿] 0B/0B Pulled 15.9s
✔ 9621f1afde84 Pull complete 2.1s
✔ d98190f30ae9 Pull complete 14.6s
✔ d147c4edb07a Pull complete 14.8s
✔ web 8 layers [⣿⣿⣿⣿⣿⣿⣿⣿] 0B/0B Pulled 152.1s
✔ 5544ebdc0c7b Pull complete 4.5s
✔ c5213c581bf5 Pull complete 8.2s
✔ a58d99176887 Pull complete 8.5s
✔ 7ae8a2c59be5 Pull complete 8.8s
✔ 2017c98fba37 Pull complete 9.0s
✔ 2f81550514d7 Pull complete 9.2s
✔ b7e289348f9c Pull complete 9.4s
✔ d5fd7dcd275c Pull complete 151.3s
[+] Running 3/3
✔ Network gitlab-network Created 0.1s
✔ Container gitlab-ce Started 0.8s
✔ Container gitlab-runner Started 1.3s
You can verify the GitLab container status using the following command.
docker-compose ps
You should see the following output.
NAME IMAGE COMMAND SERVICE CREATED STATUS PORTS
gitlab-ce gitlab/gitlab-ce:latest "/assets/wrapper" web 31 seconds ago Up 30 seconds (health: starting) 22/tcp, 0.0.0.0:8080->80/tcp, :::8080->80/tcp, 0.0.0.0:8443->443/tcp, :::8443->443/tcp
gitlab-runner gitlab/gitlab-runner:alpine "/usr/bin/dumb-init …" gitlab-runner 31 seconds ago Up 29 seconds
You can also verify the GitLab listening ports using the following command.
ss -antpl | grep docker
You will get the following output.
LISTEN 0 4096 0.0.0.0:8080 0.0.0.0:* users:(("docker-proxy",pid=12635,fd=4))
LISTEN 0 4096 0.0.0.0:8443 0.0.0.0:* users:(("docker-proxy",pid=12617,fd=4))
LISTEN 0 4096 [::]:8080 [::]:* users:(("docker-proxy",pid=12641,fd=4))
LISTEN 0 4096 [::]:8443 [::]:* users:(("docker-proxy",pid=12622,fd=4))
Step 5 - Access GitLab Web UI
At this point, GitLab is started and listening on port 8080. You can now access it using the URL http://your-server-ip:8080. You should see the GitLab login screen.
Next, go back to your GitLab terminal interface and retrieve the GitLab password with the following command.
docker exec -it gitlab-ce grep 'Password:' /etc/gitlab/initial_root_password
You should see the GitLab password in the following output.
Password: Kx1MoTQ80iKJkA3SXatepaFCOfsi/DkLe3MXEplfERU=
Next, return to the GitLab login screen, type your password, and click the Sign in button. You should see the GitLab dashboard on the following screen.
Conclusion
In this post, we explained how to install GitLab on Arch Linux. You can now implement GitLab in your development environment, making the development process faster. You can also try to deploy GitLab on dedicated server hosting from Atlantic.Net!
### How to Install Jenkins with Docker and Docker Compose on Arch Linux
Jenkins is an accessible, open-source, self-hosted automation server that helps developers automate all parts of the software development process. It is based on Java and offers 1800+ plugins to support the automation of all kinds of tasks. Jenkins aims to continuously deliver your software by integrating with many testing and deployment technologies. It is cross-platform and can run on all major platforms including, macOS, Linux, and Windows.
In this post, we will show you how to install Jenkins on Arch Linux.
Step 1 - Configure the Repository
By default, the default repository is outdated in Arch Linux, so you will need to modify the default mirror list. You can do it by editing the mirror list configuration file:
nano /etc/pacman.d/mirrorlist
Remove all lines and add the following lines:
## Score: 0.7, United States
Server = http://mirror.us.leaseweb.net/archlinux/$repo/os/$arch
## Score: 0.8, United States
Server = http://lug.mtu.edu/archlinux/$repo/os/$arch
Server = http://mirror.nl.leaseweb.net/archlinux/$repo/os/$arch
## Score: 0.9, United Kingdom
Server = http://mirror.bytemark.co.uk/archlinux/$repo/os/$arch
## Score: 1.5, United Kingdom
Server = http://mirrors.manchester.m247.com/arch-linux/$repo/os/$arch
Server = http://archlinux.dcc.fc.up.pt/$repo/os/$arch
## Score: 6.6, United States
Server = http://mirror.cs.pitt.edu/archlinux/$repo/os/$arch
## Score: 6.7, United States
Server = http://mirrors.acm.wpi.edu/archlinux/$repo/os/$arch
## Score: 6.8, United States
Server = http://ftp.osuosl.org/pub/archlinux/$repo/os/$arch
## Score: 7.1, India
Server = http://mirror.cse.iitk.ac.in/archlinux/$repo/os/$arch
## Score: 10.1, United States
Server = http://mirrors.xmission.com/archlinux/$repo/os/$arch
Save and close the file, then update all the package indexes with the following command:
pacman -Syu
Step 2 - Install Docker
In this post, we will use Docker to deploy Jenkins. You can install Docker and Docker Compose using the following command.
pacman -S docker docker-compose
Once the Docker is installed, enable the Docker service to start at system reboot.
systemctl enable docker
Next, restart your system to apply the system.
reboot
Step 3 - Create a Docker Compose File for Jenkins
First, create directories for Jenkins using the following command.
mkdir jenkins jenkins_home
Next, navigate to the Jenkins directory and create a docker-compose.yml file.
cd jenkins
nano docker-compose.yml
Add the following configurations.
version: '3.7'
services:
jenkins:
image: jenkins/jenkins:lts
privileged: true
user: root
ports:
- 8080:8080
- 50000:50000
container_name: jenkins-lts
volumes:
- ~/jenkins_home:/var/jenkins_home
- /var/run/docker.sock:/var/run/docker.sock
- /usr/local/bin/docker:/usr/local/bin/docker
Save and close the file when you are done.
Step 4 - Start Jenkins Container
At this point, the docker-compose.yml file is ready to launch the Jenkins container. Run the following command inside the Jenkins directory to create a container.
docker-compose up -d
You should see the following output.
[+] Running 14/14
✔ jenkins 13 layers [⣿⣿⣿⣿⣿⣿⣿⣿⣿⣿⣿⣿⣿] 0B/0B Pulled 24.0s
✔ 32fb02163b6b Pull complete 8.9s
✔ c09d5e9e1188 Pull complete 14.3s
✔ a56533012712 Pull complete 15.0s
✔ 7936e107ffe7 Pull complete 15.1s
✔ 3ca683058265 Pull complete 15.2s
✔ c2ecd304b4b8 Pull complete 17.4s
✔ be3512d810d6 Pull complete 17.5s
✔ 56b37d7c2a7a Pull complete 17.9s
✔ 99ed1e723e52 Pull complete 22.5s
✔ 256db5485b13 Pull complete 22.6s
✔ ee8c7eaf5e6b Pull complete 22.7s
✔ 509f66c2f317 Pull complete 22.8s
✔ 820296a845d6 Pull complete 22.9s
[+] Running 2/2
✔ Network jenkins_default Created 0.1s
✔ Container jenkins-lts Started 0.6s
You can verify the Jenkins container status using the following command.
docker-compose ps
You will get the following output.
NAME IMAGE COMMAND SERVICE CREATED STATUS PORTS
jenkins-lts jenkins/jenkins:lts "/usr/bin/tini -- /u…" jenkins About a minute ago Up About a minute 0.0.0.0:8080->8080/tcp, :::8080->8080/tcp, 0.0.0.0:50000->50000/tcp, :::50000->50000/tcp
You will also need Jenkins's initial admin password to perform the Jenkins web-based installation. You can get the Jenkins admin password with the following command.
docker exec jenkins-lts cat /var/jenkins_home/secrets/initialAdminPassword
You should see the password in the following output.
99b844a4ad13404796e1ab8bcf05edd1
You can also check the Jenkins logs to get the password.
docker logs jenkins-lts | less
You should see the following output.
Jenkins initial setup is required. An admin user has been created and a password generated.
Please use the following password to proceed to installation:
99b844a4ad13404796e1ab8bcf05edd1
Running from: /usr/share/jenkins/jenkins.war
webroot: /var/jenkins_home/war
This may also be found at: /var/jenkins_home/secrets/initialAdminPassword
*************************************************************
*************************************************************
*************************************************************
2023-03-26 05:25:19.934+0000 [id=28] INFO jenkins.InitReactorRunner$1#onAttained: Completed initialization
2023-03-26 05:25:19.956+0000 [id=22] INFO hudson.lifecycle.Lifecycle#onReady: Jenkins is fully up and running
2023-03-26 05:25:20.151+0000 [id=44] INFO h.m.DownloadService$Downloadable#load: Obtained the updated data file for hudson.tasks.Maven.MavenInstaller
2023-03-26 05:25:20.153+0000 [id=44] INFO hudson.util.Retrier#start: Performed the action check updates server successfully at the attempt #1
Step 5 - Access Jenkins Web UI
At this point, Jenkins is installed and listens on port 8080. You can now access it using the URL http://your-server-ip:8080. You should see the Jenkins initial setup password screen.
Provide your password and click on the Continue button. You should see the customized Jenkins screen.
Click on Install suggested plugins. You should see the Getting Started screen.
Create your new admin user and click on the Save and Continue buttons. You should see the instance configuration screen.
Click on the Save and Finish button. You should see the following screen.
Click on the Start using Jenkins. You should see the Jenkins dashboard.
Conclusion
In this post, we explained how to install Jenkins with Docker on Arch Linux. You can now explore the Jenkins features and implement them in your organization to automate all kinds of tasks. You can also try to deploy Jenkins on dedicated server hosting from Atlantic.Net!
### How to Install Netbox on Arch Linux
Netbox is an IP address management and data center infrastructure management tool for modeling and documenting modern networks. It is designed for network and infrastructure to empower engineers with network automation. It helps you to make your work easier by creating a map of every device in the data center. It is free and open-source so you don't need to pay for this solution.
In this post, we will show you how to install Netbox on Arch Linux.
Step 1 - Configure Repository
By default, the default repository is outdated in Arch Linux, so you will need to modify the default mirror list. You can do it by editing the mirror list configuration file:
nano /etc/pacman.d/mirrorlist
Remove all lines and add the following lines:
## Score: 0.7, United States
Server = http://mirror.us.leaseweb.net/archlinux/$repo/os/$arch
## Score: 0.8, United States
Server = http://lug.mtu.edu/archlinux/$repo/os/$arch
Server = http://mirror.nl.leaseweb.net/archlinux/$repo/os/$arch
## Score: 0.9, United Kingdom
Server = http://mirror.bytemark.co.uk/archlinux/$repo/os/$arch
## Score: 1.5, United Kingdom
Server = http://mirrors.manchester.m247.com/arch-linux/$repo/os/$arch
Server = http://archlinux.dcc.fc.up.pt/$repo/os/$arch
## Score: 6.6, United States
Server = http://mirror.cs.pitt.edu/archlinux/$repo/os/$arch
## Score: 6.7, United States
Server = http://mirrors.acm.wpi.edu/archlinux/$repo/os/$arch
## Score: 6.8, United States
Server = http://ftp.osuosl.org/pub/archlinux/$repo/os/$arch
## Score: 7.1, India
Server = http://mirror.cse.iitk.ac.in/archlinux/$repo/os/$arch
## Score: 10.1, United States
Server = http://mirrors.xmission.com/archlinux/$repo/os/$arch
Save and close the file, then update all the package indexes with the following command:
pacman -Syu
Step 2 - Install Require Dependencies
First, you will need to install Redis and other Python dependencies on your server. You can install all of them by running the following command.
pacman -S redis python python-pip git
After the successful installation, start and enable the Redis service with the following command.
systemctl start redis
systemctl enable redis
Step 3 - Install and Configure PostgreSQL
Netbox uses PostgreSQL as a database backend, so you will need to install PostgreSQL on your server.
First, install PostgreSQL using the following command.
pacman -S postgresql
Next, initialize PostgreSQL with the following command.
sudo -u postgres initdb --locale en_US.UTF-8 -D /var/lib/postgres/data
Next, start and enable the PostgreSQL service.
systemctl start postgresql
systemctl enable postgresql
Next, log in to PostgreSQL with the following command.
sudo -u postgres psql
Next, create a database and user for Netbox using the following command.
CREATE USER netbox WITH PASSWORD 'password';
CREATE DATABASE netbox OWNER netbox;
GRANT ALL PRIVILEGES ON DATABASE netbox TO netbox;
ALTER DATABASE netbox OWNER TO netbox;
Finally, exit from the PostgreSQL shell with the following command.
\q
Step 4 - Install and Configure Netbox
First, create a dedicated netbox user with the following command.
useradd -U netbox
Next, create a netbox directory and download the latest version of netbox inside the /opt/netbox.
mkdir /opt/netbox
cd /opt/netbox
git clone -b master https://github.com/netbox-community/netbox.git .
Next, change the ownership of the netbox directory.
chown -R root:netbox /opt/netbox/
Next, navigate to the netbox directory and copy the sample configuration file.
cd /opt/netbox/netbox/netbox
cp configuration_example.py configuration.py
Next, generate the secret key.
/opt/netbox/netbox/generate_secret_key.py
Output.
e1y$sW(RBxLfT0Qn9592j_5^^ESOXDavM+n0iT+wP!4Y6XEYn%
Next, edit the Netbox configuration file.
nano /opt/netbox/netbox/netbox/configuration.py
Define your allowed hosts, database, and secret key as shown below:
ALLOWED_HOSTS = ['*']
# PostgreSQL database configuration. See the Django documentation for a complete list of available parameters:
# https://docs.djangoproject.com/en/stable/ref/settings/#databases
DATABASE = {
'NAME': 'netbox', # Database name
'USER': 'netbox', # PostgreSQL username
'PASSWORD': 'password', # PostgreSQL password
'HOST': 'localhost', # Database server
'PORT': '', # Database port (leave blank for default)
'CONN_MAX_AGE': 300, # Max database connection age
}
SECRET_KEY = 'e1y$sW(RBxLfT0Qn9592j_5^^ESOXDavM+n0iT+wP!4Y6XEYn%'
Save and close the file.
Then, navigate to the /opt/netbox directory and run the upgrade.sh script to install all required dependencies.
cd /opt/netbox/
./upgrade.sh
If everything is fine, you should see the following output.
netbox.service ExecStart:
/opt/netbox/venv/bin/gunicorn
netbox-rq.service ExecStart:
/opt/netbox/venv/bin/python
After modifying these files, reload the systemctl daemon:
> systemctl daemon-reload
--------------------------------------------------------------------
Upgrade complete! Don't forget to restart the NetBox services:
> sudo systemctl restart netbox netbox-rq
Next, activate the Netbox virtual environment with the following command.
source /opt/netbox/venv/bin/activate
Next, navigate to the netbox directory:
cd /opt/netbox/netbox
Next, create a super user for Netbox:
python3 manage.py createsuperuser
Define your admin user and password as shown below:
Username (leave blank to use 'root'): admin
Email address: admin@example.com
Password:
Password (again):
Superuser created successfully.
Step 5 - Create a Systemd Service File for Netbox
First, copy the gunicorn and another service file to the desired location.
cp /opt/netbox/contrib/gunicorn.py /opt/netbox/gunicorn.py
cp -v /opt/netbox/contrib/*.service /etc/systemd/system/
Next, deactivate from the Python virtual environment.
deactivate
Next, reload the systemd daemon, start both netbox services, and enable them to start at system reboot.
systemctl daemon-reload
systemctl start netbox netbox-rq
systemctl enable netbox netbox-rq
Wait for some time to start the Netbox completely. Then, check the Netbox listening port with the following command.
ss -antpl | grep 8001
You should see the following output.
LISTEN 0 0 127.0.0.1:8001 0.0.0.0:* users:(("gunicorn",pid=62051,fd=5),("gunicorn",pid=62050,fd=5),("gunicorn",pid=62049,fd=5),("gunicorn",pid=62048,fd=5),("gunicorn",pid=62047,fd=5),("gunicorn",pid=62045,fd=5))
Step 6 - Configure Nginx as a Reverse Proxy
At this point, Netbox is installed and listening on port 8001 on localhost. To access Netbox from the outside network, you will need to configure Nginx as a reverse proxy for Netbox.
First, install Nginx with the following command.
pacman -S nginx-mainline
After installing Nginx, start and enable the Nginx service using the following command.
systemctl start nginx
systemctl enable nginx
Next, create a directory to store Nginx virtual host files.
mkdir /etc/nginx/sites-enabled
Next, create an Nginx configuration file for Netbox.
nano /etc/nginx/sites-enabled/netbox.conf
Add the following configuration.
server {
listen 80;
# CHANGE THIS TO YOUR SERVER'S NAME
server_name netbox.example.com;
client_max_body_size 25m;
location /static/ {
alias /opt/netbox/netbox/static/;
}
location / {
proxy_pass http://127.0.0.1:8001;
proxy_set_header X-Forwarded-Host $http_host;
proxy_set_header X-Real-IP $remote_addr;
proxy_set_header X-Forwarded-Proto $scheme;
}
}
Save and close the file, then edit the Nginx main configuration file.
nano /etc/nginx/nginx.conf
Add the following lines after http{:
server_names_hash_bucket_size 64;
include sites-enabled/*;
Save the file when you are done. Then, verify the Nginx configuration.
nginx -t
You will see the following output.
nginx: the configuration file /etc/nginx/nginx.conf syntax is ok
nginx: configuration file /etc/nginx/nginx.conf test is successful
Next, restart the Nginx service to implement the changes.
systemctl restart nginx
Step 7 - Access Netbox Web Interface
Now, open your web browser and access the Netbox using the URL http://netbox.example.com. You should see the Netbox welcome screen.
Click on the Login button. You should see the Netbox login page.
Provide your admin username and password and click on the Sign in button. You should see the Netbox dashboard on the following screen.
Conclusion
In this post, we explained how to install Netbox on Arch Linux. We also showed you how to configure Nginx as a reverse proxy for Netbox. You can now use Netbox in your organization and start managing all devices from a web browser. You can implement Netbox on dedicated server hosting from Atlantic.Net!
### How to Install OpenNMS on Arch Linux
OpenNMS is a free, open-source, self-hosted network monitoring and network management solution developed by OpenNMS Group. It helps you to visualize and monitor everything on your local and remote networks. OpenNMS can be integrated with business applications and workflows to monitor your networks. It comes with a web-based interface that allows you to monitor everything from a central place.
In this post, we will show you how to install the OpenNMS monitoring tool with Docker on Arch Linux.
Step 1 - Configure Repository
By default, the default repository is outdated in Arch Linux, so you will need to modify the default mirror list. You can do it by editing the mirror list configuration file:
nano /etc/pacman.d/mirrorlist
Remove all lines and add the following lines:
## Score: 0.7, United States
Server = http://mirror.us.leaseweb.net/archlinux/$repo/os/$arch
## Score: 0.8, United States
Server = http://lug.mtu.edu/archlinux/$repo/os/$arch
Server = http://mirror.nl.leaseweb.net/archlinux/$repo/os/$arch
## Score: 0.9, United Kingdom
Server = http://mirror.bytemark.co.uk/archlinux/$repo/os/$arch
## Score: 1.5, United Kingdom
Server = http://mirrors.manchester.m247.com/arch-linux/$repo/os/$arch
Server = http://archlinux.dcc.fc.up.pt/$repo/os/$arch
## Score: 6.6, United States
Server = http://mirror.cs.pitt.edu/archlinux/$repo/os/$arch
## Score: 6.7, United States
Server = http://mirrors.acm.wpi.edu/archlinux/$repo/os/$arch
## Score: 6.8, United States
Server = http://ftp.osuosl.org/pub/archlinux/$repo/os/$arch
## Score: 7.1, India
Server = http://mirror.cse.iitk.ac.in/archlinux/$repo/os/$arch
## Score: 10.1, United States
Server = http://mirrors.xmission.com/archlinux/$repo/os/$arch
Save and close the file, then update all the package indexes with the following command:
pacman -Syu
Step 2 - Install Docker
First, you will need to install Docker and Docker Compose on your server. You can install both packages with the following command.
pacman -S docker docker-compose
Once the Docker is installed, enable the Docker service to start at system reboot.
systemctl enable docker
Next, restart your system to apply the system.
reboot
Step 3 - Create a Docker Compose File for OpenNMS
First, create a directory to store OpenNMS configurations.
mkdir opennms
Next, navigate to the OpenNMS directory and create a docker-compose.yml file.
cd opennms
nano docker-compose.yml
Add the following configuration.
version: '3'
volumes:
data-postgres: {}
data-opennms: {}
services:
database:
image: postgres:12
container_name: database
environment:
- TZ=Europe/Berlin
- POSTGRES_USER=postgres
- POSTGRES_PASSWORD=postgres
volumes:
- data-postgres:/var/lib/postgresql/data
healthcheck:
test: [ "CMD-SHELL", "pg_isready -U postgres" ]
interval: 10s
timeout: 30s
retries: 3
horizon:
image: opennms/horizon:27.1.1
container_name: horizon
environment:
- TZ=Europe/Berlin
- POSTGRES_HOST=database
- POSTGRES_PORT=5432
- POSTGRES_USER=postgres
- POSTGRES_PASSWORD=postgres
- OPENNMS_DBNAME=opennms
- OPENNMS_DBUSER=opennms
- OPENNMS_DBPASS=opennms
volumes:
- data-opennms:/opt/opennms/share/rrd
- ./overlay:/opt/opennms-overlay
command: ["-s"]
ports:
- "8980:8980/tcp"
- "8101:8101/tcp"
- "61616:61616/tcp"
healthcheck:
test: [ "CMD", "curl", "-f", "-I", "http://localhost:8980/opennms/login.jsp" ]
interval: 1m
timeout: 5s
retries: 3
Save and close the file when you are done.
Step 4 - Create OpenNMS Container
Your docker-compose.yml file for OpenNMS is now ready to deploy OpenNMS. Run the following command inside the netbox directory to launch the Netbox container.
docker-compose up -d
If everything is fine, you will get the following output.
✔ horizon 12 layers [⣿⣿⣿⣿⣿⣿⣿⣿⣿⣿⣿⣿] 0B/0B Pulled 116.7s
✔ 7a0437f04f83 Pull complete 16.2s
✔ 14e88814ab83 Pull complete 17.1s
✔ 15d4a57fa9b3 Pull complete 38.0s
✔ 48f60c15ef49 Pull complete 39.0s
✔ 40326c4bdfdf Pull complete 80.7s
✔ 8fe30d1fc55f Pull complete 80.9s
✔ a0a9efee3070 Pull complete 81.1s
✔ 736b43559f0f Pull complete 81.2s
✔ fc4845e5d963 Pull complete 81.4s
✔ 0be5443a0ce9 Pull complete 115.5s
✔ bb3010fe38e5 Pull complete 115.6s
✔ 570c6a68cf58 Pull complete 115.7s
✔ database 13 layers [⣿⣿⣿⣿⣿⣿⣿⣿⣿⣿⣿⣿⣿] 0B/0B Pulled 40.3s
✔ f1f26f570256 Pull complete 18.1s
✔ 1c04f8741265 Pull complete 19.4s
✔ dffc353b86eb Pull complete 19.7s
✔ 18c4a9e6c414 Pull complete 20.6s
✔ 81f47e7b3852 Pull complete 23.7s
✔ 5e26c947960d Pull complete 24.5s
✔ a2c3dc85e8c3 Pull complete 24.8s
✔ 17df73636f01 Pull complete 25.1s
✔ 05add2dd64c8 Pull complete 37.9s
✔ f8eca8be8b3c Pull complete 38.2s
✔ cdf9a1dad65d Pull complete 38.4s
✔ 194ad2944d69 Pull complete 38.8s
✔ 66763d72b3d4 Pull complete 39.0s
[+] Running 5/5
✔ Network opennms_default Created 0.1s
✔ Volume "opennms_data-postgres" Created 0.0s
✔ Volume "opennms_data-opennms" Created 0.0s
✔ Container horizon Started 1.5s
✔ Container database Started 1.3s
You can also verify the Netbox container using the following command.
docker-compose ps
You will get the following output.
NAME IMAGE COMMAND SERVICE CREATED STATUS PORTS
database postgres:12 "docker-entrypoint.s…" database 21 seconds ago Up 19 seconds (healthy) 5432/tcp
horizon opennms/horizon:27.1.1 "/entrypoint.sh -s" horizon 21 seconds ago Up 18 seconds (health: starting) 0.0.0.0:8101->8101/tcp, :::8101->8101/tcp, 1162/udp, 0.0.0.0:8980->8980/tcp, :::8980->8980/tcp, 10514/udp, 0.0.0.0:61616->61616/tcp, :::61616->61616/tcp
Step 5 - Access OpenNMS Web Interface
At this point, OpenNMS is started and listens on port 8980. Now, open your web browser and access OpenNMS using the URL http://your-server-ip:8980. You should see the OpenNMS login page.
Provide the OpenNMS default admin username and password as admin/admin then click on the Login button. You should see the OpenNMS dashboard on the following page.
Conclusion
Congratulations! You have successfully installed OpenNMS with Docker on Arch Linux. You can now start monitoring your local and remote networks from a central location. You can also try to deploy the OpenNMS monitoring solution on dedicated server hosting from Atlantic.Net!
### How to Install phpIPAM on Arch Linux
phpIPAM is a free, open-source, lightweight, and modern IP address monitoring tool for system and network administrators. It uses MySQL as a database system and is written in PHP, jQuery libraries, Ajax, and HTML5/CSS3. phpIPAM gives you a real-time inventory of used and unassigned IP addresses with other details like subnets, status, hostname, and more.
This post will show you how to install phpIPAM with Nginx on Arch Linux.
Step 1 - Configure Repository
By default, the default repository is outdated in Arch Linux, so you will need to modify the default mirror list. You can do it by editing the mirror list configuration file:
nano /etc/pacman.d/mirrorlist
Remove all lines and add the following lines:
## Score: 0.7, United States
Server = http://mirror.us.leaseweb.net/archlinux/$repo/os/$arch
## Score: 0.8, United States
Server = http://lug.mtu.edu/archlinux/$repo/os/$arch
Server = http://mirror.nl.leaseweb.net/archlinux/$repo/os/$arch
## Score: 0.9, United Kingdom
Server = http://mirror.bytemark.co.uk/archlinux/$repo/os/$arch
## Score: 1.5, United Kingdom
Server = http://mirrors.manchester.m247.com/arch-linux/$repo/os/$arch
Server = http://archlinux.dcc.fc.up.pt/$repo/os/$arch
## Score: 6.6, United States
Server = http://mirror.cs.pitt.edu/archlinux/$repo/os/$arch
## Score: 6.7, United States
Server = http://mirrors.acm.wpi.edu/archlinux/$repo/os/$arch
## Score: 6.8, United States
Server = http://ftp.osuosl.org/pub/archlinux/$repo/os/$arch
## Score: 7.1, India
Server = http://mirror.cse.iitk.ac.in/archlinux/$repo/os/$arch
## Score: 10.1, United States
Server = http://mirrors.xmission.com/archlinux/$repo/os/$arch
Save and close the file, then update all the package indexes with the following command:
pacman -Syu
Step 2 - Install Nginx
The Nginx package is included in the Arch Linux default repository by default. You can install it with the following command.
pacman -S nginx-mainline
After installing Nginx, start and enable the Nginx service using the following command.
systemctl start nginx
systemctl enable nginx
Step 3 - Install and Configure PHP
phpIPAM is a PHP-based application, so you must install PHP and other extensions to your server. You can install all of them using the following command.
pacman -S php php-fpm php-gd unzip
Next, you must install the Pear PHP extension to your system. You can download and install it with the following command.
wget http://pear.php.net/go-pear.phar
php go-pear.phar
Next, edit the PHP configuration file and enable all the required PHP extensions.
nano /etc/php.ini
Add/modify the following lines.
extension=pdo_mysql
extension=gd
extension=json
extension=mysqli
extension=intl
extension=xml
extension=bcmath
extension=gmp
extension=iconv
extension=gettext
extension=sockets
Save and close the file, then start the PHP-FPM service and enable it to start at system reboot.
systemctl start php-fpm
systemctl enable php-fpm
Step 4 - Install and Configure MariaDB Database
Next, you will need to install the MariaDB database on your system. You can install it with the following command.
pacman -S mariadb
Once the MariaDB server is installed, initialize the MariaDB database with the following command.
mysql_install_db --user=mysql --basedir=/usr --datadir=/var/lib/mysql
Next, start and enable the MariaDB service using the following command.
systemctl start mysqld
systemctl enable mysqld
Next, connect to the MariaDB shell:
mysql
Next, create a database and user for phpIPAM using the following command.
CREATE DATABASE phpipam;
GRANT ALL ON phpipam.* TO phpipam@localhost IDENTIFIED BY 'password';
FLUSH PRIVILEGES;
Next, exit from the MariaDB with the following command.
QUIT;
Step 5 - Install phpIPAM
First, download the latest version of phpIPAM to the Nginx root directory.
mkdir /var/www/html
git clone --recursive https://github.com/phpipam/phpipam.git /var/www/html/phpipam
Next, navigate to the phpipam directory and copy the sample configuration file.
cd /var/www/html/phpipam
cp config.dist.php config.php
Next, edit the configuration file.
nano config.php
Add the following line:
$allow_untested_php_versions=true;
Define your database settings:
/**
* database connection details
******************************/
$db['host'] = 'localhost';
$db['user'] = 'phpipam';
$db['pass'] = 'password';
$db['name'] = 'phpipam';
$db['port'] = 3306;
Save and close the file, then import the phpIPAM database.
cd /var/www/html/phpipam
mysql -u root -p phpipam < db/SCHEMA.sql
Next, change the ownership of the phpipam directory.
chown -R http:http /var/www/html/phpipam
Step 6 - Configure Nginx for phpIPAM
Next, you must create an Nginx virtual host configuration file to serve phpIPAM.
First, create a directory to store the Nginx virtual host.
mkdir /etc/nginx/sites-enabled
Next, create an Nginx configuration file for phpIPAM.
nano /etc/nginx/sites-enabled/phpipam.conf
Add the following configuration.
server {
listen 80;
# root directory
server_name ipam.example.com;
index index.php;
root /var/www/html/phpipam;
location / {
try_files $uri $uri/ /index.php$is_args$args;
}
location ~ \.php$ {
try_files $uri =404;
fastcgi_split_path_info ^(.+\.php)(/.+)$;
fastcgi_pass unix:/run/php-fpm/php-fpm.sock;
fastcgi_param SCRIPT_FILENAME $document_root$fastcgi_script_name;
fastcgi_index index.php;
include fastcgi_params;
}
}
Save the file, then edit the Nginx main configuration file.
nano /etc/nginx/nginx.conf
Add the following lines after http{:
server_names_hash_bucket_size 64;
include sites-enabled/*;
Save the file when you are done. Then, verify the Nginx configuration.
nginx -t
You will see the following output.
nginx: the configuration file /etc/nginx/nginx.conf syntax is ok
nginx: configuration file /etc/nginx/nginx.conf test is successful
Next, restart the Nginx service to implement the changes.
systemctl restart nginx
Step 7 - Access phpIPAM Web UI
Now, open your web browser and access the phpIPAM web interface using the URL http://ipam.example.com. You should see the phpIPAM welcome screen.
Click on the New phpipam installation. You should see the following screen.
Click on the MySQL/MariaDB import instructions. You should see the following screen.
Provide your phpIPAM database details and click on the install phpipam database. You should see the following screen.
Click on the Login. You should see your phpIPAM login screen.
Provide phpIPAM admin username admin and password as ipamadmin, then click the Login button. You should see the change password screen.
Change your default password and click on the Save password. Then, click on the Dashboard button. You should see the following screen.
Conclusion
Congratulations! You have successfully installed the phpIPAM password management tool on Arch Linux. You can now easily install phpIPAM on your server and test it. You can also try to deploy phpIPAM on dedicated server hosting from Atlantic.Net!
### How to Install reveal.js on Arch Linux
reveal.js is a free and open-source HTML presentation framework. It allows users to create a simple and beautiful presentation via a web browser. You'll need a browser with support for CSS 3D transforms to see it in its full glory. With reveal.js, you can create a presentation that supports mobile gestures, such as pinch and slide.
In this post, we will show you how to install reveal.js with Nginx on Arch Linux.
Step 1 - Configure Repository
By default, the default repository is outdated in Arch Linux, so you will need to modify the default mirror list. You can do it by editing the mirror list configuration file:
nano /etc/pacman.d/mirrorlist
Remove all lines and add the following lines:
## Score: 0.7, United States
Server = http://mirror.us.leaseweb.net/archlinux/$repo/os/$arch
## Score: 0.8, United States
Server = http://lug.mtu.edu/archlinux/$repo/os/$arch
Server = http://mirror.nl.leaseweb.net/archlinux/$repo/os/$arch
## Score: 0.9, United Kingdom
Server = http://mirror.bytemark.co.uk/archlinux/$repo/os/$arch
## Score: 1.5, United Kingdom
Server = http://mirrors.manchester.m247.com/arch-linux/$repo/os/$arch
Server = http://archlinux.dcc.fc.up.pt/$repo/os/$arch
## Score: 6.6, United States
Server = http://mirror.cs.pitt.edu/archlinux/$repo/os/$arch
## Score: 6.7, United States
Server = http://mirrors.acm.wpi.edu/archlinux/$repo/os/$arch
## Score: 6.8, United States
Server = http://ftp.osuosl.org/pub/archlinux/$repo/os/$arch
## Score: 7.1, India
Server = http://mirror.cse.iitk.ac.in/archlinux/$repo/os/$arch
## Score: 10.1, United States
Server = http://mirrors.xmission.com/archlinux/$repo/os/$arch
Save and close the file, then update all the package indexes with the following command:
pacman -Syu
Step 2 - Install Node.js and NPM
Before starting, you will need to install Node.js and NPM packages on your server. You can install both packages with the following command:
pacman -S nodejs npm
Once both packages are installed, you can verify the Node.js version with the following command.
node --version
You should see the following output.
v19.8.1
Step 3 - Install reveal.js
First, install the Git package using the following command.
pacman -S git
Next, download the latest version of reveal.js with the following command.
git clone https://github.com/hakimel/reveal.js.git
Once the download is completed, navigate to the reveal.js directory and install all the required dependencies using the following command.
cd reveal.js
npm install
You can now run reveal.js with the following command.
npm start
If everything is fine, you will get the following output.
> reveal.js@4.4.0 start
> gulp serve
[13:33:30] Using gulpfile ~/reveal.js/gulpfile.js
[13:33:30] Starting 'serve'...
[13:33:30] Starting server...
[13:33:30] Server started http://localhost:8000
[13:33:30] LiveReload started on port 35729
[13:33:30] Running server
Press the CTRL+C to stop the application.
Step 4 - Create a Systemd Service File for reveal.js
It is recommended to create a systemd file to manage reveal.js. You can create it with the following command.
nano /lib/systemd/system/reveal.service
Add the following lines.
[Service]
Type=simple
User=root
Restart=on-failure
WorkingDirectory=/root/reveal.js
ExecStart=npm start
Save and close the file, then reload the system to apply the changes.
systemctl daemon-reload
Next, start and enable the reveal.js service.
systemctl start reveal.service
systemctl enable reveal.service
To check the service status, run the following command.
systemctl status reveal.service
You will get the following output.
● reveal.service
Loaded: loaded (/usr/lib/systemd/system/reveal.service; static)
Active: active (running) since Sat 2023-03-25 13:35:33 UTC; 35s ago
Main PID: 7113 (npm start)
Tasks: 22 (limit: 4685)
Memory: 259.6M
CPU: 15.621s
CGroup: /system.slice/reveal.service
├─7113 "npm start"
└─7124 "gulp serve"
Mar 25 13:35:33 archlinux systemd[1]: Started reveal.service.
Mar 25 13:35:34 archlinux npm[7113]: > reveal.js@4.4.0 start
Mar 25 13:35:34 archlinux npm[7113]: > gulp serve
Mar 25 13:35:36 archlinux npm[7124]: [13:35:36] Using gulpfile ~/reveal.js/gulpfile.js
Mar 25 13:35:36 archlinux npm[7124]: [13:35:36] Starting 'serve'...
Mar 25 13:35:36 archlinux npm[7124]: [13:35:36] Starting server...
Mar 25 13:35:36 archlinux npm[7124]: [13:35:36] Server started http://localhost:8000
Mar 25 13:35:36 archlinux npm[7124]: [13:35:36] LiveReload started on port 35729
Mar 25 13:35:36 archlinux npm[7124]: [13:35:36] Running serve
Step 5 - Configure Nginx as a Reverse Proxy
First, install the Nginx package with the following command.
pacman -S nginx-mainline
Next, start and enable the Nginx service with the following command.
systemctl start nginx
systemctl enable nginx
Next, create a directory to store the Nginx virtual host.
mkdir /etc/nginx/sites-enabled
Next, create an Nginx configuration file for reveal.js.
nano /etc/nginx/sites-enabled/reveal.conf
Add the following configuration.
upstream reveal_backend {
server localhost:8000;
}
server {
listen 80;
server_name reveal.example.com;
location / {
proxy_pass http://reveal_backend/;
proxy_http_version 1.1;
proxy_set_header Upgrade $http_upgrade;
proxy_set_header Connection "upgrade";
proxy_set_header Host $http_host;
proxy_set_header X-Real-IP $remote_addr;
proxy_set_header X-Forward-For $proxy_add_x_forwarded_for;
proxy_set_header X-Forward-Proto http;
proxy_set_header X-Nginx-Proxy true;
proxy_redirect off;
}
}
Save the file, then edit the Nginx main configuration file.
nano /etc/nginx/nginx.conf
Add the following lines after http{:
server_names_hash_bucket_size 64;
include sites-enabled/*;
Save the file, then verify the Nginx configuration using the following command.
nginx -t
You will get the following output.
nginx: the configuration file /etc/nginx/nginx.conf syntax is ok
nginx: configuration file /etc/nginx/nginx.conf test is successful
Finally, restart the Nginx service to apply the changes.
systemctl restart nginx
Step 6 - Access reveal.js Web UI
Now, open your web browser and access the reveal.js web interface using the URL http://reveal.example.com. You should see the reveal default slide on the following screen.
Conclusion
In this post, we explained how to install reveal.js on Arch Linux. We also showed you how to configure Nginx as a reverse proxy for reveal.js. You now try to deploy reveal.js on dedicated server hosting from Atlantic.Net!
### How eCommerce Companies Can Protect Both Their and Customer Data In Six Ways
The significance of data for business growth can not be underestimated. And the fact that data is critical for decision-making and overall business operation increases the importance of data protection. This is true for the eCommerce industry, which is growing rapidly thanks to tech development and the fact it gives customers outstanding and smooth shopping experiences. As eCommerce businesses continue to grow and prosper, data security is becoming more important than ever. Thus, eCommerce businesses should focus on creating a strong data protection system. In this article, we will convert key strategies online stores can implement to protect their and customer data.
Main Benefits of Data Protection for eCommerce Businesses
There is no doubt that data plays a significant role in decision-making and overall business growth. So let's discuss why eCommerce companies should care about protecting that valuable data.
✓ To protect payment information Successful eCommerce businesses and decentralized eCommerce marketplaces maintain sensitive data, like customer information, product information, and financial records. Thus, it is vital to protect payment information from any security breaches, whether from unauthorized access or theft.
✓ Prevent fraud One of the main perks of following data security measures is avoiding identity theft and payment fraud. Thus, eCommerce businesses can secure their buyer's financial data and prevent financial losses.
✓ Build credibility Data loss and breaches can damage the store's reputation; thus, having a strong data security system can boost brand reputation and credibility. Moreover, companies with a strong reputation can attract and retain customers.
✓ Increase customer trust Customers will shop at eCommerce stores when they know that eCommerce store cares about protecting their sensitive data and prioritize data protection. This is vital for word-of-mouth marketing efforts, as eCommerce buyers will recommend their family and friends to a business that takes data protection seriously.
✓ Improve business continuity Following data protection best practices and having recovery plans can guarantee eCommerce business continuity.
✓ Increases sales By employing effective data protection measures, eCommerce stores can boost sales, as chances are higher that customers will purchase from businesses that prioritize data security.
Six tactics eCommerce companies can protect both their and customer data
Now that we’ve discussed the advantages of data protection for eCommerce companies, we will shift to policies that companies should implement to successfully protect customers' data from security threats.
1. Safely back up your data
One of the first steps that eCommerce companies should take to protect both their and customers' data is data backups. Basically, this involves creating copies of crucial and sensitive data and storing them in a separate location. Regularly doing data backups can help ensure that customer data is not lost in case of malicious actions. Data backup is an essential part of running a successful eCommerce site. Thus, it is crucial to do regular audits also help you stay on top of the latest threats and ensure that your data is always safe. There are several tactics you should follow to make the process more effective. First, define what data you should back up. It can be valuable customer data, product, or financial records. The next step should be choosing which backup solution the eCommerce store needs and which suits the eCommerce business objectives and budget. You can use several backup methods, such as manual backups, automatic backups, and cloud backups. Another important consideration is that backups should not be one-time thing; making the backup process weekly or monthly will be beneficial. Lastly, eCommerce companies should store backups securely to guarantee that they’re protected from unauthorized access. Going through every step of this process ensures online stores have a reliable backup solution catering to all their needs.
2. Implement a strong password policy
A strong password policy is a fundamental component that can strengthen the security policy and protect your customers' data. Thus, it is crucial to encourage your eCommerce buyers to enter a strong password with a minimum length, special characters, and numbers during the registration or purchase. Require customers to create passwords at least eight characters long and include numbers and symbols. This will make it more difficult to hack passwords and protects from attacks. Moreover, eCommerce stores should require customers to change their passwords regularly. This will prevent old passwords from being used and reduce the risk of unauthorized access. Another beneficial tactic is employing extra security tactics, such as two-factor authentication, which takes us to the next point.
3․ Consider two-factor and multi-factor authentication
Authentication strategies should be an integral part of data security efforts as they can give that extra layer of security. Multi-factor authentication requires users to enter their password and authenticate their access using another device like their mobile. For example, SMS can be deployed as an extra verification layer to protect your e-commerce business from fraudulent activity and make it harder for scammers to access user accounts. eCommerce companies should consider finding high-quality multi-factor authentication services to help protect buyers and their data. Two-factor and multi-factor authentication offer an extra layer of security and provide another opportunity for your eCommerce company to connect with them. Additionally, when an eCommerce store decides to implement SMS as a verification layer, then it also makes it possible to build tailored campaigns based on the customer buying journey.
4. Educate your employees
Educating customers on how to protect their own data, such as creating strong passwords and not sharing personal information, can also help protect both their data and the eCommerce company's data. As part of this, educate employees on the risks their actions or mistakes could pose to data security and notify them about threats.
✔ Organize training sessions eCommerce companies should organize regular training sessions on data security measures. These sessions can cover topics such as password security, phishing scams, and properly handling sensitive data. The training can also include giving tips for identifying and reporting suspicious actions. Furthermore, checking whether employees understand the importance of creating strong passwords is vital, and you should recommend regularly changing them.
✔ Establish clear policies and procedures Another step is to develop clear policies and procedures for handling sensitive data and ensure that your employees understand them thoroughly. These policies should guide employees on how to store and share sensitive and crucial information. Also, you may consider giving your employees tips about Shopify bulk product image upload, as it helps to upload product images quickly and save valuable time.
✔ Monitor access to sensitive data It is crucial to limit access to sensitive data and give those employees who need it to perform their daily tasks. Lastly, it will be important to schedule regular team meetings and use the Office 365 group calendar in that process, and effectively discuss data protection strategies.
5. Educate customers as well
Online stores should not only dedicate effort to their employees but also should educate their customers as well. Also, these companies should consider implementing onboarding tools or affordable Walkme alternatives making the onboarding stage as effective as possible and increasing increase customer retention. First and foremost, share your privacy policies on the eCommerce website and explain what data you collect, how you use it, and how you protect it. The next step is to provide a secure checkout option and offer secure payment options. Moreover, it is important to suggest to customers the option to use two-factor authentication to protect their accounts and add an extra layer of security. You should not only give password management tips to customers but also encourage them to use strong passwords and give tips on creating and managing them, such as using a password manager. Furthermore, it's crucial to communicate with eCommerce buyers with a secure communication platform and consider taking email security measures when customers share sensitive data via email. Lastly, eCommerce companies should keep customers updated about privacy policy changes. Be open with customers in case data breaches happen, showcase they are responsible, and take necessary steps to minimize the impact.
6. Use encryption techniques
The last recommendation we give to eCommerce businesses is to implement encryption methods to reduce both external and internal threats and guarantee high-level security. These techniques will help to protect sensitive data, such as passwords and credit card details, and are one of the effective ways to protect an e-commerce company's data from securing your consumers' information as well. Moreover, they help to increase search engine visibility, and best practice suggests that eCommerce websites that use encryption tactics rank higher.
To Sum Up
There is no doubt that a strong data protection strategy can ensure business growth. Therefore, eCommerce companies should dedicate their time and effort to keeping both their company and customer data safe from various security threats, and PCI-compliant hosting can assist in making sure you're meeting these standards. Following these steps, we have suggested an online store build to avoid data breaches, increasing customer retention and, as a result, a skyrocketing eCommerce company.
### What Is CloudOps and How Can it Improve Your Compliance Efforts?
What Is CloudOps?
CloudOps, short for Cloud Operations, refers to the practices, tools, and methodologies used to manage and optimize cloud-based infrastructure and services. It involves the deployment, monitoring, and management of cloud-based applications and infrastructure in a way that ensures high availability, scalability, and performance.
CloudOps encompasses a range of activities, including the management of virtualized infrastructure, the deployment of cloud-native applications, the automation of operations, and the implementation of security and compliance measures. It also involves the monitoring of resource usage, performance, and cost, and the implementation of strategies to optimize these factors.
In essence, CloudOps is the practice of managing and optimizing cloud-based infrastructure and services in a way that maximizes their efficiency, reliability, and performance. It is an essential aspect of cloud computing, as it enables organizations to fully leverage the benefits of cloud-based technologies while ensuring that they are operating at peak efficiency.
The Pillars of Cloud Operations
The pillars of CloudOps refer to the key principles and practices that underpin the effective management and optimization of cloud-based infrastructure and services. The four pillars of CloudOps are:
Abstraction
Abstraction involves creating a layer of abstraction between the underlying infrastructure and the applications that run on it. This is typically achieved through the use of containerization or virtualization technologies, which allow applications to run in isolated environments that are independent of the underlying hardware or operating system.
Abstraction enables greater flexibility and agility, as applications can be moved between different cloud environments or infrastructures without the need for significant modifications. This makes it easier for organizations to take advantage of the benefits of cloud computing, such as scalability and cost savings, without being tied to a specific cloud provider or infrastructure.
Provisioning
Provisioning refers to the process of deploying and configuring cloud resources, such as virtual machines (VMs), storage, and network resources. Effective provisioning is essential to ensure that applications have access to the resources they need to operate efficiently.
Cloud-based infrastructure is typically provisioned using Infrastructure as Code (IaC) tools, which allow infrastructure to be defined and deployed using code. This enables consistent, repeatable deployments that can be automated and easily scaled up or down as needed.
Policy-driven
Policy-driven refers to the use of policies to govern the management and operation of cloud-based infrastructure and services. Policies can be used to enforce security and compliance measures, optimize resource usage, and automate management tasks.
Cloud providers typically offer a range of policy-based services, such as identity and access management (IAM), network security, and resource tagging. These services enable organizations to define and enforce policies that govern how their cloud-based infrastructure and services are managed and operated.
Automation
Automation involves the use of tools and technologies to automate the deployment, management, and optimization of cloud-based infrastructure and services. This can help to reduce the workload on IT staff, increase efficiency and consistency, and improve the overall performance and reliability of cloud-based applications and infrastructure.
Automation is typically achieved through the use of DevOps tools and practices, such as continuous integration and continuous deployment (CI/CD), infrastructure automation, and monitoring and alerting. These tools and practices enable organizations to automate many of the tasks involved in managing and optimizing their cloud-based infrastructure and services, freeing up IT staff to focus on more strategic initiatives.
Together, these pillars provide a framework for effective CloudOps, helping organizations to manage and optimize their cloud-based infrastructure and services in a way that maximizes their efficiency, reliability, and performance.
CloudOps for Compliance
CloudOps, which is the set of practices and processes for managing and optimizing cloud infrastructure and applications, can significantly improve compliance efforts in the following ways:
Automation: Automation is a key component of CloudOps and can significantly improve compliance efforts. By automating compliance checks and controls, organizations can reduce manual effort, minimize the risk of human error, and ensure that compliance is consistently enforced across their cloud infrastructure and applications.
Standardization: CloudOps also emphasizes the standardization of processes and infrastructure. By standardizing cloud infrastructure and applications, organizations can reduce complexity, minimize the risk of misconfiguration, and ensure that compliance controls are consistently applied.
Visibility: CloudOps provides visibility into cloud infrastructure and applications, enabling organizations to identify and remediate compliance issues quickly. By continuously monitoring cloud resources and applications, organizations can identify issues and risks before they become larger problems.
Scalability: CloudOps also enables organizations to scale cloud resources and applications in a compliant manner. By automating the provisioning and scaling of cloud resources, organizations can quickly respond to changes in demand and ensure that compliance controls are consistently applied.
Resilience: CloudOps also focuses on resilience and business continuity. By implementing disaster recovery and business continuity plans, organizations can ensure that critical data and applications are protected in the event of an outage or disaster, which is crucial for maintaining compliance.
Implementing CloudOps
Create an Effective Cloud Migration Strategy
Developing a comprehensive cloud migration strategy is critical to a successful cloud implementation. This strategy should involve assessing existing applications and workloads to determine which ones are suitable for migration to the cloud, and which cloud environment and services are most appropriate for each workload.
The migration strategy should also take into account factors such as security and compliance requirements (such as HIPAA compliance), data governance, and application dependencies. It's important to define a clear migration path for each workload and to ensure that the migration process is well-planned and executed to minimize disruption to the business.
Build a “Minimum Viable” Cloud
Starting with a minimum viable cloud environment can help to reduce complexity and minimize costs while enabling the organization to gain experience with cloud-based technologies and identify areas for optimization and improvement.
A minimum viable cloud typically includes only the essential infrastructure and services required to support critical business applications and workloads. As the organization gains experience and confidence with the cloud, additional infrastructure and services can be added as needed.
Champion a Cultural Shift
Implementing CloudOps often involves a cultural shift within the organization, as IT teams must adapt to new ways of working and collaborating. This requires strong leadership and communication, as well as a focus on training and education to ensure that IT staff have the skills and knowledge they need to succeed in a cloud-based environment.
Championing a cultural shift involves encouraging a mindset of continuous improvement and collaboration, as well as adopting new tools and processes to support cloud-based operations. DevOps practices, for example, can help to break down silos between development and operations teams and enable more streamlined and efficient processes for managing cloud-based infrastructure and services.
Automate Security
Security is a critical consideration when implementing CloudOps, and automation can play a key role in ensuring that cloud-based infrastructure and services are secure and compliant. Automated security tools can help to identify and remediate security vulnerabilities, enforce security policies and controls, and detect and respond to security incidents in real-time. This can help to reduce the risk of security breaches and ensure that the organization remains compliant with relevant regulations and standards.
Conclusion
In conclusion, CloudOps is the practice of managing and optimizing cloud-based infrastructure and services in a way that maximizes their efficiency, reliability, and performance. By implementing CloudOps, organizations can gain significant benefits in terms of scalability, agility, and cost savings, while also improving their compliance efforts.
Implementing CloudOps requires careful planning, execution, and ongoing management, but can offer significant benefits in terms of efficiency, agility, and scalability. By following best practices and focusing on key areas such as migration strategies, cloud environment design, cultural shifts, and security automation, organizations can successfully implement CloudOps and achieve their cloud computing goals.
### How to Install SonarQube on Arch Linux
SonarQube is an open-source and self-hosted code quality analysis tool used to check code in several programming languages via plugins. It allows development teams to find bugs and code duplication in a software application. It helps developers to decrease application size, code complexity, time, and cost of maintenance and makes code easier to read and understand. It is written in Java and supports several databases including Postgres, MySQL, Oracle, and SQL Server.
In this post, we will show you how to install SonarQube on Arch Linux.
Step 1 - Configure Repository
By default, the default repository is outdated in Arch Linux, so you will need to modify the default mirror list. You can do it by editing the mirror list configuration file:
nano /etc/pacman.d/mirrorlist
Remove all lines and add the following lines:
## Score: 0.7, United States
Server = http://mirror.us.leaseweb.net/archlinux/$repo/os/$arch
## Score: 0.8, United States
Server = http://lug.mtu.edu/archlinux/$repo/os/$arch
Server = http://mirror.nl.leaseweb.net/archlinux/$repo/os/$arch
## Score: 0.9, United Kingdom
Server = http://mirror.bytemark.co.uk/archlinux/$repo/os/$arch
## Score: 1.5, United Kingdom
Server = http://mirrors.manchester.m247.com/arch-linux/$repo/os/$arch
Server = http://archlinux.dcc.fc.up.pt/$repo/os/$arch
## Score: 6.6, United States
Server = http://mirror.cs.pitt.edu/archlinux/$repo/os/$arch
## Score: 6.7, United States
Server = http://mirrors.acm.wpi.edu/archlinux/$repo/os/$arch
## Score: 6.8, United States
Server = http://ftp.osuosl.org/pub/archlinux/$repo/os/$arch
## Score: 7.1, India
Server = http://mirror.cse.iitk.ac.in/archlinux/$repo/os/$arch
## Score: 10.1, United States
Server = http://mirrors.xmission.com/archlinux/$repo/os/$arch
Save and close the file, then update all the package indexes with the following command:
pacman -Syu
Step 2 - Install Java JDK
SonarQube is based on Java, so you will need to install Java on your server. You can install it with the following command.
pacman -S jdk17-openjdk unzip
Once Java is installed, you can verify it using the following command.
java --version
You will get the Java version information in the following output.
openjdk 17.0.6 2023-01-17
OpenJDK Runtime Environment (build 17.0.6+10)
OpenJDK 64-Bit Server VM (build 17.0.6+10, mixed mode)
Step 3 - Install and Configure PostgreSQL
First, install the PostgreSQL server with the following command.
pacman -S postgresql
Next, initialize the PostgreSQL database with the following command.
sudo -u postgres initdb --locale en_US.UTF-8 -D /var/lib/postgres/data
Next, start and enable the PostgreSQL service using the following command.
systemctl start postgresql
systemctl enable postgresql
Next, connect to the PostgreSQL shell.
sudo -u postgres psql
Next, create a database and user for SonarQube:
CREATE USER sonarqube WITH PASSWORD 'password';
CREATE DATABASE sonarqube OWNER sonarqube;
GRANT ALL PRIVILEGES ON DATABASE sonarqube TO sonarqube;
Next, exit from the PostgreSQL shell with the following command.
\q
Step 4 - Download SonarQube
First, create a dedicated user to run SonarQube.
useradd -b /opt/sonarqube -s /bin/bash sonarqube
Next, download the latest version of SonarQube using the following command.
wget https://binaries.sonarsource.com/Distribution/sonarqube/sonarqube-9.9.0.65466.zip
Once the download is completed, unzip the downloaded file with the following command.
unzip sonarqube-9.9.0.65466.zip
Next, move the extracted directory to /opt using the following command.
mv sonarqube-9.9.0.65466 /opt/sonarqube
Next, change the ownership of the SonarQube directory.
chown -R sonarqube:sonarqube /opt/sonarqube
Next, edit the SonarQube configuration file.
nano /opt/sonarqube/conf/sonar.properties
Change the following lines as per your settings.
sonar.jdbc.username=sonarqube
sonar.jdbc.password=password
sonar.web.javaOpts=-Xmx512m -Xms128m -XX:+HeapDumpOnOutOfMemoryError
sonar.web.javaAdditionalOpts=-server
sonar.web.host=0.0.0.0
sonar.web.port=9000
sonar.log.level=INFO
sonar.path.logs=logs
Save and close the file when you are done.
Step 5 - Create a Systemd Service File for SonarQube
Next, you will need to create a systemd service file to manage the SonarQube service. You can create it with the following command.
nano /etc/systemd/system/sonarqube.service
Add the following configurations.
[Unit]
Description=SonarQube service
After=syslog.target network.target
[Service]
Type=forking
ExecStart=/opt/sonarqube/bin/linux-x86-64/sonar.sh start
ExecStop=/opt/sonarqube/bin/linux-x86-64/sonar.sh stop
User=sonarqube
Group=sonarqube
Restart=always
LimitNOFILE=65536
LimitNPROC=4096
[Install]
WantedBy=multi-user.target
Save and close the file, then reload the systemd daemon to apply the changes.
systemctl daemon-reload
Next, start and enable the SonarQube service.
systemctl start sonarqube
systemctl enable sonarqube
You can check the status of SonarQube using the following command.
systemctl status sonarqube
Output.
● sonarqube.service - SonarQube service
Loaded: loaded (/etc/systemd/system/sonarqube.service; disabled; preset: disabled)
Active: active (running) since Sun 2023-03-26 04:42:04 UTC; 17s ago
Process: 1008 ExecStart=/opt/sonarqube/bin/linux-x86-64/sonar.sh start (code=exited, status=0/SUCCESS)
Main PID: 1033 (java)
Tasks: 119 (limit: 4685)
Memory: 1.1G
CPU: 33.270s
CGroup: /system.slice/sonarqube.service
├─1033 java -Xms8m -Xmx32m --add-exports=java.base/jdk.internal.ref=ALL-UNNAMED --add-opens=java.base/java.lang=ALL-UNNAMED --add-opens=java.base/java.nio>
├─1058 /usr/lib/jvm/java-17-openjdk/bin/java -XX:+UseG1GC -Djava.io.tmpdir=/opt/sonarqube/temp -XX:ErrorFile=/opt/sonarqube/logs/es_hs_err_pid%p.log -Des.>
└─1168 /usr/lib/jvm/java-17-openjdk/bin/java -Djava.awt.headless=true -Dfile.encoding=UTF-8 -Djava.io.tmpdir=/opt/sonarqube/temp -XX:-OmitStackTraceInFast>
Mar 26 04:42:04 archlinux systemd[1]: Starting SonarQube service...
Mar 26 04:42:04 archlinux sonar.sh[1008]: /usr/bin/java
Mar 26 04:42:04 archlinux systemd[1]: Started SonarQube service.
Mar 26 04:42:04 archlinux sonar.sh[1008]: Starting SonarQube...
Mar 26 04:42:04 archlinux sonar.sh[1008]: Started SonarQube.
Step 6 - Access SonarQube Web UI
At this point, SonarQube is installed and running. Now, open your web browser and access the SonarQube web interface using the URL http://your-server-ip:9000. You should see the SonarQube login page:
Provide the default admin username and password as admin/admin then click on the Login button. You should see the password change screen.
Change your default password, then click on the Update button. You should see the SonarQube dashboard on the following screen.
Conclusion
In this post, we explained how to install SonarQube on Arch Linux. You can now create your first project manually or import it from the other DevOps platform. You can now try to deploy SonarQube on dedicated server hosting from Atlantic.Net!
### How to Secure SSH Server on Arch Linux
OpenSSH is a secure shell protocol that provides a secure channel over an unsecured network. It allows the system administrator to manage Linux servers remotely over a secure channel. It works on a client-server architecture and allows users to connect to the SSH server remotely. Unlike unsecured protocols, SSH encrypts the traffic, login sessions, and passwords. OpenSSH is one of the most popular and widely used protocols.
In this post, we will show you how to secure an SSH server on Arch Linux.
Step 1 - Configure Repository
By default, the default repository is outdated in Arch Linux, so you will need to modify the default mirror list. You can do it by editing the mirrorlist configuration file:
nano /etc/pacman.d/mirrorlist
Remove all lines and add the following lines:
## Score: 0.7, United States
Server = http://mirror.us.leaseweb.net/archlinux/$repo/os/$arch
## Score: 0.8, United States
Server = http://lug.mtu.edu/archlinux/$repo/os/$arch
Server = http://mirror.nl.leaseweb.net/archlinux/$repo/os/$arch
## Score: 0.9, United Kingdom
Server = http://mirror.bytemark.co.uk/archlinux/$repo/os/$arch
## Score: 1.5, United Kingdom
Server = http://mirrors.manchester.m247.com/arch-linux/$repo/os/$arch
Server = http://archlinux.dcc.fc.up.pt/$repo/os/$arch
## Score: 6.6, United States
Server = http://mirror.cs.pitt.edu/archlinux/$repo/os/$arch
## Score: 6.7, United States
Server = http://mirrors.acm.wpi.edu/archlinux/$repo/os/$arch
## Score: 6.8, United States
Server = http://ftp.osuosl.org/pub/archlinux/$repo/os/$arch
## Score: 7.1, India
Server = http://mirror.cse.iitk.ac.in/archlinux/$repo/os/$arch
## Score: 10.1, United States
Server = http://mirrors.xmission.com/archlinux/$repo/os/$arch
Save and close the file then update all the package indexes with the following command:
pacman -Syu
Step 2 - Change SSH Default Port
By default, SSH listens on port 22. So it is vulnerable to DDoS attacks. In this case, it would be recommended to change the default SSH port to a port greater than 1024.
To change the SSH port, edit the SSH configuration file.
nano /etc/ssh/sshd_config
Find the following line:
Port 22
And, replaced it with the following line:
Port 8087
Save and close the file then restart the SSH service to apply the changes.
systemctl restart sshd
Step 3 - Disable SSH Root Login
The root user has unlimited access to the file system, so the root account is the most valuable target for hackers. You can disable the SSH root login by editing the SSH configuration file.
nano /etc/ssh/sshd_config
Find the following line:
#PermitRootLogin prohibit-password
Replaced it with the following line.
PermitRootLogin no
Save and close the file then restart the SSH service to apply the changes.
Step 4 - Limit SSH Access
It is also a good practice to grant only limited users access to the SSH server remotely. You can define the allow and deny list via SSH configuration file.
nano /etc/ssh/sshd_config
Add the following line:
AllowUsers user1 user2 user3
Save and close the file, then restart the SSH service to apply the changes.
systemctl restart sshd
Step 5 - Enable Key-based Authentication
It is a good idea to use an SSH key instead of a password to authenticate the SSH server. To do so, first, edit the SSH configuration file and enable the key-based authentication.
nano /etc/ssh/sshd_config
Change the following line:
PubkeyAuthentication yes
Save and close the file then restart the SSH service.
systemctl restart sshd
Step 6 - Disable Password Login
It is also a good idea to disable password authentication and enable key-based authentication.
nano /etc/ssh/sshd_config
Find and change the following line:
PasswordAuthentication no
Save and close the file, then restart the SSH service to apply the changes.
systemctl restart sshd
Conclusion
In this post, we explained how to secure an OpenSSH server on Arch Linux. I hope this guide will help you to secure your SSH server in a production environment. You can secure the SSH server on VPS server hosting from Atlantic.Net!
Related Guides:
HIPAA Compliant Hosting Solutions
PCI-Compliant Hosting Solutions
What Are Managed Services?
Related Products:
Atlantic.Net Dedicated Server Hosting
Atlantic.Net HIPAA Compliant Hosting
Atlantic.Net GPU Hosting
### How to Install and Configure Squid Proxy on Arch Linux
Squid is a free, open-source, fully featured proxy server that provides proxy and cache services for Hyper Text Transport Protocol. It reduces bandwidth, reduces server load, and improves response times by caching and reusing frequently-requested web pages. It also offers access control features that help you to filter Internet traffic. Generally, Squid proxies only HTTP connections and supports other protocols including FTP, Gopher, SSL, and WAIS.
In this post, we will show you how to install the Squid proxy server on Arch Linux.
Step 1 - Configure Repository
By default, the default repository is outdated in Arch Linux, so you will need to modify the default mirror list. You can do it by editing the mirrorlist configuration file:
nano /etc/pacman.d/mirrorlist
Remove all lines and add the following lines:
## Score: 0.7, United States
Server = http://mirror.us.leaseweb.net/archlinux/$repo/os/$arch
## Score: 0.8, United States
Server = http://lug.mtu.edu/archlinux/$repo/os/$arch
Server = http://mirror.nl.leaseweb.net/archlinux/$repo/os/$arch
## Score: 0.9, United Kingdom
Server = http://mirror.bytemark.co.uk/archlinux/$repo/os/$arch
## Score: 1.5, United Kingdom
Server = http://mirrors.manchester.m247.com/arch-linux/$repo/os/$arch
Server = http://archlinux.dcc.fc.up.pt/$repo/os/$arch
## Score: 6.6, United States
Server = http://mirror.cs.pitt.edu/archlinux/$repo/os/$arch
## Score: 6.7, United States
Server = http://mirrors.acm.wpi.edu/archlinux/$repo/os/$arch
## Score: 6.8, United States
Server = http://ftp.osuosl.org/pub/archlinux/$repo/os/$arch
## Score: 7.1, India
Server = http://mirror.cse.iitk.ac.in/archlinux/$repo/os/$arch
## Score: 10.1, United States
Server = http://mirrors.xmission.com/archlinux/$repo/os/$arch
Save and close the file then update all the package indexes with the following command:
pacman -Syu
Step 2 - Install Squid Proxy Server
By default, the Squid package is included in the Arch Linux default repository. You can install it using the following command.
pacman -S squid
After installing the Squid proxy, start and enable the Squid service using the following command.
systemctl start squid
systemctl enable squid
By default, Squid listens on port 3128. You can check it with the following command.
ss -antpl | grep squid
You will get the following output.
LISTEN 0 0 *:3128 *:* users:(("squid",pid=52872,fd=12))
Step 3 - Configure Squid Authentication
Before deploying Squid proxy in your organization, it is recommended to configure user-based authentication on Squid so only valid users can access the internet via Squid proxy.
First, install the Apache package with the following command.
pacman -S apache
Next, create a file to store the Squid user and password.
touch /etc/squid/squid_passwd
chown proxy /etc/squid/squid_passwd
Next, create a new user and set a password.
htpasswd /etc/squid/squid_passwd squiduser
Set your password as shown below:
New password:
Re-type new password:
Adding password for user squiduser
Next, edit the Squid configuration file and enable the authentication.
nano /etc/squid/squid.conf
Add the following lines at the beginning of the file.
auth_param basic program /usr/lib64/squid/basic_ncsa_auth /etc/squid/squid_passwd
acl ncsa_users proxy_auth REQUIRED
http_access allow ncsa_users
Save and close the file, then restart the Squid proxy service to apply the changes:
systemctl restart squid
Step 4 - Configure Squid to Anonymize Traffic
Next, you will also need to configure Squid to mask client IP addresses and anonymize the traffic. You can do it by editing Squid's main configuration file.
nano /etc/squid/squid.conf
Add the following lines at the beginning of the file.
forwarded_for off
request_header_access Allow allow all
request_header_access Authorization allow all
request_header_access WWW-Authenticate allow all
request_header_access Proxy-Authorization allow all
request_header_access Proxy-Authenticate allow all
request_header_access Cache-Control allow all
request_header_access Content-Encoding allow all
request_header_access Content-Length allow all
request_header_access Content-Type allow all
request_header_access Date allow all
request_header_access Expires allow all
request_header_access Host allow all
request_header_access If-Modified-Since allow all
request_header_access Last-Modified allow all
request_header_access Location allow all
request_header_access Pragma allow all
request_header_access Accept allow all
request_header_access Accept-Charset allow all
request_header_access Accept-Encoding allow all
request_header_access Accept-Language allow all
request_header_access Content-Language allow all
request_header_access Mime-Version allow all
request_header_access Retry-After allow all
request_header_access Title allow all
request_header_access Connection allow all
request_header_access Proxy-Connection allow all
request_header_access User-Agent allow all
request_header_access Cookie allow all
request_header_access All deny all
Save and close the file, then restart the Squid proxy service to apply the changes:
systemctl restart squid
Step 5 - Verify Squid Proxy
Now, your Squid proxy is installed and configured. It's time to verify whether Squid is working or not.
To test the Squid proxy, you will need to define your Squid proxy on your desktop computer’s browser settings.
On the desktop system, open Mozilla Firefox and click on Edit => Preferences as shown below:
Scroll down to the Network Settings section and click on Settings. You should see the following page:
Select the Manual proxy configuration radio button, enter your Squid server IP address in the HTTP Host field and 3128 in the Port field, select the “Use this proxy server for all protocols” check box, and click on the OK button to save the settings.
Your browser is now configured to browse the Internet through the Squid proxy.
To verify it, type the URL https://www.whatismyip.com/. You will be asked to provide a username and password as shown below:
Provide your Squid proxy server username and password which you created earlier and click on the OK button. You should see the following page:
Conclusion
Congratulations! You have successfully installed the Squid proxy server on Arch Linux. You can now implement Squid proxy in your organization to cache the content and filter the internet traffic. You can try the Squid proxy server on dedicated server hosting from Atlantic.Net!
### How to Install and Configure Ansible on Arch Linux
Ansible is a free and open-source automation tool used for automating administrative tasks on multiple Linux servers. It is an agentless tool and supports Linux, Windows, and VMware cloud servers. It is a simple and lightweight alternative to other automation tools, including Chef and Puppet. It is primarily designed for IT professionals for application deployment, system updates, cloud provisioning, configuration management, and much more.
In this post, we will show you how to install Ansible on Arch Linux.
Step 1 - Configure Repository
By default, the default repository is outdated in Arch Linux, so you will need to modify the default mirror list. You can do it by editing the mirrorlist configuration file:
nano /etc/pacman.d/mirrorlist
Remove all lines and add the following lines:
## Score: 0.7, United States
Server = http://mirror.us.leaseweb.net/archlinux/$repo/os/$arch
## Score: 0.8, United States
Server = http://lug.mtu.edu/archlinux/$repo/os/$arch
Server = http://mirror.nl.leaseweb.net/archlinux/$repo/os/$arch
## Score: 0.9, United Kingdom
Server = http://mirror.bytemark.co.uk/archlinux/$repo/os/$arch
## Score: 1.5, United Kingdom
Server = http://mirrors.manchester.m247.com/arch-linux/$repo/os/$arch
Server = http://archlinux.dcc.fc.up.pt/$repo/os/$arch
## Score: 6.6, United States
Server = http://mirror.cs.pitt.edu/archlinux/$repo/os/$arch
## Score: 6.7, United States
Server = http://mirrors.acm.wpi.edu/archlinux/$repo/os/$arch
## Score: 6.8, United States
Server = http://ftp.osuosl.org/pub/archlinux/$repo/os/$arch
## Score: 7.1, India
Server = http://mirror.cse.iitk.ac.in/archlinux/$repo/os/$arch
## Score: 10.1, United States
Server = http://mirrors.xmission.com/archlinux/$repo/os/$arch
Save and close the file, then update all the package indexes with the following command:
pacman -Syu
Step 2 - Install Ansible
By default, the Ansible package is included in the Arch Linux default repository. You can install it with the following command.
pacman -S ansible
After the successful installation, you can verify the Ansible version using the following command.
ansible --version
You will get the following output.
ansible [core 2.14.1]
config file = /etc/ansible/ansible.cfg
configured module search path = ['/root/.ansible/plugins/modules', '/usr/share/ansible/plugins/modules']
ansible python module location = /usr/lib/python3.10/site-packages/ansible
ansible collection location = /root/.ansible/collections:/usr/share/ansible/collections
executable location = /usr/bin/ansible
python version = 3.10.9 (main, Dec 19 2022, 17:35:49) [GCC 12.2.0] (/usr/bin/python)
jinja version = 3.1.2
libyaml = True
Step 3 - Configure SSH Key-based Authentication
Ansible uses SSH to connect to the remote server, so you will need to set up password-less key-based SSH authentication for remote Linux hosts that you want to manage.
First, generate an SSH key on the Ansible server with the following command:
ssh-keygen -t rsa
You will get the following output.
Generating public/private rsa key pair.
Enter file in which to save the key (/root/.ssh/id_rsa):
Enter passphrase (empty for no passphrase):
Enter same passphrase again:
Your identification has been saved in /root/.ssh/id_rsa
Your public key has been saved in /root/.ssh/id_rsa.pub
The key fingerprint is:
SHA256:vNxc7Y1vQAX7odhmpn1fZq4BdkMpXAh8xBUoflyEDl4 root@archlinux
The key's randomart image is:
+---[RSA 3072]----+
| ..+.**o |
| +.E..o.|
| o Bo.+o |
| . o *+o..|
| S o+B+ .|
| . + o*+.+ |
| o o. .+o=|
| .*+|
| .o+|
+----[SHA256]-----+
Next, copy the generated key to the remote Linux hosts with the following command:
ssh-copy-id -i ~/.ssh/id_rsa.pub root@your-remote-host-ip
You will be asked to provide the remote server password to copy the SSH key.
Number of key(s) added: 1
Now try logging into the machine, with: "ssh 'root@209.23.11.45'"
and check to make sure that only the key(s) you wanted were added.
Next, check the SSH password-less login with the following command:
ssh root@your-remote-host-ip
Step 4 - Configure Ansible Hosts
Next, you will need to configure Ansible hosts to define your remote Linux servers.
nano /etc/ansible/hosts
Add your remote server information as shown below:
[servers]
server1 ansible_ssh_host=your-remote-host-ip ansible_ssh_port=22 ansible_ssh_user=root
Save and close the file when you are finished.
Step 5 - How to Use Ansible
At this point, Ansible is installed and configured. Now, it's time to check how Ansible works.
Let's run the following command on the Ansible server to check the connectivity of remote hosts.
ansible -m ping all
If everything is fine, you should get the following output:
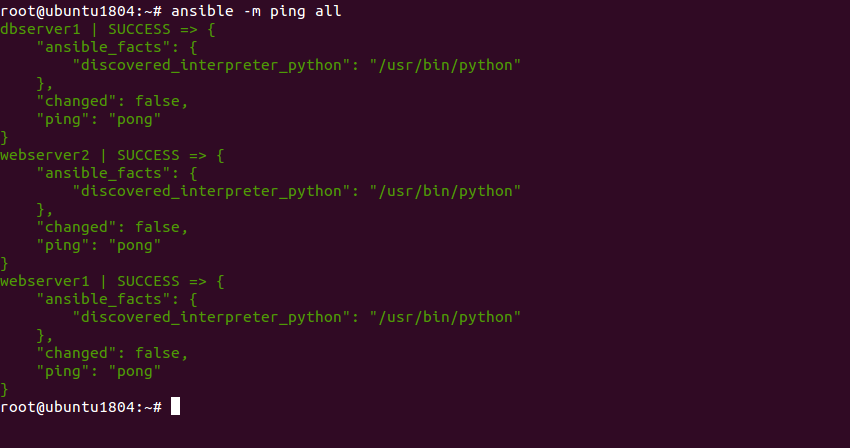
To test the connectivity of specific hosts like server1, run the following command:
ansible -m ping server1
You should see the following output.
Step 6 - Ansible Adhoc Commands
Ansible provides ad-hoc commands to manage remote Linux hosts directly via the command line.
To check the memory usage of all Ansible hosts, run the following command:
ansible -m shell -a "free -m" all
You should see the following screen:
To check the uptime of all Ansible hosts, run the following command:
ansible -m shell -a "uptime" all
You should see the following screen:
To check the disk usage of all Ansible hosts, run the following command:
ansible -m shell -a "df -h" all
You should see the following screen:
Conclusion
In this post, we explained how to install Ansible on Arch Linux. You can now use Ansible to provision and manage multiple Linux hosts using Ansible. You can deploy an Ansible server on dedicated server hosting from Atlantic.Net!
### How to Install Fail2Ban to Secure SSH Server on Arch Linux
Fail2ban is a powerful, free, open-source firewall service that is used to stop brute-force login attempts from the remote system. It is simple and lightweight, providing different filters to monitor Apache, SSH, and other programs for suspicious activity. It runs in the background and monitors the logs of different services and blocks clients that repeatedly fail authentication checks. Fail2Ban protects your Linux server against many security threats, such as dictionary, DoS, DDoS, and brute-force attacks.
In this post, we will show you how to install the Fail2Ban firewall on Arch Linux.
Step 1 - Configure Repository
By default, the default repository is outdated in Arch Linux, so you will need to modify the default mirror list. You can do it by editing the mirrorlist configuration file:
nano /etc/pacman.d/mirrorlist
Remove all lines and add the following lines:
## Score: 0.7, United States
Server = http://mirror.us.leaseweb.net/archlinux/$repo/os/$arch
## Score: 0.8, United States
Server = http://lug.mtu.edu/archlinux/$repo/os/$arch
Server = http://mirror.nl.leaseweb.net/archlinux/$repo/os/$arch
## Score: 0.9, United Kingdom
Server = http://mirror.bytemark.co.uk/archlinux/$repo/os/$arch
## Score: 1.5, United Kingdom
Server = http://mirrors.manchester.m247.com/arch-linux/$repo/os/$arch
Server = http://archlinux.dcc.fc.up.pt/$repo/os/$arch
## Score: 6.6, United States
Server = http://mirror.cs.pitt.edu/archlinux/$repo/os/$arch
## Score: 6.7, United States
Server = http://mirrors.acm.wpi.edu/archlinux/$repo/os/$arch
## Score: 6.8, United States
Server = http://ftp.osuosl.org/pub/archlinux/$repo/os/$arch
## Score: 7.1, India
Server = http://mirror.cse.iitk.ac.in/archlinux/$repo/os/$arch
## Score: 10.1, United States
Server = http://mirrors.xmission.com/archlinux/$repo/os/$arch
Save and close the file, then update all the package indexes with the following command:
pacman -Syu
Step 2 - Install Fail2Ban Firewall
By default, the Fail2Ban package is available in the Arch Linux default repository. You can install it using the following command.
pacman -S fail2ban
After installing the Fail2Ban package, start the Fail2Ban service and enable it to start at system reboot.
systemctl start fail2ban
systemctl enable fail2ban
Step 3 - Secure SSH with Fail2Ban
SSH is one of the most popular protocols used to manage the remote server via the command line, so the SSH service is always vulnerable to brute-force login attacks. In this section, we will show you how to protect SSH with Fail2Ban. Fail2Ban default configuration file located at /etc/fail2ban/jail.conf. It is always recommended to create a new Fail2Ban configuration file.
nano /etc/fail2ban/jail.local
Add the following lines:
[sshd]
enabled = true
port = ssh
filter = sshd
logpath = %(sshd_log)s
backend = %(sshd_backend)s
maxretry = 3
bantime = 300
ignoreip = 127.0.0.1
Save and close the file, then restart the SSH service to apply the changes.
systemctl restart fail2ban
Step 4 - Verify Fail2Ban
At this point, Fail2Ban is installed and configured to secure the SSH server against brute-force login attacks. You can now monitor your Fail2Ban using the fail2ban-client tool.
To check the status of the SSH jail, run the following command.
fail2ban-client status sshd
You should see the list of all IPs blocked by Fail2Ban in the following output:
Status for the jail: sshd
|- Filter
| |- Currently failed: 1
| |- Total failed: 8
| `- Journal matches: _SYSTEMD_UNIT=sshd.service + _COMM=sshd
`- Actions
|- Currently banned: 1
|- Total banned: 1
`- Banned IP list: 49.34.165.39
To check the status of all jails, run the following command.
fail2ban-client status
You will get the following output.
Status
|- Number of jail: 1
`- Jail list: sshd
You can also check the Fail2Ban log for more information:
tail -f /var/log/fail2ban.log
You should see the following output.
2023-01-31 05:03:53,142 fail2ban.filter [54073]: INFO [sshd] Found 49.34.165.39 - 2023-01-31 05:03:52
2023-01-31 05:04:03,144 fail2ban.filter [54073]: INFO [sshd] Found 49.34.165.39 - 2023-01-31 05:04:02
2023-01-31 05:04:03,339 fail2ban.actions [54073]: NOTICE [sshd] 49.34.165.39 already banned
2023-01-31 05:04:07,686 fail2ban.filter [54073]: INFO [sshd] Found 49.34.165.39 - 2023-01-31 05:04:07
2023-01-31 05:04:11,435 fail2ban.filter [54073]: INFO [sshd] Found 49.34.165.39 - 2023-01-31 05:04:11
Step 5 - Working with Fail2Ban Command Line
Fail2Ban also allows you to block and unblock remote IPs manually via the command line.
To unblock a blocked IP, run the following command:
fail2ban-client set sshd unbanip remote-ip
If you want to block an untrusted IP, run the following command:
fail2ban-client set sshd banip remote-ip
Conclusion
Congratulations! You have successfully installed and configured the Fail2Ban firewall on Arch Linux. Your server is now protected from brute-force login attempts. You can now install the Fail2Ban on dedicated server hosting from Atlantic.Net!
### How to Install and Configure Memcached on Arch Linux
Memcache is a free, open-source, general-purpose memory caching system used to speed up dynamic database-driven websites. It is a high-performance and in-memory data store that offers an open-source solution for delivering faster response times. Memcached is distributed, meaning you can easily scale up compute capacity by adding new nodes.
In this post, we will explain how to install Memcached on Arch Linux.
Step 1 - Configure Repository
By default, the default repository is outdated in Arch Linux., so you will need to modify the default mirror list. You can do it by editing the mirrorlist configuration file:
nano /etc/pacman.d/mirrorlist
Remove all lines and add the following lines:
## Score: 0.7, United States
Server = http://mirror.us.leaseweb.net/archlinux/$repo/os/$arch
## Score: 0.8, United States
Server = http://lug.mtu.edu/archlinux/$repo/os/$arch
Server = http://mirror.nl.leaseweb.net/archlinux/$repo/os/$arch
## Score: 0.9, United Kingdom
Server = http://mirror.bytemark.co.uk/archlinux/$repo/os/$arch
## Score: 1.5, United Kingdom
Server = http://mirrors.manchester.m247.com/arch-linux/$repo/os/$arch
Server = http://archlinux.dcc.fc.up.pt/$repo/os/$arch
## Score: 6.6, United States
Server = http://mirror.cs.pitt.edu/archlinux/$repo/os/$arch
## Score: 6.7, United States
Server = http://mirrors.acm.wpi.edu/archlinux/$repo/os/$arch
## Score: 6.8, United States
Server = http://ftp.osuosl.org/pub/archlinux/$repo/os/$arch
## Score: 7.1, India
Server = http://mirror.cse.iitk.ac.in/archlinux/$repo/os/$arch
## Score: 10.1, United States
Server = http://mirrors.xmission.com/archlinux/$repo/os/$arch
Save and close the file, then update all the package indexes with the following command:
pacman -Syu
Step 2 - Install Memcached
By default, the Memcached package is available in the Arch Linux default repository. You can search the Memcached package using the following command.
pacman -Ss memcached
You will get the following list:
extra/memcached 1.6.17-1 [installed]
Distributed memory object caching system
extra/prometheus-memcached-exporter 0.10.0-1
Exports metrics from memcached servers for consumption by Prometheus
community/gambas3-gb-memcached 3.17.3-8 (gambas3)
Memcached client component
community/libmemcached-awesome 1.1.3-1 [installed]
C/C++ client library and tools for the memcached server
community/nginx-mod-memc 0.19-11
Extended version of the standard memcached module for nginx
community/perl-cache-memcached 1.30-4
client library for memcached (memory cache daemon)
community/php-legacy-memcached 3.2.0-2
PHP Legacy extension for interfacing with memcached via libmemcached library
community/php-memcached 3.2.0-2
PHP extension for interfacing with memcached via libmemcached library
community/python-binary-memcached 0.31.0-1
A pure python module to access memcached via its binary protocol with SASL auth support
community/python-memcached 1.59-10
Python interface to memcached
community/python-pylibmc 1.6.1-7
Quick and small memcached client for Python
Now, install the Memcached package using the following command.
pacman -S memcached libmemcached
After the installation, verify the Memcached version with the following command.
memcached --version
You should see the following output.
memcached 1.6.17
Step 3 - Manage Memcached Service
By default, the Memcached service is managed by systemd. You can start and stop it using the systemctl utility.
To start the Memcached service, run the following command.
systemctl start memcached
To enable the Memcached service, run the following command.
systemctl enable memcached
You can check the status of the Memcached service using the following command.
systemctl status memcached
You will get the following output.
● memcached.service - memcached daemon
Loaded: loaded (/usr/lib/systemd/system/memcached.service; disabled; preset: disabled)
Active: active (running) since Mon 2023-01-30 14:36:32 UTC; 4s ago
Main PID: 47816 (memcached)
Tasks: 10 (limit: 2362)
Memory: 1.4M
CGroup: /system.slice/memcached.service
└─47816 /usr/bin/memcached -m 64 -c 1024 -l 127.0.0.1,::1 -o modern,drop_privileges
Jan 30 14:36:32 archlinux systemd[1]: Started memcached daemon.
At this point, Memcached is installed and listens on port 11211. You can check it with the following command.
ss -antpl | grep memcache
You should see the following output.
LISTEN 0 0 127.0.0.1:11211 0.0.0.0:* users:(("memcached",pid=47816,fd=22))
LISTEN 0 0 [::1]:11211 *:* users:(("memcached",pid=47816,fd=23))
Step 4 - Install Memcached PHP Extension
If you want to use Memcached with your PHP-based application then you will need to install the Memcached PHP extensions. You can install it with other packages using the following command.
pacman -S php php-memcached php-fpm
Now, start and enable the PHP-FPM service using the following command.
systemctl start php-fpm
systemctl enable php-fpm
Step 5 - Install Nginx
To verify the PHP Memcached extension, you will need to install the Nginx to your system. You can install it with the following command.
pacman -S nginx-mainline
Next, start and enable the Nginx service with the following command.
systemctl start nginx
systemctl enable nginx
Step 6 - Verify Memcache PHP Extension
To verify the Memcached PHP extension, create a simple info.php file inside the Nginx web root directory.
nano /usr/share/nginx/html/info.php
Add the following code:
Next, edit the Nginx main configuration file and define your PHP location.
nano /etc/nginx/nginx.conf
Find the following lines:
location / {
root /usr/share/nginx/html;
index index.html index.htm;
}
Add the following lines after the above lines:
location ~ \.php$ {
fastcgi_pass unix:/var/run/php-fpm/php-fpm.sock;
fastcgi_index index.php;
root /usr/share/nginx/html;
include fastcgi.conf;
}
Save and close the file, then restart the Nginx service to apply the changes.
systemctl restart nginx
Now, open your web browser and access the info.php file using the URL http://your_server_ip/info.php. You should see the Memcached on the following screen.
Conclusion
Congratulations! You have successfully installed and tested Memcached on Arch Linux. You can now use Memcached with your PHP-based application to improve application performance. You can try the Memcached on dedicated server hosting from Atlantic.Net!
### How to Install Varnish Cache with Nginx on Arch Linux
Varnish cache, also known as a reverse caching proxy, is a web application accelerator designed for content-heavy dynamic websites. It is used to cache content in front of the web server and optimize web pages for faster loading times. It handles all inbound requests before they land on your web server's backend.
In this post, we will show you how to set up the Varnish cache with Nginx on Arch Linux.
Step 1 - Configure Repository
By default, the default repository is outdated in Arch Linux, so you will need to modify the default mirror list if you have not done so already. You can do it by editing the mirrorlist configuration file:
nano /etc/pacman.d/mirrorlist
Remove all lines and add the following lines:
## Score: 0.7, United States
Server = http://mirror.us.leaseweb.net/archlinux/$repo/os/$arch
## Score: 0.8, United States
Server = http://lug.mtu.edu/archlinux/$repo/os/$arch
Server = http://mirror.nl.leaseweb.net/archlinux/$repo/os/$arch
## Score: 0.9, United Kingdom
Server = http://mirror.bytemark.co.uk/archlinux/$repo/os/$arch
## Score: 1.5, United Kingdom
Server = http://mirrors.manchester.m247.com/arch-linux/$repo/os/$arch
Server = http://archlinux.dcc.fc.up.pt/$repo/os/$arch
## Score: 6.6, United States
Server = http://mirror.cs.pitt.edu/archlinux/$repo/os/$arch
## Score: 6.7, United States
Server = http://mirrors.acm.wpi.edu/archlinux/$repo/os/$arch
## Score: 6.8, United States
Server = http://ftp.osuosl.org/pub/archlinux/$repo/os/$arch
## Score: 7.1, India
Server = http://mirror.cse.iitk.ac.in/archlinux/$repo/os/$arch
## Score: 10.1, United States
Server = http://mirrors.xmission.com/archlinux/$repo/os/$arch
Save and close the file, then update all the package indexes with the following command:
pacman -Syu
Step 2 - Install Varnish Cache
By default, the Varnish package is included in the Arch Linux default repository. You can install it by running the following command.
pacman -S varnish
After the successful installation, start the Varnish service and enable it to start after the system reboot.
systemctl start varnish
systemctl enable varnish
By default, Varnish listens on port 6081. You can check it using the following command.
ss -antpl | grep 6081
You will get the following output.
LISTEN 0 0 0.0.0.0:6081 0.0.0.0:* users:(("cache-main",pid=46376,fd=3),("varnishd",pid=46281,fd=3))
LISTEN 0 0 *:6081 *:* users:(("cache-main",pid=46376,fd=5),("varnishd",pid=46281,fd=5))
Step 3 - Install Nginx
Next, you will need to install the Nginx as a backend server. You can install it using the following command.
pacman -S nginx-mainline
Once installed, start and enable the Nginx service using the following command.
systemctl start nginx
systemctl enable nginx
By default, Nginx listens on port 80, so you will need to change the Nginx default port to 8080. You can change it by editing the Nginx main configuration file.
nano /etc/nginx/nginx.conf
Change the following line:
listen 8080;
Save and close the file, then restart the Nginx to apply the changes.
systemctl restart nginx
Step 4 - Configure Varnish to Work With Nginx
Next, you will need to edit the Varnish service file and change port 6081 to 80.
nano /usr/lib/systemd/system/varnish.service
Find the following lines:
ExecStart=/usr/sbin/varnishd \
-a :6081 \
-a localhost:8443,PROXY \
-p feature=+http2 \
-f /etc/varnish/default.vcl \
-s malloc,256m
Replace them with the following lines:
ExecStart=/usr/sbin/varnishd \
-a :80 \
-a localhost:8443,PROXY \
-p feature=+http2 \
-f /etc/varnish/default.vcl \
-s malloc,256m
Save and close the file, then reload the systemd daemon to apply the changes.
systemctl daemon-reload
Next, restart the Varnish service using the following command.
systemctl restart varnish
Next, edit the Varnish configuration file and define your backend web server.
nano /etc/varnish/default.vcl
Change the following lines as per your Nginx backend server IP and port.
backend default {
.host = "127.0.0.1";
.port = "8080";
}
Save and close the file when you are done.
Step 5 - Verify Varnish Cache
At this point, the Varnish cache is installed and configured as a front end for the Nginx web server. You can now check it using the curl command.
curl -I http://localhost
If everything is fine, you will get the following output.
HTTP/1.1 200 OK
Server: nginx/1.23.3
Date: Thu, 26 Jan 2023 14:41:04 GMT
Content-Type: text/html
Content-Length: 615
Last-Modified: Tue, 13 Dec 2022 17:30:37 GMT
ETag: "6398b6bd-267"
X-Varnish: 5 3
Age: 3
Via: 1.1 archlinux (Varnish/7.2)
Accept-Ranges: bytes
Connection: keep-alive
You can also check the Varnish log to see the caching-related information.
varnishlog
You should see the following output.
- RespHeader Age: 13
- RespHeader Via: 1.1 archlinux (Varnish/7.2)
- RespHeader Accept-Ranges: bytes
- VCL_call DELIVER
- VCL_return deliver
- Timestamp Process: 1674744107.428200 0.000149 0.000149
- RespProtocol HTTP/1.1
- RespStatus 304
- RespReason Not Modified
- Filters
- RespUnset Content-Length: 615
- RespHeader Connection: keep-alive
- Timestamp Resp: 1674744107.428263 0.000212 0.000063
- ReqAcct 538 0 538 287 0 287
- End
* << Session >> 11
- Begin sess 0 HTTP/1
- SessOpen 49.34.251.188 44732 a0 104.245.35.248 80 1674744107.418188 25
- Link req 12 rxreq
- SessClose RX_CLOSE_IDLE 5.016
- End
* << Session >> 32771
- Begin sess 0 HTTP/1
- SessOpen 49.34.251.188 44730 a0 104.245.35.248 80 1674744107.512357 31
- SessClose RX_CLOSE_IDLE 5.005
- End
* << Session >> 13
- Begin sess 0 HTTP/1
- SessOpen 49.34.251.188 44734 a0 104.245.35.248 80 1674744107.844468 32
- SessClose RX_CLOSE_IDLE 5.001
- End
Conclusion
Congratulations! You have successfully installed and configured the Varnish cache with Nginx on Arch Linux. You can now use Varnish cache as a front-end proxy server to speed up your web server performance. You can test the Varnish cache on dedicated server hosting from Atlantic.Net!
### How To Install Glances Monitoring Tool on Arch Linux
Glances is a free, open-source, cross-platform monitoring tool used for monitoring system metrics such as CPU, memory, disk, and more. It provides a command line as well as a web-based interface where you can easily monitor all system resources. Compared to other monitoring tools such as top, atop, and htop, Glances can monitor other useful resources such as filesystem I/O, network I/O, and sensor readouts.
In this post, we will show you how to install the Glances monitoring tool on Arch Linux.
Step 1 - Configure Repository
By default, the default repository is outdated in Arch Linux, so you will need to modify the default mirror list. You can do it by editing the mirror list configuration file:
nano /etc/pacman.d/mirrorlist
Remove all lines and add the following lines:
## Score: 0.7, United States
Server = http://mirror.us.leaseweb.net/archlinux/$repo/os/$arch
## Score: 0.8, United States
Server = http://lug.mtu.edu/archlinux/$repo/os/$arch
Server = http://mirror.nl.leaseweb.net/archlinux/$repo/os/$arch
## Score: 0.9, United Kingdom
Server = http://mirror.bytemark.co.uk/archlinux/$repo/os/$arch
## Score: 1.5, United Kingdom
Server = http://mirrors.manchester.m247.com/arch-linux/$repo/os/$arch
Server = http://archlinux.dcc.fc.up.pt/$repo/os/$arch
## Score: 6.6, United States
Server = http://mirror.cs.pitt.edu/archlinux/$repo/os/$arch
## Score: 6.7, United States
Server = http://mirrors.acm.wpi.edu/archlinux/$repo/os/$arch
## Score: 6.8, United States
Server = http://ftp.osuosl.org/pub/archlinux/$repo/os/$arch
## Score: 7.1, India
Server = http://mirror.cse.iitk.ac.in/archlinux/$repo/os/$arch
## Score: 10.1, United States
Server = http://mirrors.xmission.com/archlinux/$repo/os/$arch
Save and close the file, then update all the package indexes with the following command:
pacman -Syu
Step 2 - Install Required Dependencies
Before starting, you will need to install some required dependencies on your server. First, install the Python PIP package using the following command.
pacman -S python-pip
Next, install the bottle module with the following command.
pip install bottle
Once you are done, you can proceed to install Glances.
Step 3 - Install Glances Monitoring Tool
By default, the Glances tool is included in the Arch Linux default repository. You can install it using the following command.
pacman -S glances
Once Glances is installed, you can verify the Glances version with the following command.
glances --version
You will get the following output.
Glances v3.3.0 with PsUtil v5.9.4
Log file: /tmp/glances-root.log
Next, start and enable the Glances service with the following command.
systemctl start glances
systemctl enable glances
You can also check the Glances status using the following command.
systemctl status glances
You should get the following output.
● glances.service - Glances Server
Loaded: loaded (/usr/lib/systemd/system/glances.service; disabled; preset: disabled)
Active: active (running) since Fri 2023-02-24 10:25:36 UTC; 26s ago
Main PID: 57020 (glances)
Tasks: 1 (limit: 4700)
Memory: 18.8M
CGroup: /system.slice/glances.service
└─57020 /usr/bin/python /usr/bin/glances -s
Feb 24 10:25:36 archlinux systemd[1]: Started Glances Server.
Step 4 - How to Use Glances
Glances provides a command line interface that allows you to monitor your system resources via the command line.
Open your command line interface and run the following command.
glances
You should see the Glances monitoring shell on the following screen.
Press the h key to see all available options as shown below:
Press the q key to exit from the Glances shell.
Step 5 - Create a Systemd Service for Glances Web
You can also monitor the system resources via a web-based interface. To do so, you will need to start Glances in web server mode.
First, create a systemd service for Glances web.
nano /usr/lib/systemd/system/glancesweb.service
Add the following configurations:
[Unit]
Description = Glances in Web Server Mode
After = network.target
[Service]
ExecStart = /usr/bin/glances -w -t 5
[Install]
WantedBy = multi-user.target
Save and close the file then reload the systemd daemon to apply the changes.
systemctl daemon-reload
Next, start and enable the Glances web service:
systemctl start glancesweb
systemctl enable glancesweb
To check the status of the service, run the following command.
systemctl status glancesweb
You will get the following output.
glancesweb.service - Glances in Web Server Mode
Loaded: loaded (/usr/lib/systemd/system/glancesweb.service; disabled; preset: disabled)
Active: active (running) since Fri 2023-02-24 10:29:23 UTC; 4s ago
Main PID: 57076 (glances)
Tasks: 1 (limit: 4700)
Memory: 19.9M
CGroup: /system.slice/glancesweb.service
└─57076 /usr/bin/python /usr/bin/glances -w -t 5
Feb 24 10:29:23 archlinux systemd[1]: Started Glances in Web Server Mode.
At this point, the Glances web is started and listens on ports 61208 and 61209. You can check it using the following command.
ss -antpl | grep glances
You should see the following output.
LISTEN 0 0 0.0.0.0:61208 0.0.0.0:* users:(("glances",pid=57076,fd=4))
LISTEN 0 0 0.0.0.0:61209 0.0.0.0:* users:(("glances",pid=57020,fd=4))
Step 6 - Access Glances Web
Now, open your web browser and access the Glances Web UI using the URL http://your-server-ip:61208. You should see the following screen.
Conclusion
In this post, we explained how to install the Glances monitoring tool on Arch Linux. We also explained how to enable the Glances web server mode to access it via a web-based interface. You can now start monitoring your system resources via the web browser. You can now implement the Glances monitoring tool on a dedicated server from Atlantic.Net!
### How To Install Sails.js Framework with Nginx on Arch Linux
Sails is a free, open-source, popular MVC framework for Node.js. It is built on Express and used for building scalable production-ready Node.js applications. It is very similar to the Ruby on Rails web framework used to quickly build REST APIs, single-page apps, and real-time apps. It has a powerful code generator that helps you to build your application with less coding.
This post will show you how to install Sails JS with Nginx on Arch Linux.
Prerequisites
A fresh Arch Linux server
A root password configured on your server
An IPV6 IP address associated with your instance
Step 1 - Configure Repository
By default, the default repository is outdated in Arch Linux, so you will need to modify the default mirror list. You can do it by editing the mirror list configuration file:
nano /etc/pacman.d/mirrorlist
Remove all lines and add the following lines:
## Score: 0.7, United States
Server = http://mirror.us.leaseweb.net/archlinux/$repo/os/$arch
## Score: 0.8, United States
Server = http://lug.mtu.edu/archlinux/$repo/os/$arch
Server = http://mirror.nl.leaseweb.net/archlinux/$repo/os/$arch
## Score: 0.9, United Kingdom
Server = http://mirror.bytemark.co.uk/archlinux/$repo/os/$arch
## Score: 1.5, United Kingdom
Server = http://mirrors.manchester.m247.com/arch-linux/$repo/os/$arch
Server = http://archlinux.dcc.fc.up.pt/$repo/os/$arch
## Score: 6.6, United States
Server = http://mirror.cs.pitt.edu/archlinux/$repo/os/$arch
## Score: 6.7, United States
Server = http://mirrors.acm.wpi.edu/archlinux/$repo/os/$arch
## Score: 6.8, United States
Server = http://ftp.osuosl.org/pub/archlinux/$repo/os/$arch
## Score: 7.1, India
Server = http://mirror.cse.iitk.ac.in/archlinux/$repo/os/$arch
## Score: 10.1, United States
Server = http://mirrors.xmission.com/archlinux/$repo/os/$arch
Save and close the file, then update all the package indexes with the following command:
pacman -Syu
Step 2 - Install Node JS and NPM
First, install NVM on your system with the following command.
curl -o- https://raw.githubusercontent.com/nvm-sh/nvm/v0.39.2/install.sh | bash
You will get the following output.
export NVM_DIR="$HOME/.nvm"
[ -s "$NVM_DIR/nvm.sh" ] && \. "$NVM_DIR/nvm.sh" # This loads nvm
=> Close and reopen your terminal to start using nvm or run the following to use it now:
Next, run the following command to activate the NVM environment variable.
export NVM_DIR="$HOME/.nvm"
[ -s "$NVM_DIR/nvm.sh" ] && \. "$NVM_DIR/nvm.sh" # This loads nvm
Now, verify the NVM version using the following command.
nvm --version
Output.
0.39.2
Next, install the latest version of Node JS using the following command.
nvm install --lts
You will get the following output.
Installing latest LTS version.
Downloading and installing node v18.14.2...
Downloading https://nodejs.org/dist/v18.14.2/node-v18.14.2-linux-x64.tar.xz...
####################################################################################################################################### 100.0%
Computing checksum with sha256sum
Checksums matched!
Now using node v18.14.2 (npm v9.5.0)
Creating default alias: default -> lts/* (-> v18.14.2)
To verify the Node JS version, run the following command.
node --version
Output.
v18.14.2
Next, find the Node JS installation path using the following command.
which node
You will get the following output.
/root/.nvm/versions/node/v18.14.2/bin/node
Next, use the above path to create a symbolic link for Node JS.
ln -s /root/.nvm/versions/node/v18.14.2/bin/node /usr/bin/node
Step 3 - Install Sails JS
You can use the NPM to easily install the Sails JS on your server.
npm -g install sails
You will see the following output.
added 230 packages in 10s
6 packages are looking for funding
run `npm fund` for details
npm notice
npm notice New patch version of npm available! 9.5.0 -> 9.5.1
npm notice Changelog: https://github.com/npm/cli/releases/tag/v9.5.1
npm notice Run npm install -g npm@9.5.1 to update!
npm notice
Step 4 - Create a Sails JS Application
First, create a directory to hold Sails JS with the following command.
mkdir sails
Next, navigate to the Sails directory and create a Sails app with the following command.
cd sails
sails new app
You will be asked to select the template:
Choose a template for your new Sails app:
1. Web App · Extensible project with auth, login, & password recovery
2. Empty · An empty Sails app, yours to configure
(type "?" for help, or to cancel)
? 1
Type 1 and press the Enter key to continue.
= info: Installing dependencies...
Press CTRL+C to cancel.
(to skip this step in the future, use --fast)
info: Created a new Sails app `app`!
Next, change the directory to the app directory and start the Sails app with the following command.
cd app
sails lift
You will see the following output.
info: Starting app...
info: Initializing project hook... (`api/hooks/custom/`)
info: Initializing `apianalytics` hook... (requests to monitored routes will be logged!)
info: ·• Auto-migrating... (alter)
info: Hold tight, this could take a moment.
info: ✓ Auto-migration complete.
debug: Running v0 bootstrap script... (looks like this is the first time the bootstrap has run on this computer)
info:
info: .-..-.
info:
info: Sails <| .-..-.
info: v1.5.4 |\
info: /|.\
info: / || \
info: ,' |' \
info: .-'.-==|/_--'
info: `--'-------'
info: __---___--___---___--___---___--___
info: ____---___--___---___--___---___--___-__
info:
info: Server lifted in `/root/sails/app`
info: To shut down Sails, press + C at any time.
info: Read more at https://sailsjs.com/support.
debug: -------------------------------------------------------
debug: :: Fri Feb 24 2023 10:13:10 GMT+0000 (Coordinated Universal Time)
debug: Environment : development
debug: Port : 1337
debug: -------------------------------------------------------
Press the CTRL+C to stop the application
Next, find the Sails installation path with the following command.
which sails
Output.
/root/.nvm/versions/node/v18.14.2/bin/sails
Use the above path to create a symbolic link of Sails binary.
ln -s /root/.nvm/versions/node/v18.14.2/bin/sails /usr/bin/sails
Step 5 - Create a Systemd Service File for Sails JS
Next, it is a good idea to create a systemd file to manage the Sails JS service.
nano /lib/systemd/system/sails.service
Add the following configurations.
[Unit]
After=network.target
[Service]
Type=simple
User=root
WorkingDirectory=/root/sails/app
ExecStart=/usr/bin/sails lift
Restart=on-failure
[Install]
WantedBy=multi-user.target
Save and close the file, then reload the systemd daemon to apply the changes.
systemctl daemon-reload
Next, start and enable the Sails service with the following command.
systemctl start sails
systemctl enable sails
You can check the status of the Sails service with the following command.
systemctl status sails
You will get the following output.
● sails.service
Loaded: loaded (/usr/lib/systemd/system/sails.service; disabled; preset: disabled)
Active: active (running) since Fri 2023-02-24 10:15:30 UTC; 4s ago
Main PID: 56668 (node)
Tasks: 22 (limit: 4700)
Memory: 174.2M
CGroup: /system.slice/sails.service
├─56668 node /usr/bin/sails lift
└─56677 grunt
Feb 24 10:15:32 archlinux sails[56668]: info: ____---___--___---___--___---___--___-__
Feb 24 10:15:32 archlinux sails[56668]: info:
Feb 24 10:15:32 archlinux sails[56668]: info: Server lifted in `/root/sails/app`
Feb 24 10:15:32 archlinux sails[56668]: info: To shut down Sails, press + C at any time.
Feb 24 10:15:32 archlinux sails[56668]: info: Read more at https://sailsjs.com/support.
Feb 24 10:15:32 archlinux sails[56668]: debug: -------------------------------------------------------
Feb 24 10:15:32 archlinux sails[56668]: debug: :: Fri Feb 24 2023 10:15:32 GMT+0000 (Coordinated Universal Time)
Feb 24 10:15:32 archlinux sails[56668]: debug: Environment : development
Feb 24 10:15:32 archlinux sails[56668]: debug: Port : 1337
Feb 24 10:15:32 archlinux sails[56668]: debug: -------------------------------------------------------
Step 6 - Install Nginx for Sails JS
Next, you will need to install and configure Nginx as a reverse proxy for Sails JS. First, install the Nginx package using the following command.
pacman -S nginx-mainline
Next, start and enable the Nginx service with the following command.
systemctl start nginx
systemctl enable nginx
Next, create a directory to store Nginx virtual host.
mkdir /etc/nginx/sites-enabled
Next, create an Nginx configuration file for Sails JS.
nano /etc/nginx/sites-enabled/sails.conf
Add the following configuration.
server {
listen 80;
server_name sails.example.com;
location / {
proxy_pass http://localhost:1337/;
proxy_set_header Host $host;
proxy_buffering off;
}
}
Save the file, then edit the Nginx main configuration file.
nano /etc/nginx/nginx.conf
Add the following lines after http{:
server_names_hash_bucket_size 64;
include sites-enabled/*;
Save the file then verify the Nginx configuration.
nginx -t
You will get the following output.
nginx: the configuration file /etc/nginx/nginx.conf syntax is ok
nginx: configuration file /etc/nginx/nginx.conf test is successful
Finally, restart the Nginx service to apply the changes.
systemctl restart nginx
Step 7 - Access Sails JS Web UI
Now, open your web browser and access the Sails JS web interface using the URL http://sails.example.com. You should see the Sails JS registration page on the following screen.
Provide your name, email, password then click on the Create account button. You should see the Sails JS dashboard on the following screen.
Conclusion
In this tutorial, we explained how to install Sails JS on Arch Linux. We also explained how to configure Nginx as a reverse proxy for Sails JS. You can now start deploying your Sails JS app on the production environment. You can now install Sails JS on dedicated server hosting from Atlantic.Net!
### Biotech AI
Biotech AI is an emerging field that combines the principles of biotechnology with the capabilities of artificial intelligence (AI). Biotech AI uses machine learning algorithms and other techniques such as unsupervised, reinforcement, and deep learning to analyze complex biological data, identify patterns and insights, and develop new drugs and treatments.
The integration of biotech and AI has the power to transform the healthcare and medical research landscape. The potential impact is immense by facilitating the drug discovery process, creating tailored treatment plans, and enhancing the precision and speed of medical diagnosis and treatment.
In this article, we will explore the innovative ways in which AI is revolutionizing the biotech industry and what exciting opportunities this cutting-edge technology will bring to our everyday lives in the future.
Drug Discovery
The drug discovery process is a complex and costly endeavor, typically taking a decade or more and incurring expenses upwards of $2 billion to introduce a new drug to the market. Fortunately, the emergence of AI in biotech promises to streamline and accelerate this process. With its ability to analyze vast amounts of data, AI is well-suited to identify new drug targets and evaluate the efficacy of potential treatments.
Groundbreaking work in this field has already been carried out, such as Deep Genomics use of machine learning algorithms to study genomic data and identify genetic mutations that cause diseases. Similarly, Atomwise has harnessed the power of machine learning to predict the binding affinity between molecules and protein targets, enabling the creation of new drug candidates based on this information. Such advances hold tremendous promise for the biotech industry, offering the potential to transform medical research and enhance people's lives worldwide.
Optimizing Drug Efficacy
In addition to accelerating drug discovery, biotech AI can potentially optimize the effectiveness of existing drugs by leveraging data from clinical trials to predict which patients are most likely to benefit from a particular treatment. One remarkable example is the work of a UK-based company, BenevolentAI, which applied AI to analyze clinical trial data for Baricitinib, a drug commonly used to treat rheumatoid arthritis. The company's analysis uncovered the drug's effectiveness in combating COVID-19, leading to the development of a clinical trial to further investigate its efficacy in treating the disease.
By unlocking new insights from existing data, AI is revolutionizing the way medical professionals approach treatment, offering the potential for more precise and personalized care. The potential benefits of repurposing existing drugs for novel therapeutic applications are increasingly being recognized across the medical field. With the aid of AI, it is now possible to analyze the molecular structure of drugs and predict how they may interact with various proteins in the body, thus identifying new uses for drugs that have already been approved by regulatory agencies.
This approach can significantly accelerate drug development, particularly for conditions requiring new treatments. For example, Insilico Medicine, a US-based biotech company, is harnessing the power of AI to repurpose existing drugs to develop treatments for new and existing diseases. Such innovative applications of AI highlight its transformative potential to unlock novel therapeutic options and revolutionize medical treatment.
Precision Medicine
Precision medicine is a burgeoning healthcare paradigm that considers individual variability in genes, environment, and lifestyle to tailor treatment plans uniquely for each patient. By enabling the analysis of vast amounts of patient data, AI can identify personalized treatment options that can improve outcomes while minimizing side effects.
For instance, Sophia Genetics leverages AI to analyze patients' genomic data, enabling physicians to identify optimal treatment options based on each patient's genetic profile. Through such innovative approaches, AI is transforming the field of medicine, empowering clinicians to deliver more personalized and effective treatments.
Genomics
The field of genomics involves the study of an organism's complete DNA sequence, including its genes, and has emerged as a promising area for disease diagnosis and treatment. With the advent of AI, researchers can now analyze vast amounts of genetic data, which can be used to identify disease risk factors and potential treatments. By analyzing a patient's DNA, researchers can identify genetic mutations that may be associated with a higher risk of developing certain diseases.
This information can facilitate the development of early detection tests, enabling clinicians to diagnose diseases at earlier stages when they may be more treatable. Furthermore, AI can aid in identifying potential therapeutic targets for various diseases, leading to the development of novel treatments that can improve patient outcomes. AI's ability to analyze genomic data can revolutionize disease diagnosis and treatment, paving the way for more precise, personalized, and effective healthcare.
Better Collaboration
The advancement of biotech AI demands deep collaboration between researchers and practitioners across diverse disciplines, such as biology, computer science, and medicine. This multidisciplinary approach fosters a more innovative problem-solving mindset and enables researchers to approach challenges from fresh perspectives, leading to novel solutions.
Collaboration among researchers from multiple disciplines facilitates faster and more accurate diagnosis, resulting in quicker treatment and improved patient outcomes. For instance, AI-powered imaging analysis can assist radiologists in identifying potential issues more quickly and accurately, allowing for more effective treatment.
Furthermore, AI can help research teams identify patterns and insights that may not be immediately apparent to the human eye, enabling them to work together to tackle complex problems. By promoting effective collaboration, biotech AI has the potential to accelerate research and development, ultimately leading to the discovery of new treatments and cures for various diseases.
Atlantic.Net and BioTech AI
Biotech AI is an exciting field with tremendous potential to advance healthcare and medical research. However, it can also be complex and challenging, requiring deep collaboration between researchers and practitioners. This is where Atlantic.Net's managed services can greatly assist biotech AI companies.
Atlantic.Net's managed services offer cutting-edge technology solutions to help biotech companies optimize their data analysis, streamline their workflows, and improve collaboration. Our experts in cloud computing, data security, and compliance can assist with building and deploying scalable infrastructure, ensuring data privacy and security, and complying with regulatory requirements.
With our managed services, biotech companies can focus on innovation and research without worrying about the complexity of managing IT infrastructure. Our team provides customized solutions that meet the unique needs of biotech companies, whether they are just starting out or looking to expand their operations.
In conclusion, Atlantic.Net's managed services offer a reliable and secure way to manage complex biotech infrastructure, enabling companies to focus on innovation and research. With our expertise in cloud computing and data security, we can help biotech AI companies accelerate their pace of research, reduce costs, and ultimately, bring life-saving treatments to patients faster.
Don't hesitate to contact us to learn more about how we can assist you in achieving your biotech AI goals.
### How To Install Cacti Monitoring Tool on Arch Linux
Cacti is a free, open-source, web-based monitoring tool used for monitoring remote systems via a web browser. It is a frontend application for RRDTool that allows users to poll services at specific intervals and graph the resulting data. With Cacti, you can monitor remote server and network devices such as routers, switches, and more. It uses SNMP protocol to collect various system metrics such as CPU, memory disk space, and bandwidth utilization.
In this post, we will show you how to install the Cacti monitoring tool on Arch Linux.
Step 1 - Configure Repository
By default, the default repository is outdated in Arch Linux, so you will need to modify the default mirror list. You can do it by editing the mirror list configuration file:
nano /etc/pacman.d/mirrorlist
Remove all lines and add the following lines:
## Score: 0.7, United States
Server = http://mirror.us.leaseweb.net/archlinux/$repo/os/$arch
## Score: 0.8, United States
Server = http://lug.mtu.edu/archlinux/$repo/os/$arch
Server = http://mirror.nl.leaseweb.net/archlinux/$repo/os/$arch
## Score: 0.9, United Kingdom
Server = http://mirror.bytemark.co.uk/archlinux/$repo/os/$arch
## Score: 1.5, United Kingdom
Server = http://mirrors.manchester.m247.com/arch-linux/$repo/os/$arch
Server = http://archlinux.dcc.fc.up.pt/$repo/os/$arch
## Score: 6.6, United States
Server = http://mirror.cs.pitt.edu/archlinux/$repo/os/$arch
## Score: 6.7, United States
Server = http://mirrors.acm.wpi.edu/archlinux/$repo/os/$arch
## Score: 6.8, United States
Server = http://ftp.osuosl.org/pub/archlinux/$repo/os/$arch
## Score: 7.1, India
Server = http://mirror.cse.iitk.ac.in/archlinux/$repo/os/$arch
## Score: 10.1, United States
Server = http://mirrors.xmission.com/archlinux/$repo/os/$arch
Save and close the file, then update all the package indexes with the following command:
pacman -Syu
Step 2 - Install Cacti Arch Linux
By default, the Cacti monitoring package is included in the Arch Linux default repository. You can install it by simply running the following command.
pacman -S cacti
Once Cacti is installed, you can proceed to install Nginx and PHP.
Step 3 - Install Nginx and PHP
Next, you will need to install Nginx, PHP, and other required extensions to host Cacti on the Internet. You can install all of them by running the following command.
pacman -S nginx-mainline php php-fpm php-gd php-intl
Once all the packages are installed, edit the php.ini configuration file and modify the default settings.
nano /etc/php/php.ini
Add/modify the following lines:
extension=gd
extension=gettext
extension=gmp
extension=ldap
extension=mysqli
extension=pdo_mysql
extension=snmp
extension=sockets
extension=intl
memory_limit = 512M
max_execution_time = 300
Save and close the file, then create a PHP-FPM configuration file for Cacti:
nano /etc/php/php-fpm.d/cacti.conf
Add the following lines:
[cacti]
user = cacti
group = cacti
listen = /run/cacti/cacti.sock
listen.owner = http
listen.group = http
pm = ondemand
pm.max_children = 4
Save and close the file, then start and enable the Nginx and PHP-FPM services using the following command.
systemctl start nginx php-fpm
systemctl enable nginx php-fpm
Step 4 - Install and Configure MariaDB Database
Cacti uses a MariaDB as a database backend, so you will need to install the MariaDB on your server. You can install it with the following command.
pacman -S mariadb
After installing the MariaDB server, initialize the MariaDB database with the following command.
mysql_install_db --user=mysql --basedir=/usr --datadir=/var/lib/mysql
Next, edit the MariaDB configuration file and tweak some default settings:
nano /etc/my.cnf
Add/modify the following lines:
[mysqld]
innodb = ON
collation-server = utf8mb4_unicode_ci
max_heap_table_size = 128M
tmp_table_size = 64M
join_buffer_size = 2M
innodb_file_format = Barracuda
innodb_large_prefix = 1
innodb_buffer_pool_size = 2048M
innodb_flush_log_at_timeout = 3
innodb_read_io_threads = 32
innodb_write_io_threads = 16
innodb_io_capacity = 5000
innodb_io_capacity_max = 10000
innodb_doublewrite = OFF
sort_buffer_size = 4M
Next, start and enable the MariaDB service with the following command.
systemctl start mysqld
systemctl enable mysqld
Next, log into the MariaDB shell with the following command.
mysql
Once you are logged in, create a database and user using the following command.
MariaDB [(none)]> CREATE DATABASE cactidb;
MariaDB [(none)]> GRANT ALL ON cactidb.* TO cactiuser@localhost IDENTIFIED BY 'some_password';
MariaDB [(none)]> GRANT SELECT ON mysql.time_zone_name TO cactiuser@localhost;
Next, flush the privileges and exit from the MariaDB shell with the following command.
MariaDB [(none)]> FLUSH PRIVILEGES;
MariaDB [(none)]> EXIT;
Next, import the Cacti database and timezone data with the following command.
mysql -u root -p cactidb web-app@0.1.0 start
Feb 24 09:03:42 archlinux npm[74477]: > react-scripts start --port=3000
Step 7 - Configure Ngonx for React App
By default, React app listens on the local host, so you will need to configure Nginx as a reverse proxy to access the React app from the remote machine.
First, install the Nginx package with the following command.
pacman -S nginx-mainline
Next, start and enable the Nginx service using the following command.
systemctl start nginx
systemctl enable nginx
Next, create a directory to store Nginx virtual host.
mkdir /etc/nginx/sites-enabled
Next, create an Nginx virtual host configuration file.
nano /etc/nginx/sites-enabled/react.conf
Add the following configuration.
upstream react_backend {
server localhost:3000;
}
server {
listen 80;
server_name react.example.com;
location / {
proxy_pass http://react_backend/;
proxy_http_version 1.1;
proxy_set_header Upgrade $http_upgrade;
proxy_set_header Connection "upgrade";
proxy_set_header Host $http_host;
proxy_set_header X-Real-IP $remote_addr;
proxy_set_header X-Forward-For $proxy_add_x_forwarded_for;
proxy_set_header X-Forward-Proto http;
proxy_set_header X-Nginx-Proxy true;
proxy_redirect off;
}
}
Save and close the file, then edit the Nginx main configuration file.
nano /etc/nginx/nginx.conf
Add the following lines after the line http {:
server_names_hash_bucket_size 64;
include sites-enabled/*;
Save the file, then verify the Nginx configuration.
nginx -t
Output.
nginx: the configuration file /etc/nginx/nginx.conf syntax is ok
nginx: configuration file /etc/nginx/nginx.conf test is successful
Next, restart the Nginx service to implement the changes.
systemctl restart nginx
Step 8 - Access React App
Now, open your web browser and access the React App using the URL http://react.example.com. You should see the React default page on the following screen.
Conclusion
In this tutorial, we showed you how to install React JS application on Arch Linux. We also configured Nginx as a reverse proxy for React app. Try to install React.js on dedicated hosting from Atlantic.Net!
### Top 8 Best USA-Based Software as a Service Solutions for SMBs in 2025
Today it's hard to imagine a business without any workplace software as technology has infiltrated every sector. As a result, companies are always looking for the best software to help them run their operations more smoothly and efficiently. However, finding the best software can be a daunting experience, especially for small businesses.
We've created this best Software-as-a-Service article to recognize the best software for U.S.-based SMBs. The nominees are all SaaS solutions that offer innovative customization or solve a universal problem.
What Is SaaS?
SaaS is software hosted in the cloud that you can access through the internet. It can be accessed remotely, typically via a web browser, and does not usually require specific installation data files or software packages on your company or home computer.
A SaaS vendor provides the entire software product and all future updates and patches, so there is no need to worry about updating programs, upgrading your internet connection, or other technical difficulties.
1. TalkDesk
TalkDesk is a SaaS-based customer communication platform that helps businesses improve customer engagement through chat and email. With TalkDesk, companies can easily manage customer conversations, contact information, and email messages in one place. Plus, TalkDesk offers a variety of features to make managing customer communication easy, including:
Real-time communication: TalkDesk lets businesses chat with customers in real time, so you can quickly address any issues.
Customizable messages: You can customize your notifications to match your brand and style.
Email integration: TalkDesk lets you easily integrate with your email system to send and receive messages.
2. Slack
Slack is a cloud-based communication platform that helps teams work better together. You can get more done with Slack by letting your team chat and share information instantly. Slack has many advantages, such as managing your communication with bots and integrating other tools. In addition, Slack offers effortless integration with ticketing systems, cloud applications, and anything with an API to improve knowledge sharing across the business.
Slack is hugely popular, and its integrations and capabilities make it easy to communicate with coworkers, customers, and teams. It stands out in a crowded instant messaging market and it's an easy way to stay connected with your team and a great way to share information.
3. Trello
Trello is a popular Kanban-style project management tool. Some of the critical features of Trello include its easy-to-use interface, collaboration features, and ability to track progress and changes. The platform allows teams to track progress and changes in their projects. In addition, the Kanban boards enable users to assign tasks to team members, post a project to a person, and set reminders to ensure their team can manage multiple tasks simultaneously.
Trello integrates with Google Docs, Gmail, and YouTube, to name a few. It has been designed to make teamwork more accessible than ever, thanks to its easy-to-use interface, intuitive organization, ability to group cards, and easy-to-use clients. The Trello app is available for various mobile phones and tablets.
4. Toggl
Toggl is a cloud-based time tracking and productivity tool that helps employees capture and manage their work on a single platform. With key features like remote access and automatic export to many popular productivity tools, Toggl is an excellent choice for freelancers and big or small businesses.
Toggl has intelligent ways to manage your time, projects, and employees' time. Time management is essential to track costs and direct your team's focus. In addition, it can track the team's workflow and helps to prevent the siloing of team information.
5. Bit.ai
Bit is a robust shared documentation and collaboration tool. Bit is a workflow solution that allows users to manage and share content effectively; you can create, edit and share from the same place. It also has a content management system and a document editor that is compatible with all the latest office suites, making it ideal for creating and managing content.
Bit also has end-to-end sharing capabilities that make it perfect for sharing documents with teammates, with an easy-to-use frontend. Finally, Bit offers a variety of branding and security options that make it a top choice for businesses.
6. Atlassian Suite
The Atlassian Suite is a comprehensive SaaS platform that provides users with various tools to manage their work and projects. Their target audience is DevOps engineers and Developers. It includes popular collaboration tools such as the agile ticket system Jira and the related Jira Service Manager for tracking change management and tech support.
Jira is a popular project management tool that allows users to manage their work and projects efficiently. In addition to tracking tasks, deadlines, and changes, Jira provides users with various other features, such as task boards, chat features, and integrations with other software.
All Atlassian products integrate and use similar user interfaces, which makes them super user-friendly. In addition, the suite includes the popular Confluence documentation hub and the BitBucket source code repository service.
7. Zoho
Zoho is a cloud-based business software company that offers a suite of products that helps businesses manage their data, collaborate, and get work done. Zoho features include a drag-and-drop interface, a powerful CRM, and a robust email platform. Zoho's benefits include a simple, user-friendly interface, a wide range of parts, and a support team that is available 24/7.
Zoho has over 45 SaaS products for almost all industries, and popular products include social and marketing, support desk, human resources, accounting, and operations. In addition, each product can be integrated with enterprise SaaS products such as GSuite, Microsoft 365, and Shopify.
8. Miro
Miro is a visual cloud-based project management tool that creates a virtual space for virtual collaboration. With Miro, users can create and edit pictorial boards with various tools and templates. In addition, users can create visualizations such as the Storyboard, which helps users to create a video with a pre-determined structure.
Miro is quite a unique collaboration product that increases efficiency and productivity by managing projects more effectively and efficiently and reducing the time needed to complete the work. In addition, it offers greater transparency and communication by making it easy for team members to share and collaborate on projects.
How Can Atlantic.Net Help?
If you are looking for a cloud partner, consider adopting a leading cloud service provider as your partner to power the technology your business demands. With over 30 years of proven experience, our full suite of managed services and trusted professional support team will build the perfect customized hosting solution to support your business or organization.
Atlantic.Net is SOC 2, and SOC 3 certified, HIPAA and HITECH audited via qualified and independent third-party auditors. In addition, we provide 24x7x365 support, monitoring, and world-class data center infrastructure. You can find out more information by contacting our sales team today!
### RAID 0, 1, 5, 6, 10, 50 Advanced
Storage systems are absolutely fundamental for the future of the cloud, and there is a hunger for ultra-reliable, high-performance, and expansive storage systems. It is now commonplace to see flash-based storage, SSD arrays, and traditional mechanical disks in the data center. Storage hardware has progressed extensively in recent years, and RAID technology is an ever-present design choice.
To quickly recap, RAID technology underpins nearly every server environment and its purpose is to provide faster IOPs and preserve data integrity. There are several different RAID configurations that perform differently depending on the scenario: RAID that provides superfast I/O, RAID that creates multiple layers of data protection, and RAID that blends both I/O and data protection.
This article is for advanced users, meaning that we will assume that you are already familiar with storage and RAID. However, if you are just starting the journey it would be advisable to check out an introduction to RAID, you can find them on the Atlantic.Net blog here and here for RAID 10.
Remember that problems with RAID can occur over an extended time, so it's important to have a number of safeguards in place such as replication and data backups. RAID is a protection status, not a backup solution.
Why Is It Best Practice To Stop Using A RAID Array If A Drive Fails?
Local server RAIDs are typically very reliable, but occasionally issues have been encountered that impact the integrity of the array. RAIDs are susceptible to environmental events such as power loss, inadequate cooling, or increased humidity. If using RAID 1, 5, 6, or greater, then your data will be safe providing precautions are followed.
If a drive fails in a RAID 1 configuration, it is recommended to stop using the server and any attached disks. RAID 1 mirrors the data between at least 2 disks, giving you 1:1 copies of the data. If a disk fails, the RAID will go into a failed state until the disk is replaced. You will effectively be working on a single disk with zero redundancy. If the working disk(s) fail, all of the data will be lost, so swapping out the failed disk should be a top priority.
How Does Each RAID Level Affect Performance?
RAID can provide many performance benefits; it's possible to get superfast performance and strong data resilience by using nested RAID. Parity blocks are written to the RAID member disks and the storage controller tracks where each block resides. This is all done in a near-instant fashion, but the type of RAID configuration used can impact performance significantly.
RAID performance depends on several factors: the capacity of the disk, the number of disks in the array, the type of disk (flash / SSD / mechanical), and read/write IOPS. Working out the performance is complicated, however, there is a great calculator here.
RAID 0 Performance: RAID 0 is always the fastest option, but there is no data protection built in. If the array fails, that's it - all data is gone. RAID 0 divides the data between at least 2 disks, every striped disk in the array can be used simultaneously to read/write. The more disks you use in RAID 0, the better the performance.
Nested RAID performance: Nested RAID levels like RAID 10, 50, and 60 consist of two or more sets of mirrored disks. Read performance is great and writing is good. However, latency is introduced as writes are doubled per sub-array.
RAID 10 has multiple mirrored disks, and RAID 50 has more disks per sub-array allowing 1 disk per sub-array to be fault-tolerant. RAID 60 is very much the same except 2 disks can fail in the sub-array. Nested RAID levels require many disks and the available disk capacity ranges from 50% up to 80% depending on the number of disks.
RAID 5 Performance: RAID 5 is all about resilience; performance is good for reads and fair for writes. The introduction of parity on a single array creates a write bottleneck. To limit this problem, you can leverage SSD caching or, if feasible, purchase flash memory storage.
RAID 6 Performance: RAID 6 is even more resilient than RAID 5, allowing up to 2 disks to fail at any one time. The payback is that performance is impacted as 2 parity blocks are written each cycle making performance much slower than RAID 5.
What About Software vs Hardware RAID?
The type of RAID controller impacts performance considerably. Controller cards can be either physical, often dedicated riser cards, or software-defined controllers. Software controllers are cheap but they can impact performance drastically. The software controller offloads RAID processing to the CPU, this is generally a bad idea in business-critical systems because storage I/O is CPU intensive.
Most servers and production systems are configured with physical controller cards. These riser cards plug directly into the system board of the server and process all RAID I/O requests. This is not only much faster than offloading to the server CPU, but it eliminates any I/O bottlenecks. Physical controller cards enable advanced features such as multi-pathing and failover channels for redundancy, and often larger production servers will have multiple riser cards installed.
How Is the RAID Rebuild Time Affected by Raid Level?
When a hard disk fails within an array, the RAID controller marks the disk as failed. The controller will automatically use any available hot spare disk to rebuild the array. The parity blocks that are saved on each disk are used by the controller to rebuild the data array.
The time taken to rebuild the array varies per RAID level, the size and speed of the disks, and the size of the array. RAID 5 is a common configuration because you get good performance and decent resilience, and the rebuild times are quick because only 1 disk needs rebuilding at a time.
The disk utilization, the used space, and the size of the disk all impact the time taken to rebuild the array. For mechanical disks, you are looking at about 24 hours per 1TB disk if the system is heavily used.
How Do You Monitor the RAID Array?
Storage systems are often overlooked when it comes to monitoring. This can have catastrophic consequences on the health of the array. Storage controllers support SMTP so email traps can be sent to a team of support engineers with ease.
Most controllers feature a dial-home feature, and when configured correctly the storage controller automatically alerts the hardware vendor of any failure or pending failure to disk or storage hardware. Depending on your level of paid tech support, replacement hardware and an engineer will be dispatched automatically.
Despite this useful feature, monitoring is essential, so what events should you alert against?
Disk Health: Monitor disk state to alert against failed or pending disk failures.
Controller Failover: It's critical to ensure controller failover is monitored. Failover is not necessarily a bad thing, but if there are configuration mismatches on the disk paths access to data can be severed.
Performance: Monitor I/O looking for bottlenecks and performance degradation.
RAID Card Health: A ping check to ensure the controller card is up and alert against any state changes including health checks against the node canister processing units.
Battery Backup Unit Health: The state of the BBU is critical because it saves the cached state of the array. If the battery is dead and then the array fails, the chance of data loss is significant.
Error Logs: The event logs on the storage are detailed and highly accurate. A healthy array rarely alerts, so keep your eyes open for events because it's a very good indicator of an issue.
Do RAID Types Matter Now That HHDs Have Been Replaced By SATA SSD and NVME SSDs?
SSDs are so affordable now that it is commonplace to have SSD or NVME-based storage systems. RAID is still essential for data protection even when using SSD/NVME. There is certainly less need for RAID 0 arrays, however, solid-state disks work very well in RAID 50, 60, and RAID 5, 6.
Atlantic.Net RAID Options
The ACP Cloud features an exclusively SSD-based, multi-tiered, and highly redundant array. Every cloud customer benefits from the breakneck performance of our storage systems. Customers also have the option to leverage dedicated servers with either SSD or NVME storage.
To add a Dedicated Host or learn more about our storage options, please contact the Atlantic.Net Sales Team by calling 888-618-DATA (3282) (toll-free) or +1-321-206-3734 (international) or writing to us via the Contact Page and we will be happy to assist you.
### How to Ensure Your Veeam Backups Are Not Vulnerable to Ransomware
Veeam Backup & Replication is an enterprise-grade backup platform from Veeam Software that provides an industry-leading data protection suite for virtual and physical workloads. Atlantic.Net has partnered with Veeam Software and integrated our Managed Veeam Service into most of our cloud and on-premise hosting solutions.
Data protection is an essential business practice to uphold the integrity of mission-critical business data. Daily backups are the minimum requirement of most businesses. Personal users can also reap the benefits of a sensible backup solution to keep hold of precious files or treasured family photographs.
Ransomware is a serious and growing concern. Ransomware attacks can render files and folders useless as they become encrypted, making them impossible to access unless a ransom for the decryption key is paid to the threat actor. In addition, it's possible the ransomware attack may not be identified immediately, resulting in the infected files being backed up automatically as part of a predefined backup schedule.
The worst-case scenario is when the data is restored, but the backup is infected with ransomware, and critical files are encrypted and inaccessible. In this article, we will discover the advanced protections offered in Veeam that specifically target ransomware, and we will learn how Atlantic.Net hosting services offer world-class protection against ransomware.
How Does Ransomware Threaten Data Protection?
A secure backup is considered the last line of defense against ransomware. If all else fails, at least you have a good backup to restore. Consider what would happen if your backup was a dud. Would you pay the ransom? The U.S. government advises never to pay the ransom simply because it encourages hackers to continue these campaigns.
Businesses should make backup planning part of their cybersecurity defense plan. It requires backups to be planned, tested, and regularly reviewed to maintain a robust security posture. If you’re in the IT industry or work in an IT-adjacent role, you may have frequently heard, "oh, just restore it from backup" as a solution. Unfortunately, sometimes the solution is not that simple, especially when swathes of critical business infrastructure have been taken down by ransomware.
For these reasons, it is essential to have a backup solution that protects against ransomware infecting your server backups.
How to Amend Your Backup Strategy to Defend Against Ransomware
The first step in defending against ransomware in your backups is to review your existing backup schedule in great detail. It is essential to introduce procedural best practices when managing backups.
This should include:
Review Existing Backup Schedule: Take time to review the existing backup configuration. Ensure all in-scope servers are backed up correctly and that you have selected the required disk or VM-level backup. Ask yourself which disks need backup. Do you need a copy of the system state?
Check Your Backup Start and Finish Times: Check that your backups start within the start window and finish when expected. Treat a missed backup the same as a failed backup.
Always Alert Against Backup Failures: Any backup issues should be alerted against and resolved by a support team. If the backup fails, do you need to re-run it manually? Has the backup failed or over-run?
Educate Your Employees: Training staff about the latest cybersecurity threats is a great way to improve the business's security posture. Employees are the human firewall. They protect your business from phishing, social engineering, and accidental disclosure (all key attack vectors for hackers), so ensuring they are well-trained will improve security.
Follow the 3-2-1 Rule of Backups: This rule is fundamental to data protection because it offers the best protection for mission-critical data. There should be at least three copies of important data, on at least two different types of media, with at least one of these copies being offsite. To defend against ransomware, Veeam recommends introducing an "air-gapped, offline or immutable" backup - this means a copy of your organization's data that's offline and inaccessible. Your backup device can't be remotely hacked or corrupted without an internet or other network connection.
How Can Veeam Protect Against Ransomware?
Veeam has several built-in protections that combine to create additional layers of security to help defend against ransomware. Ultra-resilient media underlines ransomware protection. We have already mentioned offline, air-gapped and immutable backups. This is achieved by leveraging immutable backups from your cloud provider or by using a hardened repository for the data.
If you are still using tape backups, use tapes that support WORM (Write Once Read Many). In extreme cases, you may want to consider removable disk media or rotation of backup drives - however, this method is costly.
Other ways Veeam can protect against ransomware are:
Use the Veeam Backup Schedule: Your business's backup schedule defines what protection you enforce. Data retention dictates how long backup media is kept and in what data cycle. The most common methods are daily, weekly, monthly, and yearly backups. Where you save, the weekly and monthly are essential. Do you keep them offline? Do you commit to an offsite location? Do you send a tape backup offsite to a secured location?
Trusted Immutability: Veeam supports multiple storage layers locally and in the cloud. Having a secured hardened repository onsite and then offloading data to a multi-site cloud provider like Atlantic.Net would fulfill trusted immutability. Veeam refers to this as 'copy mode' and 'move mode.'
Backup Verification: Knowing that you have a good backup is critical when restoring data. Reviewing logs and backup reports is possible, but verifying the data is the only way to be entirely confident of a good backup. You could perform a test restore, but this is a lengthy process. Veeam uses a tool called SureBackup that runs multiple tests on your backups to confirm the data is malware free and that the data can be recovered.
Atlantic.Net Veeam Managed Service
Atlantic.Net is a global cloud services provider with over 25 years of experience, specializing in Windows, Linux, and FreeBSD server hosting. Veeam Backup is used extensively throughout the business, and we are delighted with its performance and the protection standards it affords.
Atlantic.Net provides business-class dedicated and VPS hosting solutions focusing on security, compliance, and simplifying the user experience.
Atlantic.Net offers fully-managed environments, security, and compliance-focused solutions across all its hosting facilities in San Francisco, New York, London, Toronto, Dallas, Ashburn, and Orlando. With a range of certifications, along with SSAE 18, SOC 2, SOC 3, HIPAA, and HITECH-audited data center infrastructure, Atlantic.Net is a security-first provider. For more information, please visit www.atlantic.net.
### Best Cloud Migration Solution in 2025
The Cloud Computing market is surging in popularity. The Covid-19 pandemic cemented the need for global businesses to be more agile and adaptable to successfully navigate the troubled waters of the pandemic. The cloud provided these capabilities, and companies embarked on migrating critical IT services to their preferred cloud provider at an unprecedented scale.
Migrating production workloads is a big task. One that requires careful planning and deep consideration. It needs clear guidelines and goal objectives to be successful. Businesses often outsource this responsibility to a cloud services provider or business partner.
A cloud migration tool is software that helps to move your files, folders, and applications from your current computing environment to the cloud. While there are many different types of migration tools on the market, the best ones offer a comprehensive solution that can handle all aspects of the migration process for you.
This article will discover the best cloud migration solutions and how they can help you move your business to the cloud. We'll also introduce you to some of the best tools on the market and show you how to choose the right one for your business.
1. Atlantic.Net Cloud Migration Service
Atlantic.Net understands that migrating your production and development environments can be daunting for IT departments that are often already stretched thin.
Atlantic.Net offers three migration plans:
Standard: The Standard Migration service includes migrating defined data directories from your current system, either on-premise or at another provider. Atlantic.Net's Security Operations Center (SOC) handles the data migration and will ensure that your desired data makes it into your new environment. Our skilled team of experts performs migrations for new clients daily, including cPanel migrations, file share migrations, and Plesk migrations.
Advanced: Your migration will be assigned to a dedicated engineer who will discuss your current and new environment plans, review your current and new environments to ensure compatibility, and assist with planning the migration. A dedicated engineer will then complete the migration on your behalf.
Enterprise: Enterprise Migrations include everything from the Standard and Advanced migration services with the added feature of allowing our engineering department to perform complete bare metal restores (BMR) or Physical to Virtual migrations (P2V).
2. Velostrata (Migrate for Compute Engine)
Velostrata is a cloud migration tool exclusively used with the Google Cloud Platform. Its purpose is to migrate infrastructure and applications to GCP in a simple, user-friendly package. It offers automatic workload sizing, automated deployment, and quick recovery and integrates with many on-premise application stacks, including VMware, HyperV, and physical and virtual servers. You can also migrate workloads from other cloud providers into GCP, but there is no feature to migrate out of GCP.
3. CloudEndure
CloudEndure is a software-as-a-service (SaaS) platform that enables organizations to create runbooks to automate migrating their cloud-based applications to AWS. With CloudEndure, you can automate cloud-based tasks, such as application deployment, update management, and compliance testing.
CloudEndure also offers a range of features to help keep all on-premise and migrated data in sync. For example, you can use CloudEndure's Runbook Designer to create and edit migration strategies, and the Runbook Manager will manage data synchronization automatically. If you are looking to automate your cloud-based migration process, CloudEndure is a valuable tool.
4. DataDog
DataDog is a cloud-based data migration tool that makes it easy to move your data from one cloud storage provider to another. With DataDog, you can quickly move your data between Amazon AWS, Google Cloud Platform, Microsoft Azure, and Rackspace Cloud. DataDog also offers a migration advisor to help you make the most informed decision about which cloud storage provider to use. In addition, DataDog takes the hassle out of data migration by automating the process of moving your data to the cloud.
5. Dynatrace
Dynatrace is a comprehensive cloud migration management solution that helps organizations migrate their workloads to the cloud quickly, accurately, and confidently. Dynatrace provides a complete end-to-end platform to manage migrations, including pre-and post-migration planning, migration execution, and post-migration support. Dynatrace is also unique in its ability to integrate with other cloud-based tools to provide a holistic cloud migration experience.
6. AppDynamics
AppDynamics is a global leader in cloud migration solutions. It offers robust features to help customers move their applications to the cloud, including on-demand migration, automation, and integration with other cloud-based solutions. As a result, AppDynamics helps customers move their applications to the cloud quickly, efficiently, and cost-effectively.
The AppDynamics agent can scan deep inside your network to determine how your existing infrastructure hangs. AppDynamics helps customers move their applications with minimal disruption with its on-demand migration and automation capabilities. In addition, AppDynamics integrates with other cloud-based solutions to help customers advance their applications faster and more efficiently.
7. Carbonite Migrate
Carbonite Migrate is a cloud migration tool that helps users move their data and applications to different cloud platforms. It offers a variety of features that can make the migration process more manageable.
Carbonite Migrate creates a virtual copy of the data and applications that will be moved. This virtual copy can then test the migration process before it is executed. Once the migration is complete, the virtual copy can get deleted to free up space on the original system.
8. Turbonomic
Turbonomic is the latest in a long line of cloud-based business automation tools. It offers a comprehensive set of features to help businesses streamline their workflows.
Turbonomic is perfect for migrating your business to the cloud. It offers a simple, easy-to-use interface and integrates seamlessly with other cloud-based applications. Plus, it provides a wide range of features to help you manage your business more efficiently.
9. Flexera
Flexera is a cloud-based migration platform designed to help organizations move their applications and data to the cloud. It features many features, including migration tools, data management, and security.
There are several reasons why organizations might want to use Flexera. For example, it can help streamline the migration process by providing various tools and features. In addition, Flexera can help to protect data by providing a range of security features. Finally, it can help to reduce the costs associated with moving to the cloud by providing a range of cost-effective options.
10. Corent Surpass
Corent Surpass is a cloud migration tool that helps organizations move their applications and data to the cloud.
Features of Corent Surpass include:
Automatic application and data migration
Real-time tracking and reporting
Customizable migration plans
Secure data transfers
Corent Surpass is a powerful and efficient cloud migration tool that can help organizations move their applications and data to the cloud quickly and easily. Its real-time tracking and reporting features make it easy to keep track of the migration's progress and make changes as needed. In addition, its customizable migration plans make it easy to find the perfect solution for each situation.
Ready to Find Out More?
Atlantic.Net is ready to help you attain fast compliance with various certifications, such as SOC 2 and SOC 3, HIPAA, and HITECH, with 24x7x365 support, monitoring, and world-class data center infrastructure for VPS hosting and more.
For faster application deployment, free IT architecture design, and assessment, visit us at Atlantic.Net, call 888-618-DATA (3282), or email us at sales@atlantic.net.
Read More About Data Migration
Migration Services from Atlantic.Net
WordPress Migration Services
### The Best Cloud Data Management Solution in 2025
Cloud data management is organizing, controlling, and securing the data that is moved to or accessed in the cloud. It involves the creation of a data plan, defining data policies, refining security parameters, and implementing mechanisms to ensure that the data is appropriately used and remains compliant.
Many different cloud data management solutions are available on the market, and deciding which is right for your business can be challenging. Cloud data management services enable geographical dispersion, allow greater efficiency in company operations and initiatives, and empower businesses to reach new levels of technological innovation.
This article will review the best cloud data management solutions in 2025 and discuss their features and benefits.
Nextcloud
Nextcloud is an enterprise cloud storage solution with multiple add-ons that create a unique ecosystem for business operations. In addition, it is open-source and has comprehensive support options.
Nextcloud is functionally similar to Dropbox, Office 365, or Google Drive when used with its integrated office suites Collabora Online or OnlyOffice. It can be hosted in the cloud or on-premises and is highly scalable, from basic home-based office solutions to complete data center solutions that support millions of users.
Nextcloud is a module application, which means that countless plugins are available to customize it to your requirements. Popular plugins include browser-based editors, cloud service integrations, web analytics, and featured media viewers.
Did you know that Nextcloud is available on the Atlantic.Net Cloud? You can spin up a Nextcloud instance using our 1-click applications. It will be ready to use in about 30 seconds! Click here for more information.
Internxt
Internxt is an open-source cloud storage provider designed for individuals and teams to store and manage their data with Internxt Drive and its other encrypted suite of secure services. Internxt is an alternative to Google Drive and will never store, share or sell the personal data of its users.
With Internxt, you can manage your important documents or projects with your colleagues thanks to Internxt’s advanced sharing feature, making it easier to manage who can access or edit your files.
Internxt is available across all platforms, making it easy for anyone to access and manage their cloud storage anytime from any device. As an additional feature, Internxt also allows secure, encrypted data delivery on the cloud with password-protected links, making managing your data in this cloud service efficient, private, and secure.
Tableau
With Tableau, you can quickly and easily find actionable insights from any data source. Users can simply drag and drop from almost any source to create custom formulas and visualize and slice/dice data. In addition, Tableau business services offer training services, insights, and strategies, and the unparalleled community of Tableau experts is available and keen to offer help, making your data work for you.
With role-based licensing, Tableau enables users of all skill levels to interact with data in the same intuitive and accessible way. With augmented analytics insights, Tableau helps anyone needing data to uncover insights faster—data scientists, business users, and data engineers.
Customers use Tableau to work with their data at an intellectual level. Tableau helps turn insight into action, reduce analysis time, and enhance behaviors that inform everyone in the business.
Wasabi HotCloud
Wasabi is a cloud-based object storage service developed for individuals and organizations that need a substitute for cloud storage and requires a high-performance, reliable, and secure data storage infrastructure.
HotCloud allows you to protect and manage data at any stage automatically. This tool uses automated techniques to protect data and respond in real time when it detects a potential error. It is suitable for any external and internal cloud setup because it uses a REST API such as those at Alibaba, Amazon, Google, Microsoft, and Atlantic.Net.
HotCloud helps guarantee security by discovering, removing, and preventing errors with the cloud object analyzer. In addition, it connects tracking information to help you and your team keep up with the status of your data, regardless of the number of records or objects in the cloud data set.
Snowflake
Created in 2012, Snowflake is a fully managed SaaS tool that centralizes data warehousing, data lakes, data engineering, data science, and data application development on any of the leading public and private clouds.
The tool works equally well on a single server in the cloud as in a deployment spanning hundreds of servers and hundreds of terabytes of data. Snowflake's unique selling point comes from its layered architecture. At the base is the Database Storage layer, where Snowflake stores data loaded into the platform.
The Compute layer is made up of multiple node clusters. At each data warehouse, any data loaded does not compete for the same resources. In addition, Snowflake uses a common language, SQL, to interact with the Snowflake technical architecture.
Hortonworks Data Platform
Hortonworks HDP is the only open-source project on our list. This is an alternative to Apache Hadoop focused on Apache Spark and Apache Pheonix. Hortonworkds is now owned by Cloudera, focusing on a massively scalable cluster computing engine that processes large data flow at scale.
The open-source community created an industry with HDP, enabling the world's largest enterprises to transform their organizations and entire sectors using data streaming. HDP includes the open-source toolset, and the project aims to use data science to advance relevant programs, devices, and systems.
IBM Netezza
IBM Netezza is one of the most commonly known options for Business Intelligence, operational analytics, and cloud data management solutions. It uses data warehousing, ETL processing, analytical services, and Netezza's newest feature, Query Optimizer, which solves the problem of "dimensional growth" in your data.
Netezza also has a proprietary SQL language called DynaSQL. DynaSQL supports views, triggers, partitioning, asynchronous processing, global variables, stored procedures, native concurrency support, triggers, and Oracle Synchronization, among other features.
About Atlantic.Net
As healthcare technology continues to rapidly evolve, researchers believe that cloud services will continue to be leveraged by companies to access new and innovative data management technologies.
Atlantic.Net is a global VPS hosting provider with over 30 years of experience, specializing in Windows, Linux, and managed server hosting solutions. Atlantic.Net provides business-class dedicated and cloud hosting solutions focusing on security, compliance, and simplifying the user experience.
Additionally, Atlantic.Net offers fully managed environments, security, and compliance-focused solutions across all its hosting facilities in San Francisco, New York, London, Toronto, Dallas, and Orlando. With a range of certifications and SSAE 16 (SOC 2 and SOC3), HIPAA and HITECH audited data center infrastructure. The company is also known for its reliability, as dictated by its 100 percent uptime service-level agreement (SLA). For more information, please visit www.atlantic.net.
### Top 11 Systems Integration Software in 2025
To stay competitive in a rapidly changing economy, businesses must quickly adopt and integrate new technologies with their existing systems. This process is known as systems integration.
Why Is Systems Integration Important?
Systems integration is complicated to achieve, especially when integrating legacy or mainframe systems into new environments. Not all applications are cloud-enabled, especially specialist in-house software. Systems integration software can help businesses to integrate their various systems effectively and efficiently. It allows companies to connect different systems, share data, and automate data transfer between other applications.
Systems integration software is becoming increasingly important as businesses strive to adopt new technologies and keep up with the ever-changing business landscape. As a result, it will become even more crucial for companies to have adequate systems integration software to stay competitive.
This article will discover the best systems integration software in 2025 and learn how it can transform your business.
1. Geniusee
Geniusee is a systems integration software house based in Kyiv, Ukraine. They specialize in helping businesses manage their data more effectively by providing users with a centralized platform to collect data from multiple sources to enhance business operations.
Geniusee provides many features to simplify data management, such as importing data from various sources, including databases, API integration, text files, and emails. With an approach that improves business intelligence, boosts data accessibility, and data integrity, Geniusee increases productivity and enhances performance. In addition, the integration enables authorization through social networks, online payments, better reports, and the ability to integrate with other software to create more streamlined and efficient workflows.
2. deltAlyz Corp
DeltAlyz Corp writes integration software that offers solutions for enterprise application integration, third-party system integration, business-to-business (B2B), and legacy integration. The application features include data cleansing, integration, reporting, and analytics.
DeltAlyz Corp provides API development services that use HTTP webhooks, SOAP, REST, or GraphQL. The API acts as an intermediary between two or more software endpoints and helps businesses manage their data more effectively and improve their operations.
The company's software is available in various formats and can be used to integrate multiple systems. deltAlyz Corp's design solutions provide users with a wide range of reporting and analytics tools.
3. N-iX
N-iX is a systems integration software creator that helps organizations connect and automate their business processes across multiple industries, including manufacturing, logistics, fintech, and retail. N-iX creates bespoke software for your specific needs, making them unique in their approach to customized solutions.
They are experts in digital acceleration, technology modernization, R&D, and technology advisory and have a solid track record for creating software capable of automating business processes.
4. iTechArt Group
iTechArt Group is a custom software development company that provides solutions for everyone from dedicated software engineers to venture-capital-funded startups. With a focus on software development, project management, and systems integration, iTechArt Group offers a comprehensive suite of tools to help organizations achieve their goals.
5. Cyclr
The Cyclr Group provides a variety of solutions for managing complex IT systems. Cyclr provides a scalable connectivity framework and easy low-code tools to design and build integrations. In addition, they feature over 400 custom APIs to let you create any UI/UX you like, and they provide a simple method to deliver integration directly inside your SaaS application.
Cyclr solutions are designed to help users manage and monitor complex systems, including those involving the cloud. CyclrConnect allows users to connect systems and share data quickly and easily. Cyclr also provides users with real-time insights into system performance.
6. Zapier
Zapier is a systems integration software allowing users to connect different apps. This can be helpful for tasks like sending a reminder to a colleague in a separate app or ordering a product from a different store. Zapier empowers you to automate your work across 5,000+ apps and offers a wide range of connection options, including text, email, and social media.
Zapier integrates with many popular tools, like Dropbox, Google Drive, Gmail, Slack, Mailchimp, and any webhook app. It's easy to use and navigate, and if you're looking for a way to connect different apps, Zapier is a great option.
7. Hevo
Hevo is a data-driven integration platform that creates an end-to-end data pipeline. In modern business, data is stored in countless locations across the company. Hevo is a comprehensive, user-friendly system that streamlines the integration of new systems into existing data infrastructure.
Hevo creates a simple, intuitive environment, making system integration easy and efficient. In addition, it offers advanced searching and filtering capabilities that make locating the information you need easy as well as a wide range of reports and statistics that help you track system performance and make informed decisions.
8. Rivery
Rivery is a comprehensive low-code and no-code platform that helps organizations integrate different data systems and create automated business processes using informed decision-making. Some of the critical features of Rivery include its ability to manage workflow with over 200 connectors to popular data sources like Google, LinkedIn, TikTok, SAP, Oracle, and Twitter.
Rivery enables data ingestion, creates integrations, and automates business processes using data orchestration.
9. Workato
Workato helps businesses manage their projects efficiently by creating a single platform for integration and workflow automation across your business. It has various features that make it ideal for managing projects, including a project management tool, a resource management system, and a collaboration tool.
Workato has various other features, such as enterprise resource planning (ERP) functionality and performance reporting. Some standout integrations are Salesforce, Slack, ServiceNow, Snowflake, Box, and Active Directory.
10. OmniConnect (NXTsoft)
OmniConnects integrations quickly and seamlessly deploy to create purposefully built unified commerce integrations that increase automation and transactional performance between your business central, ERP or CRM. Onmiconnect tends to focus on clients in the FinTech or financial services industries.
The OmniConnect software integration enables seamless experiences for opening new bank accounts and transferring money to and from different providers. In addition, it is a security-defined service that allows other finance apps to integrate.
11. CloverDX
CloverDX is a system integration software that helps companies manage complex integrations and connectivity between different systems. It offers various features to make this process easier, such as a robust connector library, a user-friendly interface, and the ability to connect to just about any data source or output. This approach helps eliminate data silos, avoid vendor lock-in, and create a connection native to your business.
CloverDX features the Connector library, a tool that easily connects to various systems, including ERP, CRM, and supply-chain management systems, helping achieve flexible integration to a wide range of integration options, making it suitable for diverse businesses.
Partner With a Leading Cloud Provider
You must partner with a leading VPS hosting provider if you choose to leverage the power of cloud-based systems integration software and tools. Atlantic.Net brings 30 years of experience, offering top-level services at cost-effective prices. In addition, we will work closely with your business to provide a cloud hosting solution tailored to your specific needs.
The Atlantic.Net cloud platform is the perfect solution for all your systems integration needs. The high-performance infrastructure can run large-scale integration tools and containerized application stacks, and our Cloud Storage availability will host large-scale application images to use in your environment without skipping a beat; great when ingesting large volumes of data, but great for general usage too.
Contact our sales team today to find out how Atlantic.Net can help you on your mission to streamline the process of systems integration using cloud-based software.
### Best Cloud Consultancy or MSP in 2025
In today's digital age, businesses increasingly turn to Managed Service Providers (MSPs) to outsource their IT needs. MSPs offer a wide range of services, from cloud computing and storage to network security and support.
But not all MSPs are created equal. So how do you know which provider is right for your business? And once you've found a few potential candidates, how do you choose the best one?
To help you make the best decision for your business, we've compiled a list of the ten best Cloud Consultancy or MSPs in 2024. These companies are at the forefront of the cloud revolution and helping businesses of all sizes switch to the cloud.
What Is a Cloud Consultancy?
Cloud consultancies, which offer consultancy assistance and services, benefit customers in many ways, including providing insights into cloud adoption strategies, planning processes, and managing the organization's migration to the cloud.
What Is an MSP?
Managed cloud service providers (MSPs) help employees adopt, assess, and practice cloud security best practices.
MSPs help organizations move away from traditional IT models and adopt a cloud-first strategy. They offer various services, from infrastructure support and migration to application development and management. In addition, an MSP can provide guidance and mentorship to businesses during their implementation.
Cloud consultancies are in high demand as companies move away from traditional IT models and adopt a cloud-first strategy. As a result, the global cloud computing market is expected to grow from $445.3 billion in 2021 to $947.3 billion by 2026, according to MarketsandMarkets.
Top 10 Cloud Consultancy or MSPs in 2023
1. All Covered
The industry-leading All Covered, part of Konica Minolta and founded in 1997, heads up our list. Winner of the "Best Cloud Consultancy or MSP" in the International Cloud Computing Awards program, The Cloud Awards, All Covered delivers tailored and scalable managed IT solutions to businesses of all sizes.
All Covered offers many services, including application development, cloud services, IT helpdesk, and security. The company boasts over 35 locations worldwide, including the United States, Latin America, Mexico, and the Caribbean. With All Covered, you will receive a customized service plan and benefit from 24/7 support via phone, live chat, and a handy client portal.
2. Accenture
Founded in 1989, Accenture is a prominent and flexible MSP that provides solutions tailored to specific businesses, spanning across the globe with a reach that extends across industries. Accenture serves over 9,000 clients across 120 countries worldwide and delivers managed services that aim to fast-track growth and efficiency.
Accenture's expertise helps them to secure their clients' operations and achieve business resilience. The company provides a broad range of services, including consulting, digital marketing, operations solutions, business process outsourcing, and cloud services. Accenture serves many high-profile clients, including Unilever, Marriott, BMW Group, and Vodafone.
3. ANS Group
ANS Group is a UK-based cloud services provider offering comprehensive digital transformation solutions and is an ideal option for small to mid-size companies. ANS is passionate about delivering enterprise-grade technology, expertise, and processes to businesses of all sizes at an affordable price. As a result, ANS clients can limit the cost of new hardware, scale workloads, only pay for necessary resources, and gain access to leading Azure and AWS engineers.
4. Burwood Group
Burwood Group is a leading IT consulting and managed services firm based in Chicago and benefitting from over 29 years of experience. The company has 5 US-based offices, which include 24/7 operations centers in San Diego, CA, and Normal, IL, and employs 250 staff. Clients can benefit from strategic consulting services and 24x7 IT infrastructure monitoring and event management for on-premises, hybrid, and cloud environments.
Burwood Group allows small businesses to outsource their infrastructure, disaster recovery, and cybersecurity processes successfully.
5. CyberDuo
Founded in 2008 and based in Los Angeles, CyberDuo is an award-winning MSP that provides managed IT, cloud, and cybersecurity services. CyberDuo primarily supports small and mid-size businesses and prioritizes cybersecurity. Access to 24/7 top-level tech support ensures that clients are delighted with the service that they receive.
CyberDuo provides businesses with security, endpoint protection, vulnerability scanning, firewall services, and more. Their remarkable time-to-resolution is excellent, and they prefer to avoid downtime where possible.
6. NexusTek
Over two decades, NexusTek has been trusted by thousands of small to mid-size businesses. It offers an extensive list of services, including IT consulting, end-user services, cloud, infrastructure, and cybersecurity.
NexusTek can help you review your overall technology roadmap to find solutions that optimize everything in your IT operations. It is an SSAE 18 SOC II certified company and undergoes stringent annual security audits.
Unlike many of its competitors, NexusTek offers transparent fixed-monthly, per-user pricing.
7. Dataprise
Founded in 1995 and headquartered in Maryland, Dataprise also has offices in Virginia, Tennessee, California, New York, New Jersey, Florida, Texas, Pennsylvania, and Washington, D.C. With its many branch offices, Dataprise provides fully-managed IT services and solutions, end-user services, cybersecurity, and disaster recovery.
Dataprise is recommended for small businesses looking for managed IT services to conserve cash while letting them still have the level of support in-house IT staff would offer.
8. Electric
Established in 2016, Electric, also known as Electric.ai, supports over 50,000 users and is based in New York. Electric provides clients with IT-managed services, cybersecurity, HR services, strategic IT consulting services, and application management and support. A cost-effective solution, Electric claims to cut its clients IT spending by an average of 50%. In addition, Electric's solutions are quick, scalable, and easy to understand and use.
9. Infosys
Infosys has over 40 years of experience within the consultancy and managed services industry. With headquarters in Bangalore, India, Infosys has a global presence in over 50 countries. Infosys provides a broad spectrum of services and solutions but specializes in using data analytics and an AI-powered core to improve IT infrastructure. Infosys clients benefit from a conventional and transparent pricing model.
10. ScienceSoft
ScienceSoft was established in 1989 and provides high-quality managed IT services, IT consulting, data analytics, cybersecurity, and software development. This leading MSP solution serves over 30 different industries, including non-IT enterprises. ScienceSoft guarantees that clients' cloud infrastructures will be reliable, performance-optimized, cost-efficient, and secure. Clients benefit from ScienceSoft's armory of over 700 technical experts, including cloud architects, database administrators, IT support engineers, software developers, security experts, and QA engineers.
How Can Atlantic.Net Help?
When partnering with an MSP, you must consider your options carefully and choose one that will meet the specific needs of your business. Selecting the right MSP will lead to a strong partnership that will benefit your company for years.
With so many excellent Cloud Consultancy and MSPs on the market, choosing the best one for your company can take time and effort. Look no further than Alantic.Net! With over three decades of experience, Atlantic.Net is a trusted web hosting company supplying reliable and dependable services to its SMB to enterprise clients. We can assist by creating customized solutions that fit your business’s needs with an array of hosting services, including cloud, dedicated, colocation, private virtualization, and managed hosting.
Our state-of-the-art infrastructure is SSAE 18, HIPAA, and HITECH compliant and housed in secure, climate-controlled facilities with constant monitoring and multiple direct connections to the Internet backbone to ensure the availability and safety of your data.
Read More About Consulting Services
IT Consulting Services
Healthcare IT Consulting Services
### How to Install Strapi with Nginx on Arch Linux
Strapi is a free, open-source, and headless content management system built with JavaScript. Compared to other CMS, Strapi doesn’t provide a front-end. You will need to rely on API to design your content structure. Strapi provides an easier way to build your website, integrating with popular frameworks like React and Next.js.
This post will show you how to install the Strapi App on Arch Linux.
Prerequisites
An IPV6 IP address associated with your instance
Step 1 - Configure Repository
By default, the default repository is outdated in Arch Linux, so you will need to modify the default mirror list. You can do it by editing the mirror list configuration file:
nano /etc/pacman.d/mirrorlist
Remove all lines and add the following lines:
## Score: 0.7, United States
Server = http://mirror.us.leaseweb.net/archlinux/$repo/os/$arch
## Score: 0.8, United States
Server = http://lug.mtu.edu/archlinux/$repo/os/$arch
Server = http://mirror.nl.leaseweb.net/archlinux/$repo/os/$arch
## Score: 0.9, United Kingdom
Server = http://mirror.bytemark.co.uk/archlinux/$repo/os/$arch
## Score: 1.5, United Kingdom
Server = http://mirrors.manchester.m247.com/arch-linux/$repo/os/$arch
Server = http://archlinux.dcc.fc.up.pt/$repo/os/$arch
## Score: 6.6, United States
Server = http://mirror.cs.pitt.edu/archlinux/$repo/os/$arch
## Score: 6.7, United States
Server = http://mirrors.acm.wpi.edu/archlinux/$repo/os/$arch
## Score: 6.8, United States
Server = http://ftp.osuosl.org/pub/archlinux/$repo/os/$arch
## Score: 7.1, India
Server = http://mirror.cse.iitk.ac.in/archlinux/$repo/os/$arch
## Score: 10.1, United States
Server = http://mirrors.xmission.com/archlinux/$repo/os/$arch
Save and close the file, then update all the package indexes with the following command:
pacman -Syu
Step 2 - Install Node.js
Before starting, you will need to install Node.js on your server. First, install NVM with the following command.
curl -o- https://raw.githubusercontent.com/nvm-sh/nvm/v0.39.2/install.sh | bash
Once NVM is installed, you should see the following output.
export NVM_DIR="$HOME/.nvm"
[ -s "$NVM_DIR/nvm.sh" ] && \. "$NVM_DIR/nvm.sh" # This loads nvm
=> Close and reopen your terminal to start using nvm or run the following to use it now:
Next, activate the NVM environment variable using the following command.
export NVM_DIR="$HOME/.nvm"
[ -s "$NVM_DIR/nvm.sh" ] && \. "$NVM_DIR/nvm.sh" # This loads nvm
Now, install the latest version of Node.js with the following command.
nvm install --lts
You will get the following output.
Installing latest LTS version.
Downloading and installing node v18.14.2...
Downloading https://nodejs.org/dist/v18.14.2/node-v18.14.2-linux-x64.tar.xz...
####################################################################################################################################### 100.0%
Computing checksum with sha256sum
Checksums matched!
Now using node v18.14.2 (npm v9.5.0)
Creating default alias: default -> lts/* (-> v18.14.2)
Next, find the location of Node.js with the following command.
which node
Output.
/root/.nvm/versions/node/v18.14.2/bin/node
Next, create a symbolic link of Node.js with the following command.
ln -s /root/.nvm/versions/node/v18.14.2/bin/node /usr/bin/node
Step 3 - Install and Configure PostgreSQL
If you want to use a database for the Strapi, you will need to install PostgreSQL on your server. You can install it with the following command.
pacman -S postgresql
Next, initialize the PostgreSQL database with the following command.
sudo -u postgres initdb --locale en_US.UTF-8 -D /var/lib/postgres/data
Next, start and enable the PostgreSQL service with the following command.
systemctl start postgresql
systemctl enable postgresql
Next, connect to the PostgreSQL shell:
sudo -u postgres psql
Next, set the Postgres password and create a database with the following command.
ALTER USER postgres PASSWORD 'password';
create database project;
Finally, exit from the PostgreSQL shell with the following command.
\q
Step 4 - Install Strapi
You can use the npx command line tool to install Strapi on your server.
npx create-strapi-app@latest project --no-run
You will be asked to select the installation type:
? Choose your installation type (Use arrow keys)
❯ Quickstart (recommended)
Custom (manual settings)
Select your installation type and press the Enter key to finish the installation.
? Choose your installation type Quickstart (recommended)
Creating a quickstart project.
Creating a new Strapi application at /root/project.
Creating files.
Dependencies installed successfully.
Your application was created at /root/project.
Available commands in your project:
npm run develop
Start Strapi in watch mode. (Changes in Strapi project files will trigger a server restart)
npm run start
Start Strapi without watch mode.
npm run build
Build Strapi admin panel.
npm run strapi
Display all available commands.
You can start by doing:
npm run develop
cd /root/project
Next, navigate to your project directory and build your application with the following command.
cd project
npm run build
You will get the following output.
> project@0.1.0 build
> strapi build
Building your admin UI with development configuration...
✔ Webpack
Compiled successfully in 25.78s
Admin UI built successfully
Next, edit the server.js file.
nano ./config/server.js
Make the following changes.
module.exports = ({ env }) => ({
host: env('HOST', '0.0.0.0'),
port: env.int('PORT', 1337),
url: 'http://app.example.com',
app: {
keys: env.array('APP_KEYS'),
},
});
Save and close the file, then run your Strapi app with the following command.
npm run develop
You should see the following output.
[2023-02-24 09:25:18.097] info: The Users & Permissions plugin automatically generated a jwt secret and stored it in .env under the name JWT_SECRET.
Project information
┌────────────────────┬──────────────────────────────────────────────────┐
│ Time │ Fri Feb 24 2023 09:25:19 GMT+0000 (Coordinated … │
│ Launched in │ 2503 ms │
│ Environment │ development │
│ Process PID │ 76628 │
│ Version │ 4.6.2 (node v18.14.2) │
│ Edition │ Community │
│ Database │ sqlite │
└────────────────────┴──────────────────────────────────────────────────┘
Actions available
One more thing...
Create your first administrator 💻 by going to the administration panel at:
┌──────────────────────────────┐
│ http://app.example.com/admin │
└──────────────────────────────┘
Press the CTRL+C to stop the application.
Step 5 - Create a Systemd Service File for Strapi
Next, you must create a systemd file to manage the Strapi service. You can create it with the following command.
nano /etc/systemd/system/strapi.service
Add the following configuration.
[Unit]
Description=Strapi Project
After=network.target
[Service]
Type=simple
WorkingDirectory=/root/project
User=root
ExecStart=/usr/bin/node /root/project/node_modules/.bin/strapi develop
[Install]
WantedBy=multi-user.target
Save and close the file, then reload the systemd daemon to apply the changes.
systemctl daemon-reload
Next, start and enable the Strapi service with the following command.
systemctl start strapi
systemctl enable strapi
You can check the status of the Strapi service with the following command.
systemctl status strapi
You should see the following output.
● strapi.service - Strapi Project
Loaded: loaded (/etc/systemd/system/strapi.service; disabled; preset: disabled)
Active: active (running) since Fri 2023-02-24 09:33:23 UTC; 59s ago
Main PID: 76830 (node)
Tasks: 18 (limit: 4700)
Memory: 235.3M
CGroup: /system.slice/strapi.service
├─76830 /usr/bin/node /root/project/node_modules/.bin/strapi develop
└─76837 /root/.nvm/versions/node/v18.14.2/bin/node /root/project/node_modules/.bin/strapi develop
Feb 24 09:33:30 archlinux node[76837]: │ Version │ 4.6.2 (node v18.14.2) │
Feb 24 09:33:30 archlinux node[76837]: │ Edition │ Community │
Feb 24 09:33:30 archlinux node[76837]: │ Database │ sqlite │
Feb 24 09:33:30 archlinux node[76837]: └────────────────────┴──────────────────────────────────────────────────┘
Feb 24 09:33:30 archlinux node[76837]: Actions available
Feb 24 09:33:30 archlinux node[76837]: One more thing...
Feb 24 09:33:30 archlinux node[76837]: Create your first administrator 💻 by going to the administration panel at:
Feb 24 09:33:30 archlinux node[76837]: ┌──────────────────────────────┐
Feb 24 09:33:30 archlinux node[76837]: │ http://app.example.com/admin │
Feb 24 09:33:30 archlinux node[76837]: └──────────────────────────────┘
Step 6 - Configure Nginx for Strapi App
Next, you must install and configure Nginx as a reverse proxy for Strapi App. First, install the Nginx package with the following command.
pacman -S nginx-mainline
After the successful installation, create a directory to store Nginx virtual host files.
mkdir /etc/nginx/sites-enabled
Next, create a Strapi virtual host configuration file.
nano /etc/nginx/sites-enabled/strapi.conf
Add the following configuration.
# Strapi server
upstream strapi {
server 127.0.0.1:1337;
}
server {
listen 80;
server_name app.example.com;
# Proxy Config
location / {
proxy_pass http://strapi;
proxy_http_version 1.1;
proxy_set_header X-Forwarded-Host $host;
proxy_set_header X-Forwarded-Server $host;
proxy_set_header X-Real-IP $remote_addr;
proxy_set_header X-Forwarded-For $proxy_add_x_forwarded_for;
proxy_set_header X-Forwarded-Proto $scheme;
proxy_set_header Host $http_host;
proxy_set_header Upgrade $http_upgrade;
proxy_set_header Connection "Upgrade";
proxy_pass_request_headers on;
}
}
Save and close the file, then edit the Nginx main configuration file.
nano /etc/nginx/nginx.conf
Add the following lines after http{:
server_names_hash_bucket_size 64;
include sites-enabled/*;
Save and close the file, then verify the Nginx configuration using the following command.
nginx -t
You should see the following output.
nginx: the configuration file /etc/nginx/nginx.conf syntax is ok
nginx: configuration file /etc/nginx/nginx.conf test is successful
Finally, restart Nginx to apply the changes.
systemctl restart nginx
Step 7 - Access Strapi Web Interface
Now, open your web browser and access the Strapi web UI using the URL http://app.example.com/admin. You should see the Strapi default page on the following screen.
Provide your name, email, and password then click on the Let's start button. You should see the Strapi dashboard on the following screen.
Conclusion
In this post, you learned how to install the Strapi on Arch Linux. You also learned how to use Nginx as a reverse proxy for the Strapi. You can now create your own application using Strapi and deploy it on the live server. You can now try to deploy Strapi on dedicated server hosting from Atlantic.Net!
### How to Install Prometheus on Arch Linux
Prometheus is a free and open-source monitoring solution written in the Go language. It was developed by SoundCloud and adopted by CNCF in 2016. It collects metrics data from HTTP endpoints and stores that data in a time series database. Prometheus helps system administrators diagnose problems. It is an independent service and does not need to rely on remote services like network storage.
In this post, we will show you how to install Prometheus monitoring solution on Arch Linux.
Step 1 - Configure Repository
By default, the default repository is outdated in Arch Linux, so you will need to modify the default mirror list if you have not done so already. You can do it by editing the mirrorlist configuration file:
nano /etc/pacman.d/mirrorlist
Remove all lines and add the following lines:
## Score: 0.7, United States
Server = http://mirror.us.leaseweb.net/archlinux/$repo/os/$arch
## Score: 0.8, United States
Server = http://lug.mtu.edu/archlinux/$repo/os/$arch
Server = http://mirror.nl.leaseweb.net/archlinux/$repo/os/$arch
## Score: 0.9, United Kingdom
Server = http://mirror.bytemark.co.uk/archlinux/$repo/os/$arch
## Score: 1.5, United Kingdom
Server = http://mirrors.manchester.m247.com/arch-linux/$repo/os/$arch
Server = http://archlinux.dcc.fc.up.pt/$repo/os/$arch
## Score: 6.6, United States
Server = http://mirror.cs.pitt.edu/archlinux/$repo/os/$arch
## Score: 6.7, United States
Server = http://mirrors.acm.wpi.edu/archlinux/$repo/os/$arch
## Score: 6.8, United States
Server = http://ftp.osuosl.org/pub/archlinux/$repo/os/$arch
## Score: 7.1, India
Server = http://mirror.cse.iitk.ac.in/archlinux/$repo/os/$arch
## Score: 10.1, United States
Server = http://mirrors.xmission.com/archlinux/$repo/os/$arch
Save and close the file then update all the package indexes with the following command:
pacman -Syu
Step 2 - Install Prometheus Arch Linux
By default, the Prometheus package is included in the Arch Linux default repository. You can install it using the following command.
pacman -S prometheus
After installing Prometheus, start the Prometheus service and enable it to start at system reboot.
systemctl start prometheus
To verify the Prometheus service status, run the following command.
systemctl status prometheus
You should see the following output.
● prometheus.service - Prometheus service
Loaded: loaded (/usr/lib/systemd/system/prometheus.service; disabled; preset: disabled)
Active: active (running) since Mon 2023-02-06 08:17:38 UTC; 7s ago
Main PID: 57007 (prometheus)
Tasks: 6 (limit: 2362)
Memory: 29.4M
CGroup: /system.slice/prometheus.service
└─57007 /usr/bin/prometheus --config.file=/etc/prometheus/prometheus.yml --storage.tsdb.path=/var/lib/prometheus/data
Feb 06 08:17:38 archlinux prometheus[57007]: ts=2023-02-06T08:17:38.749Z caller=tls_config.go:232 level=info component=web msg="Listening on">
Feb 06 08:17:38 archlinux prometheus[57007]: ts=2023-02-06T08:17:38.749Z caller=tls_config.go:235 level=info component=web msg="TLS is disabl>
Feb 06 08:17:38 archlinux prometheus[57007]: ts=2023-02-06T08:17:38.749Z caller=head.go:683 level=info component=tsdb msg="WAL segment loaded>
Feb 06 08:17:38 archlinux prometheus[57007]: ts=2023-02-06T08:17:38.749Z caller=head.go:720 level=info component=tsdb msg="WAL replay complet>
Feb 06 08:17:38 archlinux prometheus[57007]: ts=2023-02-06T08:17:38.751Z caller=main.go:1014 level=info fs_type=EXT4_SUPER_MAGIC
Feb 06 08:17:38 archlinux prometheus[57007]: ts=2023-02-06T08:17:38.751Z caller=main.go:1017 level=info msg="TSDB started"
Feb 06 08:17:38 archlinux prometheus[57007]: ts=2023-02-06T08:17:38.751Z caller=main.go:1197 level=info msg="Loading configuration file" file>
Feb 06 08:17:38 archlinux prometheus[57007]: ts=2023-02-06T08:17:38.786Z caller=main.go:1234 level=info msg="Completed loading of configurati>
Feb 06 08:17:38 archlinux prometheus[57007]: ts=2023-02-06T08:17:38.786Z caller=main.go:978 level=info msg="Server is ready to receive web re>
Feb 06 08:17:38 archlinux prometheus[57007]: ts=2023-02-06T08:17:38.786Z caller=manager.go:953 level=i
At this point, Prometheus is installed and listens on port 9090. You can verify it using the following command.
ss -antpl | grep prometheus
You will get the following output.
LISTEN 0 0 *:9090 *:* users:(("prometheus",pid=57007,fd=7))
Step 3 - Configure Nginx as a Reverse Proxy for Prometheus
It is always a good idea to use Nginx as a reverse proxy to access Prometheus at port 80.
First, install the Nginx package using the following command.
pacman -S nginx
Once installed, start and enable the Nginx service using the following command.
systemctl start nginx
systemctl enable nginx
Next, create a directory to store the Nginx configuration.
mkdir /etc/nginx/sites-enabled
Next, you will need to define your directory in the Nginx configuration file.
nano /etc/nginx/nginx.conf
Add the following lines below the line http{:
include sites-enabled/*;
server_names_hash_bucket_size 64;
Next, create an Nginx virtual host configuration file with the following command:
nano /etc/nginx/sites-enabled/prometheus.conf
Add the following configuration.
server {
listen 80;
server_name prometheus.example.com;
location / {
proxy_pass http://127.0.0.1:9090;
}
}
Save and close the file, then verify the Nginx for any syntax configuration error:
nginx -t
You will get the following output:
nginx: the configuration file /etc/nginx/nginx.conf syntax is ok
nginx: configuration file /etc/nginx/nginx.conf test is successful
Finally, restart the Nginx service to apply the changes:
systemctl restart nginx
Step 4 - Access Prometheus Web UI
At this point, Prometheus is installed on your server. You can now access it using the URL http://prometheus.example.com. You should see the Prometheus dashboard on the following screen.
Conclusion
In this tutorial, we explained how to install Prometheus on Arch Linux. You can now implement the Prometheus monitoring tool in your server environment and start monitoring metrics of all servers and applications from the central location. You can test the Prometheus server on dedicated server hosting from Atlantic.Net!
### How to Install Apache Spark on Arch Linux
Apache Spark is a data processing framework used for executing data engineering, data science, and machine learning on single-node machines or clusters. It is designed for fast computation and used in big data workloads to quickly perform processing tasks. It provides high-level APIs in Scala, Java, Python, and R, and an optimized engine that supports general computation graphs for data analysis.
In this tutorial, we will explain how to install Apache Spark on Arch Linux.
Step 1 - Configure Repository
By default, the default repository is outdated in Arch Linux, so you will need to modify the default mirror list. You can do it by editing the mirror list configuration file:
nano /etc/pacman.d/mirrorlist
Remove all lines and add the following lines:
## Score: 0.7, United States
Server = http://mirror.us.leaseweb.net/archlinux/$repo/os/$arch
## Score: 0.8, United States
Server = http://lug.mtu.edu/archlinux/$repo/os/$arch
Server = http://mirror.nl.leaseweb.net/archlinux/$repo/os/$arch
## Score: 0.9, United Kingdom
Server = http://mirror.bytemark.co.uk/archlinux/$repo/os/$arch
## Score: 1.5, United Kingdom
Server = http://mirrors.manchester.m247.com/arch-linux/$repo/os/$arch
Server = http://archlinux.dcc.fc.up.pt/$repo/os/$arch
## Score: 6.6, United States
Server = http://mirror.cs.pitt.edu/archlinux/$repo/os/$arch
## Score: 6.7, United States
Server = http://mirrors.acm.wpi.edu/archlinux/$repo/os/$arch
## Score: 6.8, United States
Server = http://ftp.osuosl.org/pub/archlinux/$repo/os/$arch
## Score: 7.1, India
Server = http://mirror.cse.iitk.ac.in/archlinux/$repo/os/$arch
## Score: 10.1, United States
Server = http://mirrors.xmission.com/archlinux/$repo/os/$arch
Save and close the file then update all the package indexes with the following command:
pacman -Syu
Step 2 - Install Java
Apache Spark is based on Java, so you will need to install Java JDK on your server. Run the following command to install Java:
pacman -S jre17-openjdk
Once installed, you can verify the Java installation using the following command.
java --version
You will get the following output.
openjdk 17.0.6 2023-01-17
OpenJDK Runtime Environment (build 17.0.6+10)
OpenJDK 64-Bit Server VM (build 17.0.6+10, mixed mode)
Step 3 - Install Scala
You will also need to install Scala on your server. You can install it using the following command.
pacman -S scala
After the installation, verify the Scala version:
scala --version
Sample output.
Scala code runner version 2.13.8-20220325-005602-unknown -- Copyright 2002-2021, LAMP/EPFL and Lightbend, Inc.
To connect to the Scala console, run the following command.
scala
You will get the following console.
Welcome to Scala 2.13.8-20220325-005602-unknown (OpenJDK 64-Bit Server VM, Java 17.0.6).
Type in expressions for evaluation. Or try :help.
Verify Scala using the following command.
scala> println("Testing")
Sample output.
Testing
Step 4 - Install Apache Spark
First, visit the Apache Spark download page, pick the download URL, and download it with the following command.
wget https://archive.apache.org/dist/spark/spark-3.3.1/spark-3.3.1-bin-hadoop3.tgz
Once the download is completed, extract the downloaded file using the following command.
tar -xzf spark-3.3.1-bin-hadoop3.tgz
Next, move the extracted directory to /mnt.
mv spark-3.3.1-bin-hadoop3 /mnt/spark
Next, create a ~/.bashrc file and define your Apache Spark path.
nano ~/.bashrc
Add the following lines:
export SPARK_HOME=/mnt/spark
export PATH=$PATH:$SPARK_HOME/bin:$SPARK_HOME/sbin
Next, activate the environment variable using the following command.
source ~/.bashrc
Step 5 - Start Spark Master and Worker Node
At this point, Apache Spark is installed on your server. You can now start the Spark master with the following command.
start-master.sh
Sample output.
starting org.apache.spark.deploy.master.Master, logging to /mnt/spark/logs/spark-root-org.apache.spark.deploy.master.Master-1-archlinux.out
By default, Spark master listens on port 8080. You can check it with the following command.
ss -tpln | grep 8080
Sample output.
LISTEN 0 0 *:8080 *:* users:(("java",pid=57901,fd=265))
Now, open your web browser and access the Spark master using the URL http://your-server-ip:8080. You should see the following screen.
Next, start the Spark Worker using the following command.
start-worker.sh spark://your-server-ip:7077
Now, go back to the Spark master web interface and reload the page. You should see the added worker on the following screen.
Step 6 - Create a Systemd Service File for Apache Spark
Before creating systemd service file, stop both the worker and master service using the following command.
stop-worker.sh
stop-master.sh
Next, create a Spark master service using the following command.
nano /etc/systemd/system/spark-master.service
Add the following configuration.
[Unit]
Description=Apache Spark Master
After=network.target
[Service]
Type=forking
User=root
Group=root
ExecStart=/mnt/spark/sbin/start-master.sh
ExecStop=/mnt/spark/sbin/stop-master.sh
[Install]
WantedBy=multi-user.target
Next, create a Spark worker service file.
nano /etc/systemd/system/spark-worker.service
Add the following configuration.
[Unit]
Description=Apache Spark Worker
After=network.target
[Service]
Type=forking
User=root
Group=root
ExecStart=/mnt/spark/sbin/start-slave.sh spark://your-server-ip:7077
ExecStop=/mnt/spark/sbin/stop-slave.sh
[Install]
WantedBy=multi-user.target
Save and close the file, then reload the systemd daemon to apply the changes.
systemctl daemon-reload
Next, start both the Master and Worker services using the following command.
systemctl start spark-master spark-worker
You can check the status of both services using the following command.
systemctl status spark-master spark-worker
You should see the following output.
● spark-master.service - Apache Spark Master
Loaded: loaded (/etc/systemd/system/spark-master.service; disabled; preset: disabled)
Active: active (running) since Mon 2023-02-06 05:28:09 UTC; 19s ago
Process: 58118 ExecStart=/mnt/spark/sbin/start-master.sh (code=exited, status=0/SUCCESS)
Main PID: 58151 (java)
Tasks: 34 (limit: 4700)
Memory: 159.2M
CGroup: /system.slice/spark-master.service
└─58151 /usr/lib/jvm/java-17-openjdk/bin/java -cp "/mnt/spark/conf/:/mnt/spark/jars/*" -Xmx1g org.apache.spark.deploy.master.Mas>
Feb 06 05:28:06 archlinux systemd[1]: Starting Apache Spark Master...
Feb 06 05:28:06 archlinux start-master.sh[58131]: starting org.apache.spark.deploy.master.Master, logging to /mnt/spark/logs/spark-root-org.a>
Feb 06 05:28:09 archlinux systemd[1]: Started Apache Spark Master.
● spark-worker.service - Apache Spark Worker
Loaded: loaded (/etc/systemd/system/spark-worker.service; disabled; preset: disabled)
Active: active (running) since Mon 2023-02-06 05:28:09 UTC; 19s ago
Process: 58119 ExecStart=/mnt/spark/sbin/start-slave.sh spark://your-server-ip:7077 (code=exited, status=0/SUCCESS)
Main PID: 58157 (java)
Tasks: 40 (limit: 4700)
Memory: 170.5M
CGroup: /system.slice/spark-worker.service
└─58157 /usr/lib/jvm/java-17-openjdk/bin/java -cp "/mnt/spark/conf/:/mnt/spark/jars/*" -Xmx1g org.apache.spark.deploy.worker.Wor>
Feb 06 05:28:06 archlinux systemd[1]: Starting Apache Spark Worker...
Feb 06 05:28:06 archlinux start-slave.sh[58119]: This script is deprecated, use start-worker.sh
Feb 06 05:28:06 archlinux start-slave.sh[58133]: starting org.apache.spark.deploy.worker.Worker, logging to /mnt/spark/logs/spark-root-org.ap>
Feb 06 05:28:09 archlinux systemd[1]: Started Apache Spark Worker.
Conclusion
In this post, you learned how to install Apache Spark on Arch Linux. You can now use Apache Spark in data science, and machine learning project to handle high workloads. You can try to install the Apache Spark server on dedicated server hosting from Atlantic.Net!
### How to Install pgAdmin on Arch Linux
pgAdmin is an open-source platform for managing PostgreSQL servers via GUI. It is a cross-platform solution that enables businesses to create, view, and modify PostgreSQL objects. It offers a simple and user-friendly web-UI to interact with the Postgres database sessions. If you are looking for an open-source administration panel for managing PostgreSQL, then pgAdmin is the best choice for you.
In this post, we will show you how to install pgAdmin on Arch Linux.
Step 1 - Configure Repository
By default, the default repository is outdated in Arch Linux, so you will need to modify the default mirror list. You can do it by editing the mirror list configuration file:
nano /etc/pacman.d/mirrorlist
Remove all lines and add the following lines:
## Score: 0.7, United States
Server = http://mirror.us.leaseweb.net/archlinux/$repo/os/$arch
## Score: 0.8, United States
Server = http://lug.mtu.edu/archlinux/$repo/os/$arch
Server = http://mirror.nl.leaseweb.net/archlinux/$repo/os/$arch
## Score: 0.9, United Kingdom
Server = http://mirror.bytemark.co.uk/archlinux/$repo/os/$arch
## Score: 1.5, United Kingdom
Server = http://mirrors.manchester.m247.com/arch-linux/$repo/os/$arch
Server = http://archlinux.dcc.fc.up.pt/$repo/os/$arch
## Score: 6.6, United States
Server = http://mirror.cs.pitt.edu/archlinux/$repo/os/$arch
## Score: 6.7, United States
Server = http://mirrors.acm.wpi.edu/archlinux/$repo/os/$arch
## Score: 6.8, United States
Server = http://ftp.osuosl.org/pub/archlinux/$repo/os/$arch
## Score: 7.1, India
Server = http://mirror.cse.iitk.ac.in/archlinux/$repo/os/$arch
## Score: 10.1, United States
Server = http://mirrors.xmission.com/archlinux/$repo/os/$arch
Save and close the file, then update all the package indexes with the following command:
pacman -Syu
Step 2 - Install PostgreSQL
By default, the PostgreSQL package is included in the Arch Linux main repository. You can install it using the following command:
pacman -S postgresql
Once the PostgreSQL is installed, you can verify the PostgreSQL version using the following command:
postgres --version
You will get the following output:
postgres (PostgreSQL) 15.1
Next, initialize the PostgreSQL database with the following command:
sudo -u postgres initdb --locale en_US.UTF-8 -D /var/lib/postgres/data
Next, start the PostgreSQL service using the following command.
systemctl start postgresql
By default, there is not any password for postgres user.
To set it, log in with Postgres user and set the password using the following command:
su - postgres
psql -c "alter user postgres with password 'password'"
Next, exit from the PostgreSQL shell with the following command.
exit
Step 3 - Install pgAdmin
First, install the PIP package using the following command.
pacman -S python-pip
Next, update the setuptools package to the latest version.
python -m pip install --upgrade setuptools
Next, install the pgAdmin4 package using the PIP command.
pip install pgadmin4
Once pgAdmin is installed you can proceed to the next step.
Step 4 - Start pgAdmin
Next, run the following command to start the pgAdmin4.
pgadmin4
You will be asked to set a user and password as shown below to start the server.
NOTE: Configuring authentication for SERVER mode.
Enter the email address and password to use for the initial pgAdmin user account:
Email address: hitjethva@gmail.com
Password:
Retype password:
pgAdmin 4 - Application Initialisation
=================
Starting pgAdmin 4. Please navigate to http://127.0.0.1:5050 in your browser.
2023-02-06 05:58:30,522: WARNING werkzeug: WebSocket transport not available. Install simple-websocket for improved performance.
* Serving Flask app 'pgadmin' (lazy loading)
* Environment: production
WARNING: This is a development server. Do not use it in a production deployment.
Use a production WSGI server instead.
* Debug mode: off
Note: Don't do anything on this terminal because it will stop the pgAdmin4 server.
Step 5 - Install Nginx for pgAdmin4
At this point, pgAdmin is started and listens on port 5050. Now, you will need to configure Nginx as a reverse proxy to access the pgAdmin web UI.
Open another terminal and install the Nginx with the following command.
pacman -S nginx
Next, edit the Nginx configuration file:
nano /etc/nginx/nginx.conf
Add the following line above the last line:
server {
listen 8080;
server_name _;
location / {
proxy_pass http://127.0.0.1:5050;
}
}
Save and close the file, then restart the Nginx service to apply the changes.
systemctl restart nginx
Step 6 - Access pgAdmin4 Web UI
Now, open your web browser and access the pgAdmin4 web interface using the URL http://your-server-ip:8080. You should see the pgAdmin4 login screen.
Provide your email address and password and click on the Login button. You should see the pgAdmin default dashboard on the following screen:
Next, click on the Add New Server button. You should see the following screen:
In the General tab, provide the name of the server and click on the Connection tab. You should see the following screen:
Provide the Hostname or IP address of the server that you want to connect to, as well as the Port number, PostgreSQL username, and password, and click on the Save button. Once the connection has been established, you should see the detailed information about your PostgreSQL database in the left pane:
Conclusion
In this post, you learned how to install pgAdmin4 on Arch Linux. You can now use pgAdmin4 to connect any remote PostgreSQL server and manage it via a web interface. You can try the pgAdmin on dedicated server hosting from Atlantic.Net!
### How to Install Django on Arch Linux
Django is an open-source web framework used for developing Python-based websites. It is built by experienced developers to make it easier for the rapid development of secure and maintainable websites. It is based on the Model View Template design that reduces a lot of hassles that a developer has to face during the development of a website.
In this post, we will show you how to install Django on Arch Linux.
Step 1 - Configure Repository
By default, the default repository is outdated in Arch Linux, so you will need to modify the default mirror list. You can do it by editing the mirror list configuration file:
nano /etc/pacman.d/mirrorlist
Remove all lines and add the following lines:
## Score: 0.7, United States
Server = http://mirror.us.leaseweb.net/archlinux/$repo/os/$arch
## Score: 0.8, United States
Server = http://lug.mtu.edu/archlinux/$repo/os/$arch
Server = http://mirror.nl.leaseweb.net/archlinux/$repo/os/$arch
## Score: 0.9, United Kingdom
Server = http://mirror.bytemark.co.uk/archlinux/$repo/os/$arch
## Score: 1.5, United Kingdom
Server = http://mirrors.manchester.m247.com/arch-linux/$repo/os/$arch
Server = http://archlinux.dcc.fc.up.pt/$repo/os/$arch
## Score: 6.6, United States
Server = http://mirror.cs.pitt.edu/archlinux/$repo/os/$arch
## Score: 6.7, United States
Server = http://mirrors.acm.wpi.edu/archlinux/$repo/os/$arch
## Score: 6.8, United States
Server = http://ftp.osuosl.org/pub/archlinux/$repo/os/$arch
## Score: 7.1, India
Server = http://mirror.cse.iitk.ac.in/archlinux/$repo/os/$arch
## Score: 10.1, United States
Server = http://mirrors.xmission.com/archlinux/$repo/os/$arch
Save and close the file, then update all the package indexes with the following command:
pacman -Syu
Step 2 - Install Python Dependencies
Django is a Python-based application. So you will need to install Python and other dependencies to your server. You can install all of them using the following command.
pacman -S python python-pip
Next, update the PIP package with the following command.
pip3 install --upgrade pip
Next, install the virtualenv package.
pip3 install virtualenv
Next, verify the PIP version using the following command.
pip3 --version
You will get the following output.
pip 23.0 from /usr/lib/python3.10/site-packages/pip (python 3.10)
Step 3 - Install and Configure MySQL Database Server
First, install the MySQL server using the following command.
pacman -S mysql
Next, initialize the MySQL database using the following command.
mysql_install_db --user=mysql --basedir=/usr --datadir=/var/lib/mysql
Next, start and enable the MySQL service with the following command.
systemctl start mysqld
systemctl enable mysqld
Next, log into the MySQL shell with the following command.
mysql
Once logged in, create a database and user for Django:
CREATE DATABASE django;
CREATE USER 'django'@'localhost' IDENTIFIED BY 'yourpassword';
Next, grant all the privileges to the Django database with the following command.
GRANT ALL ON django.* TO 'django'@'localhost';
Now, flush the privileges and exit from the MySQL shell with the following command.
FLUSH PRIVILEGES;
EXIT;
Step 4 - Install Django Arch Linux
First, create a Django project directory and create a virtual environment for Django using the following command.
mkdir django
cd django
python3 -m venv djangoenv
Next, activate the virtual environment with the following command.
source djangoenv/bin/activate
Next, install Django using the following command.
pip install django
You will get the following output.
Collecting django
Downloading Django-4.1.6-py3-none-any.whl (8.1 MB)
━━━━━━━━━━━━━━━━━━━━━━━━━━━━━━━━━━━━━━━━ 8.1/8.1 MB 29.9 MB/s eta 0:00:00
Collecting asgiref<4,>=3.5.2
Downloading asgiref-3.6.0-py3-none-any.whl (23 kB)
Collecting sqlparse>=0.2.2
Using cached sqlparse-0.4.3-py3-none-any.whl (42 kB)
Installing collected packages: sqlparse, asgiref, django
Successfully installed asgiref-3.6.0 django-4.1.6 sqlparse-0.4.3
[notice] A new release of pip available: 22.3.1 -> 23.0
[notice] To update, run: pip install --upgrade pip
Next, install the MySQL client package.
pip install mysqlclient
Next, create a Django project with the following command.
django-admin startproject djangoproject .
Next, edit the Django configuration file with the following command.
nano djangoproject/settings.py
Add your server IP or domain name as shown below:
ALLOWED_HOSTS = ['your_server_ip']
Find the following database section.
DATABASES = {
'default': {
'ENGINE': 'django.db.backends.sqlite3',
'NAME': BASE_DIR / 'db.sqlite3',
}
}
And replace them with the following lines.
DATABASES = {
'default': {
'ENGINE': 'django.db.backends.mysql',
'NAME': 'django',
'USER': 'django',
'PASSWORD': 'yourpassword',
'HOST': '127.0.0.1',
'PORT' : '3306',
}
}
Next, add/modify the following lines:
import os
STATIC_URL='/static/'
STATIC_ROOT=os.path.join(BASE_DIR, 'static/')
MEDIA_URL='/media/'
MEDIA_ROOT=os.path.join(BASE_DIR, 'media/')
Save and close the file when you are done. Then, migrate the database with the following command.
./manage.py makemigrations
./manage.py migrate
You will get the following output.
Operations to perform:
Apply all migrations: admin, auth, contenttypes, sessions
Running migrations:
Applying contenttypes.0001_initial... OK
Applying auth.0001_initial... OK
Applying admin.0001_initial... OK
Applying admin.0002_logentry_remove_auto_add... OK
Applying admin.0003_logentry_add_action_flag_choices... OK
Applying contenttypes.0002_remove_content_type_name... OK
Applying auth.0002_alter_permission_name_max_length... OK
Applying auth.0003_alter_user_email_max_length... OK
Applying auth.0004_alter_user_username_opts... OK
Applying auth.0005_alter_user_last_login_null... OK
Applying auth.0006_require_contenttypes_0002... OK
Applying auth.0007_alter_validators_add_error_messages... OK
Applying auth.0008_alter_user_username_max_length... OK
Applying auth.0009_alter_user_last_name_max_length... OK
Applying auth.0010_alter_group_name_max_length... OK
Applying auth.0011_update_proxy_permissions... OK
Applying auth.0012_alter_user_first_name_max_length... OK
Applying sessions.0001_initial... OK
Step 5 - Create a Django Superuser
Next, create an administrative user for Django using the following command.
./manage.py createsuperuser
Define your email address and password as shown below:
Username (leave blank to use 'root'): hiteshj
Email address: admin@example.com
Password:
Password (again):
Superuser created successfully.
Next, copy all static files with the following command.
./manage.py collectstatic
Step 6 - Start Django Server
At this point, Django is installed and configured. You can now start Django using the following command.
./manage.py runserver 0.0.0.0:8000
You should see the following output.
Watching for file changes with StatReloader
Performing system checks...
System check identified no issues (0 silenced).
February 06, 2023 - 08:00:46
Django version 4.1.6, using settings 'djangoproject.settings'
Starting development server at http://0.0.0.0:8000/
Quit the server with CONTROL-C.
Step 7 - Access Django Web UI
Django is now started and listens on port 8000. You can now access it using the URL http://your-server-ip:8000/admin. You should see the Django login page on the following screen.
Provide your admin username and password and click on the Login button. You should see the Django dashboard on the following screen.
Conclusion
Congratulations! You have successfully installed and configured Django on Arch Linux. You can now start developing and deploying Python applications using the Django framework. You can set up a Django on a dedicated server hosting from Atlantic.Net!
### How to Install GlassFish Server on Arch Linux
GlassFish is an open-source Java application server used for the development and deployment of Java-based web applications. GlassFish is a flexible, lightweight, and production-ready application that provides many easy-to-use tools to manage, deploy, scale and set up Java-based applications. If you are looking for an enterprise-grade open-source platform for deploying Java applications, then Glassfish is the best option for you.
In this post, we will show you how to install GlassFish on Arch Linux.
Step 1 - Configure Repository
By default, the default repository is outdated in Arch Linux, so you will need to modify the default mirror list. You can do it by editing the mirror list configuration file:
nano /etc/pacman.d/mirrorlist
Remove all lines and add the following lines:
## Score: 0.7, United States
Server = http://mirror.us.leaseweb.net/archlinux/$repo/os/$arch
## Score: 0.8, United States
Server = http://lug.mtu.edu/archlinux/$repo/os/$arch
Server = http://mirror.nl.leaseweb.net/archlinux/$repo/os/$arch
## Score: 0.9, United Kingdom
Server = http://mirror.bytemark.co.uk/archlinux/$repo/os/$arch
## Score: 1.5, United Kingdom
Server = http://mirrors.manchester.m247.com/arch-linux/$repo/os/$arch
Server = http://archlinux.dcc.fc.up.pt/$repo/os/$arch
## Score: 6.6, United States
Server = http://mirror.cs.pitt.edu/archlinux/$repo/os/$arch
## Score: 6.7, United States
Server = http://mirrors.acm.wpi.edu/archlinux/$repo/os/$arch
## Score: 6.8, United States
Server = http://ftp.osuosl.org/pub/archlinux/$repo/os/$arch
## Score: 7.1, India
Server = http://mirror.cse.iitk.ac.in/archlinux/$repo/os/$arch
## Score: 10.1, United States
Server = http://mirrors.xmission.com/archlinux/$repo/os/$arch
Save and close the file, then update all the package indexes with the following command:
pacman -Syu
Step 2 - Install Java
First, you will need to install Java on your server. You can install it using the following command.
pacman -S jre17-openjdk
After installing Java, you can check the Java version using the following command.
java --version
You will get the following output.
openjdk 17.0.6 2023-01-17
OpenJDK Runtime Environment (build 17.0.6+10)
OpenJDK 64-Bit Server VM (build 17.0.6+10, mixed mode)
Step 3 - Download and Install GlassFish
First, visit the GlassFish official download page and download the latest version of GlassFish using the following command.
wget https://download.eclipse.org/ee4j/glassfish/glassfish-7.0.1.zip
Once the download is completed, unzip the downloaded file using the following command.
pacman -S unzip
unzip glassfish-7.0.1.zip
Next, move the extracted directory to /opt using the following command.
mv glassfish7 /opt/
Next, export the GlassFish path to the ~/.bashrc file.
echo "export PATH=$PATH:/opt/glassfish7/bin" >> ~/.bashrc
After that, reload the ~/.bashrc file using the following command.
source ~/.bashrc
Step 4 - Start GlassFish Server
You can now use the asadmin command to start the GlassFish server.
asadmin start-domain
You will get the following output.
Waiting for domain1 to start ............
Waiting finished after 11,935 ms.
Successfully started the domain : domain1
domain Location: /opt/glassfish7/glassfish/domains/domain1
Log File: /opt/glassfish7/glassfish/domains/domain1/logs/server.log
Admin Port: 4,848
Command start-domain executed successfully.
You can verify the GlassFish server using the following command.
asadmin list-domains
Sample output.
domain1 running
Command list-domains executed successfully.
Step 5 - Set GlassFish Admin Password
By default, there is not any password for the GlassFish admin user, so you can set it using the following command.
asadmin change-admin-password
You will be asked to provide your admin user:
Enter admin user name [default: admin]>
Just press the Enter key and you will be asked to provide your admin password.
Enter the admin password>
Just press the Enter key without typing anything. You will be asked to set a new admin password as shown below.
Enter the new admin password>
Enter the new admin password again>
Command change-admin-password executed successfully.
Next, you will also need to enable the admin user. You can enable it using the following command.
asadmin --port 4848 enable-secure-admin
You will be asked to provide your admin user and password to enable it as shown below.
Enter admin user name> admin
Enter admin password for user "admin">
You must restart all running servers for the change in secure admin to take effect.
Command enable-secure-admin executed successfully.
Step 6 - Create a Systemd Service File for GlassFish
Before starting, stop the GlassFish server using the following command.
asadmin stop-domain
Next, create a systemd service file using the following command.
nano /usr/lib/systemd/system/glassfish.service
Add the following configurations.
[Unit]
Description = GlassFish Server v7.1.0
After = syslog.target network.target
[Service]
ExecStart = /usr/bin/java -jar /opt/glassfish7/glassfish/lib/client/appserver-cli.jar start-domain
ExecStop = /usr/bin/java -jar /opt/glassfish7/glassfish/lib/client/appserver-cli.jar stop-domain
ExecReload = /usr/bin/java -jar /opt/glassfish7/glassfish/lib/client/appserver-cli.jar restart-domain
Type = forking
[Install]
WantedBy = multi-user.target
Save the file, then reload the systemd daemon to apply the changes.
systemctl daemon-reload
Next, start and enable the GlassFish service using the following command.
systemctl start glassfish
systemctl enable glassfish
To verify the GlassFish service, run the following command.
systemctl status glassfish
Sample output.
● glassfish.service - GlassFish Server v7.1.0
Loaded: loaded (/usr/lib/systemd/system/glassfish.service; disabled; preset: disabled)
Active: active (running) since Mon 2023-02-06 11:41:57 UTC; 22s ago
Process: 59110 ExecStart=/usr/bin/java -jar /opt/glassfish7/glassfish/lib/client/appserver-cli.jar start-domain (code=exited, status=0/SU>
Main PID: 59125 (java)
Tasks: 77 (limit: 2362)
Memory: 195.5M
CGroup: /system.slice/glassfish.service
└─59125 /usr/lib/jvm/java-17-openjdk/bin/java -cp /opt/glassfish7/glassfish/modules/glassfish.jar -DWALL_CLOCK_START=2023-02-06T>
Feb 06 11:41:44 archlinux systemd[1]: Starting GlassFish Server v7.1.0...
Feb 06 11:41:57 archlinux java[59110]: Waiting for domain1 to start ...........
Feb 06 11:41:57 archlinux java[59110]: Waiting finished after 10,943 ms.
Feb 06 11:41:57 archlinux java[59110]: Successfully started the domain : domain1
Feb 06 11:41:57 archlinux java[59110]: domain Location: /opt/glassfish7/glassfish/domains/domain1
Feb 06 11:41:57 archlinux java[59110]: Log File: /opt/glassfish7/glassfish/domains/domain1/logs/server.log
Feb 06 11:41:57 archlinux java[59110]: Admin Port: 4,848
Feb 06 11:41:57 archlinux java[59110]: Command start-domain executed successfully.
Feb 06 11:41:57 archlinux systemd[1]: Started GlassFish Server v7.1.0.
Step 7 - Access GlassFish Web UI
At this point, GlassFish is installed and listens on port 4848. You can now access it using the URL http://your-server-ip:4848. You should see the GlassFish login page:
Type your admin username and password and click on the Login button. You should see the GlassFish dashboard on the following page.
Conclusion
In this post, we explained how to install a GlassFish server on Arch Linux. You can now deploy, manage and scale Java applications using your GlassFish server. You can try to set up a GlassFish server on dedicated server hosting from Atlantic.Net!
### Medical AI
Medical or healthcare AI provides the healthcare system with artificial intelligence (AI) and machine learning (ML) technologies. The use of AI in medicine has gained significant attention in recent years, as the technology can revolutionize healthcare by enabling more accurate and efficient diagnosis, treatment, and patient care.
AI can transform frontline healthcare services by enabling more accurate and efficient diagnosis, treatment, and patient care. There is also significant scope for Ai automation to reduce the workload of physicians and improve patient satisfaction. In addition, advanced AI can interpret large amounts of medical data, including patient records, medical images, clinical research, and genomic data.
The next generation of AI tools is inbound, and you have probably heard of one of the most popular, ChatGPT. However, this Generative Pre-Trained Transformer is more than just a platform to tell jokes, write homework, or even give you cooking recipes. Researchers are excited by the potential that the technology behind chatGPT can impact the healthcare industry.
Trained AI algorithms can identify patterns and trends in patient data that human doctors might miss. In this article, we will discover what technologies like chatGPT will offer the healthcare industry today and in the future.
Chatbots
Virtual medical consultations are one use case for AI in the medical field that utilizes Chat GPT for medical data processing. With the help of the natural language processing (NLP) capabilities of Chat GPT, it is possible to create an AI-powered virtual assistant that can interact with patients and help doctors diagnose and treat medical conditions remotely.
Here's how it could work: when patients schedule a virtual medical consultation, they are directed to a trained AI-powered chatbot with access to a vast dataset of medical data, symptoms, diagnoses, treatments, and drug interactions. The chatbot could ask patients questions to collect information about their medical history, symptoms, and current condition. It could then use this information to generate a preliminary diagnosis and suggest a treatment plan.
The doctor could then review the chatbot's diagnosis and treatment plan and use it as a starting point for further evaluation and treatment. The doctor could also use the chatbot to help educate the patient about their condition and answer any questions they may have.
Using an AI-powered chatbot for virtual medical consultations could have several benefits:
Reduce the need for in-person visits, which could be especially useful in areas with limited access to healthcare.
Improve healthcare delivery efficiency by automating patient information collection and generating preliminary diagnoses.
Improve patient outcomes by providing patients with more immediate access to medical care and allowing them to receive more personalized treatment plans.
Medical Research
AI services can analyze large amounts of medical data, such as electronic health records, research papers, and clinical trials, enabling researchers to identify patterns and insights that may be difficult to uncover through traditional research methods.
Text mining techniques extract meaningful insights and patterns from data sources such as electronic health records, research papers, and clinical trials. As a result, AI can identify new research opportunities or suggest hypotheses for further investigation.
ChatGPT can automatically generate literature reviews by summarizing key findings and conclusions from relevant research papers saving researchers significant time and effort and allowing them to focus their attention elsewhere.
Data analysis tasks, such as data cleaning and preprocessing, can be handled by ChatGPT, helping researchers identify inconsistencies or errors in their data and ensure that their data is suitable for analysis.
Generative Pretrained Transformers can analyze patients' medical records and suggest personalized treatment plans based on their medical history, symptoms, and other factors, utilizing advanced machine learning techniques. This approach can help to improve the effectiveness of medical treatments and reduce the risk of adverse events.
ChatGPT can provide clinical decision support by helping healthcare providers diagnose diseases and recommend appropriate treatments, helping to improve the accuracy of diagnoses and reducing the risk of medical errors.
Speed Up Medical Diagnosis
AI is unlikely to replace human expertise fully. However, it can help medical professionals handle the pressures of frontline services. However, here are some ways tools like chatGPT can do this:
Answering patient questions: Patients often have many questions about their health conditions, treatments, and medications. ChatGPT can provide easy-to-understand answers to these questions using language that patients are familiar with, helping patients feel more informed and empowered when making decisions about their health.
Explaining medical terms: Medical terminology can confuse and overwhelm patients. ChatGPT can help by explaining medical terms in a way that patients can understand without using technical jargon, helping patients to understand their conditions and treatments better.
Providing health tips: Patients can learn expert tips for managing their health conditions and promoting overall wellness from AI toolsets. For example, AI can provide information on healthy eating, exercise, and stress management techniques.
Sharing resources: ChatGPT can direct patients to reliable resources for further information on their health conditions, including websites, support groups, and other resources that can help patients learn more about their needs and connect with others who may be going through similar experiences.
Supporting self-care: ChatGPT can encourage patients to take an active role in their healthcare by providing tips and guidance on self-care. This can include advice on monitoring symptoms, managing medications, and making lifestyle changes to improve their health.
Private ChatGPT Servers
Did you know that ChatGPT can be deployed on-premise? It can be installed locally or in cloud infrastructure, allowing organizations more control over their data and resources. It can be instrumental in industries such as healthcare, finance, or government, where data privacy and security are critical.
Atlantic.Net is a cloud hosting provider that offers a range of hosting services, including virtual private servers (VPS), dedicated servers, and cloud hosting. Running ChatGPT on Atlantic.Net servers can provide several benefits, including scalability, reliability, and security.
Atlantic.Net offers various hosting options, including VPS and HIPAA-Compliant cloud hosting options and a 100% uptime guarantee. High availability is essential for organizations that require continuous access to their chat interfaces, such as those in the healthcare or finance industries.
Finally, running ChatGPT on Atlantic.Net servers can provide enhanced security. Atlantic.Net range of security features includes firewalls, intrusion detection and prevention, and data encryption to help protect their customer's data and applications, and essential requirements when using AI services that access sensitive or confidential information.
Organizations must set up their virtual machine or cloud server instance, install the necessary software frameworks, and train and deploy the ChatGPT model. Atlantic.Net offers a range of customizable hosting plans to meet your organization's specific needs.
### How to Install Apache Kafka on Arch Linux
Apache Kafka is a free, open-source Distributed Data Streaming Technology used for real-time data pipelines. It is used by thousands of companies for high-performance data pipelines, stream processing, and data integration at scale. Kafka can handle a high volume of data and enables you to pass messages from one end-point to another.
In this post, we will show you how to install Apache Kafka on Arch Linux.
Step 1 - Configure Repository
By default, the default repository is outdated in Arch Linux, so you will need to modify the default mirror list. You can do it by editing the mirrorlist configuration file:
nano /etc/pacman.d/mirrorlist
Remove all lines and add the following lines:
## Score: 0.7, United States
Server = http://mirror.us.leaseweb.net/archlinux/$repo/os/$arch
## Score: 0.8, United States
Server = http://lug.mtu.edu/archlinux/$repo/os/$arch
Server = http://mirror.nl.leaseweb.net/archlinux/$repo/os/$arch
## Score: 0.9, United Kingdom
Server = http://mirror.bytemark.co.uk/archlinux/$repo/os/$arch
## Score: 1.5, United Kingdom
Server = http://mirrors.manchester.m247.com/arch-linux/$repo/os/$arch
Server = http://archlinux.dcc.fc.up.pt/$repo/os/$arch
## Score: 6.6, United States
Server = http://mirror.cs.pitt.edu/archlinux/$repo/os/$arch
## Score: 6.7, United States
Server = http://mirrors.acm.wpi.edu/archlinux/$repo/os/$arch
## Score: 6.8, United States
Server = http://ftp.osuosl.org/pub/archlinux/$repo/os/$arch
## Score: 7.1, India
Server = http://mirror.cse.iitk.ac.in/archlinux/$repo/os/$arch
## Score: 10.1, United States
Server = http://mirrors.xmission.com/archlinux/$repo/os/$arch
Save and close the file then update all the package indexes with the following command:
pacman -Syu
Step 2 - Install Java JDK
Apache Kafka is a Java-based software, so Java must be installed on your system. You can install it by simply running the following command.
pacman -S jre17-openjdk curl
After the successful installation, you can verify the Java version using the following command.
java --version
You will get the following output.
openjdk 17.0.6 2023-01-17
OpenJDK Runtime Environment (build 17.0.6+10)
OpenJDK 64-Bit Server VM (build 17.0.6+10, mixed mode)
Step 3 - Install Apache Kafka
First, create a dedicated user to run Apache Kafka using the following command.
useradd -r -d /opt/kafka -s /usr/sbin/nologin kafka
Next, download the latest version of Apache Kafka from their official download page.
curl -fsSLo kafka.tgz https://downloads.apache.org/kafka/3.3.2/kafka_2.13-3.3.2.tgz
Once the download is completed, extract the downloaded file with the following command.
tar -xzf kafka.tgz
Next, move the extracted directory to /opt.
mv kafka_2.13-3.3.2 /opt/kafka
Next, change the ownership of the Kafka directory.
chown -R kafka:kafka /opt/kafka
Next, create a Kafka log directory using the following command.
sudo -u kafka mkdir -p /opt/kafka/logs
Next, edit the Kafka configuration file and define your log directory.
sudo -u kafka nano /opt/kafka/config/server.properties
Change the following line:
log.dirs=/opt/kafka/logs
Save and close the file when you are done.
Step 4 - Create a Systemd Service File for Kafka
It is recommended to create a systemd service file to manage the Kafka service. First, create a Zookeeper service file using the following command.
nano /etc/systemd/system/zookeeper.service
Add the following configuration.
[Unit]
Requires=network.target remote-fs.target
After=network.target remote-fs.target
[Service]
Type=simple
User=kafka
ExecStart=/opt/kafka/bin/zookeeper-server-start.sh /opt/kafka/config/zookeeper.properties
ExecStop=/opt/kafka/bin/zookeeper-server-stop.sh
Restart=on-abnormal
[Install]
WantedBy=multi-user.target
Next, create a Kafka service file:
nano /etc/systemd/system/kafka.service
Add the following configuration.
[Unit]
Requires=zookeeper.service
After=zookeeper.service
[Service]
Type=simple
User=kafka
ExecStart=/bin/sh -c '/opt/kafka/bin/kafka-server-start.sh /opt/kafka/config/server.properties > /opt/kafka/logs/start-kafka.log 2>&1'
ExecStop=/opt/kafka/bin/kafka-server-stop.sh
Restart=on-abnormal
[Install]
WantedBy=multi-user.target
Save and close the file, then reload the systemd daemon to apply the changes.
systemctl daemon-reload
Next, start and enable both services using the following command.
systemctl enable zookeeper kafka
systemctl start zookeeper kafka
You can check the status of both services using the following command.
systemctl status zookeeper kafka
You will get the service status in the following output.
● zookeeper.service
Loaded: loaded (/etc/systemd/system/zookeeper.service; enabled; preset: disabled)
Active: active (running) since Mon 2023-02-06 05:05:11 UTC; 17s ago
Main PID: 54782 (java)
Tasks: 34 (limit: 4700)
Memory: 68.5M
CGroup: /system.slice/zookeeper.service
└─54782 java -Xmx512M -Xms512M -server -XX:+UseG1GC -XX:MaxGCPauseMillis=20 -XX:InitiatingHeapOccupancyPercent=35 -XX:+ExplicitG>
Feb 06 05:05:13 archlinux zookeeper-server-start.sh[54782]: [2023-02-06 05:05:13,594] INFO zookeeper.snapshot.compression.method = CHECKED (o>
Feb 06 05:05:13 archlinux zookeeper-server-start.sh[54782]: [2023-02-06 05:05:13,594] INFO Snapshotting: 0x0 to /tmp/zookeeper/version-2/snap>
Feb 06 05:05:13 archlinux zookeeper-server-start.sh[54782]: [2023-02-06 05:05:13,598] INFO Snapshot loaded in 11 ms, highest zxid is 0x0, dig>
Feb 06 05:05:13 archlinux zookeeper-server-start.sh[54782]: [2023-02-06 05:05:13,598] INFO Snapshotting: 0x0 to /tmp/zookeeper/version-2/snap>
Feb 06 05:05:13 archlinux zookeeper-server-start.sh[54782]: [2023-02-06 05:05:13,598] INFO Snapshot taken in 0 ms (org.apache.zookeeper.serve>
Feb 06 05:05:13 archlinux zookeeper-server-start.sh[54782]: [2023-02-06 05:05:13,625] INFO zookeeper.request_throttler.shutdownTimeout = 1000>
Feb 06 05:05:13 archlinux zookeeper-server-start.sh[54782]: [2023-02-06 05:05:13,626] INFO PrepRequestProcessor (sid:0) started, reconfigEnab>
Feb 06 05:05:13 archlinux zookeeper-server-start.sh[54782]: [2023-02-06 05:05:13,660] INFO Using checkIntervalMs=60000 maxPerMinute=10000 max>
Feb 06 05:05:13 archlinux zookeeper-server-start.sh[54782]: [2023-02-06 05:05:13,662] INFO ZooKeeper audit is disabled. (org.apache.zookeeper>
Feb 06 05:05:24 archlinux zookeeper-server-start.sh[54782]: [2023-02-06 05:05:24,979] INFO Creating new log file: log.1 (org.apache.zookeeper>
● kafka.service
Loaded: loaded (/etc/systemd/system/kafka.service; enabled; preset: disabled)
Active: active (running) since Mon 2023-02-06 05:05:21 UTC; 15s ago
Main PID: 55164 (sh)
Tasks: 73 (limit: 4700)
Memory: 316.6M
CGroup: /system.slice/kafka.service
├─55164 /bin/sh -c "/opt/kafka/bin/kafka-server-start.sh /opt/kafka/config/server.properties > /opt/kafka/logs/start-kafka.log 2>
└─55165 java -Xmx1G -Xms1G -server -XX:+UseG1GC -XX:MaxGCPauseMillis=20 -XX:InitiatingHeapOccupancyPercent=35 -XX:+ExplicitGCInv>
Feb 06 05:05:21 archlinux systemd[1]: Started kafka.service.
Step 5 – Create a Topic in Kafka
At this point, Kafka is installed and running. Now, it's time to verify Kafka.
To verify Kafka, create a topic named MyTopic using the following command.
sudo -u kafka /opt/kafka/bin/kafka-topics.sh --create --bootstrap-server localhost:9092 --replication-factor 1 --partitions 1 --topic MyTopic
You can now verify your created topic using the following command.
sudo -u kafka /opt/kafka/bin/kafka-topics.sh --list --bootstrap-server localhost:9092
Sample output.
MyTopic
Kafka provides a command line client called producer that will take input from a file or from standard input and send it out as messages to the Kafka cluster.
Run the following command to type a few messages into the console to send to the server.
sudo -u kafka /opt/kafka/bin/kafka-console-producer.sh --broker-list localhost:9092 --topic MyTopic
Type some messages as shown below:
>Hi How are you?
>I am fine
Now, open another terminal and run the consumer command line tool to read data from the Kafka cluster and display it to the output.
sudo -u kafka /opt/kafka/bin/kafka-console-consumer.sh --bootstrap-server localhost:9092 --topic MyTopic --from-beginning
You will get the messages in the following output.
Hi How are you?
I am fine
Conclusion
In this tutorial, we explained how to install Apache Kafka on Arch Linux. We also verified Kafka using producer and consumer. Try installing a Kafka server on dedicated server hosting from Atlantic.Net!
### How to Install Apache Solr on Arch Linux
Apache Solr is a popular open-source search platform built on Apache Lucene. It is written in Java and used to build search applications. Solr provides distributed indexing, replication, and load-balanced querying to achieve data querying in near real-time. It offers very useful features, including full-text search capability, easy monitoring, real-time indexing, optimized for high-volume traffic, and more.
This post will show you how to install Apache Solr on Arch Linux.
Step 1 - Configure Repository
By default, the default repository is outdated in Arch Linux, so you will need to modify the default mirror list. You can do it by editing the mirrorlist configuration file:
nano /etc/pacman.d/mirrorlist
Remove all lines and add the following lines:
## Score: 0.7, United States
Server = http://mirror.us.leaseweb.net/archlinux/$repo/os/$arch
## Score: 0.8, United States
Server = http://lug.mtu.edu/archlinux/$repo/os/$arch
Server = http://mirror.nl.leaseweb.net/archlinux/$repo/os/$arch
## Score: 0.9, United Kingdom
Server = http://mirror.bytemark.co.uk/archlinux/$repo/os/$arch
## Score: 1.5, United Kingdom
Server = http://mirrors.manchester.m247.com/arch-linux/$repo/os/$arch
Server = http://archlinux.dcc.fc.up.pt/$repo/os/$arch
## Score: 6.6, United States
Server = http://mirror.cs.pitt.edu/archlinux/$repo/os/$arch
## Score: 6.7, United States
Server = http://mirrors.acm.wpi.edu/archlinux/$repo/os/$arch
## Score: 6.8, United States
Server = http://ftp.osuosl.org/pub/archlinux/$repo/os/$arch
## Score: 7.1, India
Server = http://mirror.cse.iitk.ac.in/archlinux/$repo/os/$arch
## Score: 10.1, United States
Server = http://mirrors.xmission.com/archlinux/$repo/os/$arch
Save and close the file, then update all the package indexes with the following command:
pacman -Syu
Step 2 - Install Java JDK
First, you will need to install Java on your server. You can install it using the following command.
pacman -S jre17-openjdk
Once installed, you can verify the Java version with the following command.
java --version
You will get the following output.
openjdk 17.0.6 2023-01-17
OpenJDK Runtime Environment (build 17.0.6+10)
OpenJDK 64-Bit Server VM (build 17.0.6+10, mixed mode)
Step 3 - Install Apache Solr
Apache Solr is available in the Arch Linux default repository. You can install it using the following command.
pacman -S solr
After the installation, start and enable the Apache Solr service using the following command.
systemctl start solr
systemctl enable solr
You can also check the Apache Solr status with the following command.
systemctl status solr
You will see the following output.
● solr.service - Solr full text search engine
Loaded: loaded (/usr/lib/systemd/system/solr.service; disabled; preset: disabled)
Active: active (running) since Mon 2023-02-06 13:22:26 UTC; 2min 22s ago
Main PID: 60050 (java)
Tasks: 40 (limit: 2362)
Memory: 637.6M
CGroup: /system.slice/solr.service
└─60050 java -server -Xms512m -Xmx512m -XX:+UseG1GC -XX:+PerfDisableSharedMem -XX:+ParallelRefProcEnabled -XX:MaxGCPauseMillis=2>
Feb 06 13:22:34 archlinux solr[60050]: 2023-02-06 13:22:34.532 WARN (main) [] o.a.s.c.CoreContainer Not all security plugins configured! au>
Feb 06 13:22:35 archlinux solr[60050]: 2023-02-06 13:22:35.040 INFO (main) [] o.a.s.c.CorePropertiesLocator Found 0 core definitions underne>
Feb 06 13:22:35 archlinux solr[60050]: 2023-02-06 13:22:35.243 INFO (main) [] o.e.j.s.h.ContextHandler Started o.e.j.w.WebAppContext@33a053d>
Feb 06 13:22:35 archlinux solr[60050]: 2023-02-06 13:22:35.274 INFO (main) [] o.e.j.s.RequestLogWriter Opened /var/log/solr/2023_02_06.reque>
Feb 06 13:22:35 archlinux solr[60050]: 2023-02-06 13:22:35.289 INFO (main) [] o.e.j.s.AbstractConnector Started ServerConnector@aa22f1c{HTTP>
Feb 06 13:22:35 archlinux solr[60050]: 2023-02-06 13:22:35.290 INFO (main) [] o.e.j.s.Server Started @7940ms
Feb 06 13:24:14 archlinux solr[60050]: 2023-02-06 13:24:14.606 INFO (qtp2085886997-19) [] o.a.s.c.TransientSolrCoreCacheDefault Allocating t>
Feb 06 13:24:14 archlinux solr[60050]: 2023-02-06 13:24:14.638 INFO (qtp2085886997-19) [] o.a.s.s.HttpSolrCall [admin] webapp=null path=/adm>
Feb 06 13:24:14 archlinux solr[60050]: 2023-02-06 13:24:14.688 INFO (qtp2085886997-18) [] o.a.s.s.HttpSolrCall [admin] webapp=null path=/adm>
Feb 06 13:24:15 archlinux solr[60050]: 2023-02-06 13:24:15.982 INFO (qtp2085886997-19) [] o.a.s.s.HttpSolrCall [admin] webapp=null path=/adm>
lines 1-19/19 (END)
By default, Apache Solr listens on port 8993. You can verify it using the following command.
ss -altnp | grep 8983
You will get the following output.
LISTEN 0 0 [::ffff:127.0.0.1]:8983 *:* users:(("java",pid=60050,fd=138))
Step 4 - Configure Nginx as a Reverse Proxy for Apache Solr
First, install the Nginx web server package using the following command.
pacman -S nginx
Next, start and enable the Nginx service with the following command.
systemctl start nginx
systemctl enable nginx
Next, create a directory for the Nginx configuration with the following command.
mkdir /etc/nginx/sites-enabled
Next, edit the Nginx main configuration file and define your directory.
nano /etc/nginx/nginx.conf
Add the following lines below the line http{:
include sites-enabled/*;
server_names_hash_bucket_size 64;
Next, create an Nginx virtual host configuration file with the following command:
nano /etc/nginx/sites-enabled/solr.conf
Add the following lines.
Server {
listen 80;
server_name solr.example.com;
location / {
proxy_pass http://127.0.0.1:8983;
}
}
Save and close the file, then verify Nginx for any syntax configuration errors:
nginx -t
You will get the following output:
nginx: the configuration file /etc/nginx/nginx.conf syntax is ok
nginx: configuration file /etc/nginx/nginx.conf test is successful
Finally, restart the Nginx service to apply the changes:
systemctl restart nginx
Step 5 - Access Apache Solr
Now, open your web browser and access the Apache Solr web UI using the URL http://solr.example.com. You should see the Apache Solr web UI on the following screen.
Conclusion
In this tutorial, we showed you how to install Apache Solr on Arch Linux. You can now start building your search application using the Apache Solr platform. You can test Apache Solr on dedicated server hosting from Atlantic.Net!
### How to Install Wildfly Server on Arch Linux
WildFly, formerly known as JBoss Application Server, is an open-source web application server used to build amazing applications. It is popular among users and developers worldwide who want to develop enterprise-grade Java applications. WildFly provides necessary features that reduce development time, manage resources more efficiently, and save money for users.
In this tutorial, we will explain how to install Wildfly on Arch Linux.
Step 1 - Configure Repository
By default, the default repository is outdated in Arch Linux, so you will need to modify the default mirror list if you have not done so already. You can do it by editing the mirror list configuration file:
nano /etc/pacman.d/mirrorlist
Remove all lines and add the following lines:
## Score: 0.7, United States
Server = http://mirror.us.leaseweb.net/archlinux/$repo/os/$arch
## Score: 0.8, United States
Server = http://lug.mtu.edu/archlinux/$repo/os/$arch
Server = http://mirror.nl.leaseweb.net/archlinux/$repo/os/$arch
## Score: 0.9, United Kingdom
Server = http://mirror.bytemark.co.uk/archlinux/$repo/os/$arch
## Score: 1.5, United Kingdom
Server = http://mirrors.manchester.m247.com/arch-linux/$repo/os/$arch
Server = http://archlinux.dcc.fc.up.pt/$repo/os/$arch
## Score: 6.6, United States
Server = http://mirror.cs.pitt.edu/archlinux/$repo/os/$arch
## Score: 6.7, United States
Server = http://mirrors.acm.wpi.edu/archlinux/$repo/os/$arch
## Score: 6.8, United States
Server = http://ftp.osuosl.org/pub/archlinux/$repo/os/$arch
## Score: 7.1, India
Server = http://mirror.cse.iitk.ac.in/archlinux/$repo/os/$arch
## Score: 10.1, United States
Server = http://mirrors.xmission.com/archlinux/$repo/os/$arch
Save and close the file, then update all the package indexes with the following command:
pacman -Syu
Step 2 - Install Java
WildFly is a Java-based application server, so you will require Java to be installed on your server. You can install the latest version of Java using the following command.
pacman -S jre17-openjdk
Once installed, verify the Java installation using the following command.
java --version
You should see the Java version in the following output.
openjdk 17.0.6 2023-01-17
OpenJDK Runtime Environment (build 17.0.6+10)
OpenJDK 64-Bit Server VM (build 17.0.6+10, mixed mode)
Step 3 - Download and Install Wildfly
Before starting, it is a good idea to create a dedicated user and group to run the Wildfly application server. You can create a user and group with the following command.
groupadd -r wildfly
useradd -r -g wildfly -d /opt/wildfly -s /sbin/nologin wildfly
Next, download the latest version of Wildfly using the following command.
wget https://github.com/wildfly/wildfly/releases/download/26.1.3.Final/wildfly-26.1.3.Final.zip
Once the download is completed, unzip the downloaded file with the following command.
pacman -S unzip
unzip wildfly-26.1.3.Final.zip
Next, move the extracted directory to /opt with the following command.
mv wildfly-26.1.3.Final /opt/wildfly
Next, change the ownership of the Wildfly directory.
chown -RH wildfly: /opt/wildfly
Step 4 - Configure Wildfly
First, create a configuration directory for Wildfly using the following command.
mkdir -p /etc/wildfly
Next, copy the Wildfly configuration file to the /etc/wildfly.
cp /opt/wildfly/docs/contrib/scripts/systemd/wildfly.conf /etc/wildfly/
Next, edit the Wildfly configuration file.
nano /etc/wildfly/wildfly.conf
Change the file as shown below:
# The configuration you want to run
WILDFLY_CONFIG=standalone.xml
# The mode you want to run
WILDFLY_MODE=standalone
# The address to bind to
WILDFLY_BIND=0.0.0.0
WILDFLY_CONSOLE_BIND=0.0.0.0
Next, copy the launch.sh file to the bin directory.
cp /opt/wildfly/docs/contrib/scripts/systemd/launch.sh /opt/wildfly/bin/
Next, edit the launch.sh file.
nano /opt/wildfly/bin/launch.sh
Find the following lines:
$WILDFLY_HOME/bin/domain.sh -c $2 -b $3
$WILDFLY_HOME/bin/standalone.sh -c $2 -b $3
Replace them with the following lines:
$WILDFLY_HOME/bin/domain.sh -c $2 -b $3 -bmanagement $4
$WILDFLY_HOME/bin/standalone.sh -c $2 -b $3 -bmanagement $4
Save and close the file when you are done.
Step 5 - Configure Systemd Service File for Wildfly
First, copy the Wildfly sample configuration file.
cp /opt/wildfly/docs/contrib/scripts/systemd/wildfly.service /etc/systemd/system/
Next, edit the Wildfly service file and make some changes.
nano /etc/systemd/system/wildfly.service
Find the following line.
ExecStart=/opt/wildfly/bin/launch.sh $WILDFLY_MODE $WILDFLY_CONFIG $WILDFLY_BIND
Replace it with the following line.
ExecStart=/opt/wildfly/bin/launch.sh $WILDFLY_MODE $WILDFLY_CONFIG $WILDFLY_BIND $WILDFLY_CONSOLE_BIND
Save and close the file, then set the execution permission.
chmod +x /opt/wildfly/bin/*.sh
Next, reload the systemd daemon to apply the changes.
systemctl daemon-reload
Next, start and enable the Wildfly service with the following command.
systemctl start wildfly
systemctl enable wildfly
You can verify the Wildfly status using the following command.
systemctl status wildfly
You will get the following output.
● wildfly.service - The WildFly Application Server
Loaded: loaded (/etc/systemd/system/wildfly.service; disabled; preset: disabled)
Active: active (running) since Mon 2023-02-06 13:42:44 UTC; 6s ago
Main PID: 45915 (launch.sh)
Tasks: 118 (limit: 4700)
Memory: 254.2M
CGroup: /system.slice/wildfly.service
├─45915 /bin/bash /opt/wildfly/bin/launch.sh standalone standalone.xml 0.0.0.0
├─45918 /bin/sh /opt/wildfly/bin/standalone.sh -c standalone.xml -b 0.0.0.0
└─46106 java "-D[Standalone]" -server -Xms64m -Xmx512m -XX:MetaspaceSize=96M -XX:MaxMetaspaceSize=256m -Djava.net.preferIPv4Stac>
Feb 06 13:42:44 archlinux systemd[1]: Started The WildFly Application Server.
Step 6 - Add Wildfly Admin User
Next, you will need to add an administrator user to manage the Wildfly. You can add it with the following command.
/opt/wildfly/bin/add-user.sh
You will be asked to select the user types as shown below:
What type of user do you wish to add?
a) Management User (mgmt-users.properties)
b) Application User (application-users.properties)
(a):
Type a for management user and press the Enter key. You will be asked to provide a username and password as shown below.
Enter the details of the new user to add.
Using realm 'ManagementRealm' as discovered from the existing property files.
Username : hjethva
Password recommendations are listed below. To modify these restrictions edit the add-user.properties configuration file.
- The password should be different from the username
- The password should not be one of the following restricted values {root, admin, administrator}
- The password should contain at least 8 characters, 1 alphabetic character(s), 1 digit(s), 1 non-alphanumeric symbol(s)
Password :
Re-enter Password :
Provide your username and password and press the Enter key. Answer all the questions to add a user.
What groups do you want this user to belong to? (Please enter a comma separated list, or leave blank for none)[ ]:
About to add user 'hjethva' for realm 'ManagementRealm'
Is this correct yes/no? yes
Added user 'hjethva' to file '/opt/wildfly/standalone/configuration/mgmt-users.properties'
Added user 'hjethva' to file '/opt/wildfly/domain/configuration/mgmt-users.properties'
Added user 'hjethva' with groups to file '/opt/wildfly/standalone/configuration/mgmt-groups.properties'
Added user 'hjethva' with groups to file '/opt/wildfly/domain/configuration/mgmt-groups.properties'
Is this new user going to be used for one AS process to connect to another AS process?
e.g. for a slave host controller connecting to the master or for a Remoting connection for server to server Jakarta Enterprise Beans calls.
yes/no? yes
Step 7 - Access Wildfly Web Interface
Now, open your web browser and type the URL http://your-server-ip:8080 to access the Wildfly. You should see the following screen.
You can also access the administration console using the URL http://your-server-ip:9990/console. You will be redirected to the Wildfly login screen.
Provide your username and password and click on the Sign in button. You should see the Wildfly administrative dashboard on the following screen.
Conclusion
Congratulations! You have successfully installed the Wildfly application server on Arch Linux. You can now build and deploy Java applications using the Wildfly application server. You can test the Wildfly application server on dedicated server hosting from Atlantic.Net!
### How to Install TinyProxy on Arch Linux
TinyProxy is a lightweight and small-footprint Proxy server designed for Linux-based operating systems. It is fast, configurable, and also can be used as a reverse proxy. It offers an access control feature that helps you to block and unblock specific websites. It is an ideal solution for use cases such as embedded deployments requiring a full-featured HTTP proxy.
In this post, we will show you how to install TinyProxy on Arch Linux.
Step 1 - Configure Repository
By default, the default repository is outdated in Arch Linux, so you will need to modify the default mirror list. You can do it by editing the mirror list configuration file:
nano /etc/pacman.d/mirrorlist
Remove all lines and add the following lines:
## Score: 0.7, United States
Server = http://mirror.us.leaseweb.net/archlinux/$repo/os/$arch
## Score: 0.8, United States
Server = http://lug.mtu.edu/archlinux/$repo/os/$arch
Server = http://mirror.nl.leaseweb.net/archlinux/$repo/os/$arch
## Score: 0.9, United Kingdom
Server = http://mirror.bytemark.co.uk/archlinux/$repo/os/$arch
## Score: 1.5, United Kingdom
Server = http://mirrors.manchester.m247.com/arch-linux/$repo/os/$arch
Server = http://archlinux.dcc.fc.up.pt/$repo/os/$arch
## Score: 6.6, United States
Server = http://mirror.cs.pitt.edu/archlinux/$repo/os/$arch
## Score: 6.7, United States
Server = http://mirrors.acm.wpi.edu/archlinux/$repo/os/$arch
## Score: 6.8, United States
Server = http://ftp.osuosl.org/pub/archlinux/$repo/os/$arch
## Score: 7.1, India
Server = http://mirror.cse.iitk.ac.in/archlinux/$repo/os/$arch
## Score: 10.1, United States
Server = http://mirrors.xmission.com/archlinux/$repo/os/$arch
Save and close the file, then update all the package indexes with the following command:
pacman -Syu
Step 2 - Install TinyProxy
By default, the TinyProxy package is included in the Arch Linux main repository. You can simply install it with the following command.
pacman -S tinyproxy
Once the TinyProxy is installed on your server, you can proceed to the next step.
Step 3 - Configure TinyProxy
Next, you will need to edit the TinyProxy main configuration file and modify it as per your requirements.
You can edit it with the following command.
nano /etc/tinyproxy/tinyproxy.conf
Change the following configurations.
Port 8888
Listen your-server-ip
LogFile "/var/log/tinyproxy/tinyproxy.log"
PidFile "/var/run/tinyproxy/tinyproxy.pid"
BasicAuth user password
Allow client-machine-ip
Save and close the file, then create a log directory and file with the following command.
mkdir /var/log/tinyproxy
touch /var/log/tinyproxy/tinyproxy.log
Next, start and enable the TinyProxy service with the following command.
systemctl start tinyproxy
systemctl enable tinyproxy
You can now verify the status of TinyProxy using the following command.
systemctl status tinyproxy
You should see the following output.
● tinyproxy.service - Tinyproxy Web Proxy Server
Loaded: loaded (/usr/lib/systemd/system/tinyproxy.service; disabled; preset: disabled)
Active: active (running) since Sat 2023-03-04 03:40:34 UTC; 3min 53s ago
Process: 64007 ExecStart=/usr/bin/tinyproxy -c /etc/tinyproxy/tinyproxy.conf (code=exited, status=0/SUCCESS)
Main PID: 64009 (tinyproxy)
Tasks: 1 (limit: 2362)
Memory: 1.4M
CGroup: /system.slice/tinyproxy.service
└─64009 /usr/bin/tinyproxy -c /etc/tinyproxy/tinyproxy.conf
Mar 04 03:40:34 archlinux tinyproxy[64009]: Added basic auth user : user
Mar 04 03:40:34 archlinux tinyproxy[64009]: Setting "Via" header to 'tinyproxy'
Mar 04 03:40:34 archlinux tinyproxy[64009]: Reloading config file finished
Mar 04 03:40:34 archlinux tinyproxy[64009]: listen_sock called with addr = '69.28.85.116'
Mar 04 03:40:34 archlinux tinyproxy[64009]: trying to listen on host[69.28.85.116], family[2], socktype[1], proto[6]
Mar 04 03:40:34 archlinux tinyproxy[64009]: listening on fd [0]
Mar 04 03:40:34 archlinux tinyproxy[64009]: Now running as group "tinyproxy".
Mar 04 03:40:34 archlinux tinyproxy[64009]: Now running as user "tinyproxy".
Mar 04 03:40:34 archlinux tinyproxy[64009]: Setting the various signals.
Mar 04 03:40:34 archlinux tinyproxy[64009]: Starting main loop. Accepting connections.
At this point, TinyProxy is installed and listens on port 8888. You can check it with the following command.
ss -antpl | grep tinyproxy
You should see the following output.
LISTEN 0 0 69.28.85.116:8888 0.0.0.0:* users:(("tinyproxy",pid=64009,fd=0))
Step 4 - Define Proxy Setting on Web Browser
Next, you will need to configure your web browser and define your proxy server. Go to the client machine, open the Firefox browser, and click on the settings. You should see the following screen.
Now, click on the settings under the Network Settings. You should see the proxy setting screen.
Define your TinyProxy server IP, Port, and click on the Ok button.
Now, type the URL https://whatismyipaddress.com/ in your web browser. You will be asked to provide a username and password.
Provide your username and password and click on the Sign in button to authentic TinyProxy. You should see your server IP on the following screen.
Conclusion
In this tutorial, we explained how to install TinyProxy and configure it on Arch Linux. You can now use TinyProxy to browse the Internet anonymously. You can also deploy TinyProxy on dedicated server hosting from Atlantic.Net!
### How to Install Dstat Monitoring Tool on Arch Linux
Dstat is a versatile tool used for monitoring several system resources such as CPU, Memory, Network, Processes, and more. It is a great replacement for older tools such as vmstat, iostat, mpstat, netstat, and ifstat. It displays system resources in a real-time. Dstat is written in Python and allows you to export a generated result in an Excel sheet If you are looking for an all-in-one system resource monitoring tool, then Dstat is the right choice for you.
In this post, we will show you how to install and use the Dstat monitoring tool on Arch Linux.
Step 1 - Configure Repository
By default, the default repository is outdated in Arch Linux, so you will need to modify the default mirror list. You can do it by editing the mirror list configuration file:
nano /etc/pacman.d/mirrorlist
Remove all lines and add the following lines:
## Score: 0.7, United States
Server = http://mirror.us.leaseweb.net/archlinux/$repo/os/$arch
## Score: 0.8, United States
Server = http://lug.mtu.edu/archlinux/$repo/os/$arch
Server = http://mirror.nl.leaseweb.net/archlinux/$repo/os/$arch
## Score: 0.9, United Kingdom
Server = http://mirror.bytemark.co.uk/archlinux/$repo/os/$arch
## Score: 1.5, United Kingdom
Server = http://mirrors.manchester.m247.com/arch-linux/$repo/os/$arch
Server = http://archlinux.dcc.fc.up.pt/$repo/os/$arch
## Score: 6.6, United States
Server = http://mirror.cs.pitt.edu/archlinux/$repo/os/$arch
## Score: 6.7, United States
Server = http://mirrors.acm.wpi.edu/archlinux/$repo/os/$arch
## Score: 6.8, United States
Server = http://ftp.osuosl.org/pub/archlinux/$repo/os/$arch
## Score: 7.1, India
Server = http://mirror.cse.iitk.ac.in/archlinux/$repo/os/$arch
## Score: 10.1, United States
Server = http://mirrors.xmission.com/archlinux/$repo/os/$arch
Save and close the file, then update all the package indexes with the following command:
pacman -Syu
Step 2 - Install Dstat
By default, the Dstat utility is included in the Arch Linux default repository. You can install it using the following command.
pacman -S dstat
Once Dstat is installed, you can see all Dstat options with the following command.
dstat --help
You should see the following screen.
Step 3 - How to Use Dstat to Monitor System Resources.
To display the CPU usage information, run the following command.
dstat -c
You should see the following screen.
To display the memory usage information, run the following command.
dstat -m
You should see the following screen.
To display CPU usage with load average, run the following command.
dstat -cl
You should see the following screen.
To display the most expensive CPU process with the most expensive memory process, run the following command.
dstat --top-cpu-adv --top-latency --top-mem
You should see the following screen.
To display to CPU and Memory consuming processes, run the following command.
dstat -c --top-cpu -dn --top-mem
You should see the following screen.
If you want to display the time, CPU, mem, and system load stats with a one-second delay between 5 updates, run the following command.
dstat --time --cpu --mem --load 1 5
You should see the following screen.
To list all available Dstat plugins, run the following command.
dstat --list
You should see all plugins on the following screen.
To display information in vmstat format, use the following command:
dstat --vmstat
You should see the following screen.
To display the output without color, run the following command.
dstat --nocolor
Conclusion
In this post, we showed you how to install and use Dstat to monitor server performance and system resources via the command line. You can now use Dstat on dedicated server hosting from Atlantic.Net!
### How to Install Golang on Arch Linux
Go, also known as Golang or Go language, is an open-source programming language developed by Google. It is a high-level language used for developing web applications, cloud, and networking services. Compared to other programming languages, Golang runs faster, compiles quicker, is easy to maintain and support, and allows for shorter software development lifecycles.
In this post, we will show you how to install Golang on Arch Linux.
Step 1 - Configure Repository
By default, the default repository is outdated in Arch Linux, so you will need to modify the default mirror list. You can do it by editing the mirror list configuration file:
nano /etc/pacman.d/mirrorlist
Remove all lines and add the following lines:
## Score: 0.7, United States
Server = http://mirror.us.leaseweb.net/archlinux/$repo/os/$arch
## Score: 0.8, United States
Server = http://lug.mtu.edu/archlinux/$repo/os/$arch
Server = http://mirror.nl.leaseweb.net/archlinux/$repo/os/$arch
## Score: 0.9, United Kingdom
Server = http://mirror.bytemark.co.uk/archlinux/$repo/os/$arch
## Score: 1.5, United Kingdom
Server = http://mirrors.manchester.m247.com/arch-linux/$repo/os/$arch
Server = http://archlinux.dcc.fc.up.pt/$repo/os/$arch
## Score: 6.6, United States
Server = http://mirror.cs.pitt.edu/archlinux/$repo/os/$arch
## Score: 6.7, United States
Server = http://mirrors.acm.wpi.edu/archlinux/$repo/os/$arch
## Score: 6.8, United States
Server = http://ftp.osuosl.org/pub/archlinux/$repo/os/$arch
## Score: 7.1, India
Server = http://mirror.cse.iitk.ac.in/archlinux/$repo/os/$arch
## Score: 10.1, United States
Server = http://mirrors.xmission.com/archlinux/$repo/os/$arch
Save and close the file then update all the package index with the following command:
pacman -Syu
Step 2 - Install Golang
First, visit the Golang official website, pick the latest version of Golang, and download it with the following command.
wget https://go.dev/dl/go1.20.1.linux-amd64.tar.gz
Once the download is completed, extract the downloaded file with the following command.
tar -C /usr/local -xzf go1.20.1.linux-amd64.tar.gz
You can verify the content of the extracted file with the following command.
ls /usr/local/go
You should see the following output.
api bin CONTRIBUTING.md doc LICENSE PATENTS README.md src VERSION
AUTHORS codereview.cfg CONTRIBUTORS lib misc pkg SECURITY.md test
Step 3 - Create Golang Environment Variable
Next, you will need to create or edit the .bashrc file and define your Golang installation path.
nano ~/.bashrc
Add the following line:
export PATH=$PATH:/usr/local/go/bin
Save and close the file, then activate the environment variable with the following command.
source ~/.bashrc
You can now verify the Go version with the following command.
go version
You should see the Go version in the following output.
go version go1.18.1 linux/amd64
Step 4 - Create a Project with Golang
First, create a project directory for Golang using the following command.
mkdir project
Next, navigate to the project directory and initialize the project with the following command.
cd project
go mod init go.example.com/hello
Next, create a hello application file with the following command.
nano hello.go
Add the following code.
package main
import "fmt"
func main() {
fmt.Println("Hello, Go is working")
}
Save and close the file, then run the Go application using the following command.
go run hello.go
If everything is fine, you should see the following output.
Hello, Go is working
Conclusion
In this post, we showed you how to install Golang on Arch Linux. We also created a sample project with Golang. You can now start developing cloud and web applications using Golang. Deploy the Go application on a dedicated server hosting plan from Atlantic.Net!
### Bare Metal, Dedicated Cloud Hosts, and Dedicated Servers - What Is the Difference in 2025?
Businesses looking to maximize the performance of their websites and eCommerce platforms have a choice between several solutions. The type of system that works best for an organization depends on factors like the market sector in which the business operates, the volume of daily transactions, and the effects of seasonal fluctuations on capacity demands.
The three major options available from public cloud service providers (CSPs) for businesses searching for optimal performance and availability are a bare metal solution, dedicated cloud hosts, or dedicated physical servers. While these alternatives may seem very similar, they are not the same and each presents advantages and disadvantages in certain usage scenarios.
In this article, we will break down the differences in these three solutions to help identify which one best suits your unique business requirements. Let’s start with a discussion of each hosting option to identify their strengths and potential weaknesses.
Dedicated Servers
A dedicated server is a remotely located physical server that does not employ virtualization technology. The server’s performance and storage capabilities are limited by the hardware and its associated infrastructure. Dedicated servers are single-tenant entities where the machine is not shared with other customers.
Dedicated servers do not have a hypervisor pre-installed and enable users to exert full control over how the server and its infrastructure are configured. This level of control allows customers to install any operating system they choose without relying on the selected offerings of a virtualized environment. Hardware and software resources can be optimized to manage specific workloads and large volumes of data.
Advantages of dedicated servers
Using dedicated servers provides these benefits:
Enhanced processing power suitable for substantial workloads.
Full control over the operating system and application software.
Consistent disk and network performance.
Users have root access to the server.
Improved quality of service by eliminating resource spikes.
Traditional billing plans for planning and budgeting.
Physical isolation (which can be important for security and regulatory compliance).
Disadvantages of dedicated servers
Some things to look out for when considering dedicated servers are:
More expensive than virtualized cloud hosting options.
There could be delays in provisioning given supply chain constraints.
Additional technical expertise is required by the customer.
Providers may use lesser-quality or outdated hardware.
Bare Metal Servers
Bare metal servers are dedicated servers that are delivered to a customer using a different method by their cloud provider. These servers are also sometimes referred to as managed dedicated servers. In some ways, bare metal servers can be seen as a hybrid between dedicated servers and cloud hosts.
As with dedicated servers, a bare metal server is not shared with multiple tenants. Its role is to run dedicated services for a single customer. Cloud vendors carefully select the components that go into their bare metal offerings, which typically results in enhanced performance and reliability. In some cases, customers can choose to deploy specific components that fit the machine’s intended workload. Reputable providers will optimize the server to address specific use cases and business requirements.
Bare metal servers can be rented on an hourly or monthly subscription basis from a cloud provider, eliminating concerns over a long-term commitment to a dedicated server solution. In this way, they are like inexpensive cloud hosting options but deliver greater control, performance, and flexibility.
Advantages of bare metal servers
Benefits of using bare metal dedicated servers include:
Enhanced processing power for data and processing-intensive workloads.
Faster provisioning when compared to dedicated servers.
Flexible hardware choices range from inexpensive to cutting-edge components.
Managed by the cloud service provider.
Users have root access to the server.
Full control over operating system and application software.
Consistent disk and network performance.
Flexible billing options that can result in substantial savings over dedicated servers.
Improved quality of service by the elimination of resource spikes.
Physical isolation for enhanced security and regulatory compliance.
Disadvantages of bare metal servers
Bare metal servers have similar disadvantages to dedicated servers including:
More expensive than dedicated servers of virtualized cloud hosting options.
Additional technical expertise is required by the customer.
Dedicated Cloud Hosts
A dedicated cloud host is a single-tenant cloud infrastructure that serves as an isolated public cloud. Dedicated clouds fall into the category of infrastructure as a service (IaaS) solution and provide organizations with flexibility and performance as well as features not found in dedicated and bare metal options.
This hosting model provides customers with a dedicated cloud node connected to the Internet. The customer has more control than in a shared cloud hosting environment and can deploy the provisioned resources however they see fit. Through vendor-supplied automation and software tools, the dedicated cloud host can be turned into multiple cloud servers.
Though the cloud host is dedicated to a single tenant, the underlying physical hardware is still shared with other customers. This implies that there are limitations regarding the scalability of the system which are dependent on resource availability. The isolated nature of a dedicated cloud host may be sufficient for addressing concerns over security and privacy as it pertains to regulatory compliance.
Advantages of dedicated cloud hosts
The benefits of going with a dedicated cloud hosting solution include:
Less expensive than dedicated or bare metal servers.
Quickly provisioned by a cloud provider.
Security and development tools are provided by the cloud vendor.
Flexible licensing terms are usually available.
Can be used to create multiple cloud servers.
Computing resources can be customized to meet business requirements.
Disadvantages of dedicated cloud hosts
Customers considering dedicated cloud hosts should keep these points in mind:
Potential resource limitations.
Lesser performance than bare metal or dedicated servers.
Choosing the Right Hosting Option for Your Business
The three dedicated hosting options we discussed all provide benefits and some disadvantages. They can all successfully address the web hosting needs of a business or organization under certain conditions. Answering the following questions should provide an indication of which choice is appropriate for your company.
What are the business uses of the website? - If your business does not need the higher performance of a dedicated or bare metal server, a dedicated cloud host can be an economical choice. On the other hand, if your business relies on the performance of mission-critical web applications, bare metal or dedicated servers should be strongly considered. The price difference will often be repaid with a more responsive and reliable website.
What are the vendor’s subscription options? - Most reputable cloud vendors offer various subscription plans tailored to the needs of their customers. If you need high performance for a limited time, a bare metal server might be a better choice than a dedicated server with a long-term contract.
What features are included? - The feature set available with different hosting options varies widely from vendor to vendor. Make sure the hosting option you select offers the features and flexibility your business requires.
Are there uptime and reliability guarantees? - Mission-critical websites need to be hosted by providers willing to enter into service level agreements (SLAs) that guarantee system performance and availability.
The answers to these questions should give you a good sense of which type of hosting option is best for your business. Don’t make a selection without considering if the alternatives can address your business objectives more effectively and efficiently.
Atlantic.Net can help!
If you are looking for a hosting solution but need assistance with choosing the right solution for your organization, please contact us today and we will be happy to design a customized solution for you.
### How to Monitor Node.js Applications Using PM2 Web Dashboard
Node.js is an open-source JavaScript runtime environment built on Chrome's V8. It is mainly used to execute JavaScript code outside a web browser. It uses an asynchronous, event-driven model, perfect for data-intensive applications.
After deploying a Node.js application, you may need a tool to monitor your application. This is where PM2 can help. PM2 is a popular process manager used for managing and monitoring Node.js applications. It allows you to monitor Node.js applications via CLI and a web-based dashboard.
In this post, we will show you how to install and use PM2 to monitor Node.js applications.
Step 1 - Install Nodejs
First, install the necessary dependencies using the following command.
apt-get install -y ca-certificates curl gnupg
Next, download the Node.js GPG key.
mkdir -p /etc/apt/keyrings
curl -fsSL https://deb.nodesource.com/gpgkey/nodesource-repo.gpg.key | gpg --dearmor -o /etc/apt/keyrings/nodesource.gpg
Next, add the NodeSource repo to the APT source list.
echo "deb [signed-by=/etc/apt/keyrings/nodesource.gpg] https://deb.nodesource.com/node_18.x nodistro main" | tee /etc/apt/sources.list.d/nodesource.list
Then, update the repository index and install the Ndoe.js with the following command.
apt update
apt-get install -y nodejs
Next, verify the Node.js version using the following command.
node -v
Output.
v18.19.0
Step 2 - Create a Simple Nodejs Application
Next, you will need a Node.js application that you want to monitor using PM2. First, create a directory for your application.
mkdir app
Next, create an application file.
cd app
nano app.js
Add the following code:
const http = require('http');
const hostname = 'localhost';
const port = 3000;
const server = http.createServer((req, res) => {
res.statusCode = 200;
res.setHeader('Content-Type', 'text/plain');
res.end('Your Nodejs App is Working!\n');
});
server.listen(port, hostname, () => {
console.log(`Server running at http://${hostname}:${port}/`);
});
Save and close the file when you are done.
Step 3 - Install and Use PM2 to Manage Nodejs Application
First, install PM2 using the following command.
npm install pm2 -g
Next, start the Node.js application using PM2.
pm2 start app.js
Output.
[PM2] Spawning PM2 daemon with pm2_home=/root/.pm2
[PM2] PM2 Successfully daemonized
[PM2] Starting /root/app/app.js in fork_mode (1 instance)
[PM2] Done.
┌────┬────────┬─────────────┬─────────┬─────────┬──────────┬────────┬──────┬───────────┬──────────┬──────────┬──────────┬──────────┐
│ id │ name │ namespace │ version │ mode │ pid │ uptime │ ↺ │ status │ cpu │ mem │ user │ watching │
├────┼────────┼─────────────┼─────────┼─────────┼──────────┼────────┼──────┼───────────┼──────────┼──────────┼──────────┼──────────┤
│ 0 │ app │ default │ N/A │ fork │ 55173 │ 0s │ 0 │ online │ 0% │ 33.0mb │ root │ disabled │
└────┴────────┴─────────────┴─────────┴─────────┴──────────┴────────┴──────┴───────────┴──────────┴──────────┴──────────┴──────────┘
You can now list your application using the following command.
pm2 list
Output
┌────┬────────┬─────────────┬─────────┬─────────┬──────────┬────────┬──────┬───────────┬──────────┬──────────┬──────────┬──────────┐
│ id │ name │ namespace │ version │ mode │ pid │ uptime │ ↺ │ status │ cpu │ mem │ user │ watching │
├────┼────────┼─────────────┼─────────┼─────────┼──────────┼────────┼──────┼───────────┼──────────┼──────────┼──────────┼──────────┤
│ 0 │ app │ default │ N/A │ fork │ 55173 │ 16s │ 0 │ online │ 0% │ 51.2mb │ root │ disabled │
└────┴────────┴─────────────┴─────────┴─────────┴──────────┴────────┴──────┴───────────┴──────────┴──────────┴──────────┴──────────┘
To stop and delete the application, run the following command.
pm2 stop app.js
pm2 delete app.js
To reload the application after making changes, run the following command.
pm2 reload app.js
To add the application at system startup, run the following command.
pm2 startup
To check the application log, run the following command.
pm2 logs
Output.
PM2 | 2023-07-30T10:23:06: PM2 log: BUS socket file : /root/.pm2/pub.sock
PM2 | 2023-07-30T10:23:06: PM2 log: Application log path : /root/.pm2/logs
PM2 | 2023-07-30T10:23:06: PM2 log: Worker Interval : 30000
PM2 | 2023-07-30T10:23:06: PM2 log: Process dump file : /root/.pm2/dump.pm2
PM2 | 2023-07-30T10:23:06: PM2 log: Concurrent actions : 2
PM2 | 2023-07-30T10:23:06: PM2 log: SIGTERM timeout : 1600
PM2 | 2023-07-30T10:23:06: PM2 log: ===============================================================================
PM2 | 2023-07-30T10:23:06: PM2 log: App [app:0] starting in -fork mode-
PM2 | 2023-07-30T10:23:06: PM2 log: App [app:0] online
PM2 | 2023-07-30T10:23:36: PM2 log: Process 0 in a stopped status, starting it
PM2 | 2023-07-30T10:23:36: PM2 log: Stopping app:app id:0
PM2 | 2023-07-30T10:23:36: PM2 log: App [app:0] exited with code [0] via signal [SIGINT]
PM2 | 2023-07-30T10:23:37: PM2 log: pid=55173 msg=process killed
PM2 | 2023-07-30T10:23:37: PM2 log: App [app:0] starting in -fork mode-
PM2 | 2023-07-30T10:23:37: PM2 log: App [app:0] online
/root/.pm2/logs/app-error.log last 15 lines:
/root/.pm2/logs/app-out.log last 15 lines:
0|app | Server running at http://localhost:3000/
Step 4 - Monitor Nodejs Application Using PM2 Dashboard
PM2 also provides a web-based dashboard that allows you to monitor and diagnose Node.js applications in real-time.
To use the PM2 dashboard, go to https://app.pm2.io, then sign up as shown in the following screenshot.
After the successful login, copy the pm2 link command from the above screenshot and run it on your server.
pm2 link 30ew4cpwzxopx3v tzc9tp9s2oc0wkf
You will see the following output:
[PM2 I/O] Using: Public key: tzc9tp9s2oc0wkf | Private key: 30ew4cpwzxopx3v | Machine name: fedora-e930
[+] PM2+ activated!
Now, refresh the PM2 dashboard page. You should see that your server is connected and showing a list of all your Nodejs applications in expanded mode.
Step 5 - Monitor Nodejs Using pm2-server-monit
You can also use the pm2-server-monit module to monitor your application's CPU, disk, and memory usage, network speed, and other key aspects of your server.
You can install the pm2-server-monit module with the following command.
pm2 install pm2-server-monit
Output:
⇆ PM2+ activated | Instance Name: fedora-e930 | Dash: https://app.pm2.io/#/r/tzc9tp9s2oc0wkf
┌────┬─────────────────────┬─────────────┬─────────┬─────────┬──────────┬────────┬──────┬───────────┬──────────┬──────────┬──────────┬──────────┐
│ id │ name │ namespace │ version │ mode │ pid │ uptime │ ↺ │ status │ cpu │ mem │ user │ watching │
├────┼─────────────────────┼─────────────┼─────────┼─────────┼──────────┼────────┼──────┼───────────┼──────────┼──────────┼──────────┼──────────┤
│ 0 │ app │ default │ N/A │ fork │ 55202 │ 5m │ 1 │ online │ 0% │ 52.4mb │ root │ disabled │
└────┴─────────────────────┴─────────────┴─────────┴─────────┴──────────┴────────┴──────┴───────────┴──────────┴──────────┴──────────┴──────────┘
Module
┌────┬──────────────────────────────┬───────────────┬──────────┬──────────┬──────┬──────────┬──────────┬──────────┐
│ id │ module │ version │ pid │ status │ ↺ │ cpu │ mem │ user │
├────┼──────────────────────────────┼───────────────┼──────────┼──────────┼──────┼──────────┼──────────┼──────────┤
│ 1 │ pm2-server-monit │ 3.0.0 │ 55367 │ online │ 0 │ 0% │ 26.9mb │ root │
└────┴──────────────────────────────┴───────────────┴──────────┴──────────┴──────┴──────────┴──────────┴──────────┘
Once installed, go back to your PM2 dashboard. You should see your server's key metrics on the following screen.
If you want to remove your server from the PM2 dashboard, run the following command:
pm2 unlink
Output:
[PM2 I/O] Permanently disable agent...
[PM2 I/O] Agent interaction ended
Conclusion
In this post, we showed you how to install Node.js, create a Node.js application and then manage it via the command line. Then, we explained how to install the PM2 dashboard and monitor your application via a web-based dashboard. You can now deploy the Node.js application on virtual private server hosting from Atlantic.Net! and start monitoring it using the PM2 dashboard.
### On the FDIC Response to the Silicon Valley Banking Crisis: They Hurt the Wrong People
You can learn a lot by simple observation. Last week, there was a brouhaha as several banks nearly collapsed, and then some did. The usual discourse will be set with educated people explaining how something was right, wrong, or neither. A joint statement by the FDIC, the Federal Reserve, and the United States Treasury affirmed their resolve to protect the system. While most coverage will try to confuse you with a labyrinth of econobabble whose goal is to convince you that it's too complex and you can't understand it, the reality is quite simple. In their attempt to hurt the right people, they accidentally hurt the wrong people.
How Did This Happen?
First, we must examine how we arrived here. In the post-2008 financial crisis, the economy was in rough shape. Simply put, there were too few jobs/businesses and too many workers. To solve that, the government decided to flood the markets with "easy money," lending below the inflation rate, which led to a torrent of economic activity that would absorb the jobless.
This created the cancer capitalists that built companies that never made money but soared in value as their businesses (and losses) grew. The money to be made was not in profit but in the shares they could sell of companies highly valued on their ever-growing promises of dominance in the future.
Who doesn't want to be in early for the next Google or Facebook? It would be great! Because these companies didn't need to make money, they could be very inefficient in almost every facet. In fact, to maximize valuation, you needed to overpay and over-hire. Why wouldn't you if you would dominate the on-demand dog-washing market? Are you going to be the market leader or not? Go big or go home!
This coalesced nicely with government policy — it absorbed workers into the market, and they got paid an above-market rate. It was a win/win except for legacy companies that made money or were good at getting good returns on their investments. Those legacy companies didn't help solve the problem; they were efficient, which was the problem.
The new companies were the ones that would freely spend more on just sales and marketing than they brought in revenue, not the old guard. These companies were very inefficient, which made them fabulous (at least to the government). Sure, people were getting fabulously wealthy on questionable investing principles, but that was a small price to pay because it solved the problem of the greater good — we had enough "startups" to absorb the unemployed. People were attached to society, and all was good. People could complain about politics, taxes, or whatever while subscribing to environmentally sustainable seasonal doormats from hot startups. Life went on.
Pandemic Stimulus
Then came the pandemic, which led to massive stimulus to avert a massive depression, which swung things the other way. We made a society with too many businesses and not enough workers. Simple enough! We'll tighten things up. We don't really need fake companies anymore. After all, there need to be more workers for the real economy now.
Think of it like a balloon; government policy inflated it (through free money programs), and now it intended to do the opposite, deflating it, which would re-balance the economy. This controlled demolition was coordinated by the brightest policymakers in the land to hurt people who work for a living so that they would be in the office at 9 am instead of hot yoga classes.
Unfortunately, the government can't control how things deflate exactly. The most fragile parts will break first if you put enough strain on any system. If you put enough weight on your body, your weakest joints will eventually snap first. It is expected! Instead of having the ordinary workers of society "deflate" in an orderly manner, the weakest "joint" turned out to be the newly rich and their risky investments. Imagine how frustrating it is for policymakers when the nouveau rich, who skimmed money from society by creating fake companies for a phony economy, are getting pulverized while the working class still had good jobs and long waits Friday night at Olive Garden. After all, who has more than $250,000 in cash in a bank account? Who needed saving? Not the average Joe or Jane.
At this point, it is essential to understand why hurting the wrong people means it will hurt more when they hurt the right people. Imagine there are 5 friends, with 1 person (call him "Rich") having $20, and everyone else has $5. The government, learning from the 2008 crisis that they a) went too slow and b) too small on stimulus, decides to do the opposite, so the crisis this time is abbreviated. They create free money programs that double everyone's savings. Now Rich has $40, and his four friends have $10. Net-net, everyone is $40 "wealthier" (Rich has $20 extra, and the four friends have $20 extra combined). Everyone feels so good they buy a big drink and popcorn combo when they go to the movies. Now the economy has become hot (because everyone feels too good), and you have runaway inflation, angering everyone.
Handling Inflation
Something must be done. Easy! We'll reverse the free money programs by raising interest rates and making things more challenging. Unfortunately, Rich, being rich, has his money in with all the other rich people doing rich people's stuff. Even more unfortunate because government policy is disproportionately whooshing away the stuff rich people have (because it's the highest beta or moves the most relative to the real economy, like startup investments). Rich's bank is now collapsing. The bank only has government guarantees for $20, so Rich is out $20. Excellent! It is working; over time, Rich's friend's assets will deflate (but slower because they aren't in as sophisticated investment vehicles that can lose money quickly). Then, life can return to normal.
Oops! Rich wasn't the one who the government wanted to hurt. They had hurt the wrong person. Something must be done! Quick, we'll coordinate at the highest levels of government. We'll bail out Rich, but we won't call it a bailout. We'll say we're protecting the people we are trying to hurt by keeping Rich, rich. We'll say it's to save the payrolls of small businesses. Who could be against that? So, Rich...well, he gets to stay rich. He receives the gains of the stimulus but none of the losses. However, the government still has an overarching problem they are trying to solve there is still too much money. They are still trying to remove the $40 they created. Rich being rich is now "systemically important," so he must stay richer. The losses must come from somewhere else.
The Problem with the Plan
And that is where the plan delivers the chef's kiss — they will hurt the people they want to hurt even more. Instead of Rich's friends, each losing $5 to get things back to where they were, they each have to lose $5 plus the amount Rich should have lost ($20), so the friends each have to lose an additional $5, leaving them broke. So, we're left with rich Rich, who has $40 and laments to his broke friends; I wish you worked harder to vacation in the south of France with me, but you can't. Try harder!
The real lesson is that it's simple. We can learn what's going on through simple observation. Clearly, the government is trying to slow the economy to dampen inflation and return the world to normal. When they hurt the right people, like in 2008 when people lost their homes, assets, and livelihood - it made sense because it was "free markets" and "capitalism." However, when they hurt the wrong people (like the banks, the rich, or the politically connected), protecting them is deemed "systemically important" because we are really saving everyday people's jobs. The problem is that when they hurt the right people, there won't be any help. There will be free markets. Pull yourself up by your bootstraps. When that happens, we'll know they are hurting the right people.
There is a firehose of opinions you can listen to that will opine on what happened last week. Of course, you will be implored to believe that the issues are too complex and sophisticated to understand the grift. But just by simple observation, you can distill it to what it really is. They hurt the wrong people. This also means it will be much worse for those they plan to hurt when they hurt the right people.
This is an opinion piece.
### How to Install Angular on Arch Linux
Angular is a component-based framework used for building single-page client applications using HTML and TypeScript. Supported by Google, it is the perfect framework for building large-scale, powerful, and easy-to-serve web apps. It is cross-platform and offers a wide range of features and benefits, including reduced development time, unit test friendliness, and more.
In this post, we will show you how to install Angular on Arch Linux.
Step 1 - Configure Repository
By default, the default repository is outdated in Arch Linux, so you will need to modify the default mirror list. You can do it by editing the mirror list configuration file:
nano /etc/pacman.d/mirrorlist
Remove all lines and add the following lines:
## Score: 0.7, United States
Server = http://mirror.us.leaseweb.net/archlinux/$repo/os/$arch
## Score: 0.8, United States
Server = http://lug.mtu.edu/archlinux/$repo/os/$arch
Server = http://mirror.nl.leaseweb.net/archlinux/$repo/os/$arch
## Score: 0.9, United Kingdom
Server = http://mirror.bytemark.co.uk/archlinux/$repo/os/$arch
## Score: 1.5, United Kingdom
Server = http://mirrors.manchester.m247.com/arch-linux/$repo/os/$arch
Server = http://archlinux.dcc.fc.up.pt/$repo/os/$arch
## Score: 6.6, United States
Server = http://mirror.cs.pitt.edu/archlinux/$repo/os/$arch
## Score: 6.7, United States
Server = http://mirrors.acm.wpi.edu/archlinux/$repo/os/$arch
## Score: 6.8, United States
Server = http://ftp.osuosl.org/pub/archlinux/$repo/os/$arch
## Score: 7.1, India
Server = http://mirror.cse.iitk.ac.in/archlinux/$repo/os/$arch
## Score: 10.1, United States
Server = http://mirrors.xmission.com/archlinux/$repo/os/$arch
Save and close the file, then update all the package indexes with the following command:
pacman -Syu
Step 2 - Install Node JS and NPM
First, download and run the following script to install NVM on your system.
curl -o- https://raw.githubusercontent.com/nvm-sh/nvm/v0.39.2/install.sh | bash
You will get the following output.
export NVM_DIR="$HOME/.nvm"
[ -s "$NVM_DIR/nvm.sh" ] && \. "$NVM_DIR/nvm.sh" # This loads nvm
=> Close and reopen your terminal to start using nvm or run the following to use it now:
Next, activate the NVM environment variable using the following command.
export NVM_DIR="$HOME/.nvm"
[ -s "$NVM_DIR/nvm.sh" ] && \. "$NVM_DIR/nvm.sh" # This loads nvm
Next, check the NVM version with the following command.
nvm --version
Output.
0.39.2
Next, install the latest version of Node JS using the following command.
nvm install --lts
You will get the following output.
Installing latest LTS version.
Downloading and installing node v18.14.2...
Downloading https://nodejs.org/dist/v18.14.2/node-v18.14.2-linux-x64.tar.xz...
####################################################################################################################################### 100.0%
Computing checksum with sha256sum
Checksums matched!
Now using node v18.14.2 (npm v9.5.0)
Creating default alias: default -> lts/* (-> v18.14.2)
To verify the Node JS version, run the following command.
node --version
Output.
v18.14.2
Step 3 - Install Angular CLI
Angular provides a CLI tool used to install and manage Angular applications via the command line interface.
First, install Angular CLI with the following command.
npm install -g @angular/cli
After the installation, you can verify the Angular version with the following command.
ng version
You should see the following output.
Thank you for sharing pseudonymous usage data. Should you change your mind, the following
command will disable this feature entirely:
ng analytics disable --global
Global setting: enabled
Local setting: No local workspace configuration file.
Effective status: enabled
_ _ ____ _ ___
/ \ _ __ __ _ _ _| | __ _ _ __ / ___| | |_ _|
/ △ \ | '_ \ / _` | | | | |/ _` | '__| | | | | | |
/ ___ \| | | | (_| | |_| | | (_| | | | |___| |___ | |
/_/ \_\_| |_|\__, |\__,_|_|\__,_|_| \____|_____|___|
|___/
Angular CLI: 15.2.1
Node: 18.14.2
Package Manager: npm 9.5.0
OS: linux x64
Angular:
...
Package Version
------------------------------------------------------
@angular-devkit/architect 0.1502.1 (cli-only)
@angular-devkit/core 15.2.1 (cli-only)
@angular-devkit/schematics 15.2.1 (cli-only)
@schematics/angular 15.2.1 (cli-only)
Step 4 - Create an Angular Application
First, install the Git package using the following command.
pacman -S git
Next, create a new Angular application using the following command.
ng new myapp
Once the application is created, you will get the following output.
? Would you like to add Angular routing? No
? Which stylesheet format would you like to use? CSS
CREATE myapp/README.md (1059 bytes)
CREATE myapp/.editorconfig (274 bytes)
CREATE myapp/.gitignore (548 bytes)
CREATE myapp/angular.json (2695 bytes)
CREATE myapp/package.json (1036 bytes)
CREATE myapp/tsconfig.json (901 bytes)
CREATE myapp/tsconfig.app.json (263 bytes)
CREATE myapp/tsconfig.spec.json (273 bytes)
CREATE myapp/.vscode/extensions.json (130 bytes)
CREATE myapp/.vscode/launch.json (474 bytes)
CREATE myapp/.vscode/tasks.json (938 bytes)
CREATE myapp/src/favicon.ico (948 bytes)
CREATE myapp/src/index.html (291 bytes)
CREATE myapp/src/main.ts (214 bytes)
CREATE myapp/src/styles.css (80 bytes)
CREATE myapp/src/assets/.gitkeep (0 bytes)
CREATE myapp/src/app/app.module.ts (314 bytes)
CREATE myapp/src/app/app.component.css (0 bytes)
CREATE myapp/src/app/app.component.html (23083 bytes)
CREATE myapp/src/app/app.component.spec.ts (953 bytes)
CREATE myapp/src/app/app.component.ts (209 bytes)
✔ Packages installed successfully.
Next, navigate to the myapp directory and run the application using the following command.
cd myapp
ng serve --host 0.0.0.0 --port 8080
Once the application started successfully, you should see the following output.
✔ Browser application bundle generation complete.
Initial Chunk Files | Names | Raw Size
vendor.js | vendor | 1.71 MB |
polyfills.js | polyfills | 314.26 kB |
styles.css, styles.js | styles | 209.39 kB |
main.js | main | 45.98 kB |
runtime.js | runtime | 6.51 kB |
| Initial Total | 2.28 MB
Build at: 2023-03-03T15:38:15.307Z - Hash: 70299a3e44f1744b - Time: 12653ms
** Angular Live Development Server is listening on 0.0.0.0:8080, open your browser on http://localhost:8080/ **
✔ Compiled successfully.
Step 5 - Access Angular Application
At this point, Angular is installed on your server. Now, it's time to access it via a web browser. Open your web browser and access the Angular web interface using the URL http://your-server-ip:8080. You should see the Angular page on the following screen.
Conclusion
In this tutorial, we explained how to install Angular on Arch Linux. We also create a sample Angular app and test it via a web browser. You can now start creating and deploying your own Angular application on the production server. Try Angular on dedicated server hosting from Atlantic.Net!
### How to Install MediaWiki on Arch Linux
MediaWiki is a free and open-source wiki software tool used to build Wikipedia-like websites. It is written in PHP and allows for data to be written to a read-write database and read from read-only databases. It is used by students, teachers, and businesses to create materials, resources, and instructional presentations. It comes with a user-friendly web interface that helps you to add and edit wiki content, creating a group-moderated website.
In this post, we will show you how to install MediaWiki on Arch Linux.
Step 1 - Configure Repository
By default, the default repository is outdated in Arch Linux, so you will need to modify the default mirror list. You can do it by editing the mirror list configuration file:
nano /etc/pacman.d/mirrorlist
Remove all lines and add the following lines:
## Score: 0.7, United States
Server = http://mirror.us.leaseweb.net/archlinux/$repo/os/$arch
## Score: 0.8, United States
Server = http://lug.mtu.edu/archlinux/$repo/os/$arch
Server = http://mirror.nl.leaseweb.net/archlinux/$repo/os/$arch
## Score: 0.9, United Kingdom
Server = http://mirror.bytemark.co.uk/archlinux/$repo/os/$arch
## Score: 1.5, United Kingdom
Server = http://mirrors.manchester.m247.com/arch-linux/$repo/os/$arch
Server = http://archlinux.dcc.fc.up.pt/$repo/os/$arch
## Score: 6.6, United States
Server = http://mirror.cs.pitt.edu/archlinux/$repo/os/$arch
## Score: 6.7, United States
Server = http://mirrors.acm.wpi.edu/archlinux/$repo/os/$arch
## Score: 6.8, United States
Server = http://ftp.osuosl.org/pub/archlinux/$repo/os/$arch
## Score: 7.1, India
Server = http://mirror.cse.iitk.ac.in/archlinux/$repo/os/$arch
## Score: 10.1, United States
Server = http://mirrors.xmission.com/archlinux/$repo/os/$arch
Save and close the file, then update all the package indexes with the following command:
pacman -Syu
Step 2 - Install Nginx
By default, the Nginx package is included in the Arch Linux default repository. You can install it with the following command.
pacman -S nginx-mainline
After installing the Nginx, start and enable the Nginx service using the following command.
systemctl start nginx
systemctl enable nginx
Step 3 - Install and Configure PHP
MediaWiki is a PHP-based application, so you will also need to install PHP and other extensions to your server. You can install all of them using the following command.
pacman -S php php-fpm php-gd unzip
Next, edit the PHP configuration file and enable all the required PHP extensions.
nano /etc/php/php.ini
Add / Modify the following lines:
memory_limit = 512M
post_max_size =32M
upload_max_filesize = 32M
date.timezone = Asia/Kolkata
extension=gd
extension=json
extension=xml
extension=ldap
extension=mysqli
extension=imagemagick
extension=curl
extension=intl
extension=iconv
Save and close the file, then start the PHP-FPM service and enable it to start at system reboot.
systemctl start php-fpm
systemctl enable php-fpm
Step 4 - Install and Configure MariaDB Database
First, install MariaDB with the following command.
pacman -S mariadb
Once the MariaDB server is installed, initialize the MariaDB database with the following command.
mysql_install_db --user=mysql --basedir=/usr --datadir=/var/lib/mysql
Next, start and enable the MariaDB service using the following command.
systemctl start mysqld
systemctl enable mysqld
Next, connect to the MariaDB shell:
mysql
Next, create a database and user using the following command.
CREATE DATABASE mediawiki;
GRANT ALL ON mediawiki.* TO mediawiki@localhost IDENTIFIED BY 'securepassword';
Next, flush the privileges and exit from the MariaDB shell with the following command.
FLUSH PRIVILEGES;
EXIT;
Step 5 - Download Mediawiki
First, download the latest version of MediaWiki from their official download page using the following command.
wget https://releases.wikimedia.org/mediawiki/1.39/mediawiki-1.39.2.zip
Once the download is finished, extract the downloaded file with the following command.
unzip mediawiki-1.39.2.zip
Next, create an Nginx web root directory and move Mediawiki inside the Nginx web root.
mkdir -p /var/www/html/
mv mediawiki-1.39.2 /var/www/html/mediawiki
Next, change the ownership of the Mediawiki directory.
chown -R http:http /var/www/html/mediawiki/
Step 6 - Configure Nginx for Mediawiki
Next, you will need to create an Nginx virtual host configuration file to serve Mediawiki.
First, create a directory to store Nginx virtual host.
mkdir /etc/nginx/sites-enabled
Next, create an Nginx configuration file for MediaWiki.
nano /etc/nginx/sites-enabled/mediawiki.conf
Add the following configurations.
server {
listen 80;
server_name mediawiki.example.com;
root /var/www/html/mediawiki;
index index.php;
error_log /var/log/nginx/mediawiki.error;
access_log /var/log/nginx/mediawiki.access;
location / {
try_files $uri $uri/ /index.php;
}
location ~ /\.ht {
deny all;
}
location ~ \.php$ {
fastcgi_pass unix:/var/run/php-fpm/php-fpm.sock;
fastcgi_param SCRIPT_FILENAME $document_root$fastcgi_script_name;
include fastcgi_params;
}
}
Save the file, then edit the Nginx main configuration file.
nano /etc/nginx/nginx.conf
Add the following lines after http{:
server_names_hash_bucket_size 64;
include sites-enabled/*;
Save the file when you are done. Then, verify the Nginx configuration.
nginx -t
You will see the following output.
nginx: the configuration file /etc/nginx/nginx.conf syntax is ok
nginx: configuration file /etc/nginx/nginx.conf test is successful
Next, restart the Nginx service to implement the changes.
systemctl restart nginx
Step 7 - Perform Mediawiki Web Installation
Now, open your web browser and access Mediawiki using the URL http://mediawiki.example.com/. You should see the following screen.
Click on the Set up the wiki. You should see the language selection screen.
Select your language and click on the Continue button. You should see the terms of service page.
Read the term of service and click on the Continue button. You should see the database settings page.
Define your database settings and click on the Continue button. You should see the following page.
Click on the Continue button. You should see the Mediawiki site configuration page:
Define your site name, admin username, and password, and click on the Continue button. You should see the following page:
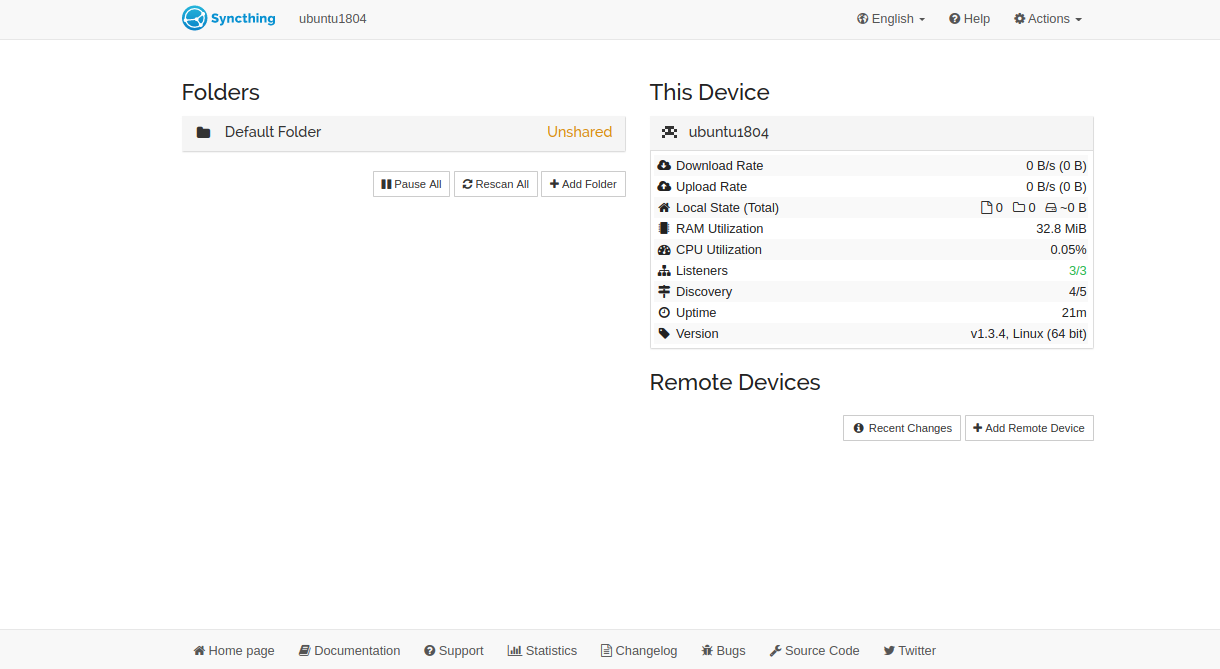
Click on the Continue button. Once the installation has been finished, you should see the following page.
Click on the enter your wiki. You should see your Mediawiki dashboard on the following screen.
Conclusion
Congratulations! You have successfully installed Mediawiki with Nginx on Arch Linux. You can now start deploying your own Wiki website using MediaWiki. You can also try Mediawiki on dedicated server hosting from Atlantic.Net!
### How to Install DokuWiki on Arch Linux
DokuWiki is a free and open-source Wiki software tool written in PHP language. It does not require any database to store its content. It is highly versatile and has a clean and readable syntax. It allows users to create, edit and delete web pages via a web-based dashboard. DokuWiki has built-in authentication extensions that allow users to store user IDs and passwords using various methods.
In this post, we will show you how to install DokuWiki on Arch Linux.
Step 1 - Configure Repository
By default, the default repository is outdated in Arch Linux, so you will need to modify the default mirror list. You can do it by editing the mirror list configuration file:
nano /etc/pacman.d/mirrorlist
Remove all lines and add the following lines:
## Score: 0.7, United States
Server = http://mirror.us.leaseweb.net/archlinux/$repo/os/$arch
## Score: 0.8, United States
Server = http://lug.mtu.edu/archlinux/$repo/os/$arch
Server = http://mirror.nl.leaseweb.net/archlinux/$repo/os/$arch
## Score: 0.9, United Kingdom
Server = http://mirror.bytemark.co.uk/archlinux/$repo/os/$arch
## Score: 1.5, United Kingdom
Server = http://mirrors.manchester.m247.com/arch-linux/$repo/os/$arch
Server = http://archlinux.dcc.fc.up.pt/$repo/os/$arch
## Score: 6.6, United States
Server = http://mirror.cs.pitt.edu/archlinux/$repo/os/$arch
## Score: 6.7, United States
Server = http://mirrors.acm.wpi.edu/archlinux/$repo/os/$arch
## Score: 6.8, United States
Server = http://ftp.osuosl.org/pub/archlinux/$repo/os/$arch
## Score: 7.1, India
Server = http://mirror.cse.iitk.ac.in/archlinux/$repo/os/$arch
## Score: 10.1, United States
Server = http://mirrors.xmission.com/archlinux/$repo/os/$arch
Save and close the file, then update all the package indexes with the following command:
pacman -Syu
Step 2 - Install Nginx
First, you will need to install the Nginx web server on your system. You can install it with the following command.
pacman -S nginx-mainline
Next, start and enable the Nginx service with the following command.
systemctl start nginx
systemctl enable nginx
Step 3 - Install and Configure PHP
First, install the PHP and other PHP extensions using the following command.
pacman -S php php-fpm php-gd
After successful installation, edit the PHP configuration file.
nano /etc/php/php.ini
Add/modify the following lines:
extension=gd
extension=json
extension=xml
extension=ldap
extension=mysqli
Save and close the file, then start the PHP-FPM service and enable it to start at system reboot.
systemctl start php-fpm
systemctl enable php-fpm
Step 4 - Install DokuWiki
First, download the latest version of DokuWiki from their official download page.
wget https://download.dokuwiki.org/src/dokuwiki/dokuwiki-stable.tgz
Once the download is completed, create a directory for DokuWiki and extract the downloaded file.
mkdir -p /var/www/html/dokuwiki
tar xzf dokuwiki-stable.tgz -C /var/www/html/dokuwiki/ --strip-components=1
Next, change the ownership of the DokuWiki directory.
chown -R http:http /var/www/html/dokuwiki/
Step 5 - Configure Nginx for DokuWiki
First, create a directory to store Nginx virtual host.
mkdir /etc/nginx/sites-enabled
Next, create an Nginx configuration file for DokuWiki.
nano /etc/nginx/sites-enabled/dokuwiki.conf
Add the following configurations.
server {
server_name dokuwiki.example.com;
root /var/www/html/dokuwiki;
location / {
index doku.php;
try_files $uri $uri/ @dokuwiki;
}
location ~ ^/lib.*\.(gif|png|ico|jpg)$ {
expires 30d;
}
location ^~ /conf/ { return 403; }
location ^~ /data/ { return 403; }
location @dokuwiki {
rewrite ^/_media/(.*) /lib/exe/fetch.php?media=$1 last;
rewrite ^/_detail/(.*) /lib/exe/detail.php?media=$1 last;
rewrite ^/_export/([^/]+)/(.*) /doku.php?do=export_$1&id=$2 last;
rewrite ^/(.*) /doku.php?id=$1 last;
}
location ~ \.php$ {
fastcgi_split_path_info ^(.+\.php)(/.+)$;
fastcgi_pass unix:/var/run/php-fpm/php-fpm.sock;
fastcgi_index index.php;
include fastcgi_params;
fastcgi_param SCRIPT_FILENAME $document_root$fastcgi_script_name;
fastcgi_intercept_errors off;
fastcgi_buffer_size 16k;
fastcgi_buffers 4 16k;
}
}
Save the file, then edit the Nginx main configuration file.
nano /etc/nginx/nginx.conf
Add the following lines after http{:
server_names_hash_bucket_size 64;
include sites-enabled/*;
Save the file, then verify the Nginx configuration.
nginx -t
You will get the following output.
nginx: the configuration file /etc/nginx/nginx.conf syntax is ok
nginx: configuration file /etc/nginx/nginx.conf test is successful
Finally, restart the Nginx service to apply the changes.
systemctl restart nginx
Step 6 - Access DokuWiki
Now, open your web browser and access the DokuWiki using the URL https://dokuwiki.example.com/install.php. You should see the following screen.
Provide all necessary information and click on the Save button to save the information. You should see the DokuWiki dashboard on the following screen.
You will also need to remove the install.php file from your server.
rm -f /var/www/html/dokuwiki/install.php
Conclusion
Congratulations! You have successfully installed DokuWiki with Nginx on Arch Linux. You can now deploy your own Wiki website using DokuWiki. You can now install DokuWiki on dedicated server hosting from Atlantic.Net!
### How to Install phpBB on Arch Linux
phpBB is a free, open-source, and flat-forum bulletin board software written in PHP scripting language. It is also known as a "PHP Bulletin Board" and is used to create a discussion forum where people can post topics and other people can reply to those topics. Compared to other forum software, phpBB is a popular and widely used open-source forum script found all over the web.
In this post, we will explain how to install the phpBB forum on Arch Linux.
Step 1 - Configure Repository
By default, the default repository is outdated in Arch Linux, so you will need to modify the default mirror list. You can do it by editing the mirror list configuration file:
nano /etc/pacman.d/mirrorlist
Remove all lines and add the following lines:
## Score: 0.7, United States
Server = http://mirror.us.leaseweb.net/archlinux/$repo/os/$arch
## Score: 0.8, United States
Server = http://lug.mtu.edu/archlinux/$repo/os/$arch
Server = http://mirror.nl.leaseweb.net/archlinux/$repo/os/$arch
## Score: 0.9, United Kingdom
Server = http://mirror.bytemark.co.uk/archlinux/$repo/os/$arch
## Score: 1.5, United Kingdom
Server = http://mirrors.manchester.m247.com/arch-linux/$repo/os/$arch
Server = http://archlinux.dcc.fc.up.pt/$repo/os/$arch
## Score: 6.6, United States
Server = http://mirror.cs.pitt.edu/archlinux/$repo/os/$arch
## Score: 6.7, United States
Server = http://mirrors.acm.wpi.edu/archlinux/$repo/os/$arch
## Score: 6.8, United States
Server = http://ftp.osuosl.org/pub/archlinux/$repo/os/$arch
## Score: 7.1, India
Server = http://mirror.cse.iitk.ac.in/archlinux/$repo/os/$arch
## Score: 10.1, United States
Server = http://mirrors.xmission.com/archlinux/$repo/os/$arch
Save and close the file, then update all the package indexes with the following command:
pacman -Syu
Step 2 - Install Nginx Web Server
phpBB requires a web server to be installed on your server. If not installed, you can install Nginx with the following command.
pacman -S nginx-mainline
Next, start and enable the Nginx service with the following command.
systemctl start nginx
systemctl enable nginx
Step 3 - Install and Configure PHP
First, install the PHP, PHP-FPM, and other PHP extensions using the following command.
pacman -S php php-fpm php-gd unzip
After the successful installation, edit the PHP configuration file and change the necessary settings.
nano /etc/php/php.ini
Add/modify the following lines:
memory_limit = 512M
post_max_size =32M
upload_max_filesize = 32M
date.timezone = Asia/Kolkata
extension=gd
extension=json
extension=xml
extension=ldap
extension=mysqli
extension=imagemagick
extension=curl
extension=intl
Save and close the file, then start the PHP-FPM service and enable it to start at system reboot.
systemctl start php-fpm
systemctl enable php-fpm
Step 4 - Create a Database for phpBB
phpBB uses MariaDB as a database backend, so you will need to install MariaDB on your server.
pacman -S mariadb
After installing the MariaDB server, initialize the MariaDB database with the following command.
mysql_install_db --user=mysql --basedir=/usr --datadir=/var/lib/mysql
Next, start the MariaDB service and enable it to start at system reboot.
systemctl start mysqld
systemctl enable mysqld
Next, log into the MariaDB shell with the following command.
mysql
Next, create a database and user for phpBB using the following command.
CREATE DATABASE phpbb;
GRANT ALL ON phpbb.* TO phpbb@localhost IDENTIFIED BY 'securepassword';
Next, flush the privileges and exit from the MariaDB shell with the following command.
FLUSH PRIVILEGES;
EXIT;
Step 5 - Download phpBB
First, download the latest version of phpBB from their official download page.
wget https://download.phpbb.com/pub/release/3.3/3.3.10/phpBB-3.3.10.zip
Once the download is completed, unzip the downloaded file with the following command.
unzip phpBB-3.3.10.zip
Next, create a directory for phpBB and move the phpBB to this directory.
mkdir -p /var/www/html/
mv phpBB3 /var/www/html/phpbb
Next, change the ownership of the phpBB directory.
chown -R http:http /var/www/html/phpbb/
Step 6 - Create an Nginx Virtual Host for phpBB
Next, you will need to create an Nginx virtual host configuration file to host phpBB on Nginx.
First, create a directory to store Nginx virtual host.
mkdir /etc/nginx/sites-enabled
Next, create an Nginx configuration file for phpBB.
nano /etc/nginx/sites-enabled/phpbb.conf
Add the following configurations.
server {
listen 80;
server_name phpbb.example.com;
root /var/www/html/phpbb;
index index.php index.html index.htm;
error_log /var/log/nginx/example.com.error.log warn;
access_log /var/log/nginx/example.com.access.log;
location / {
try_files $uri $uri/ @rewriteapp;
# Pass the php scripts to FastCGI server specified in upstream declaration.
location ~ \.php(/|$) {
include fastcgi.conf;
fastcgi_split_path_info ^(.+\.php)(/.*)$;
fastcgi_param PATH_INFO $fastcgi_path_info;
fastcgi_param SCRIPT_FILENAME $realpath_root$fastcgi_script_name;
fastcgi_param DOCUMENT_ROOT $realpath_root;
try_files $uri $uri/ /app.php$is_args$args;
fastcgi_pass unix:/var/run/php-fpm/php-fpm.sock;
}
# Deny access to internal phpbb files.
location ~ /(config\.php|common\.php|cache|files|images/avatars/upload|includes|(?
ServerAdmin admin@example.com
DocumentRoot "/srv/http/craft/web"
ServerName craft.example.com
DirectoryIndex index.php
Options Indexes FollowSymLinks
AllowOverride All
Require all granted
ErrorLog /var/log/httpd/error.log
CustomLog /var/log/httpd/access.log combined
Next, edit the Apache main configuration file.
nano /etc/httpd/conf/httpd.conf
Uncomment the following line:
Include conf/extra/httpd-vhosts.conf
LoadModule mpm_prefork_module modules/mod_mpm_prefork.so
LoadModule rewrite_module modules/mod_rewrite.so
Comment the following line:
#LoadModule mpm_event_module modules/mod_mpm_event.so
Add the following lines:
LoadModule php_module modules/libphp.so
AddHandler php-script .php
Include conf/extra/php_module.conf
Include conf/extra/craft.conf
Save and close the file. Next, restart the Apache service to apply the changes:
systemctl restart httpd
Step 6 - Access Craft CMS
Now, open your web browser and access the Craft CMS admin page using the URL http://craft.example.com/admin/login. You should see the Craft CMS login page.
Provide your admin user name and password and click on the Sign in button. You should see the Craft CMS dashboard on the following page.
Conclusion
Congratulations! You have successfully installed Craft CMS on Arch Linux. You have now enough knowledge to host your own website with Craft CMS. You can now try Craft CMS on one of our dedicated server hosting plans from Atlantic.Net!
### How to Install Backdrop CMS on Arch Linux
Backdrop is a simple, lightweight, and powerful content management system used for building professional websites. It is written in PHP and is a fork of the Drupal project. It offers a simple and user-friendly web UI where users can create web pages easily. If you are looking for a simple and powerful CMS, then Backdrop CMS is the right choice for you.
In this post, we will show you how to install Backdrop CMS on Arch Linux.
Step 1 - Configure Repository
By default, the default repository is outdated in Arch Linux, so you will need to modify the default mirror list. You can do it by editing the mirror list configuration file:
nano /etc/pacman.d/mirrorlist
Remove all lines and add the following lines:
## Score: 0.7, United States
Server = http://mirror.us.leaseweb.net/archlinux/$repo/os/$arch
## Score: 0.8, United States
Server = http://lug.mtu.edu/archlinux/$repo/os/$arch
Server = http://mirror.nl.leaseweb.net/archlinux/$repo/os/$arch
## Score: 0.9, United Kingdom
Server = http://mirror.bytemark.co.uk/archlinux/$repo/os/$arch
## Score: 1.5, United Kingdom
Server = http://mirrors.manchester.m247.com/arch-linux/$repo/os/$arch
Server = http://archlinux.dcc.fc.up.pt/$repo/os/$arch
## Score: 6.6, United States
Server = http://mirror.cs.pitt.edu/archlinux/$repo/os/$arch
## Score: 6.7, United States
Server = http://mirrors.acm.wpi.edu/archlinux/$repo/os/$arch
## Score: 6.8, United States
Server = http://ftp.osuosl.org/pub/archlinux/$repo/os/$arch
## Score: 7.1, India
Server = http://mirror.cse.iitk.ac.in/archlinux/$repo/os/$arch
## Score: 10.1, United States
Server = http://mirrors.xmission.com/archlinux/$repo/os/$arch
Save and close the file, then update all the package indexes with the following command:
pacman -Syu
Step 2 - Install Apache and PHP
First, install the Apache web server with the following command:
pacman -Sy apache
After the successful installation, start and enable the Apache service with the following command:
systemctl start httpd
systemctl enable httpd
Next, install the PHP and other required extensions using the following command:
pacman -Sy php php-gd php-cgi php-intl php-apache unzip
After the installation, edit the PHP configuration file and enable the required extensions:
nano /etc/php/php.ini
Add/modify the following lines:
extension=pdo_mysql
extension=gd
extension=json
extension=mysqli
extension=intl
extension=xml
Save and close the file when you are finished.
Step 3 - Install and Configure MariaDB Database
First, install the MariaDB server with the following command:
pacman -S libmariadbclient mariadb mariadb-clients
Next, initialize the MariaDB database with the following command:
mysql_install_db --user=mysql --basedir=/usr --datadir=/var/lib/mysql
Next, start and enable the MariaDB service with the following command:
systemctl start mysqld
systemctl enable mysqld
Next, connect to the MariaDB console using the following command:
mysql
Once you are connected, create a database and user for Backdrop:
CREATE DATABASE backdrop;
GRANT ALL ON backdrop.* TO backdrop@localhost IDENTIFIED BY 'password';
Next, flush the privileges and exit from the MariaDB shell with the following command:
FLUSH PRIVILEGES;
EXIT;
Step 4 - Download Backdrop CMS
First, download the latest version of Backdrop CMS from their official download page.
curl -s https://api.github.com/repos/backdrop/backdrop/releases/latest|grep browser_download_url|grep backdrop.zip|cut -d '"' -f 4|wget -qi -
Once the download is completed, extract it to the Apache web root directory with the following command:
unzip backdrop.zip
mv backdrop /srv/http/backdrop
Next, change the ownership of the Backdrop directory to Apache:
chown -R http:http /srv/http/backdrop/
chmod -R 775 /srv/http/backdrop/
Step 5 - Configure Apache for Backdrop CMS
Next, you will need to create an Apache virtual host configuration file to host Backdrop CMS on the web.
nano /etc/httpd/conf/extra/backdrop.conf
Add the following configurations:
ServerAdmin admin@example.com
DocumentRoot /srv/http/backdrop
ServerName backdrop.example.com
Options FollowSymLinks
AllowOverride All
Require all granted
ErrorLog /var/log/httpd/error.log
CustomLog /var/log/httpd/access.log combined
Save and close the file, then edit the Apache main configuration file.
nano /etc/httpd/conf/httpd.conf
Uncomment the following lines:
Include conf/extra/httpd-vhosts.conf
LoadModule mpm_prefork_module modules/mod_mpm_prefork.so
Comment the following line:
#LoadModule mpm_event_module modules/mod_mpm_event.so
Add the following lines:
LoadModule php_module modules/libphp.so
AddHandler php-script .php
Include conf/extra/php_module.conf
Include conf/extra/backdrop.conf
Save and close the file. Then, restart the Apache service to apply the changes:
systemctl restart httpd
Step 6 - Access Backdrop CMS
Now, open your web browser and access the Backdrop CMS web interface using the URL http://backdrop.example.com. You should see the language selection screen.
Select your language and click on the SAVE AND CONTINUE button. You should see the database configuration screen.
Define your database user and password and click on the SAVE AND CONTINUE button. You should see the site configuration page.
Provide your site information, admin username, and password, and click on the SAVE AND CONTINUE button. You should see the Backdrop CMS dashboard on the following page.
Conclusion
In this guide, we explained how to install Backdrop CMS with Apache on Arch Linux. You can now use Backdrop CMS in the production environment to create and manage your website via a web browser. You can also try Backdrop CMS on one of our dedicated server hosting from Atlantic.Net!
### How to Install PrestaShop Arch Linux
Prestashop is a free and open-source e-commerce platform used to host your own online shop on the web. It uses a web template system that allows you to customize shop themes and add new features through add-on modules. Prestashop provides an addons marketplace where developers can sell themes and modules to merchants.
In this post, we will show you how to install Prestashop on Arch Linux.
Step 1 - Configure Repository
By default, the default repository is outdated in Arch Linux, so you will need to modify the default mirror list. You can do it by editing the mirror list configuration file:
nano /etc/pacman.d/mirrorlist
Remove all lines and add the following lines:
## Score: 0.7, United States
Server = http://mirror.us.leaseweb.net/archlinux/$repo/os/$arch
## Score: 0.8, United States
Server = http://lug.mtu.edu/archlinux/$repo/os/$arch
Server = http://mirror.nl.leaseweb.net/archlinux/$repo/os/$arch
## Score: 0.9, United Kingdom
Server = http://mirror.bytemark.co.uk/archlinux/$repo/os/$arch
## Score: 1.5, United Kingdom
Server = http://mirrors.manchester.m247.com/arch-linux/$repo/os/$arch
Server = http://archlinux.dcc.fc.up.pt/$repo/os/$arch
## Score: 6.6, United States
Server = http://mirror.cs.pitt.edu/archlinux/$repo/os/$arch
## Score: 6.7, United States
Server = http://mirrors.acm.wpi.edu/archlinux/$repo/os/$arch
## Score: 6.8, United States
Server = http://ftp.osuosl.org/pub/archlinux/$repo/os/$arch
## Score: 7.1, India
Server = http://mirror.cse.iitk.ac.in/archlinux/$repo/os/$arch
## Score: 10.1, United States
Server = http://mirrors.xmission.com/archlinux/$repo/os/$arch
Save and close the file, then update all the package indexes with the following command:
pacman -Syu
Step 2 - Install Nginx Web Server
First, install the latest version of the Nginx web server on your system with the following command.
pacman -S nginx-mainline
Next, start the Nginx service and enable it to start at system reboot.
systemctl start nginx
systemctl enable nginx
Step 3 - Install and Configure PHP
First, install the PHP, PHP-FPM, and other PHP extensions using the following command.
pacman -S php php-fpm php-gd unzip
Once all the packages are installed, edit the PHP configuration file.
nano /etc/php/php.ini
Add/modify the following lines:
file_uploads = On
allow_url_fopen = On
memory_limit = 256M
upload_max_filesize = 64M
date.timezone = Asia/Kolkata
extension=pdo_dblib
extension=pdo_mysql
extension=gd
extension=json
extension=xml
extension=mysqli
extension=intl
Save and close the file when you are done. Then, start the PHP-FPM service and enable it to start at system reboot.
systemctl start php-fpm
systemctl enable php-fpm
Step 4 - Install and Configure MariaDB Database
Prestashop uses a MariaDB as a database backend. So you will need to install the MariaDB on your server. You can install it with the following command.
pacman -S mariadb
After installing the MariaDB server, initialize the MariaDB database with the following command.
mysql_install_db --user=mysql --basedir=/usr --datadir=/var/lib/mysql
Next, start the MariaDB service and enable it to start at system reboot.
systemctl start mysqld
systemctl enable mysqld
Next, connect to the MariaDB shell with the following command.
mysql
Once you are connected, create a database and user for Prestashop using the following command.
CREATE DATABASE prestashop;
GRANT ALL ON prestashop.* TO prestashop@localhost IDENTIFIED BY 'securepassword';
Next, flush the privileges and exit from the MariaDB shell with the following command.
FLUSH PRIVILEGES;
EXIT;
Step 5 - Download Typo3
First, go to the Prestashop official download page and download the latest version using the following command.
wget https://assets.prestashop3.com/dst/edition/corporate/8.0.1/prestashop_edition_basic_version_8.0.1.zip
Once the download is completed, create a directory for Prestashop and extract the downloaded file.
mkdir -p /var/www/html/
unzip prestashop_edition_basic_version_8.0.1.zip -d /var/www/html/prestashop
Next, change the ownership of the Prestashop directory.
chown -R http:http /var/www/html/prestashop/
Step 6 - Configure Nginx for Prestashop
Next, you will need to create an Nginx virtual host for Prestashop. First, create a directory to store Nginx virtual host.
mkdir /etc/nginx/sites-enabled
Next, create an Nginx configuration file for Prestashop.
nano /etc/nginx/sites-enabled/prestashop.conf
Add the following configurations.
server {
listen 80;
root /var/www/html/prestashop;
index index.php index.html index.htm;
server_name prestashop.example.com;
location / {
rewrite ^/api/?(.*)$ /webservice/dispatcher.php?url=$1 last;
rewrite ^/([0-9])(-[_a-zA-Z0-9-]*)?(-[0-9]+)?/.+\.jpg$ /img/p/$1/$1$2.jpg last;
rewrite ^/([0-9])([0-9])(-[_a-zA-Z0-9-]*)?(-[0-9]+)?/.+\.jpg$ /img/p/$1/$2/$1$2$3.jpg last;
rewrite ^/([0-9])([0-9])([0-9])(-[_a-zA-Z0-9-]*)?(-[0-9]+)?/.+\.jpg$ /img/p/$1/$2/$3/$1$2$3$4.jpg last;
rewrite ^/([0-9])([0-9])([0-9])([0-9])(-[_a-zA-Z0-9-]*)?(-[0-9]+)?/.+\.jpg$ /img/p/$1/$2/$3/$4/$1$2$3$4$5.jpg last;
rewrite ^/([0-9])([0-9])([0-9])([0-9])([0-9])(-[_a-zA-Z0-9-]*)?(-[0-9]+)?/.+\.jpg$ /img/p/$1/$2/$3/$4/$5/$1$2$3$4$5$6.jpg last;
rewrite ^/([0-9])([0-9])([0-9])([0-9])([0-9])([0-9])(-[_a-zA-Z0-9-]*)?(-[0-9]+)?/.+\.jpg$ /img/p/$1/$2/$3/$4/$5/$6/$1$2$3$4$5$6$7.jpg last;
rewrite ^/([0-9])([0-9])([0-9])([0-9])([0-9])([0-9])([0-9])(-[_a-zA-Z0-9-]*)?(-[0-9]+)?/.+\.jpg$ /img/p/$1/$2/$3/$4/$5/$6/$7/$1$2$3$4$5$6$7$8.jpg last;
rewrite ^/([0-9])([0-9])([0-9])([0-9])([0-9])([0-9])([0-9])([0-9])(-[_a-zA-Z0-9-]*)?(-[0-9]+)?/.+\.jpg$ /img/p/$1/$2/$3/$4/$5/$6/$7/$8/$1$2$3$4$5$6$7$8$9.jpg last;
rewrite ^/c/([0-9]+)(-[_a-zA-Z0-9-]*)(-[0-9]+)?/.+\.jpg$ /img/c/$1$2.jpg last;
rewrite ^/c/([a-zA-Z-]+)(-[0-9]+)?/.+\.jpg$ /img/c/$1.jpg last;
rewrite ^/([0-9]+)(-[_a-zA-Z0-9-]*)(-[0-9]+)?/.+\.jpg$ /img/c/$1$2.jpg last;
try_files $uri $uri/ /index.php?$args;
}
rewrite ^images_ie/?([^/]+)\.(jpe?g|png|gif)$ js/jquery/plugins/fancybox/images/$1.$2 last;
rewrite ^/api/?(.*)$ /webservice/dispatcher.php?url=$1 last;
rewrite ^(/install(?:-dev)?/sandbox)/(.*) /$1/test.php last;
#Replace 'admin_xxxxx' in this block with the name of your admin directory.
location /admin_xxxxx {
if (!-e $request_filename) {
rewrite ^/.*$ /admin_xxxxx/index.php last;
}
}
location ~ ^/(app|bin|cache|classes|config|controllers|docs|localization|override|src|tests|tools|translations|travis-scripts|vendor|var)/ {
deny all;
}
location ~ \.(yml|log|tpl|twig|sass)$ {
deny all;
}
location ~ \.php$ {
fastcgi_pass unix:/var/run/php-fpm/php-fpm.sock;
fastcgi_param SCRIPT_FILENAME $document_root$fastcgi_script_name;
include fastcgi_params;
}
}
Save the file, then edit the Nginx main configuration file.
nano /etc/nginx/nginx.conf
Add the following lines after http{:
server_names_hash_bucket_size 64;
include sites-enabled/*;
Save the file, then verify the Nginx configuration.
nginx -t
You will get the following output.
nginx: the configuration file /etc/nginx/nginx.conf syntax is ok
nginx: configuration file /etc/nginx/nginx.conf test is successful
Finally, restart the Nginx service to apply the changes.
systemctl restart nginx
Step 7 - Access Prestashop Web UI
Now, open your web browser and access the Prestashop web installation using the URL http://prestashop.example.com. You should see the language selection page.
Select your language and click on the Next button. You should see the license agreement page.
Accept the license agreement and click on the Next button. You should see the Store information page.
Provide your shop name, county, and account details, and click on the Next button. You should see the content of the store page.
Select your required options and click on the Next button. You should see the database configuration page.
Define your database settings and click on the Test your database connection now. If everything is fine, you should see the following page.
Click on the Next button. Once the installation is finished, you should see the following page.
Before login, remove the Prestashop installation directory using the following command.
rm -rf /var/www/html/prestashop/install/
Next, click on the Manage your store button. You should see the Prestashop login page.
Provide your email address and password and click on the LOG IN button. You should see the Prestashop dashboard on the following page.
Conclusion
In this post, you learned how to install Prestashop on Arch Linux with Nginx. You have now enough knowledge to install Prestashop easily on your server and start your own online business. You can try Prestashop on dedicated server hosting from Atlantic.Net!
### How to Install Typo3 CMS on Arch Linux
Typo3 is a free and open-source content management system written in PHP language. It is a simple, flexible, and professional CMS that offers services and solutions for teams across industries. It is a great alternative to popular CMS platforms like WordPress, Joomla, and Drupal. Additionally, it can be installed on all major operating systems and runs on Apache, Nginx, and IIS web servers.
In this post, we will show you how to install Typo3 CMS on Arch Linux.
Step 1 - Configure Repository
By default, the default repository is outdated in Arch Linux, so you will need to modify the default mirror list if you have not done so already. You can do it by editing the mirror list configuration file:
nano /etc/pacman.d/mirrorlist
Remove all lines and add the following lines:
## Score: 0.7, United States
Server = http://mirror.us.leaseweb.net/archlinux/$repo/os/$arch
## Score: 0.8, United States
Server = http://lug.mtu.edu/archlinux/$repo/os/$arch
Server = http://mirror.nl.leaseweb.net/archlinux/$repo/os/$arch
## Score: 0.9, United Kingdom
Server = http://mirror.bytemark.co.uk/archlinux/$repo/os/$arch
## Score: 1.5, United Kingdom
Server = http://mirrors.manchester.m247.com/arch-linux/$repo/os/$arch
Server = http://archlinux.dcc.fc.up.pt/$repo/os/$arch
## Score: 6.6, United States
Server = http://mirror.cs.pitt.edu/archlinux/$repo/os/$arch
## Score: 6.7, United States
Server = http://mirrors.acm.wpi.edu/archlinux/$repo/os/$arch
## Score: 6.8, United States
Server = http://ftp.osuosl.org/pub/archlinux/$repo/os/$arch
## Score: 7.1, India
Server = http://mirror.cse.iitk.ac.in/archlinux/$repo/os/$arch
## Score: 10.1, United States
Server = http://mirrors.xmission.com/archlinux/$repo/os/$arch
Save and close the file, then update all the package indexes with the following command:
pacman -Syu
Step 2 - Install Apache and PHP
Typo3 CMS is written in PHP and runs on a web server, so you will need to install the Apache web server and PHP on your server.
First, install the Apache web server package with the following command:
pacman -Sy apache
After the successful installation, start and enable the Apache service with the following command:
systemctl start httpd
systemctl enable httpd
Next, install PHP and other required extensions using the following command:
pacman -Sy php php-gd php-cgi php-intl php-apache unzip
Next, edit the PHP configuration file and enable the required extensions:
nano /etc/php/php.ini
Add / Modify the following lines.
extension=pdo_mysql
extension=gd
extension=json
extension=mysqli
extension=intl
extension=xml
extension=bcmath
max_execution_time = 300
max_input_vars = 1500
memory_limit = 128M
Save and close the file when you are finished.
Step 3 - Install and Configure MariaDB Database
First, install the MariaDB server with the following command:
pacman -S libmariadbclient mariadb mariadb-clients
Next, initialize the MariaDB database with the following command:
mysql_install_db --user=mysql --basedir=/usr --datadir=/var/lib/mysql
Next, start and enable the MariaDB service with the following command:
systemctl start mysqld
systemctl enable mysqld
Next, log in to the MariaDB console using the following command:
mysql
Once you are logged in, create a database and user for Typo3 CMS:
CREATE DATABASE typo3;
GRANT ALL ON typo3.* TO typo3@localhost IDENTIFIED BY 'password';
Next, flush the privileges and exit from the MariaDB shell with the following command:
FLUSH PRIVILEGES;
EXIT;
Step 4 - Download Typo3 CMS
First, download the latest version of Typo3 CMS with the following command.
wget --content-disposition https://get.typo3.org/11.5.12
Once the download is completed, extract the downloaded file with the following command.
tar -xvzf typo3_src-11.5.12.tar.gz
Next, move the extracted directory to the Apache web root:
mv typo3_src-11.5.12 /srv/http/typo3
Next, change the ownership of the Typo3 directory to Apache:
chown -R http:http /srv/http/typo3/
chmod -R 775 /srv/http/typo3/
Step 5 - Create an Apache Virtual Host Configuration File
Next, you will need to create an Apache virtual host configuration file to host Typo3 CMS on the internet.
nano /etc/httpd/conf/extra/typo3.conf
Add the following lines:
ServerAdmin admin@example.com
DocumentRoot "/srv/http/typo3"
ServerName typo3.example.com
DirectoryIndex index.php
Options FollowSymlinks
AllowOverride All
Require all granted
ErrorLog /var/log/httpd/error.log
CustomLog /var/log/httpd/access.log combined
Save and close the file when you are finished. Next, edit the Apache main configuration file.
nano /etc/httpd/conf/httpd.conf
Uncomment the following line:
Include conf/extra/httpd-vhosts.conf
LoadModule mpm_prefork_module modules/mod_mpm_prefork.so
LoadModule rewrite_module modules/mod_rewrite.so
Comment on the following line:
#LoadModule mpm_event_module modules/mod_mpm_event.so
Add the following lines:
LoadModule php_module modules/libphp.so
AddHandler php-script .php
Include conf/extra/php_module.conf
Include conf/extra/typo3.conf
Save and close the file when you are done.
Next, restart the Apache service to apply the changes:
systemctl restart httpd
Step 6 - Access Typo3 CMS
Now, open your web browser and access the Typo3 CMS using the URL http://typo3.example.com. You should see the following screen.
Next, open your terminal and create an empty file using the following command.
touch /srv/http/typo3/FIRST_INSTALL
Next, go back to the web browser and refresh the page. You should see the following page.
Click on No problems detected, continue with installation. You should see the following page.
Provide your database username and password and click on the Continue button. You should see the following page.
Select your database and click on the Continue button. You should see the following page.
Provide your admin username, password, email, and site name, and click on the Continue button. Once the installation has been completed, you should see the following page.
Select Take me straight to the backend and click on Open the TYPO3 Backend. You should see the Typo3 login page.
Provide your admin username and password and click on the Login button. You should see the Typo3 dashboard on the following page.
Conclusion
Congratulations! You have successfully installed Typo3 CMS with Apache on Arch Linux. You can now build awesome websites using the Typo3 CMS. You can also try Typo3 CMS on one of our dedicated server hosting from Atlantic.Net!
### Most Promising Start-Ups to Watch in 2023
A startup is a type of business that is new and innovative, offering something unique to the market. The tech industry is full of startups searching for new and creative ways to improve the way we do business. Startups always look for ways to enhance their products and services to create value, meaning that startups are frequently willing to try new things and experiment with new ideas.
It's no secret that the United States is a hotbed for technology startups. In fact, according to a report from Startup Genome, the United States has more startup ecosystems than any other country in the world. And within the tech ecosystem, plenty of startups are worth watching in 2024.
This article will look at the top IT startups in the United States and abroad to watch in 2023. These startups come from various industries, and they're all doing amazing things with technology. Without further ado, here are the most promising startups to watch in 2024.
1. Sweep
Sweep is a French startup that creates innovation by enabling businesses to take control of their climate emissions, from tracking and reducing emissions to contributing to exciting climate projects worldwide. At its heart, Sweep is a data company that uses AI to predict carbon emissions from your business fleet. For example, you may have a logistics team, delivery personnel, and an integrated supplier network, all of which contribute to your organization's carbon footprint.
The Sweep app will calculate and suggest the most eco-friendly routes for your business, saving you money and the planet. It also offers insights into recycling resources, switching to sustainable suppliers, and the impact of improving transportation usage. You can gain insights on how car sharing, switching to hybrid and electric company cars, and using public transport for business trips can reduce your emissions.,
2. Vita Mojo
Vita Mojo is a technology company based in London that produces state-of-the-art software and mobile applications for the restaurant industry. Their USP is cashless transactions for the hospitality sector. This might not sound unique today, but they started doing this before Covid-19 changed everyone's need for cashless retail.
The pandemic uniquely positioned the business to grow and fulfill the hospitalities demand for cashless table service apps. As a result, they have some of the biggest names in the restaurant industry in the UK and Europe and are quickly growing internationally. Their tech powers digital ordering, point-of-sale systems, and kitchen management, to home delivery networks for takeaways.
3. SeekOut
SeekOut is a recruitment tech application that aims to simplify managing existing employees and help recruit new ones. As an organization, it is essential to stay ahead of the curve and seek out the latest and greatest in AI and hiring technology. This is where SeekOut comes in. As an AI-powered talent search engine, they can help you find and hire the best talent for your company. Not only that, but they also offer a wide range of services to help you grow and retain your talent. If you're looking for a company that can help you find and hire top talent, then SeekOut is a perfect choice.
4. Moveworks
Moveworks is a bot business that automatically resolves employees' tech issues. There is no better option for companies looking to improve their workplace and attract the best talent than Moveworks. Their AI platform helps employers understand employees' needs and when they need them.
Bots are trained to do simple tasks like resetting passwords, organizing meetings, and answering technical questions. In addition, Moveworks shines when integrating automation into the business, such as automating the onboarding process for new starters, from the application, communication, contracts, and even automated account creation on the user's first day.
5. Starburst
Starburst is a fast-growing startup that creates an abstraction layer between all your data sources. In a traditional business setup, data is kept in a database, business intelligence systems, perhaps mainframes, servers, and any of the numerous cloud database offerings. Instead,
Starburst integrates every endpoint into a seamless end-to-end solution that can read and write data to all your data sources without the complexity of data movement and copies. This is a big deal because it creates a single pane of glass where data scientists can query the entire data stack to make much more accurate decisions.
6. Immuta
Immuta is a startup that is focused on accelerating secure data access. Their Data Security Platform helps organizations protect their data and keep it safe. Immuta lets you create self-sovereign, self-custodial digital identities and keep them safe. This means no more passwords, no more user names, and no more digital identities which can be lost, taken, or stolen.
Immuta integrates with data applications like Snowflake, Data bricks, RedShift, Starburst, and Big Query. It creates unified access and trust between each stack layer, resulting in a seamless experience for the user.
7. StackBlitz
StackBlitz is a developer tool to rapidly create, test, and deploy mobile web or app solutions. The platform provides an online editor to build and test web or mobile applications and allows developers to code live within a web browser. Its USP is that you only need a web browser to use a programming application and IDE, making it mobile and tablet friendly.
In 2024, there will be several promising startups to watch. These companies are creating new ways to improve the lives of their customers, employees, and communities. With continued innovation and growth, these startups will continue to make an impact in the years to come.
How Can Atlantic.Net Help?
If you are a fledgling startup looking for a cloud partner, consider adopting a leading cloud service provider as your partner to power the technology your business demands. With over 30 years of proven experience, our full suite of managed services and trusted professional support team will build the perfect customized hosting solution to support your business or organization.
Atlantic.Net is SOC 2, and SOC 3 certified, HIPAA and HITECH audited via qualified and independent third-party auditors. In addition, we provide 24x7x365 support, monitoring, and world-class data center infrastructure for dedicated hosting and VPS hosting. You can find out more information by contacting our sales team today!
### Top 10 "Best in Mobile" Cloud Solutions in 2025
Businesses have been moving to the cloud for years, and there's no sign of that stopping anytime soon. As enterprises move more and more of their operations to the cloud, they need solutions that can keep up. In an increasingly mobile world, businesses need to ensure that their solutions are just as mobile-friendly – and that's where the "Best in Mobile" Cloud Solution comes in.
What Is a Mobile Cloud Solution?
A Mobile Cloud Solution is a comprehensive system that allows businesses to securely access their data and applications from any mobile device anywhere in the world. It provides users with the flexibility to work on the go without sacrificing security or performance. A mobile cloud solution allows businesses to run their apps and processes in the cloud, which delivers many benefits, including scalability, flexibility, and efficiency.
Top 10 "Best in Mobile" Cloud Solutions
The global mobile cloud market is thriving and is predicted to reach $202.4 billion by 2028. Do you need help deciding on the best mobile cloud solution for your business? This article will look at 10 of the best mobile cloud solutions in 2025. We will discuss what makes each provider unique and how they can help your business to thrive in the digital age.
1. Back4App
Back4App is an MBaaS (Mobile Backend as a Service) offering that aims to streamline and accelerate backend development. Using Back4App, developers can readily conduct expedient, safe, cost-effective, and scalable development of mobile applications. Key features of Back4App include real-time data management, database storage, scalability, and cross-platform software development kits.
Back4App is a trusted name within this space and a developer's favorite, as it is elastic, scalable, global, and reliable. Users can opt to use the free plan with limited functionality or commit to one of their paid plans for enhanced features.
2. Firebase
Trusted by development teams around the world, Firebase is another popular BaaS solution.
Developed in 2011 and acquired by Google in 2014, Firebase is easily integrated on the Web, Android, and iOS.
With a pay-as-you-go price structure, you only pay for the resources you use. Also, Firebase does offer some limited features and products for free. Core features of this BaaS offering include a highly secure end-to-end identity solution, ready-to-use machine learning APIs, real-time database solutions, and multiple release and monitoring products.
3. Domo
Founded in 2010, Domo Server is a fully cloud-based operating system that unites every part of your business on your phone. It is a comprehensive and easy-to-use platform trusted by some leading companies, including Unilever, ESPN, NBA, and Cisco.
Focused on end-user self-service, the Domo Appstore provides users access to hundreds of business-oriented apps. Domo also incorporates advanced analytics, including a smart alert center, data science and machine learning, embedded analytics, and predictive analytics.
4. Backendless
Another popular MBaaS offering, Backendless, was developed by Mark Piller in 2012. It is an easy-to-use, intuitive visual app development platform requiring no code. APIs required for the development of your application are all generated automatically by the software.
Backendless is compatible with popular client-side mobile and web development languages, including Swift, Objective-C, Java, JavaScript, .NET, and Flutter. Notable features include SQL and NoSQL databases, top-level file security and user authentication, geolocation, and messaging security.
Startups and small businesses can opt for a specific price plan, while medium and large enterprises will benefit from custom functions and should request an individual quote.
5. IBM Cloud
Coming in at number 5 on our list of the top "best in mobile" cloud solutions for 2023 is IBM Cloud. IBM Cloud can help you to develop, host, and run your mobile applications within the cloud. This platform enables users to integrate it with various external software applications by providing an API. With IBM Cloud, you can deploy mobile apps faster and enhance the existing features of your apps using the AI capability of IBM Watson.
6. DigitalOcean
DigitalOcean is a popular cloud platform widely used to host web or mobile applications. The company boasts 14 globally distributed data centers and supports over 600,000 customers worldwide. This flexible and scalable developer-friendly platform is ideal for startups and small businesses looking to grow. Some of the notable features of DigitalOcean are SSD-based block storage, an intuitive and easy-to-use control panel, automatically-generated back-ups, and 'DigitalOcean Droplets' or Linux-based virtual machines.
A flat pricing structure and monthly price caps mean that Digital Ocean users benefit from affordable and predictable pricing.
7. Vultr
Founded in 2014, Vultr has 27 secure data centers strategically located around the globe. It is a popular cloud platform with over 1.5 million customers served and over 45 million instances deployed. Clients benefit from DDoS protection, 100% SSDs, a seamless custom control panel, and dedicated IP addresses.
Vultr avoids long-term contracts, offering standard hourly billing for their products and services.
8. Heroku
Owned by Salesforce, Heroku is a cloud service provider that helps businesses quickly build, deploy, and scale dynamic and efficient apps. It can be used by developers, teams, and businesses of all sizes. Many prominent companies, including Facebook, Unsplash, and Toyota, use Heroku. This PaaS offering supports many popular programming languages, including Ruby, Java, Python, Node.js, and Scala.
The Heroku platform is feature-rich, with core features including app metrics for monitoring response time, throughput, and CPU usage, compliance with PCI, HIPAA, ISO, and SOC, and 24/7 access to the operations and security team.
9. Kinvey
Kinvey is an MBaaS platform that helps mainstream businesses to deliver their cross-platform applications more efficiently. As a platform, Kinvey provides solutions to a variety of developer problems. It has many pre-built components that make setting up a productive working environment accessible. Along with those tools, Kinvey lets developers focus on what is core to their product and what positively impacts the user's experience.
Core features of Kinvey include a serverless backend, code sharing, streamlined user authentication, complete integration, and a drag-and-drop builder. In addition, Kinvey offers affordable annual plans with the option to scale up as needed.
10. Linode
Since 2003, developers have trusted the Linode platform to build and support their mobile applications. The platform is known for its durability, dependability, speed, and wide network of connectivity. With an award-winning support team, a transparent flat pricing structure, and the ability to scale efficiently, Linode is an excellent choice for businesses of all sizes worldwide.
How Can Atlantic.Net Help?
Atlantic.Net is a cloud services provider with over 30 years of experience providing award-winning and highly durable infrastructure services for global businesses. We have dedicated and virtual private servers that can offload your web application's backend. In addition, our security-defined platform provides premium-grade components on an SSD-based storage architecture.
Atlantic.Net is SOC 2, and SOC 3 certified, HIPAA and HITECH audited via qualified and independent third-party auditors. In addition, we provide 24x7x365 support, monitoring, and world-class data center infrastructure. You can find out more information by contacting our sales team today!
### What Lessons Can HIPAA Compliance Teach Other Industries When It Comes to IT Operations?
HIPAA is the federal legislation that controls how the security and privacy standards of protected health information are governed. Atlantic.Net has been providing HIPAA-compliant hosting services to healthcare institutions across the United States. In addition, we are experts in upholding the physical, technical and administrative safeguards of the Health Insurance Portability and Accountability Act of 1996.
Achieving HIPAA compliance is challenging, but it is a proven method of reducing the risk and potential damage to the healthcare industry. HIPAA must be taken seriously and adhered to at all levels to be successful. One of the easiest ways to help achieve this is to outsource IT services to a HIPAA-compliant hosting provider like Atlantic.Net.
HIPAA is all about the security and integrity of data, and the founding principles of HIPAA can be applied to numerous other tech industries outside of healthcare. So what lessons can HIPAA Compliance teach other sectors when it comes to IT operations?
Lesson 1: Encrypt Everything
HIPAA places significant emphasis on encryption, and although encryption is not a mandatory requirement of the legislation, HIPAA-covered businesses must have a good reason not to implement an encryption strategy. All industries will benefit from the full disk encryption of local and attached storage (such as Atlantic.Net’s Secure Block Storage)
HIPAA recommends using complete end-to-end encryption (E2EE); this networking standard only permits the sender and receiver to view or access critical data. In addition, our experts recommend that you encrypt all data in transit, for example, when transferring data to and from Atlantic.Net servers - the simplest way to do this is over an encrypted VPN.
Another example is the mandatory encryption of data using SSL/TLS certificates. This method introduces a secured data transfer connection that protects data when traversing private networks and the public internet. In addition, certificates prevent snooping and preserve the integrity of a website.
Lesson 2: Invest in a Web Application Firewall
The security of personal data and business web applications is becoming an increasing concern. Industries are already expected to meet security standards that comply with their relevant sector. For example, businesses responsible for user transactions or sharing personal information have a duty to protect all data.
This is why tools such as a Web Application Firewall (WAF) are so popular. A WAF protects and enhances the security of individual web applications. For example, a typical application consists of a front, mid, and back tier. The WAF protects the entire stack by ensuring only legitimate traffic passes between the stack and that internet traffic is from a legitimate source.
Provisioning a WAF is the best way to protect against malicious scripts infecting your website and against zero-day malware. However, the WAF requires configuring and continuous management, which is why the Atlantic.Net WAF managed service is so popular. If you opt to self-manage, ensure the block lists and allow lists are regularly updated and reviewed, and the WAF is monitored 24x7x365.
Lesson 3: Know What Sensitive Data You Store and Protect the Data Lifecycle
This is another complex requirement of HIPAA; you must know what protected data you keep on your server and take measures to prevent unauthorized changes to the data. For example, do you know what data is on your servers? Or what information is stored inside an application? Data governance is critical for a modern business to comply with data protection laws.
Audit your infrastructure, identify sensitive data, and ensure security measures protect the data. Tools like an IPS (intrusion prevention system) can detect changes in data integrity and alert a SIEM platform. This approach creates a highly secure environment for sensitive business data.
Lesson 4: Invest in Business Continuity and Disaster Recovery
Maintaining critical business services during a disaster is crucial to HIPAA compliance. The HIPAA security rule demands the development of a process to follow in the event of a crisis or disaster scenario. Many large enterprise customers already invest in disaster recovery solutions, but small and medium-sized businesses have growing business continuity and disaster recovery requirements.
“Business continuity” refers to a tried and tested recovery plan and a solution to continue business operations. The first step of business continuity is always to have a trusted backup solution that replicates data to an alternative location.
Next, draw up a disaster recovery plan (DRP) that covers the business's technical and administrative responsibilities. For example, if you outsource your IT, your DRP should also involve your hosting provider. The DRP details the steps taken to continue operations, such as who to contact in the event of a disaster, where employees will work from, and a playbook outlining how to fail over core business services to an alternative location in the event of a catastrophic failure.
See our detailed whitepaper on the DRP process if you want to learn more about this critical business continuity element.
Lesson 5: Choose an Accredited Hosting Provider
Atlantic.Net is an award-winning HIPAA-compliant hosting provider with over 30 years of experience. We provide effective hosting solutions to an extensive list of leading healthcare clients.
Since 1994, Atlantic.Net has built a reputation as a market-leading Hosting Solutions Provider renowned for simplifying complex technologies and providing exceptional Infrastructure as a Service (IAAS). Atlantic.Net operates SSAE 18 SOC 2 and SOC2 audited and certified hosting solutions to meet the advanced IT needs of businesses. In addition, we are proud of our HIPAA-compliant hosting, HITECH, and PCI Ready options.
Contact our sales team today to find out how, heading through 2022, Atlantic.Net can help your organization meet and exceed HIPAA requirements with a managed or unmanaged hosting solution customized to meet your business's needs.
Learn more about our HIPAA-compliant web hosting and HIPAA cloud hosting solutions.
### The Impact of Cloud Computing in the Pharma and Life Sciences Space
If ever there was an industry sector that could benefit from migrating to a cloud-based infrastructure, it’s the Pharma and Life Sciences sector! Innovation and growth within Pharma and Life Sciences companies is strong, and these companies must turn to cloud computing solutions to power them through the vast changes taking place within the sector.
Cloud solutions minimize the technological worries of the past, such as slow response times, poor data security, and lack of accessibility, allowing companies to attend to the more pressing issues facing their industry, including rising costs and client expectations.
So, with this in mind, we will explore how companies within the Biotech, Pharma, and Life Science industry are leveraging the power of the cloud to drive innovation and streamline their day-to-day processes.
Cloud Migration
Cloud computing offers distinct advantages to companies operating within the Biotech, Pharma, and Life Sciences space. The on-demand access, cost reductions, increased data security, scalability, and improved collaboration offered by cloud-based solutions are unparalleled.
Cloud-based solutions enable companies to speed up the generation of informed data-driven decisions that can expedite the development of key deliverables, such as vaccines and novel drugs. The importance of these processes has become apparent over the last few years in light of the global COVID-19 pandemic.
Drug and Vaccine Development Streamlined
The research required to identify and develop novel drugs and vaccines against emerging diseases is data intensive. The computing power required to collate and analyze such data is immense. Cloud-based high-performance computing solutions arm researchers with the tools to perform complex analyses and modeling of large data sets and to use AI, Machine Learning, and image and text recognition to identify key drug and vaccine targets.
Previously unimaginable tasks can now be performed quickly and easily as Pharma and Life Science businesses offload data-intense workloads into the cloud. As an example of cloud computing’s impact within this area, Pfizer’s successful and globally-distributed COVID-19 vaccine and anti-viral medication relied on AI algorithms for production at every stage, from design right through to manufacture and delivery. The scale of this operation required an abundance of always available cloud resources in a decentralized, distributed computer network.
Improved Collaboration and Accessibility
One of the major advantages of deploying cloud-based infrastructure is the ability to access information from anywhere in the world, at any time. Given that success within the Pharma and Life Sciences industry depends on collaboration with researchers all across the globe, this is a distinct advantage.
Access to a global marketplace drives collaboration between high-profile research institutions, increasing the speed and quality of research innovations. With cloud computing, time zones no longer become an issue, instead allowing geographically disparate colleagues to securely access and contribute to shared files in their own time.
Accelerate Sector Transformation
It is clear that transformation is occurring in the Pharma, Biotech, and Life Sciences industry at an alarming rate, fast-tracked in part by the current global pandemic. Digital transformation is an essential part of this evolution. The scalability and agility offered by the cloud ensure the continued innovation of companies within this industry and the ability to compete in a saturated market.
By allowing companies to process ever-increasing amounts of data at speed, cloud computing can streamline research processes, expediting access to actionable insights. Many companies now rely on cloud-based infrastructure to automate and standardize many of their daily research tasks.
Improved Patient Experience
As we make our way cautiously out of the coronavirus pandemic, Pharma, Biotech, and Life Science companies are seeking to provide a service that is patient-centric. As cloud solutions allow companies to process increasing amounts of data at speed, patient experience and outcome will inevitably improve. Digital technology and the development of personalized therapies are putting patients directly in the driving seat of their own health and well-being.
How Can Atlantic.Net Help?
Atlantic.Net has over 30 years of experience providing reliable customized hosting solutions to clients spanning many industries, including the Pharma, Biotech, and Life Sciences sectors. Our Pharma, Biotech, and Life Sciences hosting solutions can help to drive innovation and collaboration within your company.
While the uptake of cloud-based services is often hampered within this sector due to concerns over strict compliance regulations, with Atlantic.Net, this no longer becomes a concern as we ensure your infrastructure maintains strict compliance and security at all times. Our services are fully customizable, as we work to ensure that our terms can meet the requirements laid out by your legal team.
Contact our sales team today to learn more about how Atlantic.Net can deliver the powerful infrastructure required to place your company at the forefront of a research-intensive industry.
### How to Install a TeamSpeak 3 Server on Arch Linux
TeamSpeak is a VoIP communication system used in online multiplayer gaming. It allows users to join channels and chat with other online gamers in real-time. It’s a reliable and lightweight tool and provides AES-256 encryption, minimal latency, and high audio quality. TeamSpeak is very popular with the gaming community thanks to the rise of 3D sound effects in games. It allows users to hear the action of other players as they collaborate and work through a game in real-time.
In this post, we will show you how to install a TeamSpeak server on Arch Linux.
Step 1 - Configure Repository
By default, the default repository is outdated in Arch Linux, so you will need to modify the default mirror list. You can do it by editing the mirrorlist configuration file:
nano /etc/pacman.d/mirrorlist
Remove all lines and add the following lines:
## Score: 0.7, United States
Server = http://mirror.us.leaseweb.net/archlinux/$repo/os/$arch
## Score: 0.8, United States
Server = http://lug.mtu.edu/archlinux/$repo/os/$arch
Server = http://mirror.nl.leaseweb.net/archlinux/$repo/os/$arch
## Score: 0.9, United Kingdom
Server = http://mirror.bytemark.co.uk/archlinux/$repo/os/$arch
## Score: 1.5, United Kingdom
Server = http://mirrors.manchester.m247.com/arch-linux/$repo/os/$arch
Server = http://archlinux.dcc.fc.up.pt/$repo/os/$arch
## Score: 6.6, United States
Server = http://mirror.cs.pitt.edu/archlinux/$repo/os/$arch
## Score: 6.7, United States
Server = http://mirrors.acm.wpi.edu/archlinux/$repo/os/$arch
## Score: 6.8, United States
Server = http://ftp.osuosl.org/pub/archlinux/$repo/os/$arch
## Score: 7.1, India
Server = http://mirror.cse.iitk.ac.in/archlinux/$repo/os/$arch
## Score: 10.1, United States
Server = http://mirrors.xmission.com/archlinux/$repo/os/$arch
Save and close the file, then update all the package indexes with the following command:
pacman -Syu
Step 2 - Install TeamSpeak Server
First, create a user for TeamSpeak with the following command.
adduser --disabled-login teamspeak
Next, log in as a TeamSpeak user with the following command.
su - teamspeak
Next, download the latest version of TeamSpeak with the following command.
wget https://files.teamspeak-services.com/releases/server/3.13.7/teamspeak3-server_linux_amd64-3.13.7.tar.bz2
Once the download is completed, extract the downloaded file using the following command.
tar -xvzf teamspeak3-server_linux_amd64-3.13.7.tar.bz2
Next, copy all files from the extracted directory to your current directory.
cp teamspeak3-server_linux_amd64/* .
Next, create a blank license agreement file.
touch .ts3server_license_accepted
Next, exit from the TeamSpeak user with the following command.
exit
Step 3 - Create a systemd Service File for TeamSpeak
Next, you will need to create a systemd service file to manage the TeamSpeak service via systemd.
nano /lib/systemd/system/ts3server.service
Add the following lines:
[Unit]
Description=Teamspeak Service
Wants=network.target
[Service]
WorkingDirectory=/home/teamspeak
User=teamspeak
ExecStart=/home/teamspeak/ts3server_minimal_runscript.sh
ExecStop=/home/teamspeak/ts3server_startscript.sh stop
ExecReload=/home/teamspeak/ts3server_startscript.sh restart
Restart=always
RestartSec=15
[Install]
WantedBy=multi-user.target
Save and close the file then reload the systemd daemon with the following command.
systemctl daemon-reload
Next, start and enable the TeamSpeak service using the following command.
systemctl start ts3server
systemctl enable ts3server
You can also verify the service status using the following command.
systemctl status ts3server
Step 4 - Set an Admin Password
For security purposes, it is recommended to set an administrative password for TeamSpeak.
First, stop the TeamSpeak service with the following command.
systemctl stop ts3server
Next, log in as a TeamSpeak server and set an admin password with the following command.
su - teamspeak
./ts3server_startscript.sh start serveradmin_password=yourpassword
Next, stop the TeamSpeak service with the following command.
./ts3server_startscript.sh stop
Finally, exit from the TeamSpeak user and start the TeamSpeak service:
exit
systemctl start ts3server
Step 5 - Connect TeamSpeak Server
First, you will need to download and install the TeamSpeak client on your desktop machine. You can download it from the TeamSpeak download page.
wget https://files.teamspeak-services.com/releases/client/3.5.6/TeamSpeak3-Client-linux_amd64-3.5.6.run
Once the download is completed, set executable permissions and install it with the following command.
chmod 755 TeamSpeak3-Client-linux_amd64-3.5.6.run
./TeamSpeak3-Client-linux_amd64-3.5.6.run
Once the installation is complete, navigate to the TeamSpeak install directory with the following command.
cd TeamSpeak3-Client-linux_amd64
Next, launch the TeamSpeak client with the following command.
bash ts3client_runscript.sh
You should see the TeamSpeak client on the following screen.
Click on the Connection => Connect button. You should see the following screen.
Provide your TeamSpeak server IP, admin password then click on the Connect button to connect to the TeamSpeak server.
Conclusion
In this post, you learned how to install the TeamSpeak server on Arch Linux. You also learned how to install the TeamSpeak client and connect to the TeamSpeak server. You can try the TeamSpeak server on dedicated server hosting from Atlantic.Net!
### PCI DSS Cybersecurity Requirements: A Practical Guide
What Is PCI DSS Compliance?
The Payment Card Industry Data Security Standard (PCI DSS) is a set of security standards that apply to any organization that processes, accepts, stores, or transmits credit card payments. The PCI DSS was established by the Payment Card Industry Security Standards Council (PCI SSC), a group of payment card companies, to ensure that all companies that handle credit card information do so securely and responsibly.
The PCI DSS includes requirements for protecting cardholder data, maintaining a secure network, maintaining an effective vulnerability management strategy, implementing strong access controls, and regularly monitoring and testing networks.
Organizations that handle credit card payments must be PCI DSS compliant to accept payments from customers. This may involve periodic assessments and audits to ensure that the organization follows security practices and procedures.
Failure to comply with the PCI DSS can result in financial penalties, damage to the organization's reputation, and loss of customers. Thus, it is important for any organization that handles credit card payments to be familiar with the PCI DSS and maintain compliance with its requirements.
PCI DSS Cybersecurity Requirements
The PCI DSS includes several requirements related to cybersecurity, which are designed to help ensure that organizations that handle credit card payments are protecting cardholder data and maintaining a secure network.
Install and Maintain a Firewall
The PCI DSS requires organizations to maintain a network firewall to protect cardholder data and maintain a secure network.
A firewall is a security mechanism that controls both incoming and outgoing network traffic according to predetermined security policies. It is designed to prevent unauthorized access to or from a network while permitting authorized communication to pass through.
To comply with the PCI DSS requirement to install and maintain a firewall, a covered entity must implement correct firewall configurations to protect all cardholder data. This may involve setting up firewall rules that control access to systems that store or process cardholder data and configuring the firewall to block unauthorized attempts to access the network.
In addition to installing a firewall, the PCI DSS requires organizations to maintain the firewall to ensure it is functioning correctly and is up to date with the newest security patches. This may involve regularly checking the firewall configuration, testing it to ensure that it is working properly, and updating the firewall with the latest security patches.
Encrypt Transmission of Payment Card Data Across Public and Open Networks
The PCI DSS requires organizations to encrypt the transmission of cardholder data across public networks.
Encrypting data involves converting it into a coded format that only someone with the appropriate decryption key can access. This helps to prevent data from being accessed by unauthorized entities while it is being transmitted over a network.
Complying with the PCI DSS requirement to encrypt the transmission of cardholder data over public networks may involve implementing secure protocols such as Secure Sockets Layer (SSL) or Transport Layer Security (TLS) to encrypt data as it is transmitted.
In addition to encrypting cardholder data in transit, the PCI DSS also requires organizations to protect the security of any encryption keys used to decrypt the data. This may involve implementing strong access controls that block unauthorized access to the keys and regularly rotating and updating them to ensure they remain secure.
Develop and Maintain Secure Applications and Systems
An organization must implement measures to ensure that its systems and applications are designed and developed with security in mind. This may involve following secure coding practices, such as input validation and sanitization, to prevent vulnerabilities from being introduced into the code and regularly testing and patching systems and applications to address any identified vulnerabilities.
In addition to creating secure proprietary systems and applications, the PCI DSS also requires organizations to implement measures to protect against vulnerabilities in third-party applications. This may involve regularly reviewing and testing third-party applications for vulnerabilities, mapping application dependencies, and implementing measures to address identified vulnerabilities.
Use Up-to-Date Antivirus Software
The PCI DSS requires organizations to use and regularly update antivirus software.
Anti-virus software is a type of software that is designed to detect and remove malicious software, such as viruses and malware, from a computer or network. It helps to protect against threats such as ransomware, which can encrypt data and hold it hostage until a ransom is paid, and spyware, which can steal sensitive information. An essential complement to antivirus is cloud backup solutions which can help recover data in case of a successful ransomware attack.
To comply with the PCI DSS requirement to use and regularly update antivirus software, an organization must implement measures to ensure that anti-virus software is installed and running on every system that stores or processes cardholder data. This may involve installing antivirus software on all servers, workstations, and other devices connected to the network.
In addition to installing an AV, the PCI DSS requires organizations to regularly update the software to ensure it can detect and remove the latest threats. This may involve setting up automatic updates to ensure that the software is always up to date or regularly checking for updates and installing them manually.
Assign User Access Identification
The PCI DSS requires organizations to assign user access identification.
An organization must implement measures to ensure that each user who accesses systems that store or process cardholder data has a unique user identifier, such as a username or employee number. This helps to ensure that each user's activity can be traced and monitored and that unauthorized access to corporate systems can be detected and prevented.
In addition to assigning unique user identifiers, the PCI DSS requires organizations to implement strong access controls to prevent unauthorized access to systems that store or process cardholder data. This may involve requiring users to authenticate themselves using passwords and other authentication forms and implementing measures such as two-factor authentication to increase the security of the login process.
Track and Monitor Network Access
The PCI DSS requires organizations to track and monitor network access and keep an audit trail of network activity for a minimum of one year.
An organization must implement measures to track and monitor access to its network and systems that store or process cardholder data. This may involve implementing logging and monitoring systems that track user activity, such as logins, file access, and data changes.
In addition to tracking and monitoring access, the PCI DSS requires organizations to review log files regularly to identify any unusual or suspicious activity. This may involve setting up alerts to notify administrators of potential security threats or conducting regular reviews of log files to identify security issues.
Ongoing Systems and Process Testing
The PCI DSS requires organizations to function with ongoing systems and process testing.
An organization must implement measures to regularly test its systems and processes to identify and address any vulnerabilities. This may involve conducting regular vulnerability scans and penetration tests to identify potential security weaknesses and implementing measures to address any identified vulnerabilities. External IPs and domains may need to be scanned by a PCI-approved scanning vendor (ASV).
In addition to testing systems and processes, the PCI DSS also requires organizations to regularly review and update their security policies and procedures to ensure that they are still practical and relevant. This may involve reviewing and updating policies and procedures in response to changes in the organization's operations or the threat landscape.
Conclusion
In conclusion, the PCI DSS is a security standard that applies to organizations that accept, process, store, or transmit credit card payments. The PCI DSS includes several requirements related to cybersecurity, including installing and maintaining a firewall, encrypting the transmission of cardholder data, using and regularly updating antivirus software, developing and maintaining secure systems and applications, assigning user access identification, tracking, and monitoring network access, and conducting ongoing systems and process testing.
Compliance with the PCI DSS is essential for protecting customers' sensitive financial information and maintaining stakeholders' trust. It is crucial for organizations that handle credit card payments to be aware of the PCI DSS requirements and to have systems in place to ensure that they are in compliance. By following the PCI DSS requirements, organizations can help to ensure that they are protecting cardholder data and maintaining a secure network. They can help to reduce the risk of a data breach or other security incident.
How can Atlantic.Net help? Atlantic.Net provides PCI-ready hosting services and solutions. We maintain multiple processes to provide the best protection, such as a risk assessment and monitoring user access to Payment Data.
PCI-Compliant Hosting Requirements: 12-Point Checklist
PCI DSS is a global program that businesses and organizations around the world must uphold if they want to accept payment cards, such as credit cards or debit cards. PCI compliance is critical for many businesses, so we have created a list of the principal PCI-compliant requirements that every PCI DSS-compliant web host should meet. Its purpose is to create and maintain a security standard known as the PCI DSS (Payment Card Industry Data Security Standard) which each merchant must abide by.
How do I protect the network for PCI compliance?
Install and maintain a firewall configuration to protect cardholder data
The firewall is the front door to a network that must be adequately protected from internal or externally routed traffic over trusted and untrusted networks. All layers of the network are in scope,
such as the open internet, VPN connectivity, wirelessnetworking, and corporate networks.
The network security design must be documented and amendments must be managed by change control in dev, test, and production configurations. Importantly, the flow of card data around the
network must be known and documented. Other key areas to consider are the roles and responsibilities must be defined in terms of who will manage the network (typically a network engineering team), all unused switch ports must be down and closed, all undefined traffic must be denied by default, and any discovered vulnerabilities in the network hardware must be patched.
How can Atlantic.Net help? Thanks to the robust training provided to our employees for our HIPAA-ready hosting services, all Atlantic.Net employees are already trained to PCI standards for a PCI-compliant hosting provider. We maintain multiple processes to provide the best protection, such as a risk assessment and monitoring user access to payment data.
to meet PCI-DSS standards?
Do not use vendor-supplied defaults for system passwords and other security parameters
It is very easy for a malicious user to compromise a system if the vendor passwords have not been amended from their defaults. Default passwords are documented all over the
Internet, so it is recommended to disable the accounts and create unique accounts. Any wireless network must be protected with strong encryption (minimum WPA2) and complex passwords.
PCI-DSS also requires configuration standards being met for server builds to include security and server hardening to close off security vulnerabilities, operating system patching, application updates, and more. You must also only have one primary function per server; a single server must not do every task required by the business. Often front-end, DMZ, mid-tier, and backend services are divided to create a secured hierarchy, and the technical teams must be aware of the security policies put in place to protect these systems.
How can Atlantic.Net help?
All our systems are already hardened to provide the best level of security and compliance. If you use our Managed Services you will automatically inherit this best practice from our audited environment. Our support teams and consultancy services can advise on patching schedules, security best practices, and more.
How do I protect stored cardholder data?
Credit card data should only be stored when necessary. If your organization does store permanent account numbers, or PANs (in this case payment card numbers), they should be encrypted. When
displayed, the PAN should be masked and truncated; one-way hash functions based on strong cryptography can be used to render cardholder data unreadable.
The storage of full-track data, PINs and validation codes is prohibited, andthere are strict rules on data retention - Remember, if you don't need it, don't store it!
How can Atlantic.Net help? Atlantic.Net systems use AES encryption as standard, and our teams are highly trained in security best practices when handling sensitive data, as with PCI-compliant web hosting. All employees are vetted before employment and we conduct regular training for the team. Ask about our SOC audits as well! They are a critical part of PCI-DSS.
How do I secure cardholder data transmission?
Encrypt transmission of cardholder data across open, public networks
When you accept credit card payments for secure processing on your company's web server or share cardholder data across networks, sensitive data must be encrypted during transmission over the Internet, WiFi, private networks, and site-to-site connections. All websites must be secured with TLS (HTTPS), and there are strict rules on how PAN data can be transmitted. Always ensure
this is done in a secure environment; never transmit over email, SMS, or mobile apps, as this data is easily intercepted and should be routinely monitored.
How can Atlantic.Net help?
We can provide secure point-to-point VPN connectivity into our data centers, and our managed services teams can assist with key management and website certificates.
How do I meet PCI-DSS vulnerability protection requirements?
Develop and maintain secure systems and applications
Vulnerability scanning will identify all the known vulnerabilities affecting the infrastructure. This landscape rapidly changes, and it is important to stay one step ahead. The majority of vulnerabilities have already been identified by the manufacturers and patches are available rapidly.
Any custom applications must be built to PCI DSS compliance standards regarding access to and encryption of source code. Never hard-code security information into source code, and never
publish to public repos like GitHub. Databases require special attention to prevent Buffer Overflow and SQL injection weaknesses.
How can Atlantic.Net help?
We already invest heavily in threat reduction and are continuously monitoring our platforms for weaknesses. Our teams manage the security of the Cloud Infrastructure and our managed services teams are available to advise on patching schedules and system maintenance.
Should access to cardholder data be restricted?
Restrict access to cardholder data by business need-to-know
Employee roles and business need-to-know should guide the development of access controls so that unauthorized use does not occur. The basic idea of need-to-know is that you only give the extent of privileges and amount of data to a user that is necessary to conduct their tasks. Zero Trust should be integrated into your access control system, as indicated by the PCI Council’s instructions to “‘deny all’ unless specifically allowed.”
How can Atlantic.Net help?
Our PCI-compliant hosting consultancy team can help assign the least privileges to employees and introduce technical safeguards to restrict access to cardholder data. All Atlantic.Net employees who have access to these systems are trained on the security requirements of PCI-DSS.
How can I know who is accessing my systems?
Identify and authenticate access to system components
To meet PCI compliance standards, you need to know who is doing what within the system, and you want all activities to be easily trackable so that you can monitor and verify. Do not give
anyone access to critical systems or data unless you have first given them a unique user ID. A password, passphrase, or multi-factor authentication (MFA) should be standard. MFA should be
used for remote access. Virtual private networks, tokenization, or authentication, and dial-in should be implemented for remote use.
How can Atlantic.Net help?
Our managed services teams can process and create users and computers to meet the required security parameters and enforce the correct password policy and key rotation requirements. We can configure automated alerts to identify when user accounts are not used on X days. In addition to our PCI-Compliant Hosting services, we also offer a managed Multi-Factor Authentication service.
How secure are the Atlantic.Net data centers?
Restrict physical access to cardholder data
Data is, of course, stored on real systems, and any access to physical systems presents the opportunity for theft. To achieve PCI-compliant hosting requirements, the provider’s data center
should restrict physical access. Facility entry controls should be used. Before any outsider enters a space in which cardholder data is present or is being processed, they should receive a
physical token that they give back before departure.
How can Atlantic.Net help?
In our multiple data center locations, security is paramount. We employ a permanent security presence, and our buildings are protected by CCTV, door access controls, and access control lists. Only authorized users are allowed in the data center and all cabinets are locked. All unused network ports are closed throughout the data center and strict visitor controls are in place.
Is it possible to monitor all activity for PCI-DSS?
Track and monitor all access to network resources and cardholder data
Being able to track exactly what a given user is doing by logging all steps they take allows you to perform vulnerability management and forensics in an organized fashion. Logs allow you to
analyze something much more specifically and efficiently so that if any issues arise, you can understand how hacking or other improper use occurs. To meet PCI standards, you want automated audit trails in place so that you can review any activities.
How can Atlantic.Net help?
Atlantic.Net maintains detailed audit logs of all access on our systems. We use machine learning to predict unexpected access, and alerts are automatically generated to our support personnel.
Who is responsible for pen-testing?
Regularly test security systems and processes
Security gaps are often revealed through hacking. Testing security protocols, hardware, and software will keep you secure long-term. Check to see what wireless devices are being used with
a wireless analyzer at least quarterly. Alternatively, use a wireless intrusion prevention service (IPS). Network vulnerability scans should be performed once each quarter and also following major adjustments within the network. Perform penetration testing annually at a minimum.
How can Atlantic.Net help?
We perform quarterly vulnerability scanning for our PCI-compliant hosting customers, and identified threats are responded to quickly and under change control. Annual penetration tests are conducted to test our infrastructure is in the best shape possible for our clients.
Who needs to understand the rules of PCI compliance? My staff, or just my PCI-compliant hosting provider?
Maintain a policy that addresses information security for all personnel
Beyond PCI-compliant server requirements, you also need personnel interacting with the systems to be well-equipped. Everyone on staff should know their PCI compliance responsibilities for
safeguarding sensitive data. Create, update, and distribute a PCI compliance information security policy that lets your employees know about PCI DSS rules. For internal environments, create usage policies to shape expectations for employees and contractors.
How can Atlantic.Net help?
All Atlantic.Net employees are trained to PCI standards for a PCI-compliant hosting provider. We maintain multiple processes to provide the best protection, such as a risk assessment, monitoring user access to Payment Data
Read More About PCI Compliant Hosting
PCI Compliant Hosting
What Is PCI Compliance?
PCI Compliance Checklist for Small Businesses
Cloud PCI Compliance Key Requirements
### Top 10 Best Cloud Payment, Finance, or Billing Solutions in 2025
The cloud is ubiquitous these days, with businesses and organizations utilizing cloud-based tools and services for a variety of purposes. From data storage to software-as-a-service (SaaS), the cloud has revolutionized how we work and live. As the cloud has grown in popularity, so too has the field of cloud-based payments.
Cloud-based payment solutions and finance and accounting outsourcing services are becoming the preferred choice for businesses of all sizes. They offer many benefits, including easier and faster payments, improved security, enhanced scalability, and reduced costs. In addition, cloud-based solutions allow companies to process payments without installing any software or hardware and can be accessed from anywhere in the world.
Technologies that have emerged over the last few years—such as mobile payments, mobile commerce, and online payments—have changed the face of the financial landscape. This article will explore the top 10 cloud payment, finance, and billing providers available on the market in 2023. We have based our ranking on various criteria, including the provider's size and reach, its platform's features and functionality, and customer satisfaction.
Top 10 Cloud Payment, Finance, and Billing Solutions
1. QuickBooksOnline
QuickBooks Online is the cloud-based version of the on-premise QuickBooks accounting software. It is aimed at small businesses, allowing users to manage their finances in real-time using a user-friendly platform. The advantages of using the online version of the software include lower costs, accessibility from anywhere in the world, increased collaboration, and more extensive integrations, like Quickbooks BigQuery integration. You will also benefit from access to an award-winning support team. In addition, a QuickBooks mobile app allows you to keep on top of your books while on the move. Security needn’t be a worry as all data transferred via QuickBooks Online is protected with 128-bit SSL encryption and automatically backed up.
2. PaySimple
Established in 2006, PaySimple is a cloud-based online payment solution that helps to streamline and simplify billing and payment acceptance. With PaySimple, businesses can accept payments, track customers’ information, set up recurring payments, and invoice customers. PaySimple is ideal for small to medium enterprises that regularly establish subscriptions or repeat payments. You can even take advantage of a free trial to test the software before committing.
3. FreshBooks
Another cloud-based, all-in-one accounting software for small business, FreshBooks, was designed with owners of small businesses and freelancers in mind. FreshBooks can integrate with over 100 apps, create unlimited, customizable invoices and provide auto payment and recurring invoicing options. The software can be accessed using a desktop computer, a tablet, or a mobile phone. Notably, the mobile app offers users limited functionality. You can try FreshBooks and all its features with a 30-day free trial which you can cancel anytime.
4. GoCardless
GoCardless is a leading online payment processing service offering secure transactions with FCA authorization, GDPR compliance, and protection via the Direct Debit Guarantee. They currently handle transactions for over 75,000 businesses worldwide and process over $30 billion annually. GoCardless is very easy to integrate with other popular accounting, invoicing, and billing solutions. When signing up with GoCardless, several different price plans are available, allowing you to choose the one that is right for your business.
5. Scoro
Scoro provides an end-to-end work management platform that is ideal for service-based businesses. This platform allows you to streamline and automate your business's financial processes. The system is made to be customizable to your needs and offers a real-time dashboard on which you can design a setup that matches how you work. Companies can generate quotes and requests for payment without having to hire professionals or learn complicated processes, and users can even set up automatic payments and reminders.
6. Xero
If you are a new or small business looking for financial software that can grow and evolve with you, then Xero is a perfect choice. It is one of the most cost-effective solutions, offering customers 50% off the standard monthly price for the first six months. There is a selection of plans to suit your business, which are cost-effective compared to their competitors. In addition, Xero offers extensive features, including payment processing, payment functionality, online file storage, financial reporting and analytics, and employee time tracking.
7. Sage
Sage offers a range of cloud-based financial solutions, including integrated payroll, accounting, and payment systems, designed for SMEs worldwide. Their integrated payment solution allows you to improve payment processing and banking integration by letting customers pay on your website, accept digital payments, pay staff, and set up automated banking feeds. You can choose from different plans and cancel or upgrade at any time.
8. Zoho Books
Established in 2011, Zoho Books is a cloud-based accounting system that takes care of your business management needs. This software takes the burden and stress away from you by automating tasks such as calculating VAT receipts. With a user-friendly and intuitive dashboard, Zoho Books boasts a vast number of delighted clients. In addition, Zoho Books offers features that place it ahead of its competitors, including a client-specific portal, transaction approval, and autoscan to extract essential information from uploaded documents.
You can try out the full range of features offered by Zoho Books with a 14-day free trial. After this, you can choose one of their affordably priced plans.
9. PayPal
Not to be left off a list of top payment solutions, PayPal is a world leader in this field. It successfully provides businesses worldwide with a suite of practical solutions for online billing. PayPal has also successfully teamed up with many clients to offer customized billing solutions. PayPal's Invoicing tool allows users to send detailed electronic invoices, enabling customers to pay via credit card or PayPal. From its sleek dashboard, PayPal customers can manage bill payment history, provide reminders about invoices and keep track of unpaid invoices. In addition, companies can register for PayPal without being charged directly and then simply pay transaction fees to PayPal based on the final cost of their transactions.
10. Stripe
Stripe is a complete payment gateway and processing platform trusted globally by millions of companies of all sizes. It allows businesses to send payouts, accept online payments, and manage their business processes online. Stripe provides cardholder support in over 195 countries around the world. It will help your business to maximize and drive revenue using powerful machine learning to increase authorization rates and reduce decline rates. Stripe is an excellent payment gateway and billing solution for businesses that offer a subscription-based service, as its subscription-based billing features are top-level.
How Can Atlantic.Net Help?
With plenty of cloud-based payment, billing, and finance solutions available, we are confident that you will find one to meet the unique needs of your business. However, it is essential to remember that whichever solution you choose, make sure it is PCI compliant.
Your next decision may involve finding a leading hosting provider to host your payment and billing solution. Atlantic.Net can create the perfect hosting solution for your business or organization. For over 30 years, our talented team of professionals has delivered a full suite of managed IT services and always-available professional technical support. With SOC 2 and SOC 3, HIPAA, and HITECH certifications, 24x7x365 support, monitoring, and world-class data center infrastructure, you can trust us to protect the security and compliance of your business.
You can find out more information by contacting our sales team today!
### How to Set Up Kubernetes Cluster Using Minikube on Arch Linux
Kubernetes is a free and open-source platform that allows you to deploy, scale, and manage containerized applications automatically. It supports various container runtimes such as Docker, containerd, CRI-O, and any implementation of the Kubernetes CRI (Container Runtime Interface). Kubernetes automates several container-related tasks, including deployment, rollouts, service discovery, storage provisioning, load balancing, autoscaling, and more.
This post will show you how to install Kubernetes on Arch Linux.
Step 1 - Configure Repository
By default, the default repository is outdated in Arch Linux, so you will need to modify the default mirror list. You can do it by editing the mirrorlist configuration file:
nano /etc/pacman.d/mirrorlist
Remove all lines and add the following lines:
## Score: 0.7, United States
Server = http://mirror.us.leaseweb.net/archlinux/$repo/os/$arch
## Score: 0.8, United States
Server = http://lug.mtu.edu/archlinux/$repo/os/$arch
Server = http://mirror.nl.leaseweb.net/archlinux/$repo/os/$arch
## Score: 0.9, United Kingdom
Server = http://mirror.bytemark.co.uk/archlinux/$repo/os/$arch
## Score: 1.5, United Kingdom
Server = http://mirrors.manchester.m247.com/arch-linux/$repo/os/$arch
Server = http://archlinux.dcc.fc.up.pt/$repo/os/$arch
## Score: 6.6, United States
Server = http://mirror.cs.pitt.edu/archlinux/$repo/os/$arch
## Score: 6.7, United States
Server = http://mirrors.acm.wpi.edu/archlinux/$repo/os/$arch
## Score: 6.8, United States
Server = http://ftp.osuosl.org/pub/archlinux/$repo/os/$arch
## Score: 7.1, India
Server = http://mirror.cse.iitk.ac.in/archlinux/$repo/os/$arch
## Score: 10.1, United States
Server = http://mirrors.xmission.com/archlinux/$repo/os/$arch
Save and close the file, then update all the package indexes with the following command:
pacman -Syu
Step 2 - Install Docker Engine
Kubernetes requires Docker Engine to be installed on your server. If not installed, you can install it with the following command.
pacman -S docker
Once Docker is installed, enable the Docker service using the following command.
systemctl enable docker
Next, restart your system to apply the changes.
reboot
Step 3 - Install Minikube
Minikube provides an easier way to deploy a Kubernetes cluster for local development. The Minikube package is available in the Arch Linux default repository by default. You can install it with the following command.
pacman -S minikube
After the successful installation, start Minikube with the following command.
minikube start --force
This command will set up a local Kubernetes cluster on your server.
😄 minikube v1.28.0 on Arch (kvm/amd64)
❗ minikube skips various validations when --force is supplied; this may lead to unexpected behavior
✨ Automatically selected the docker driver. Other choices: ssh, none
🛑 The "docker" driver should not be used with root privileges. If you wish to continue as root, use --force.
💡 If you are running minikube within a VM, consider using --driver=none:
📘 https://minikube.sigs.k8s.io/docs/reference/drivers/none/
📌 Using Docker driver with root privileges
👍 Starting control plane node minikube in cluster minikube
🚜 Pulling base image ...
💾 Downloading Kubernetes v1.25.3 preload ...
> preloaded-images-k8s-v18-v1...: 385.44 MiB / 385.44 MiB 100.00% 40.76 M
> gcr.io/k8s-minikube/kicbase: 386.27 MiB / 386.27 MiB 100.00% 26.76 MiB
> gcr.io/k8s-minikube/kicbase: 0 B [________________________] ?% ? p/s 10s
🔥 Creating docker container (CPUs=2, Memory=2200MB) ...
🐳 Preparing Kubernetes v1.25.3 on Docker 20.10.20 ...
▪ Generating certificates and keys ...
▪ Booting up control plane ...
▪ Configuring RBAC rules ...
🔎 Verifying Kubernetes components...
▪ Using image gcr.io/k8s-minikube/storage-provisioner:v5
🌟 Enabled addons: default-storageclass, storage-provisioner
💡 kubectl not found. If you need it, try: 'minikube kubectl -- get pods -A'
🏄 Done! kubectl is now configured to use "minikube" cluster and "default" namespace by default
Step 4 - Verify Kubernetes Cluster
You can now verify the Kubernetes cluster using the following command.
minikube kubectl -- get pods -A
You should get the following output.
> kubectl.sha256: 64 B / 64 B [-------------------------] 100.00% ? p/s 0s
> kubectl: 42.93 MiB / 42.93 MiB [------------] 100.00% 45.96 MiB p/s 1.1s
NAMESPACE NAME READY STATUS RESTARTS AGE
kube-system coredns-565d847f94-2dq5q 1/1 Running 0 54s
kube-system etcd-minikube 1/1 Running 0 66s
kube-system kube-apiserver-minikube 1/1 Running 0 67s
kube-system kube-controller-manager-minikube 1/1 Running 0 66s
kube-system kube-proxy-g7w2q 1/1 Running 0 54s
kube-system kube-scheduler-minikube 1/1 Running 0 67s
kube-system storage-provisioner 1/1 Running 1 (23s ago) 65s
To get information about nodes, use the following command.
minikube kubectl -- get nodes -A
You will get the following output.
NAME STATUS ROLES AGE VERSION
minikube Ready control-plane 109s v1.25.3
Step 5 - Access the Minikube Dashboard
By default, the Minikube dashboard is disabled, so you must enable it first.
Run the following command to enable the Minikube dashboard.
minikube dashboard
You can now retrieve the Minikube URL with the following command.
minikube dashboard --url
You should see your Minikube URL in the following output.
🤔 Verifying dashboard health ...
🚀 Launching proxy ...
🤔 Verifying proxy health ...
http://127.0.0.1:38999/api/v1/namespaces/kubernetes-dashboard/services/http:kubernetes-dashboard:/proxy/
Minikube dashboard is now enabled and listens on port 38999 on localhost. You can access the Minikube dashboard only from the localhost. You must use the SSH port forwarding method to access the Minikube dashboard from the remote system.
Log in to your Linux desktop system and forward your SSH port using the following command.
ssh -L 38999:127.0.0.1:38999 -fN root@your-server-ip
You will be asked to provide your server's root password to enable SSH port forwarding.
You can now open your web browser and access the Minikube dashboard using the URL http://127.0.0.1:38999/api/v1/namespaces/kubernetes-dashboard/services/http:kubernetes-dashboard:/proxy/. You should see the Minikube dashboard on the following screen.
Conclusion
This tutorial explained how to install the Kubernetes cluster with Minikube on Arch Linux 8. You can follow this tutorial to deploy a Kubernetes cluster for local development. You can also try to deploy Kubernetes on dedicated server hosting from Atlantic.Net!
### How to Install Jenkins on Arch Linux
Jenkins is an open-source automation tool based on Java. It helps developers to build, test, and deploy software projects automatically. Jenkins is an important part of DevOps, allowing you to continuously deliver your software by integrating with different technologies. It offers a lot of plugins that help you to integrate various DevOps stages. Jenkins is a self-contained Java-based program that can be run on Linux, macOS, and other Unix-like operating systems.
This post will show you how to install Jenkins on Arch Linux.
Step 1 - Configure Repository
By default, the default repository is outdated in Arch Linux, so you will need to modify the default mirror list. You can do it by editing the mirrorlist configuration file:
nano /etc/pacman.d/mirrorlist
Remove all lines and add the following lines:
## Score: 0.7, United States
Server = http://mirror.us.leaseweb.net/archlinux/$repo/os/$arch
## Score: 0.8, United States
Server = http://lug.mtu.edu/archlinux/$repo/os/$arch
Server = http://mirror.nl.leaseweb.net/archlinux/$repo/os/$arch
## Score: 0.9, United Kingdom
Server = http://mirror.bytemark.co.uk/archlinux/$repo/os/$arch
## Score: 1.5, United Kingdom
Server = http://mirrors.manchester.m247.com/arch-linux/$repo/os/$arch
Server = http://archlinux.dcc.fc.up.pt/$repo/os/$arch
## Score: 6.6, United States
Server = http://mirror.cs.pitt.edu/archlinux/$repo/os/$arch
## Score: 6.7, United States
Server = http://mirrors.acm.wpi.edu/archlinux/$repo/os/$arch
## Score: 6.8, United States
Server = http://ftp.osuosl.org/pub/archlinux/$repo/os/$arch
## Score: 7.1, India
Server = http://mirror.cse.iitk.ac.in/archlinux/$repo/os/$arch
## Score: 10.1, United States
Server = http://mirrors.xmission.com/archlinux/$repo/os/$arch
Save and close the file, then update all the package indexes with the following command:
pacman -Syu
Step 2 - Install Jenkins
By default, the Jenkins package is included in the Arch Linux default repository. You can install it easily with the following command.
pacman -S jenkins
You will also need to install the fontconfig package on your server. You can install it using the following command.
pacman -S fontconfig
Jenkins also installs Java automatically. You can check whether you have installed Java with the following command.
archlinux-java status
You will get the following output.
Available Java environments:
java-11-openjdk (default)
To check the Java version, run the following command.
java --version
You should see the following output.
openjdk 11.0.17 2022-10-18
OpenJDK Runtime Environment (build 11.0.17+1)
OpenJDK 64-Bit Server VM (build 11.0.17+1, mixed mode)
Step 3 - Configure Jenkins
Next, you will need to edit the Jenkins default configuration file and define your Java path.
nano /etc/conf.d/jenkins
Change the following lines:
JAVA=/usr/lib/jvm/java-11-openjdk/bin/java
JAVA_ARGS="-Xmx2048m -XX:MaxPermSize=512m -Djava.awt.headless=true"
Save and close the file, then reload the systemd daemon to apply the changes.
systemctl daemon-reload
Now, start the Jenkins service using the following command.
systemctl start jenkins
You can check the status of Jenkins with the following command.
systemctl status jenkins
You should see the following output.
● jenkins.service - Extendable continuous integration server
Loaded: loaded (/usr/lib/systemd/system/jenkins.service; disabled; preset: disabled)
Active: active (running) since Wed 2023-01-04 23:44:26 EST; 25s ago
Main PID: 75311 (sh)
Tasks: 40 (limit: 2362)
Memory: 240.1M
CGroup: /system.slice/jenkins.service
├─75311 /bin/sh -c "eval \$JENKINS_COMMAND_LINE"
└─75312 /usr/lib/jvm/java-11-openjdk/bin/java -Xmx2048m -XX:MaxPermSize=512m -Djava.awt.headless=true -jar /usr/share/java/jenki>
Jan 04 23:44:35 archlinux jenkins[75312]: *************************************************************
Jan 04 23:44:35 archlinux jenkins[75312]: Jenkins initial setup is required. An admin user has been created and a password generated.
Jan 04 23:44:35 archlinux jenkins[75312]: Please use the following password to proceed to installation:
Jan 04 23:44:35 archlinux jenkins[75312]: d8c00da0dc784653ad1dfbe40d8e0b17
Jan 04 23:44:35 archlinux jenkins[75312]: This may also be found at: /var/lib/jenkins/secrets/initialAdminPassword
Jan 04 23:44:35 archlinux jenkins[75312]: *************************************************************
Step 4 - Access Jenkins Dashboard
At this point, Jenkins is installed and listens on port 8090. You can check it with the following command.
ss -antpl | grep java
You should see the following output.
LISTEN 0 0 *:8090 *:* users:(("java",pid=74709,fd=8))
Now, open your web browser and access the Jenkins web interface using the URL http://your-server-ip:8090. You should see the Jenkins login screen.
Next, retrieve the Jenkins root password using the following command.
cat /var/lib/jenkins/secrets/initialAdminPassword
You should see the Jenkins password in the following output.
d8c00da0dc784653ad1dfbe40d8e0b17
Type the above password in the Jenkins screen and click on the Continue button. You should see the Jenkins plugin installation screen.
Click on the Install suggested plugins. You should see the admin user creation screen.
Set your admin username, password, and email, then click on the Save and Continue button. You should see the Instance configuration screen.
Set your Jenkins URL and click on the Save and Finish button. You should see the following screen.
Click on Start using Jenkins. You should see the Jenkins dashboard on the following screen.
Conclusion
In this tutorial, we explained how to install Jenkins on Arch Linux 8. You can now integrate Jenkins with any software technology and start to build, test and deploy your application automatically. You can also try to deploy Jenkins on dedicated server hosting from Atlantic.Net!
### Which Compliance Standards Require an IPS?
What Is an Intrusion Prevention System?
An intrusion prevention system (IPS) is a network security tool that monitors network traffic and analyzes it for signs of malicious activity or policy violations. If such activity is detected, the IPS can take various actions to prevent the activity from succeeding. These actions might include blocking the traffic, sending an alert to a security administrator, or quarantining the offending traffic. Also known as an intrusion detection system (IDS), an IPS aims to detect and prevent security threats in real time rather than waiting for the threats to be detected and dealt with after the fact. This makes IPS an important part of an overall security strategy, as it can help to protect networks and systems from attacks that might otherwise go undetected.
IPS for PCI DSS Compliance
PCI DSS stands for Payment Card Industry Data Security Standard. It sets security standards to ensure that all companies that accept, process, store or transmit credit card information maintain a secure environment.
The PCI DSS was developed by the Payment Card Industry Security Standards Council (PCI SSC), a group of the major payment card brands (Visa, Mastercard, American Express, Discover, and JCB). The standards are designed to help protect cardholder data from being accessed, used, or disclosed without authorization.
To comply with PCI DSS, companies must meet security requirements, including network architecture, security management, and access controls.
PCI DSS Requirement 11.4
PCI DSS Requirement 11.4 states that organizations must employ detection and prevention techniques to mitigate network intrusions. Organizations can use an IPS to monitor their network activity and alert security administrators if any suspicious activity is detected to meet this requirement, as well as implement active security measures to block threats.
According to PCI DSS Requirement 11.4, organizations must implement controls to detect and prevent network intrusions, protect the cardholder data environment (CDE), and maintain the security of their systems. These controls include:
Using IPS technology to monitor and protect networks from security threats.
Monitoring all traffic in the CDE and at critical points in the CDE to identify potential security issues.
Alerting employees to potential security threats.
Keeping intrusion detection and prevention engines, signatures, and baselines up to date to ensure that the organization's security systems are effective.
IPS for GDPR Compliance
The General Data Protection Regulation (GDPR) is a regulation in EU law on data protection and privacy for all individuals within the European Union (EU) and the European Economic Area (EEA). It also addresses the export of personal data outside the EU and EEA. The GDPR strengthens and expands the rights of individuals to control how their data is collected, used, and shared and places several new obligations on organizations that handle personal data.
The GDPR requires organizations to take appropriate technical and organizational measures to protect personal data from unauthorized access, use, or disclosure. An IPS can help organizations to meet this requirement by detecting and preventing security threats in real-time. This helps ensure personal data's confidentiality by blocking traffic attempting to exfiltrate data from an organization's systems.
IPS for HIPAA Compliance
The Health Insurance Portability and Accountability Act (HIPAA) is a U.S. federal law that establishes standards for protecting certain health information. HIPAA aims to ensure the privacy and security of protected health information (PHI) while allowing for the appropriate use and disclosure of this information when necessary for patient care or other authorized purposes.
HIPAA applies to a wide range of organizations and individuals, including healthcare providers, health plans, and healthcare clearinghouses, as well as their business associates who handle PHI on their behalf. HIPAA sets forth several requirements for the handling of PHI, including requirements for physical, technical, and administrative safeguards to protect data.
Violations of HIPAA can result in civil and criminal penalties for covered entities and their business associates. HIPAA also gives individuals the right to request access to their PHI and corrections if they believe it is incorrect. The HIPAA Security Rule 164.306 stipulates the security obligations of organizations handling PHI, including
Ensuring electronic PHI's confidentiality, integrity, and availability.
Protecting against anticipated misuse of PHI and other security threats.
Ensuring that all employees comply with HIPAA requirements.
Intrusion prevention systems (IPS) are important for HIPAA compliance because they can help covered entities and their business associates to protect relevant health information.
How to Choose an Intrusion Prevention System for a Regulated Industry
Detection Capabilities
An IPS with strong detection capabilities is more likely to identify and prevent a wider range of threats, which can help protect a network or system better.
Several factors can impact an IPS's detection capabilities, including the types of threats it is designed to detect, the algorithms and techniques it uses to analyze traffic, and the possible level of customization and tuning. Some IPS products offer a wide range of detection options, while others may be more limited in the types of threats they are able to detect.
When evaluating an IPS, it is important to consider the specific security threats and policy violations that the IPS is designed to detect, as well as the overall effectiveness of its detection capabilities. This will help to ensure that the IPS is well-suited to the needs of the organization and able to provide the level of protection that is needed.
In most cases, organizations should combine multiple detection methods to cover a broad range of threats.
Contextual Analysis
This is important because it determines how well the IPS is able to understand and interpret the context in which traffic is occurring. Security threats or policy violations often depend on the context in which they occur.
For example, an IPS that has a strong context understanding might be able to differentiate between normal network traffic and traffic that is part of a security threat, such as a distributed denial-of-service (DDoS) attack. This can help the IPS to more accurately identify and prevent threats, rather than mistakenly blocking legitimate traffic.
Some IPS products offer a wide range of context-understanding capabilities, such as the ability to analyze traffic at different layers of the network stack and to understand the relationships between different types of traffic. Other IPS products may have more limited context-understanding capabilities.
When evaluating an IPS, it is important to consider the level of context understanding that the IPS is able to provide, as well as how this context understanding is used to identify and prevent threats.
Threat Intelligence
Threat intelligence refers to information about current and emerging security threats that can be used to improve an organization's security posture.
An IPS that has access to a wide range of threat intelligence sources and that is able to use this intelligence to identify and prevent threats is more likely to be effective at protecting a network or system. This is because such an IPS will be able to stay up-to-date on the latest security threats and use this information to identify and prevent threats that might otherwise go undetected.
There are a number of ways that an IPS can use threat intelligence, including by analyzing traffic for indicators of compromise (IOCs) and by using machine learning algorithms to identify patterns of behavior that are associated with security threats. Some IPS products offer their threat intelligence feeds, while others can be configured to use third-party threat intelligence sources.
Conclusion
Several compliance standards require using an intrusion prevention system (IPS). The most important standards include the PCI DSS, GDPR, and HIPAA, which require organizations to implement an IPS as part of their security strategy.
The right IPS can help businesses protect their networks and systems from security threats and demon