When you’re training deep learning models on a GPU server, knowing what’s going on under the hood is just as important as writing the code. This is where TensorBoard comes in. It’s a powerful visualization tool that lets you monitor your training process in real time, right from your browser.
With TensorBoard, you can track training loss, GPU memory usage, and other performance metrics as your model learns. Instead of waiting until training is over to discover problems, you can spot issues like slow convergence, overfitting, or memory bottlenecks early on and make adjustments immediately.
In this guide, you’ll learn how to install TensorBoard on Ubuntu 24.04, integrate it with a PyTorch training script, and monitor your GPU metrics live.
Prerequisites
- An Ubuntu 24.04 server with an NVIDIA GPU.
- A non-root user or a user with sudo privileges.
- NVIDIA drivers are installed on your server.
Step 1 – Install Python and TensorBoard
The first step is to set up Python, a virtual environment, and the required packages for training and monitoring. This keeps your dependencies isolated and avoids version conflicts with system packages.
1. Install Python and additional dependencies.
apt install -y python3 python3-venv python3-pip git2. Create a virtual environment.
python3 -m venv tb-env
source tb-env/bin/activate
3. Upgrade pip to the latest version.
pip install --upgrade pip4. Install PyTorch, torchvision, torchaudio, and TensorBoard.
pip install torch torchvision torchaudio tensorboard5. To confirm TensorBoard is installed correctly, check its version.
tensorboard --versionOutput.
2.20.0Step 2 – Create a Training Script with TensorBoard Logging
Now that TensorBoard is installed, the next step is to integrate it into a PyTorch training loop so you can log metrics in real time.
We’ll create a file named train_with_tb.py and write a simple MNIST digit classification model. Along with tracking the training loss per batch, we’ll also log GPU memory usage in MB, which is especially useful when working on a GPU server.
nano train_with_tb.pyAdd the following code.
import torch
from torch import nn, optim
from torch.utils.data import DataLoader
from torchvision import datasets, transforms
from torch.utils.tensorboard import SummaryWriter

# Initialize TensorBoard writer
writer = SummaryWriter(log_dir="./tb_logs")

# Dataset & loader
transform = transforms.ToTensor()
train_data = datasets.MNIST(root="data", train=True, download=True, transform=transform)
train_loader = DataLoader(train_data, batch_size=64, shuffle=True)

# Model, loss, optimizer
model = nn.Sequential(
    nn.Flatten(),
    nn.Linear(28*28, 128),
    nn.ReLU(),
    nn.Linear(128, 10)
).cuda()

criterion = nn.CrossEntropyLoss()
optimizer = optim.Adam(model.parameters(), lr=0.001)

# Training loop
global_step = 0
for epoch in range(3):
    total_loss = 0
    for batch_idx, (data, target) in enumerate(train_loader):
        data, target = data.cuda(), target.cuda()

        optimizer.zero_grad()
        output = model(data)
        loss = criterion(output, target)
        loss.backward()
        optimizer.step()

        total_loss += loss.item()

        # Log loss per batch
        writer.add_scalar("Loss/train", loss.item(), global_step)

        # Log GPU memory usage in MB per batch
        gpu_mem = torch.cuda.memory_allocated() / (1024 ** 2)
        writer.add_scalar("GPU/Memory_MB", gpu_mem, global_step)

        global_step += 1

    avg_loss = total_loss / len(train_loader)
    print(f"Epoch {epoch+1}, Average Loss: {avg_loss:.4f}")

writer.close()
Now, run the training script.
python3 train_with_tb.pyOutput.
100.0%
100.0%
100.0%
100.0%
Epoch 1, Loss: 0.3434
Epoch 2, Loss: 0.1530
Epoch 3, Loss: 0.1066
Step 3 – Launch TensorBoard to View GPU Metrics
1. Once training is complete (or even while it’s still running), you can launch TensorBoard to visualize the logged data.
tensorboard --logdir ./tb_logs --port 6006 --host 0.0.0.0Note:
--logdir ./tb_logs: Points TensorBoard to the directory where you saved your logs.--port 6006: Specifies the network port to serve the dashboard on (6006 is the default).--host 0.0.0.0: Makes TensorBoard listen on all network interfaces, allowing you to connect to it from your local machine using the server’s public IP address.”
Output.
TensorBoard 2.20.0 at http://0.0.0.0:6006/ (Press CTRL+C to quit)2. Now, you can access the TensorBoard web interface using the URL http://your-server-ip:6006 from your browser to visualize your training metrics.
Note: Before you can access the dashboard, you may need to open port 6006 in your server’s firewall. For example, on Ubuntu using UFW (Uncomplicated Firewall), you would run:”
sudo ufw allow 6006/tcp
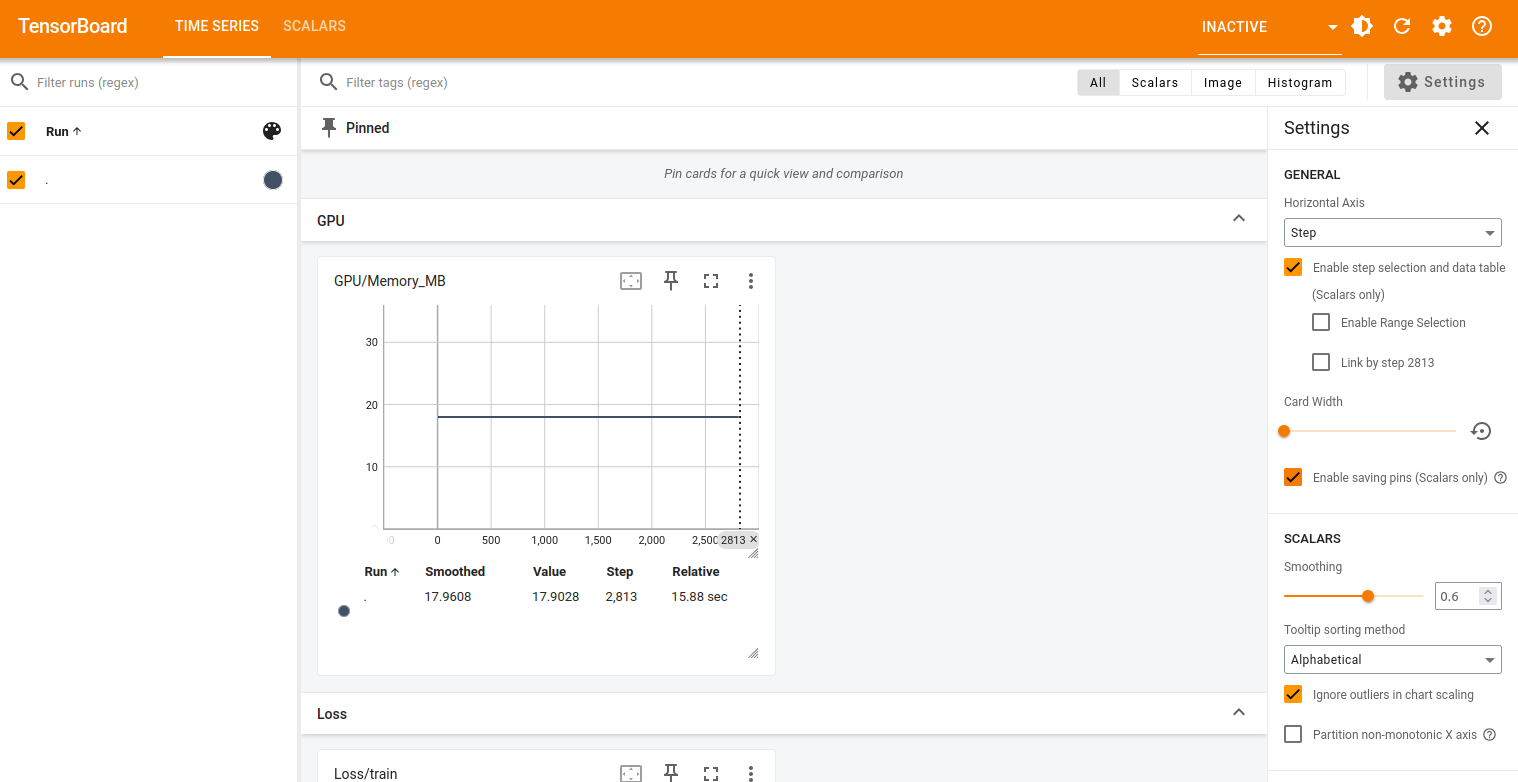
This chart displays the GPU memory usage in megabytes (MB) throughout training.
3. Click on the SCALARS tab, and you should see the graph below.
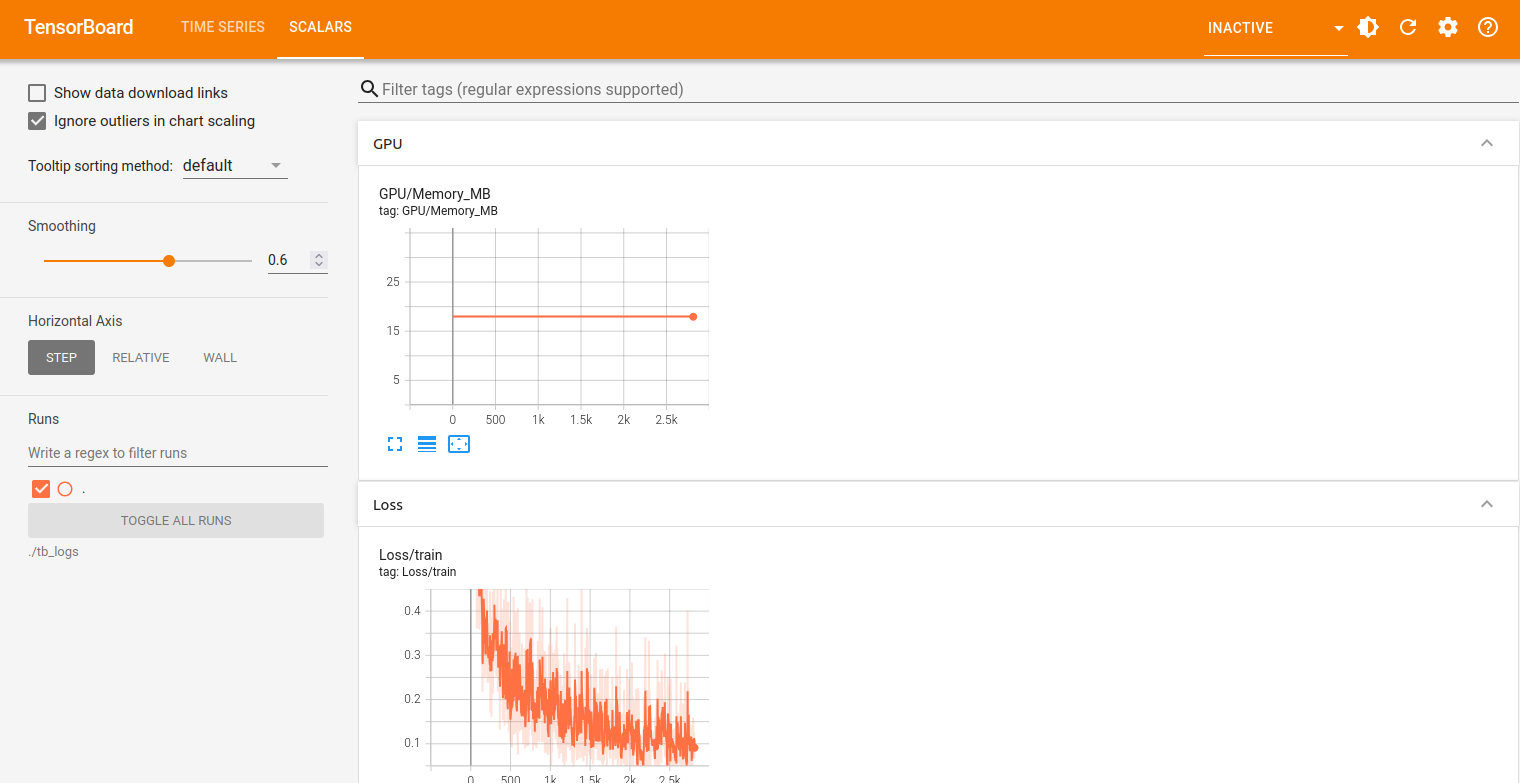
The above graph shows the model’s loss decreasing from around 0.4 to 0.1 over training steps, with expected batch-to-batch fluctuations, indicating steady learning and convergence, while a flat or rising curve would signal poor training requiring parameter or architecture changes.
Conclusion
Using TensorBoard on Ubuntu 24.04 gives you a clear, real-time view of your model’s training progress and GPU usage without guesswork. By logging metrics like training loss and GPU memory consumption, you can quickly identify whether your model is converging, detect inefficiencies, and make informed adjustments during training.
* This post is for informational purposes only and does not constitute professional, legal, financial, or technical advice. Each situation is unique and may require guidance from a qualified professional.
Readers should conduct their own due diligence before making any decisions.