Introduction
The Elastic Stack (formerly known as the ELK Stack) is a powerful set of tools for searching, analyzing, and visualizing data in real time. It consists of three main components:
- Elasticsearch – a distributed search and analytics engine.
- Kibana – a web-based visualization and dashboard interface for Elasticsearch.
- Logstash and Beats – optional components used for data collection, ingestion, and shipping.
In this guide, you will learn how to install and configure the Elastic Stack on Debian 12.
Step 1 – Install Required Packages
Before installing Elasticsearch, you need to install some supporting packages that allow Debian to handle HTTPS repositories and GPG keys. These packages are required to securely fetch and verify the Elastic Stack repository.
apt install gnupg2 apt-transport-https curl -y
Once installed, your system is now ready to add the official Elastic repository in the next step.
Step 2 – Add Elastic GPG Key and Repository
Now that the required packages are installed, you need to add Elastic’s official GPG key and repository to your Debian 12 system. This ensures that all Elastic Stack packages come from a trusted source and can be verified before installation.
1. Import the Elastic GPG key.
wget -qO - https://artifacts.elastic.co/GPG-KEY-elasticsearch | gpg --dearmor > /etc/apt/trusted.gpg.d/elk.gpg
2. Next, add the Elastic repository to your system.
echo "deb https://artifacts.elastic.co/packages/8.x/apt stable main" > /etc/apt/sources.list.d/elastic-8.list
3. Finally, update your package list to include Elastic Stack packages.
apt update -y
If everything is set up correctly, you’ll now see Elastic packages (like Elasticsearch and Kibana) available for installation via apt.
Step 3 – Install Elasticsearch
With the repository in place, you can now install Elasticsearch – the heart of the Elastic Stack. It’s the search and analytics engine that stores and processes your data.
1. Install the Elasticsearch package.
apt install elasticsearch -y
You will also see output similar to this after installation:
Authentication and authorization are enabled.
TLS for the transport and HTTP layers is enabled and configured.

The generated password for the elastic built-in superuser is : HULttZpAwdSrb-lertSG
Important: Make sure to note down the password for the Elastic user. This account will be used to log in to Elasticsearch and Kibana later.
2. Create a new configuration file under /etc/elasticsearch/jvm.options.d/ and set the heap size to 512 MB.
echo -e '-Xms512m\n-Xmx512m' > /etc/elasticsearch/jvm.options.d/jvm-heap.options
3. Reload the systemd manager configuration.
systemctl daemon-reload
4. Enable Elasticsearch to start on boot and start it immediately.
systemctl enable --now elasticsearch
5. Verify that Elasticsearch is running.
systemctl status elasticsearch
Output.
● elasticsearch.service - Elasticsearch
     Loaded: loaded (/lib/systemd/system/elasticsearch.service; enabled; preset: enabled)
     Active: active (running) since Sun 2025-09-07 14:37:01 UTC; 1min 2s ago
       Docs: https://www.elastic.co
   Main PID: 1477 (java)
      Tasks: 100 (limit: 9472)
     Memory: 1003.0M
        CPU: 1min 884ms
     CGroup: /system.slice/elasticsearch.service
             ├─1477 /usr/share/elasticsearch/jdk/bin/java -Xms4m -Xmx64m -XX:+UseSerialGC -Dcli.name=server -Dcli.script=/usr/share/elasticsearch/bin/elasticsearch -Dc>
             ├─1541 /usr/share/elasticsearch/jdk/bin/java -Des.networkaddress.cache.ttl=60 -Des.networkaddress.cache.negative.ttl=10 -XX:+AlwaysPreTouch -Xss1m -Djava.>
             └─1564 /usr/share/elasticsearch/modules/x-pack-ml/platform/linux-x86_64/bin/controller

Sep 07 14:36:38 debian12 systemd[1]: Starting elasticsearch.service - Elasticsearch...
Sep 07 14:37:01 debian12 systemd[1]: Started elasticsearch.service - Elasticsearch.
If you see “Active: active (running)”, Elasticsearch is running successfully.
Step 4 – Verify Elasticsearch Installation
After starting the Elasticsearch service, you should confirm that it is working correctly and responding to requests. Elasticsearch runs on port 9200 by default and requires HTTPS authentication in version 8.x.
1. Use curl to connect securely to Elasticsearch.
curl https:/localhost:9200 --cacert /etc/elasticsearch/certs/http_ca.crt -u elastic
Enter host password for user 'elastic':
When prompted, enter the password generated earlier (e.g., HULttZpAwdSrb-lertSG). If successful, you should see a JSON response like this.
{
  "name" : "debian12",
  "cluster_name" : "elasticsearch",
  "cluster_uuid" : "JdqQwQjtQ8qiOmqWYFwYwA",
  "version" : {
    "number" : "8.19.3",
    "build_flavor" : "default",
    "build_type" : "deb",
    "build_hash" : "1fde05a4d63448377eceb8fd3d51ce16ca3f02a9",
    "build_date" : "2025-08-26T02:35:34.366492370Z",
    "build_snapshot" : false,
    "lucene_version" : "9.12.2",
    "minimum_wire_compatibility_version" : "7.17.0",
    "minimum_index_compatibility_version" : "7.0.0"
  },
  "tagline" : "You Know, for Search"
}
2. You can also verify that Elasticsearch is listening on port 9200.
ss -altnp | grep 9200
Expected output:
LISTEN 0 4096 *:9200 *:* users:(("java",pid=1541,fd=580))
Step 5 – Install and Configure Kibana
Kibana is the web-based dashboard for the Elastic Stack. It lets you visualize data stored in Elasticsearch and manage the stack with an intuitive interface.
1. Install the Kibana package.
apt install kibana -y
2. After installation, you need to configure Kibana’s settings. Open the configuration file.
nano /etc/kibana/kibana.yml
Add or modify the following lines.
server.port: 5601
server.host: "your-server-ip"
3. Generate a Kibana enrollment token to connect securely to Elasticsearch.
/usr/share/elasticsearch/bin/elasticsearch-create-enrollment-token -s kibana
Output.
eyJ2ZXIiOiI4LjE0LjAiLCJhZHIiOlsiNjkuODcuMjE4LjE0ODo5MjAwIl0sImZnciI6IjMyNzYxM2VmMTE1NTY0NjdlNDZjNGUzMmIzZTU1ODZkYmY3NzkzY2JhYTdiMzBmZWQ2NWMxYjYxNGU4M2M0MGYiLCJrZXkiOiJPb0tnSkprQm9iMGZuZTRDRkQxMTpqTnNsOVp0TWMxdFNnUmRWcjdjaWl3In0=
Copy this token and keep it safe – you’ll need it during the Kibana setup in your browser.
4. Generate encryption keys to secure saved objects, reports, and other sensitive data.
/usr/share/kibana/bin/kibana-encryption-keys generate
Output.
Settings:
xpack.encryptedSavedObjects.encryptionKey: c186d33b7d783feae43f70bd01c6afe6
xpack.reporting.encryptionKey: 48c6bbd36dc57fd459f29d13443338bf
xpack.security.encryptionKey: 741d8f829631da11c6857ddf778e6d28
5. Open the Kibana configuration file.
nano /etc/kibana/kibana.yml
Scroll to the bottom and add the keys you generated
xpack.encryptedSavedObjects.encryptionKey: c186d33b7d783feae43f70bd01c6afe6
xpack.reporting.encryptionKey: 48c6bbd36dc57fd459f29d13443338bf
xpack.security.encryptionKey: 741d8f829631da11c6857ddf778e6d28
6. Enable and start Kibana.
systemctl enable --now kibana
7. Wait for some time to start the Kibana completely. Then, check the status of Kibana.
systemctl status kibana
Output.
● kibana.service - Kibana
     Loaded: loaded (/lib/systemd/system/kibana.service; enabled; preset: enabled)
     Active: active (running) since Sun 2025-09-07 14:43:00 UTC; 2min 35s ago
       Docs: https://www.elastic.co
   Main PID: 1830 (node)
      Tasks: 11 (limit: 9472)
     Memory: 264.0M
        CPU: 19.226s
     CGroup: /system.slice/kibana.service
             └─1830 /usr/share/kibana/bin/../node/glibc-217/bin/node /usr/share/kibana/bin/../src/cli/dist

Sep 07 14:43:02 debian12 kibana[1830]: Native global console methods have been overridden in production environment.
Sep 07 14:43:04 debian12 kibana[1830]: [2025-09-07T14:43:04.549+00:00][INFO ][root] Kibana is starting
Sep 07 14:43:04 debian12 kibana[1830]: [2025-09-07T14:43:04.627+00:00][INFO ][node] Kibana process configured with roles: [background_tasks, ui]
Sep 07 14:43:15 debian12 kibana[1830]: [2025-09-07T14:43:15.740+00:00][INFO ][plugins-service] The following plugins are disabled: "cloudChat,cloudExperiments,cloudFul>
Sep 07 14:43:15 debian12 kibana[1830]: [2025-09-07T14:43:15.841+00:00][INFO ][http.server.Preboot] http server running at http://69.87.218.148:5601
Sep 07 14:43:16 debian12 kibana[1830]: [2025-09-07T14:43:16.048+00:00][INFO ][plugins-system.preboot] Setting up [1] plugins: [interactiveSetup]
Sep 07 14:43:16 debian12 kibana[1830]: [2025-09-07T14:43:16.074+00:00][INFO ][preboot] "interactiveSetup" plugin is holding setup: Validating Elasticsearch connection >
Sep 07 14:43:16 debian12 kibana[1830]: [2025-09-07T14:43:16.114+00:00][INFO ][root] Holding setup until preboot stage is completed.
Sep 07 14:43:23 debian12 kibana[1830]: i Kibana has not been configured.
Sep 07 14:43:23 debian12 kibana[1830]: Go to http://69.87.218.148:5601/?code=548390 to get started.
From the status output, you will see the following lines:
Kibana has not been configured.
Go to http://69.87.218.148:5601/?code=548390 to get started.
Step 6 – Access Kibana Web Interface
Now that Kibana is running, you can complete the setup through your web browser.
1. Open your web browser and access Kibana using the URL http://your-server-ip:5601/?code=548390. You will see the welcome page, where you will be required to configure Elastic to get started.
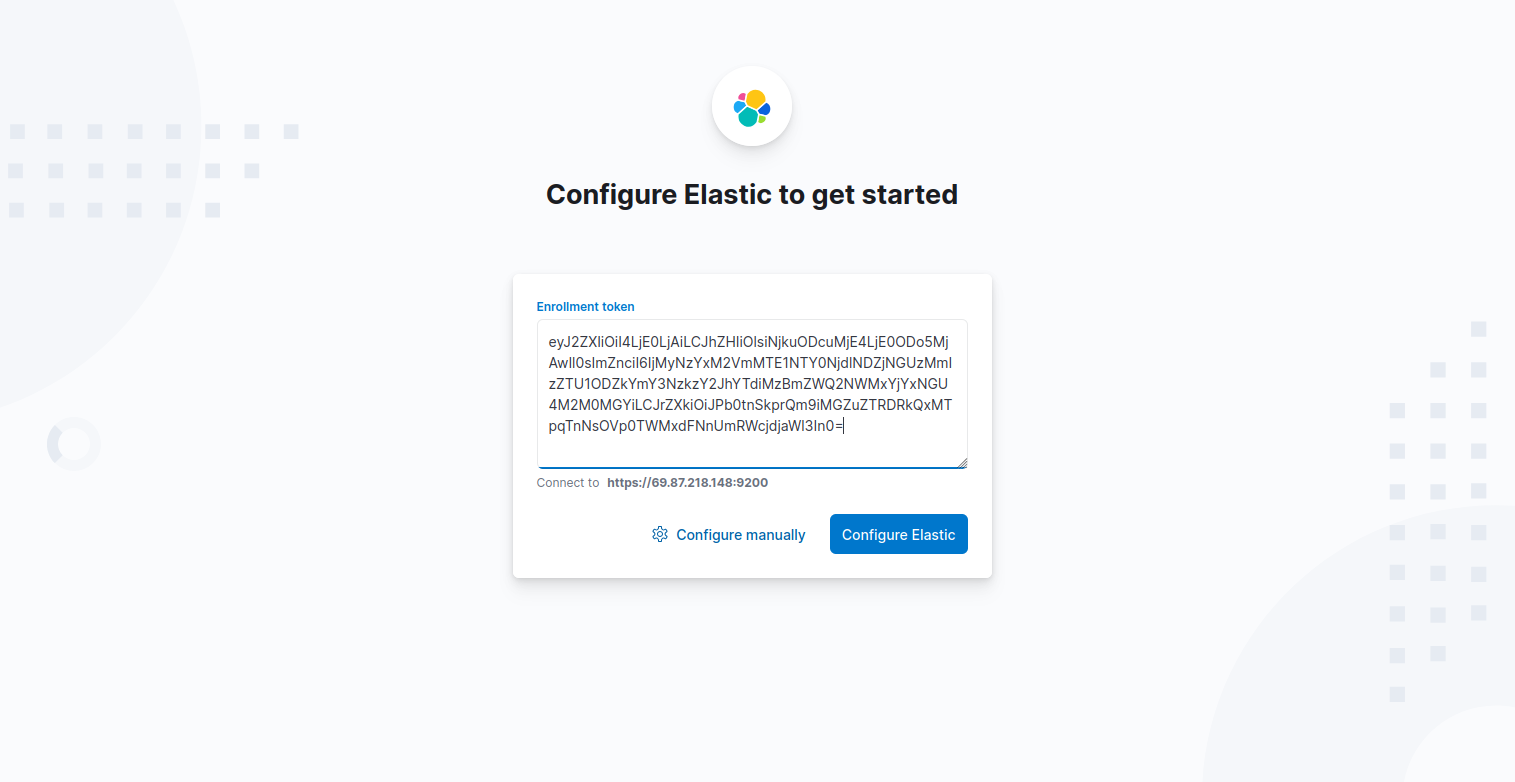
2. Copy the Kibana token generated above using the /usr/share/elasticsearch/bin/elasticsearch-create-enrollment-token -s kibana, command and paste on the box. Then, click Configure Elastic. It will then save the settings, configure and restart Elasticsearch.
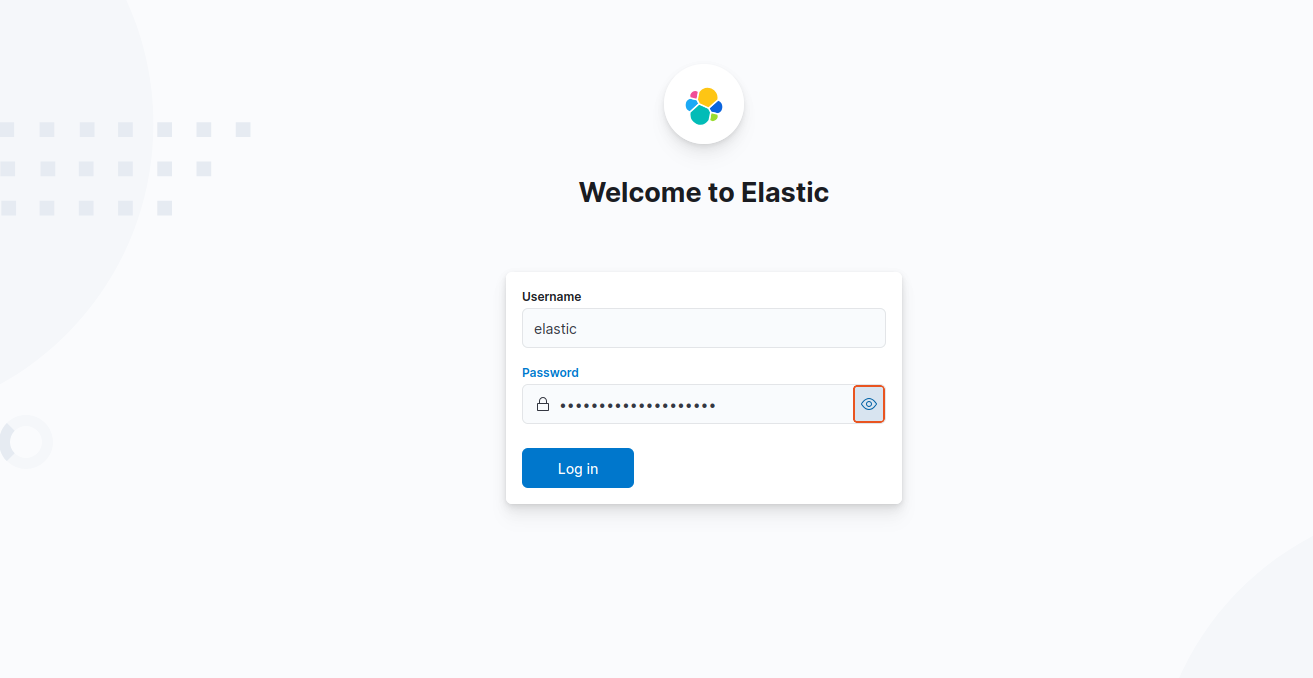
3. Login using the generated Elastic user credentials.
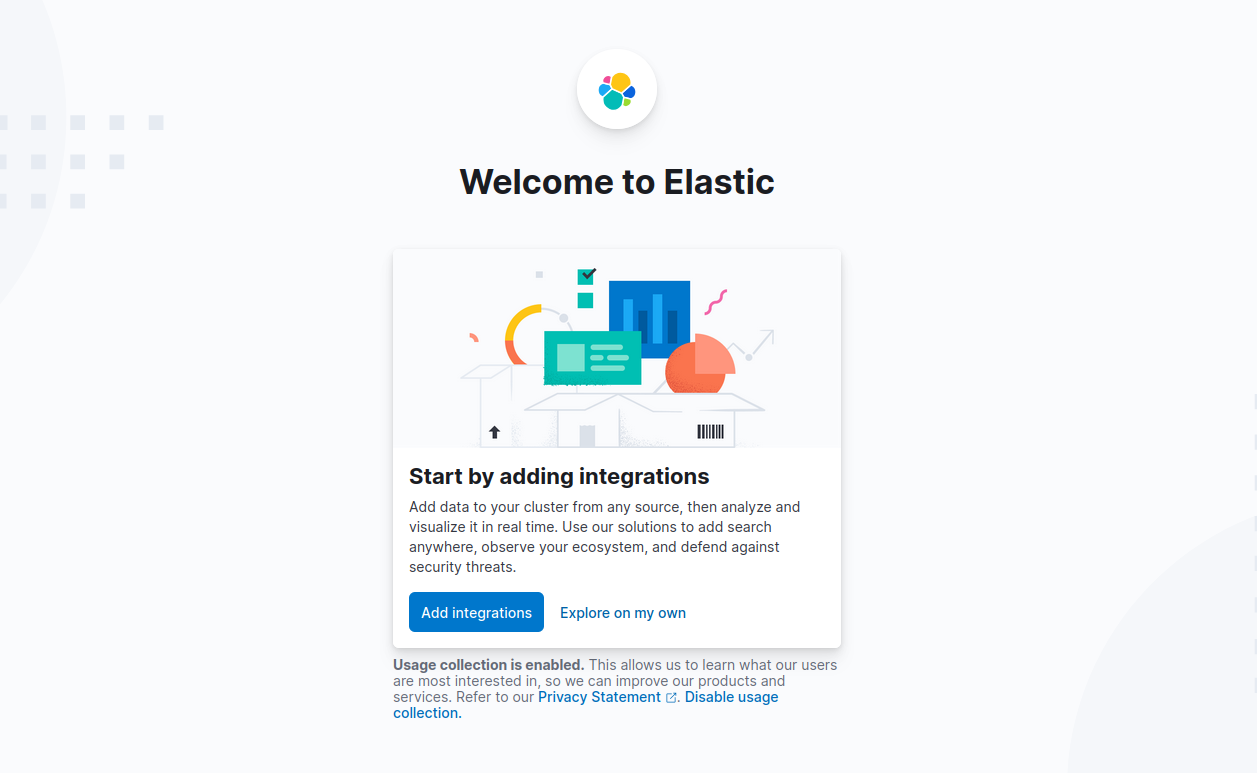
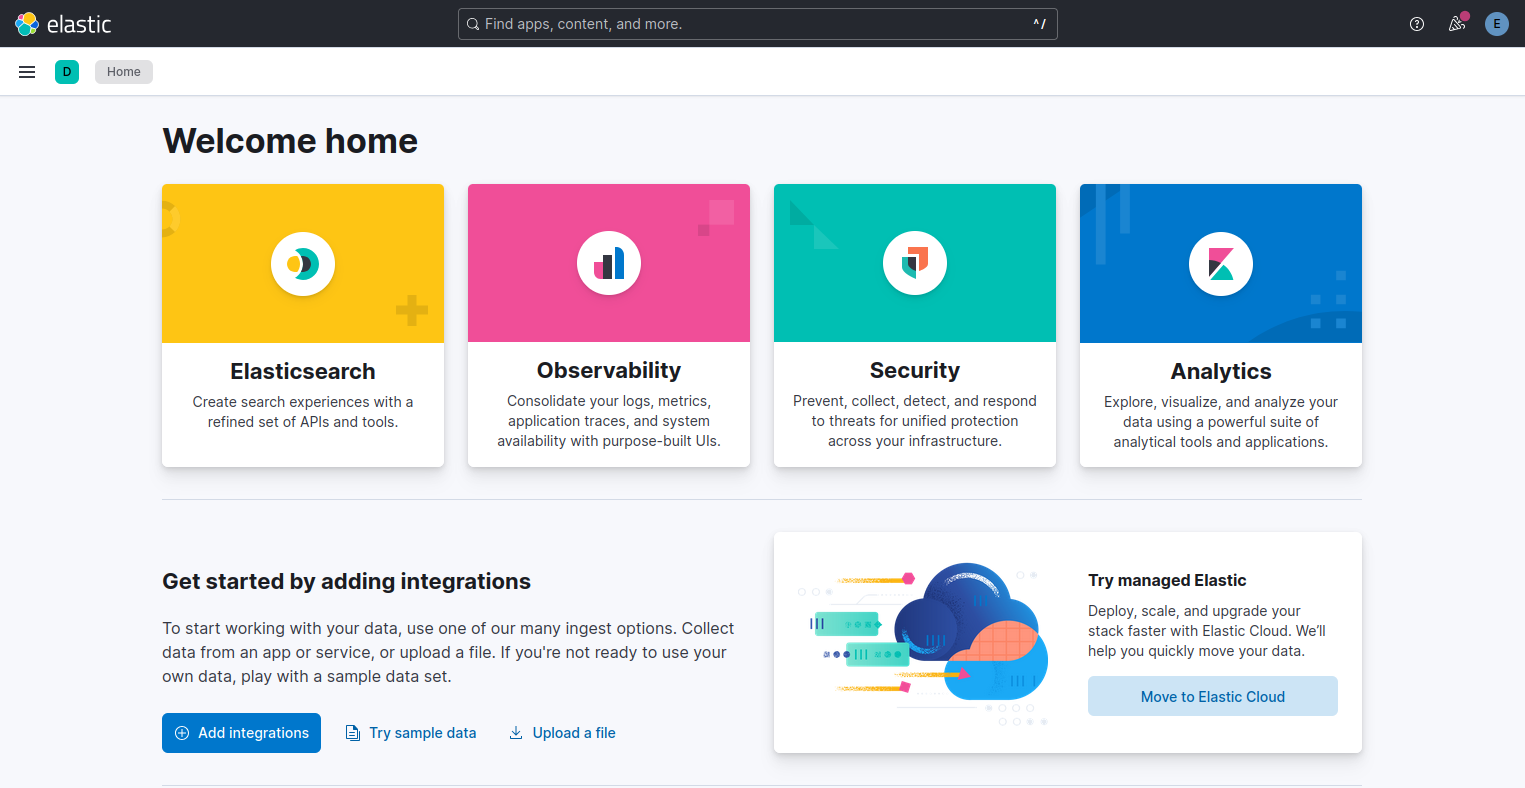
4. On the welcome page, click Explore on my own to proceed to the Kibana 8 dashboard.
Conclusion
In this tutorial, you learned how to install and configure the Elastic Stack on Debian 12. With Elasticsearch and Kibana running together, you now have a secure and functional Elastic Stack environment on Debian 12. From here, you can expand the setup further by adding Logstash for advanced data processing or deploying Beats to collect and ship logs and metrics from your servers.
* This post is for informational purposes only and does not constitute professional, legal, financial, or technical advice. Each situation is unique and may require guidance from a qualified professional.
Readers should conduct their own due diligence before making any decisions.