Wazuh is a free and open-source security monitoring tool that monitors security events at an application and OS level. It uses Elastic stack to visualize event data through a web-based interface. Wazuh allows users to search the security event data from the web browser. It offers a rich set of features including Intrusion Detection, File Integrity Monitoring, Log Data Analysis, Incident Response, Vulnerability Detection, and more.
In this post, we will show you how to install a Wazuh server on CentOS 8.
Step 1 – Install Java
Wazuh is a Java-based application, so Java must be installed on your server. If not installed, you can install it using the following command:
dnf install java-11-openjdk-devel -y
Once Java has been installed, verify the Java version using the following command:
java -version
Sample output:
openjdk version "11.0.11" 2021-04-20 LTS
OpenJDK Runtime Environment 18.9 (build 11.0.11+9-LTS)
OpenJDK 64-Bit Server VM 18.9 (build 11.0.11+9-LTS, mixed mode, sharing)
Step 2 – Install Wazuh Server
By default, the Wazuh server package is not included in the CentOS 8 default repository, so you will need to create a repo for Wazuh.
First, import the GPG key with the following command:
rpm --import https://packages.wazuh.com/key/GPG-KEY-WAZUH
Next, create a Wazuh repo with the following command:
nano /etc/yum.repos.d/wazuh.repo
Add the following lines:
[wazuh]
gpgcheck=1
gpgkey=https://packages.wazuh.com/key/GPG-KEY-WAZUH
enabled=1
name=EL-Wazuh
baseurl=https://packages.wazuh.com/4.x/yum/
protect=1
Save and close the file, then install the Wazuh server with the following command:
dnf install wazuh-manager -y
Once the Wazuh server is installed, start the Wazuh service and enable it to start at system reboot:
systemctl enable --now wazuh-manager
Step 3 – Install Elasticsearch and Kibana
First, import the Elasticsearch GPG key with the following command:
rpm --import https://artifacts.elastic.co/GPG-KEY-elasticsearch
Next, create an Elasticsearch repo with the following command:
nano /etc/yum.repos.d/elasticsearch.repo
Add the following lines:
[elasticsearch-7.x]
name=Elasticsearch repository for 7.x packages
baseurl=https://artifacts.elastic.co/packages/7.x/yum
gpgcheck=1
gpgkey=https://artifacts.elastic.co/GPG-KEY-elasticsearch
enabled=1
autorefresh=1
type=rpm-md
Save and close the file, then install Elasticsearch and Kibana with the following command:
dnf install elasticsearch-7.11.2 kibana-7.11.2 -y
Once the installation is completed, start Elasticsearch and enable it to start at system reboot:
systemctl enable elasticsearch.service --now
Next, edit the Kibana configuration file and define the Elasticsearch host, server port, and server host:
nano /etc/kibana/kibana.yml
Change the following lines:
server.port: 5601
server.host: "45.58.42.91"
elasticsearch.hosts: [http://localhost:9200]
Save and close the file, then start the Kibana service and enable it to start at system reboot:
systemctl enable --now kibana
Step 4 – Install and Configure Filebeat
First, install Filebeat using the following command:
dnf install filebeat-7.11.2 -y
Once installed, you will need to configure Filebeat to work with Wazuh.
First, back up the Filebeat configuration file:
mv /etc/filebeat/filebeat.yml{,.bak}
Next, download the pre-configured configuration file:
curl -so /etc/filebeat/filebeat.yml https://raw.githubusercontent.com/wazuh/wazuh/v4.0.3/extensions/filebeat/7.x/filebeat.yml
Next, edit the downloaded file:
nano /etc/filebeat/filebeat.yml
Add or modify the following lines:
#output.elasticsearch.hosts: ['http://YOUR_ELASTIC_SERVER_IP:9200']
output.elasticsearch.hosts: ['http://localhost:9200']

logging.level: info
logging.to_files: true
logging.files:
  path: /var/log/filebeat
  name: filebeat
  keepfiles: 7
  permissions: 0644
Save and close the file, then verify the Filebeat with the following command:
filebeat test output
Sample output:
elasticsearch: http://localhost:9200...
  parse url... OK
  connection...
    parse host... OK
    dns lookup... OK
    addresses: ::1, 127.0.0.1
    dial up... OK
  TLS... WARN secure connection disabled
  talk to server... OK
  version: 7.13.3
Step 5 – Install Filebeat Wazuh Module
Next, you will need to download and install the Wazuh module for Filebeat. You can download it with the following command:
wget https://packages.wazuh.com/4.x/filebeat/wazuh-filebeat-0.1.tar.gz
Next, create a directory for Wazuh and extract the content of the downloaded file to the Wazuh directory:
mkdir /usr/share/filebeat/module/wazuh
tar xzf wazuh-filebeat-0.1.tar.gz -C /usr/share/filebeat/module/wazuh/ --strip-components=1
Next, download the Wazuh Elasticsearch alerts index template with the following command:
curl -so /etc/filebeat/wazuh-template.json https://raw.githubusercontent.com/wazuh/wazuh/4.1/extensions/elasticsearch/7.x/wazuh-template.json
Next, set up it using the following command:
filebeat setup --path.config /etc/filebeat --path.home /usr/share/filebeat --path.data /var/lib/filebeat --index-management -E setup.template.json.enabled=false
Next, restart the Filebeat service to apply the changes:
systemctl restart filebeat
Step 6 – Install Wazuh Plugin for Kibana
First, create a data directory for Kibana and set proper ownership for the kibana directory:
mkdir /usr/share/kibana/data
chown -R kibana: /usr/share/kibana/
Next, change the directory to Kibana and install the Wazuh plugin:
cd /usr/share/kibana
sudo -u kibana /usr/share/kibana/bin/kibana-plugin install https://packages.wazuh.com/4.x/ui/kibana/wazuh_kibana-4.1.5_7.11.2-1.zip
Once the plugin is installed, verify the installed plugin with the following command:
sudo -u kibana /usr/share/kibana/bin/kibana-plugin list
Sample output:
wazuh@4.1.5-4108
Finally, restart all services to apply the changes:
systemctl restart kibana
systemctl restart elasticsearch
systemctl restart wazuh-manager
Step 7 – Access Kibana Dashboard
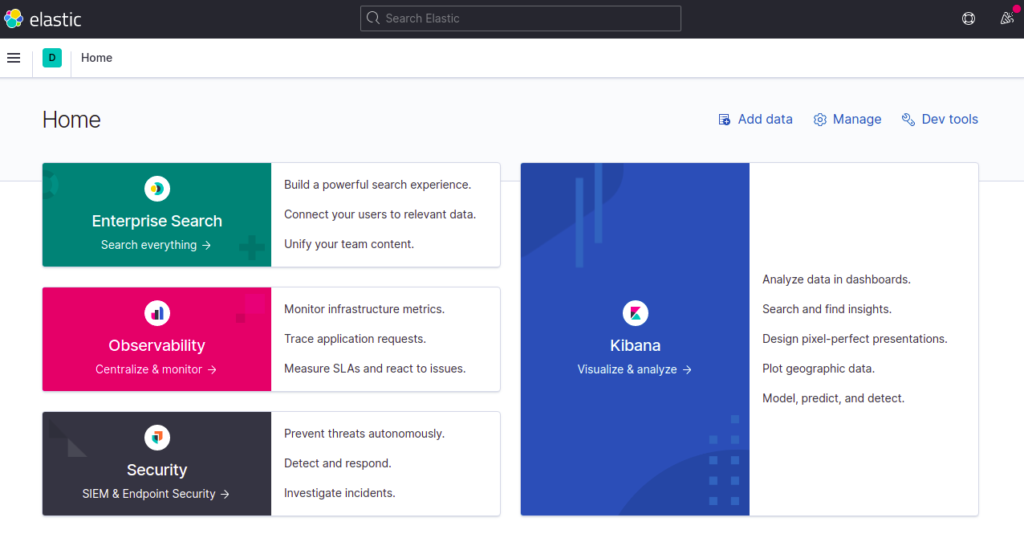
You can now access the Kibana web interface using the URL http://server-IP:5601. You should see the Kibana dashboard on the following page:

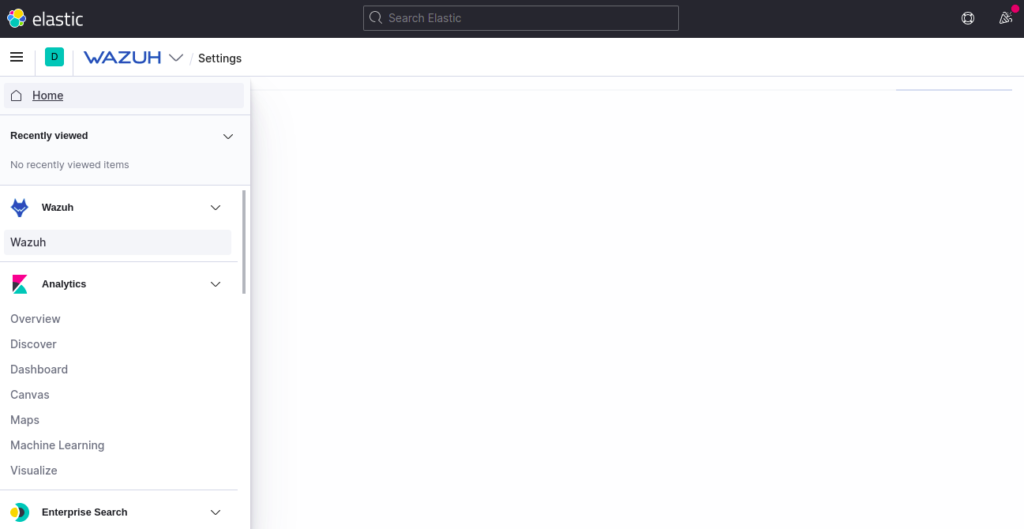
Click on Explore on my own. You should see the following screen:
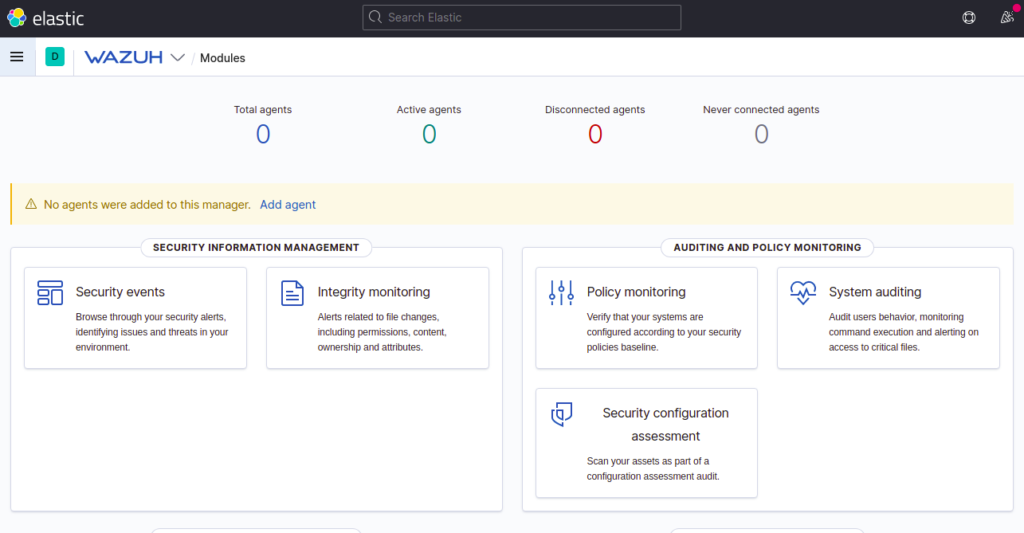
Now, click on the Menu and select Wazuh. You should see the Wazuh dashboard on the following page:
Conclusion
Congratulations! You have successfully installed and configured a Wazuh server with an ELK stack on CentOS 8. You can now install and configure the Wazuh agent on the client machine and start monitoring it from the Wazuh dashboard – try it on dedicated server hosting from Atlantic.Net.
* This post is for informational purposes only and does not constitute professional, legal, financial, or technical advice. Each situation is unique and may require guidance from a qualified professional.
Readers should conduct their own due diligence before making any decisions.