Wazuh is a free, open-source, powerful threat detection and integrity monitoring tool that helps organizations to detect intrusions, threats, and behavioral anomalies. It collects and analyzes the data gathered by the agent and visualizes event data through a web-based interface. It can be integrated with Kibana for visualization, Elasticsearch for data storage, and Filebeat for collecting Wazuh manager event data. It allows you to monitor hosts at the operating system and application levels to gain security visibility.
In this post, we will show you how to install a Wazuh server on Oracle Linux 8 server.
Step 1 – Install Java
Wazuh is a Java-based application, so Java must be installed on your server. If not installed, you can install it using the following command:
dnf install java-11-openjdk-devel -y
Once Java has been installed, verify the Java version using the following command:
java -version
Sample output:
openjdk version "11.0.16" 2022-07-19 LTS
OpenJDK Runtime Environment (Red_Hat-11.0.16.0.8-1.el8_6) (build 11.0.16+8-LTS)
OpenJDK 64-Bit Server VM (Red_Hat-11.0.16.0.8-1.el8_6) (build 11.0.16+8-LTS, mixed mode, sharing)
Step 2 – Install Wazuh Server
By default, the Wazuh server package is not included in the Oracle Linux 8 default repository, so you will need to create a repo for Wazuh.
First, import the GPG key with the following command:
rpm --import https://packages.wazuh.com/key/GPG-KEY-WAZUH
Next, create a Wazuh repo with the following command:
nano /etc/yum.repos.d/wazuh.repo
Add the following lines:
[wazuh]
gpgcheck=1
gpgkey=https://packages.wazuh.com/key/GPG-KEY-WAZUH
enabled=1
name=EL-Wazuh
baseurl=https://packages.wazuh.com/4.x/yum/
protect=1
Save and close the file, then install the Wazuh server with the following command:
dnf install wazuh-manager -y
Once the Wazuh server is installed, start the Wazuh service and enable it to start at system reboot:
systemctl enable --now wazuh-manager
You can also check the status of Wazuh with the following command:
systemctl status wazuh-manager
You will get the following output:
● wazuh-manager.service - Wazuh manager
   Loaded: loaded (/usr/lib/systemd/system/wazuh-manager.service; enabled; vendor preset: disabled)
   Active: active (running) since Thu 2022-09-01 06:34:14 EDT; 11s ago
  Process: 11484 ExecStart=/usr/bin/env /var/ossec/bin/wazuh-control start (code=exited, status=0/SUCCESS)
    Tasks: 102 (limit: 11409)
   Memory: 579.5M
   CGroup: /system.slice/wazuh-manager.service
           ├─11540 /var/ossec/framework/python/bin/python3 /var/ossec/api/scripts/wazuh-apid.py
           ├─11582 /var/ossec/bin/wazuh-authd
           ├─11599 /var/ossec/bin/wazuh-db
           ├─11611 /var/ossec/framework/python/bin/python3 /var/ossec/api/scripts/wazuh-apid.py
           ├─11614 /var/ossec/framework/python/bin/python3 /var/ossec/api/scripts/wazuh-apid.py
           ├─11629 /var/ossec/bin/wazuh-execd
           ├─11644 /var/ossec/bin/wazuh-analysisd
           ├─11658 /var/ossec/bin/wazuh-syscheckd
           ├─11695 /var/ossec/bin/wazuh-remoted
           ├─11728 /var/ossec/bin/wazuh-logcollector
           ├─11752 /var/ossec/bin/wazuh-monitord
           ├─11773 /var/ossec/bin/wazuh-modulesd
           └─12421 sysctl net.ipv4.icmp_echo_ignore_broadcasts

Sep 01 06:34:04 oraclelinux8 env[11484]: Started wazuh-db...
Sep 01 06:34:05 oraclelinux8 env[11484]: Started wazuh-execd...
Sep 01 06:34:06 oraclelinux8 env[11484]: Started wazuh-analysisd...
Sep 01 06:34:07 oraclelinux8 env[11484]: Started wazuh-syscheckd...
Sep 01 06:34:09 oraclelinux8 env[11484]: Started wazuh-remoted...
Sep 01 06:34:10 oraclelinux8 env[11484]: Started wazuh-logcollector...
Sep 01 06:34:11 oraclelinux8 env[11484]: Started wazuh-monitord...
Sep 01 06:34:12 oraclelinux8 env[11484]: Started wazuh-modulesd...
Sep 01 06:34:14 oraclelinux8 env[11484]: Completed.
Sep 01 06:34:14 oraclelinux8 systemd[1]: Started Wazuh manager.
Step 3 – Install Elasticsearch and Kibana
First, import the Elasticsearch GPG key with the following command:
rpm --import https://artifacts.elastic.co/GPG-KEY-elasticsearch
Next, create an Elasticsearch repo with the following command:
nano /etc/yum.repos.d/elasticsearch.repo
Add the following lines:
[elasticsearch-7.x]
name=Elasticsearch repository for 7.x packages
baseurl=https://artifacts.elastic.co/packages/7.x/yum
gpgcheck=1
gpgkey=https://artifacts.elastic.co/GPG-KEY-elasticsearch
enabled=1
autorefresh=1
type=rpm-md
Save and close the file, then install Elasticsearch and Kibana with the following command:
dnf install elasticsearch-7.16.3 kibana-7.16.3 -y
Once the installation is completed, start Elasticsearch and enable it to start at system reboot:
systemctl start elasticsearch
Next, edit the Kibana configuration file and define the Elasticsearch host, server port, and server host:
nano /etc/kibana/kibana.yml
Change the following lines:
server.port: 5601
server.host: "your-server-ip"
elasticsearch.hosts: [http://localhost:9200]
Save and close the file, then start the Kibana service and enable it to start at system reboot:
systemctl start kibana
To check the statuses of Kibana and Elasticsearch, run the following command:
systemctl status kibana elasticsearch
You will get the following output:
● kibana.service - Kibana
   Loaded: loaded (/etc/systemd/system/kibana.service; disabled; vendor preset: disabled)
   Active: active (running) since Thu 2022-09-01 07:01:03 EDT; 22s ago
     Docs: https://www.elastic.co
 Main PID: 5283 (node)
    Tasks: 11 (limit: 49496)
   Memory: 312.1M
   CGroup: /system.slice/kibana.service
           └─5283 /usr/share/kibana/bin/../node/bin/node /usr/share/kibana/bin/../src/cli/dist --logging.dest=/var/log/kibana/kibana.log --pi>

Sep 01 07:01:03 oraclelinux8 systemd[1]: Started Kibana.

● elasticsearch.service - Elasticsearch
   Loaded: loaded (/usr/lib/systemd/system/elasticsearch.service; enabled; vendor preset: disabled)
   Active: active (running) since Thu 2022-09-01 06:59:54 EDT; 1min 31s ago
     Docs: https://www.elastic.co
 Main PID: 5025 (java)
    Tasks: 77 (limit: 49496)
   Memory: 4.2G
   CGroup: /system.slice/elasticsearch.service
           ├─5025 /usr/share/elasticsearch/jdk/bin/java -Xshare:auto -Des.networkaddress.cache.ttl=60 -Des.networkaddress.cache.negative.ttl=>
           └─5215 /usr/share/elasticsearch/modules/x-pack-ml/platform/linux-x86_64/bin/controller
Step 4 – Install and Configure Filebeat
First, install Filebeat using the following command:
dnf install filebeat-7.16.3 -y
Once installed, you will need to configure Filebeat to work with Wazuh.
First, backup the Filebeat configuration file:
mv /etc/filebeat/filebeat.yml{,.bak}
Next, download the pre-configured configuration file:
curl -so /etc/filebeat/filebeat.yml https://raw.githubusercontent.com/wazuh/wazuh/v4.0.3/extensions/filebeat/7.x/filebeat.yml
Next, edit the downloaded file:
nano /etc/filebeat/filebeat.yml
Add or modify the following lines:
output.elasticsearch.hosts: ['http://localhost:9200']

logging.level: info
logging.to_files: true
logging.files:
  path: /var/log/filebeat
  name: filebeat
  keepfiles: 7
  permissions: 0644
Save and close the file, then verify Filebeat with the following command:
filebeat test output
Sample output:
elasticsearch: http://localhost:9200...
  parse url... OK
  connection...
    parse host... OK
    dns lookup... OK
    addresses: ::1, 127.0.0.1
    dial up... OK
  TLS... WARN secure connection disabled
  talk to server... OK
  version: 7.16.3
Step 5 – Install Filebeat Wazuh Module
Next, you will need to download and install the Wazuh module for Filebeat. You can download it with the following command:
wget https://packages.wazuh.com/4.x/filebeat/wazuh-filebeat-0.1.tar.gz
Next, create a directory for Wazuh and extract the content of the downloaded file to the Wazuh directory:
mkdir /usr/share/filebeat/module/wazuh
tar xzf wazuh-filebeat-0.1.tar.gz -C /usr/share/filebeat/module/wazuh/ --strip-components=1
Next, download the Wazuh Elasticsearch alerts index template with the following command:
curl -so /etc/filebeat/wazuh-template.json https://raw.githubusercontent.com/wazuh/wazuh/4.1/extensions/elasticsearch/7.x/wazuh-template.json
Next, set up it using the following command:
filebeat setup --path.config /etc/filebeat --path.home /usr/share/filebeat --path.data /var/lib/filebeat --index-management -E setup.template.json.enabled=false
Next, restart the Filebeat service to apply the changes:
systemctl restart filebeat
You can check the status of Filebeat with the following command:
systemctl status filebeat
You will get the following output:
● filebeat.service - Filebeat sends log files to Logstash or directly to Elasticsearch.
   Loaded: loaded (/usr/lib/systemd/system/filebeat.service; disabled; vendor preset: disabled)
   Active: active (running) since Thu 2022-09-01 07:03:55 EDT; 6s ago
     Docs: https://www.elastic.co/products/beats/filebeat
 Main PID: 5384 (filebeat)
    Tasks: 9 (limit: 49496)
   Memory: 26.8M
   CGroup: /system.slice/filebeat.service
           └─5384 /usr/share/filebeat/bin/filebeat --environment systemd -c /etc/filebeat/filebeat.yml --path.home /usr/share/filebeat --path>

Sep 01 07:03:55 oraclelinux8 systemd[1]: Started Filebeat sends log files to Logstash or directly to Elasticsearch..
Step 6 – Install Wazuh Plugin for Kibana
First, create a data directory for Kibana and set proper ownership to the kibana directory:
mkdir /usr/share/kibana/data
chown -R kibana: /usr/share/kibana/
Next, change the directory to Kibana and install the Wazuh plugin:
cd /usr/share/kibana
sudo -u kibana /usr/share/kibana/bin/kibana-plugin install https://packages.wazuh.com/4.x/ui/kibana/wazuh_kibana-4.3.3_7.16.3-1.zip
Once the plugin is installed, verify the installed plugin with the following command:
sudo -u kibana /usr/share/kibana/bin/kibana-plugin list
Sample output:
wazuh@4.1.5-4108
Finally, restart all services to apply the changes:
systemctl restart kibana
systemctl restart elasticsearch
systemctl restart wazuh-manager
Step 7 – Access Kibana Dashboard
You can now access the Kibana web interface using the URL http://server-IP:5601. You should see the following page:

Click on Explore on my own. You should see the following screen:
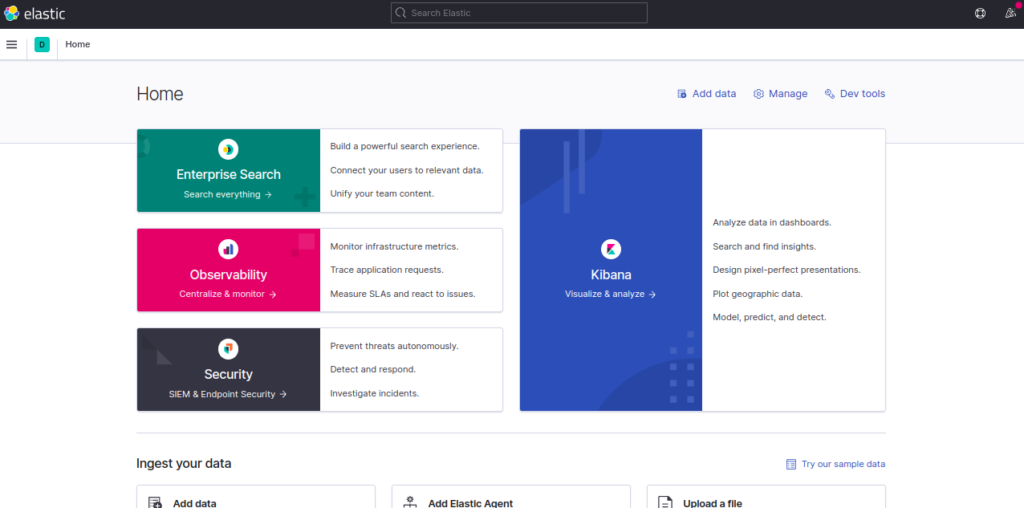
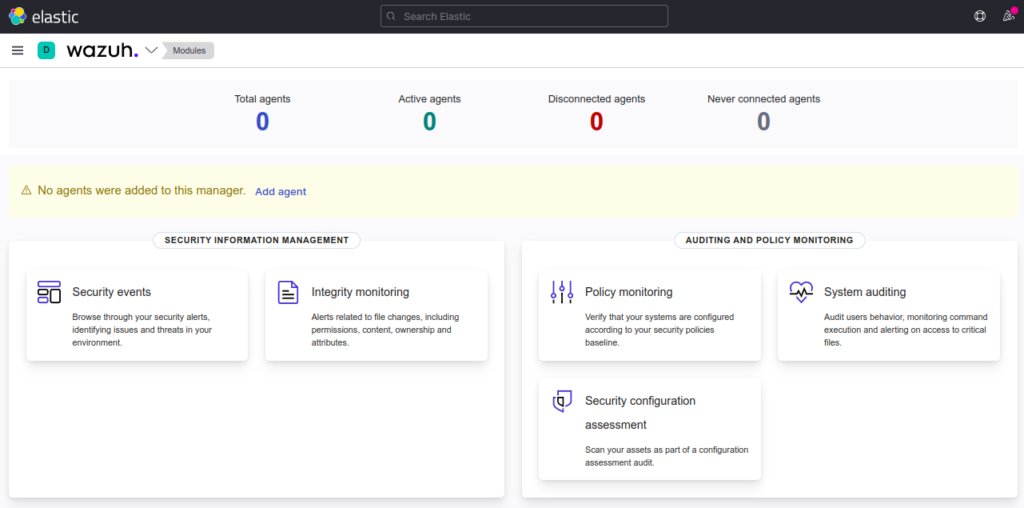
Now, click on the Menu and select Wazuh. You should see the Wazuh dashboard on the following page:
Conclusion
Congratulations! You have successfully installed and configured the Wazuh server with ELK stack on Oracle Linux 8. You can now install and configure the Wazuh agent on the client machine and start monitoring it from the Wazuh dashboard. Try out a Wazuh server on dedicated hosting from Atlantic.Net!
* This post is for informational purposes only and does not constitute professional, legal, financial, or technical advice. Each situation is unique and may require guidance from a qualified professional.
Readers should conduct their own due diligence before making any decisions.