Netdata is an open-source monitoring tool that collects all possible metrics from systems and applications and displays them via a web-based interface. With Netdata, you can collect real-time metrics such as CPU usage, disk activity, bandwidth usage, website visits, etc. It helps a system administrator to diagnose anomalies and slowdowns in your system with insightful analysis. Netdata runs its collectors every second to collect rich data and store them in a database.
In this tutorial, we will show you how to install the Netdata monitoring tool on Arch Linux.
Step 1 – Configure Repository
By default, the default repository is outdated in Arch Linux, so you will need to modify the default mirror list. You can do it by editing the mirrorlist configuration file:
nano /etc/pacman.d/mirrorlist
Remove all lines and add the following lines:
## Score: 0.7, United States
Server = http://mirror.us.leaseweb.net/archlinux/$repo/os/$arch
## Score: 0.8, United States
Server = http://lug.mtu.edu/archlinux/$repo/os/$arch
Server = http://mirror.nl.leaseweb.net/archlinux/$repo/os/$arch
## Score: 0.9, United Kingdom
Server = http://mirror.bytemark.co.uk/archlinux/$repo/os/$arch
## Score: 1.5, United Kingdom
Server = http://mirrors.manchester.m247.com/arch-linux/$repo/os/$arch
Server = http://archlinux.dcc.fc.up.pt/$repo/os/$arch
## Score: 6.6, United States
Server = http://mirror.cs.pitt.edu/archlinux/$repo/os/$arch
## Score: 6.7, United States
Server = http://mirrors.acm.wpi.edu/archlinux/$repo/os/$arch
## Score: 6.8, United States
Server = http://ftp.osuosl.org/pub/archlinux/$repo/os/$arch
## Score: 7.1, India
Server = http://mirror.cse.iitk.ac.in/archlinux/$repo/os/$arch
## Score: 10.1, United States
Server = http://mirrors.xmission.com/archlinux/$repo/os/$arch
Save and close the file, then update all the package indexes with the following command:
pacman -Syu
Step 2 – Install Netdata Monitoring Tool
By default, the Netdata package is included in the Arch Linux default repository. You can install it easily with the following command.
pacman -S netdata
Once installed, start and enable the Netdata service using the following command.
systemctl start netdata
systemctl enable netdata
You can verify the Netdata service status with the following command.
systemctl status netdata
You will get the following output.
● netdata.service - Real time performance monitoring
     Loaded: loaded (/usr/lib/systemd/system/netdata.service; disabled; preset: disabled)
     Active: active (running) since Wed 2023-01-04 23:03:23 EST; 34s ago
   Main PID: 73567 (netdata)
      Tasks: 54 (limit: 2362)
     Memory: 66.2M
     CGroup: /system.slice/netdata.service
             ├─73567 /usr/sbin/netdata -D
             ├─73569 /usr/bin/netdata --special-spawn-server
             ├─73715 bash /usr/lib/netdata/plugins.d/tc-qos-helper.sh 1
             ├─73720 /usr/lib/netdata/plugins.d/nfacct.plugin 1
             └─73723 /usr/lib/netdata/plugins.d/apps.plugin 1
Step 3 – Access Netdata Monitoring Dashboard
At this point, Netdata is started and listens on port 19999. You can check it with the following command.
ss -antpl | grep 19999
You should see the following output.
LISTEN 0      0            0.0.0.0:19999      0.0.0.0:*    users:(("netdata",pid=73567,fd=6))
LISTEN 0      0                  *:19999            *:*    users:(("netdata",pid=73567,fd=7))
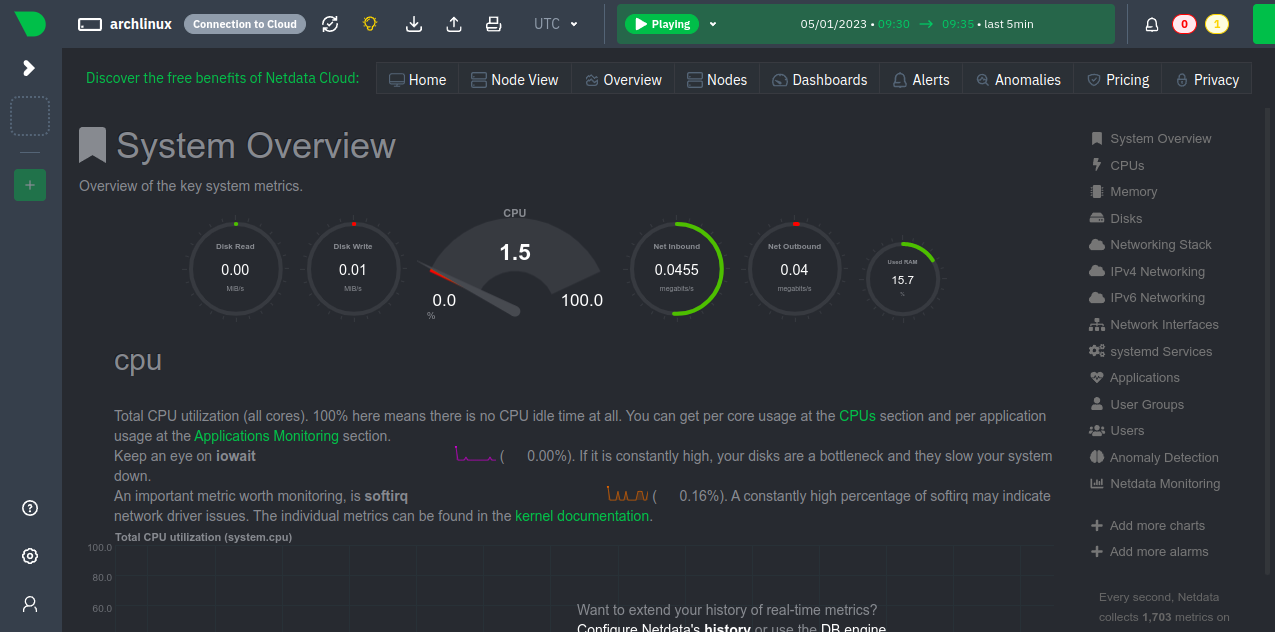
Now, open your web browser and access the Netdata web interface using the URL http://your-server-ip:19999. You should see the Netdata dashboard on the following screen.
System Overview
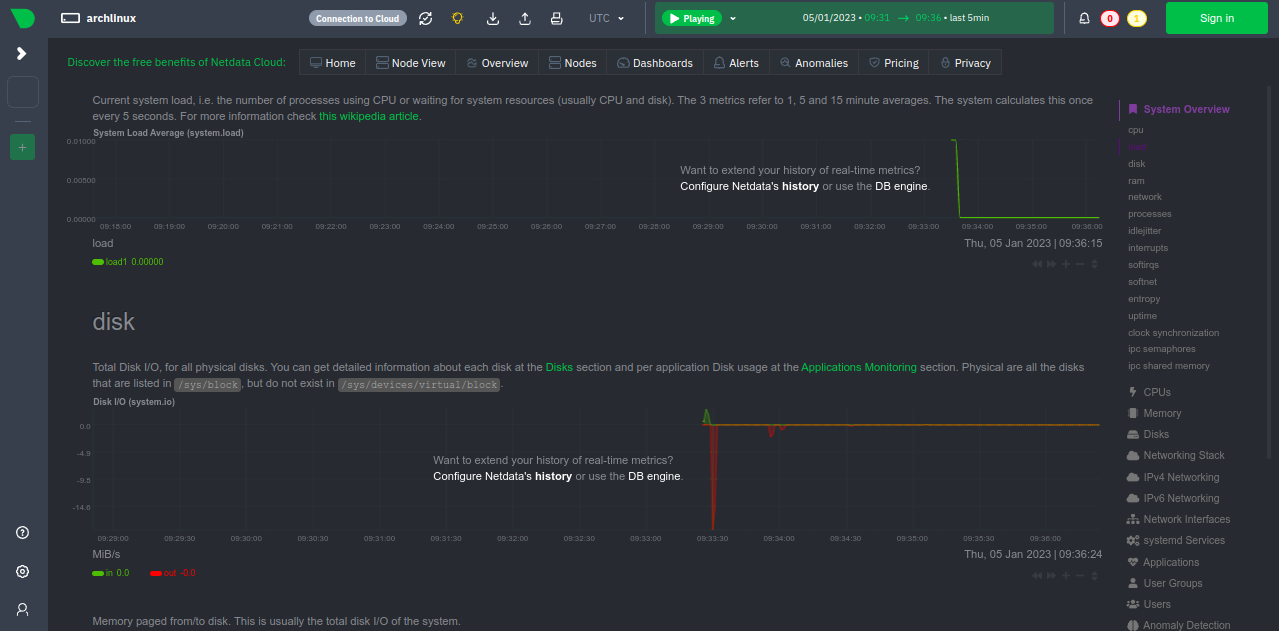
Disk Usage
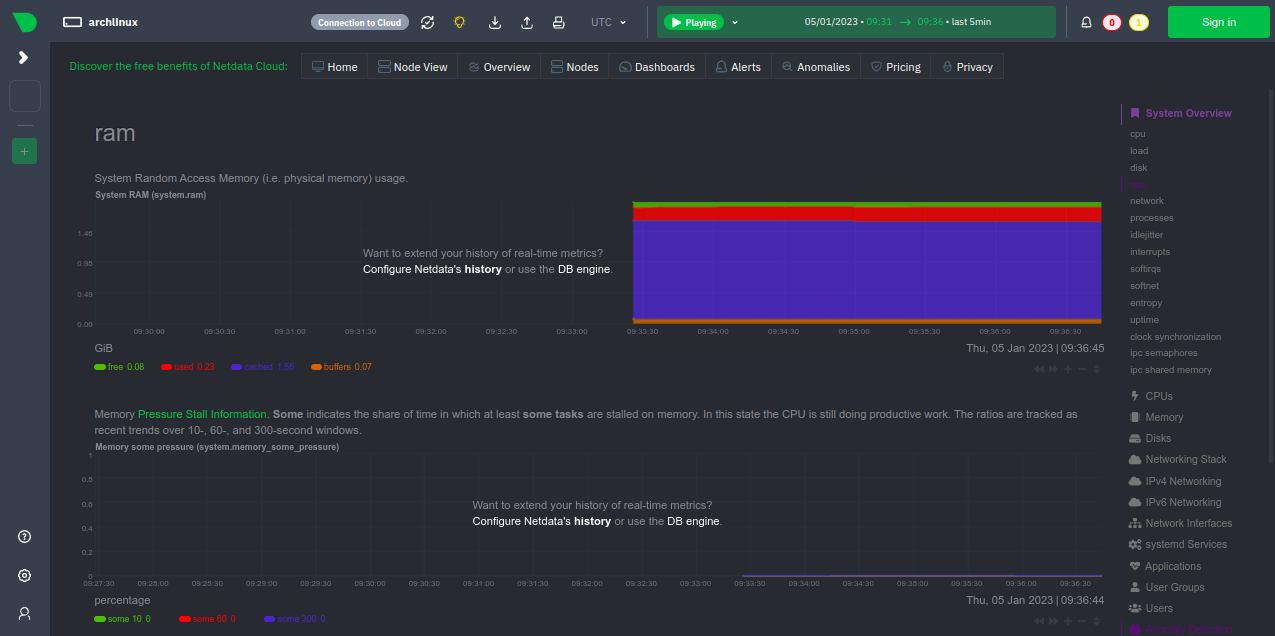
Memory Usage
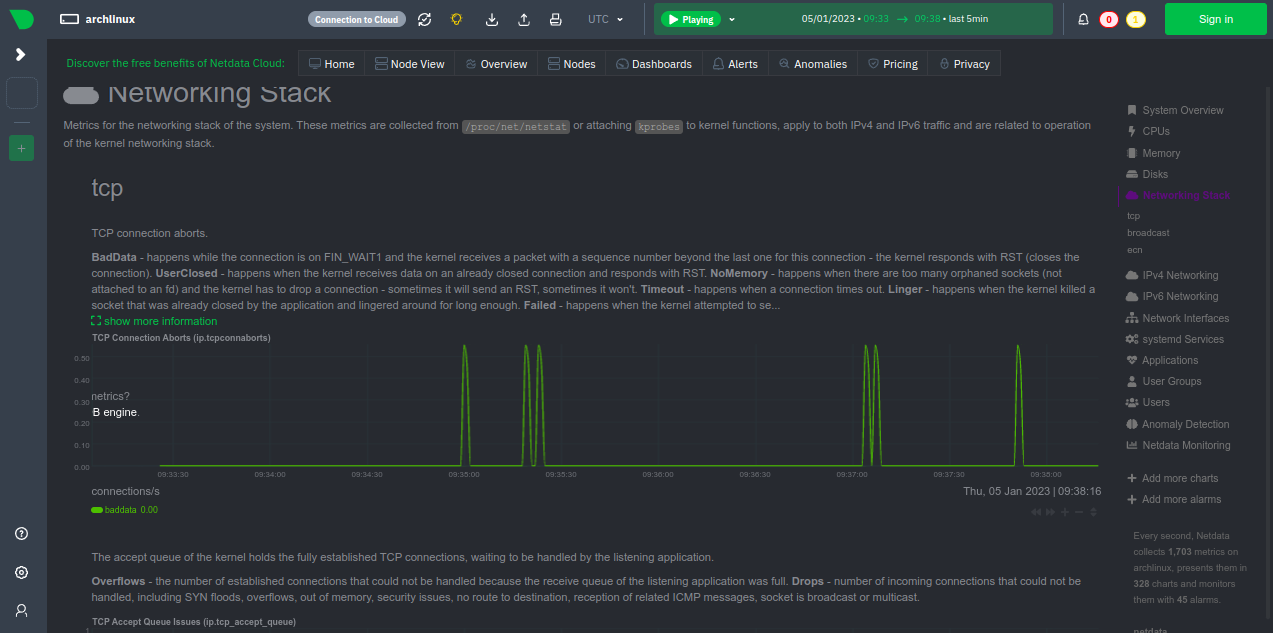
Networking State
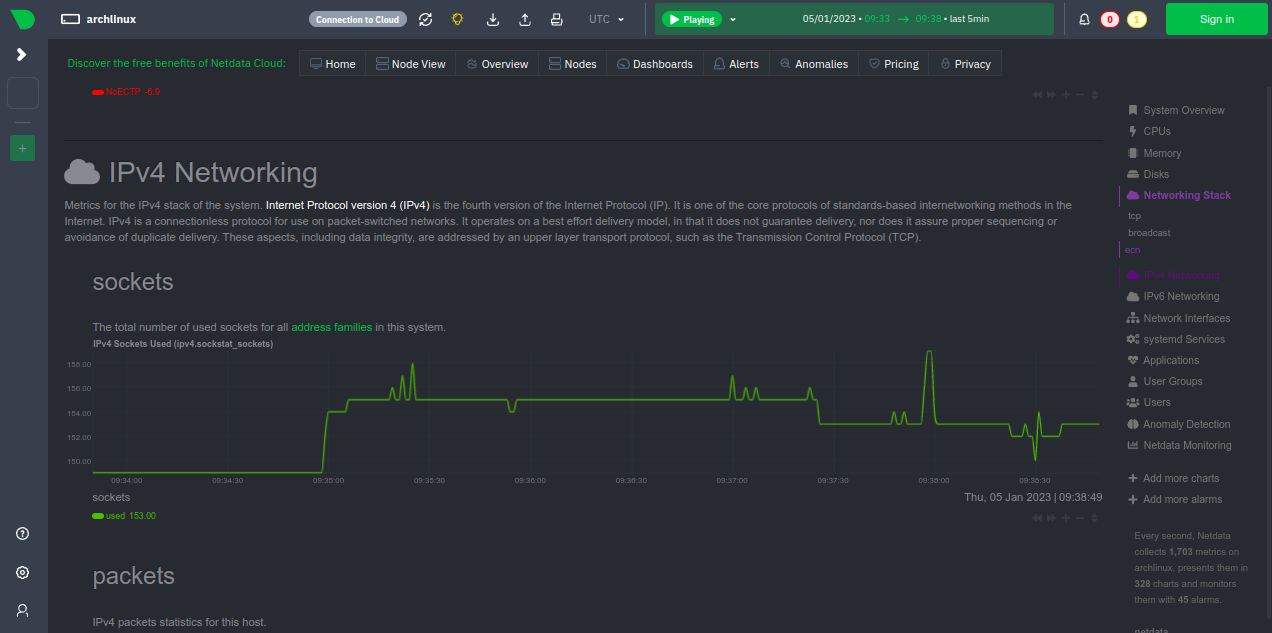
IPv4 Networking
Conclusion
In this guide, we explained how to install the Netdata monitoring tool on Arch Linux. You can now install the Netdata agent on the client machine and start monitoring them via the Netdata dashboard. You can now deploy the Netdata monitoring tool on dedicated server hosting from Atlantic.Net!
* This post is for informational purposes only and does not constitute professional, legal, financial, or technical advice. Each situation is unique and may require guidance from a qualified professional.
Readers should conduct their own due diligence before making any decisions.