Monitoring the performance of the CPU is an essential task for any system administrator who needs to measure the performance of a system. This will help you to debug system processes, manage system resources, and make system decisions. There are several tools available for checking CPU usage in Linux.
In this post, we will demonstrate a few methods to check and monitor CPU usage in Linux. NOTE: This article assumes that your base system is updated with the latest available packages.
1. Check CPU Usage with top Command
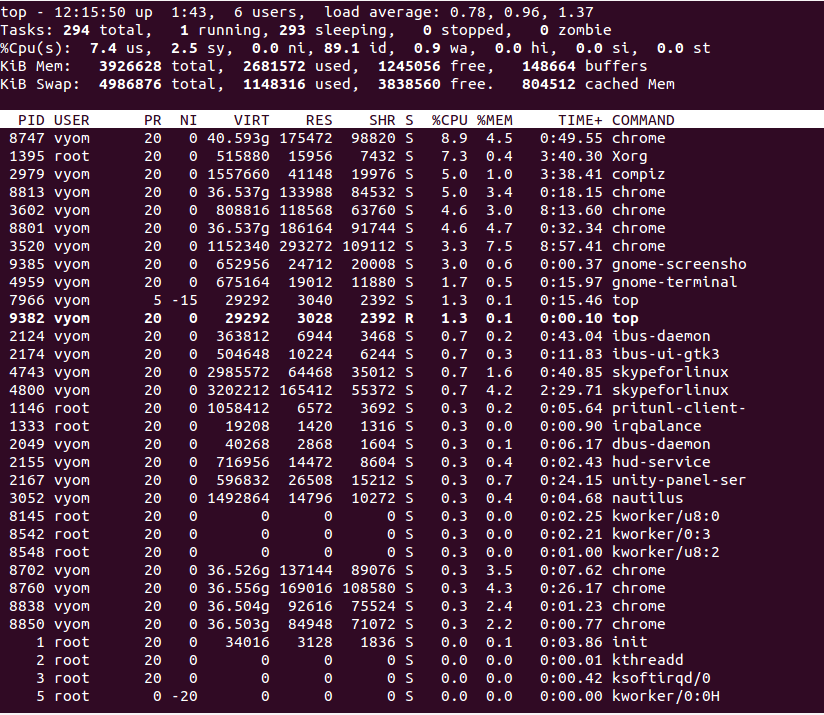
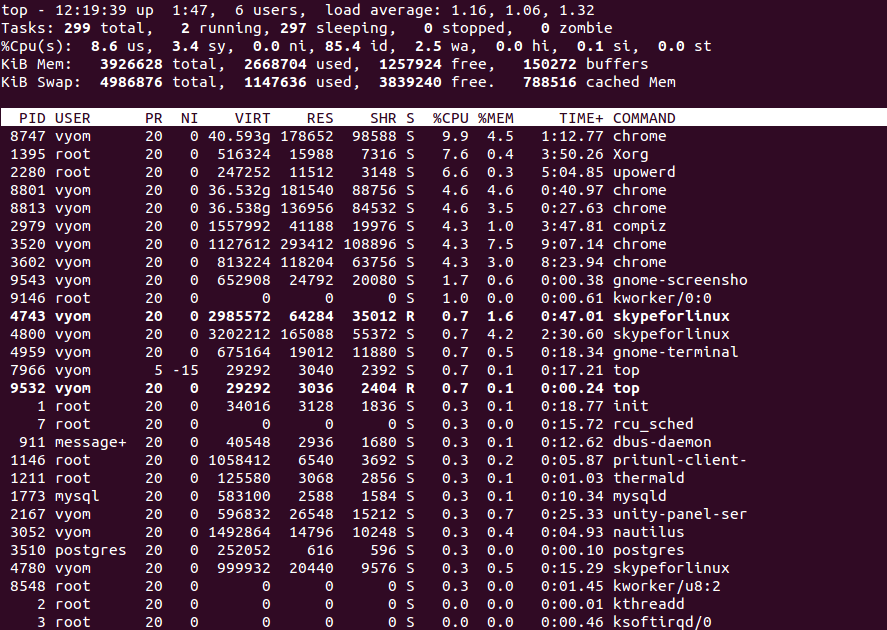
Top is a very useful command-line tool that helps you to monitor all running processes in real-time. It will display information about the readout of users, tasks, CPU load, and memory usage in real-time. By default, the top command updates the data every 5 seconds.
Now, let’s start using the top command to monitor the CPU usage:
top
You should see the all running processes on the following screen:
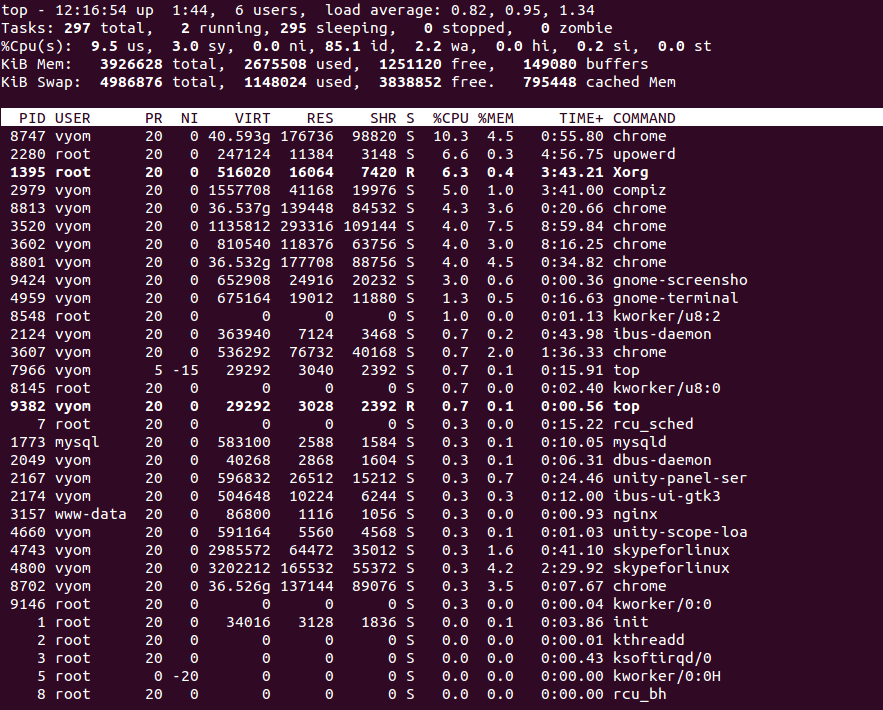
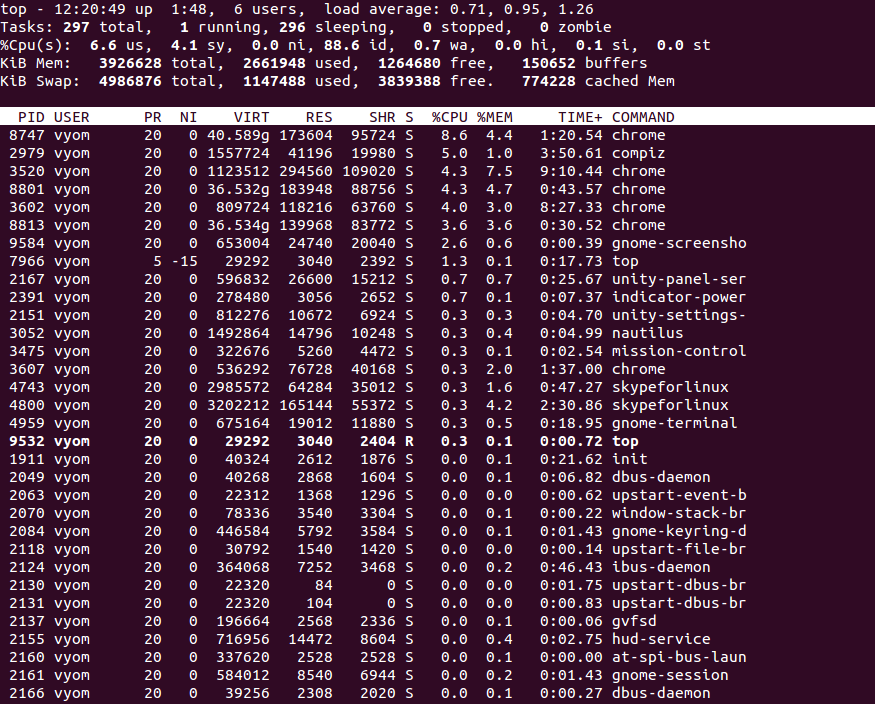
Type P to sort all running processes by CPU usage. You should see the following screen:
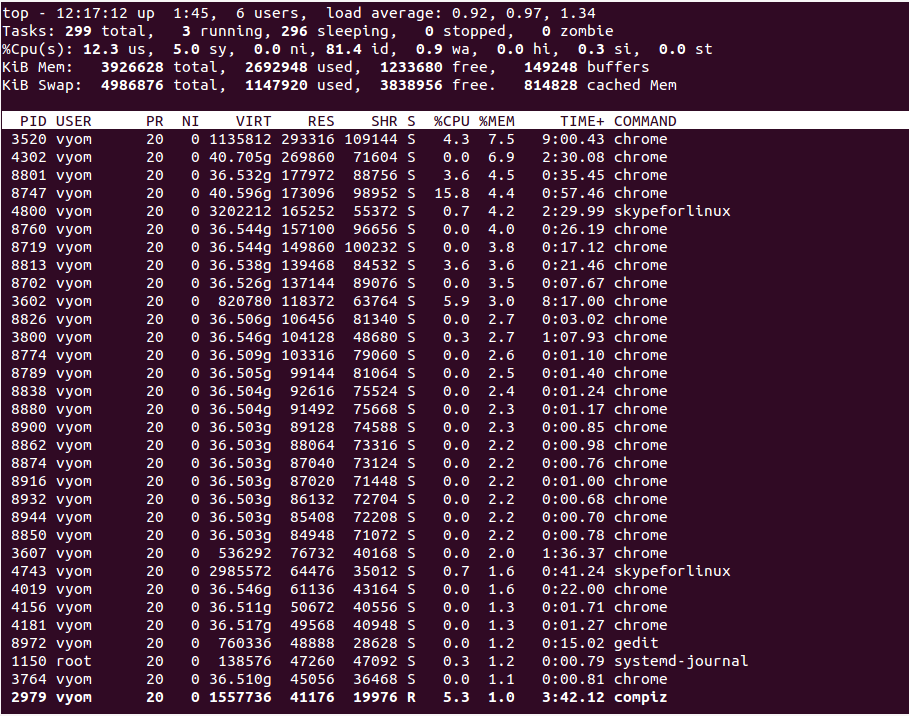
Type M to sort all running processes by Memory usage. You should see the following screen:
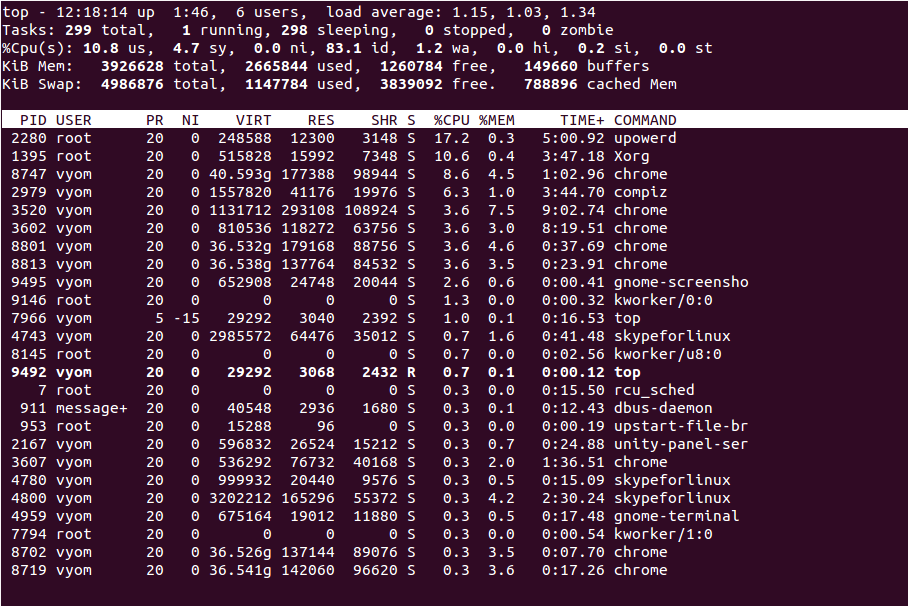
Type I to hide all idle processes. You should see the following screen:
Type S to sort all processes by how long the processes have been running:
Type U to view all processes owned by a specific user. You should see the following screen:
2. Check CPU Usage with mpstat Command
Mpstat is a part of the sysstat package.
For Debian or Ubuntu operating systems, you can install it using the following command:
apt-get install sysstat -y
For CentOS or RHEL operating systems, you can install it using the following command:
yum install sysstat -y
Now, run the mpstat command without any options. This will display usage for each processor:
mpstat
Sample output:
Linux 4.4.0-148-generic (newpc) 	Monday 23 August 2021 	_x86_64_	(4 CPU)

12:28:46  IST  CPU    %usr   %nice    %sys %iowait    %irq   %soft  %steal  %guest  %gnice   %idle
12:28:46  IST  all   18.30    0.01    3.44    8.26    0.00    0.16    0.00    0.00    0.00   69.82
To display a report for the first processor, run:
mpstat -P 0
Sample output:
Linux 4.4.0-148-generic (newpc) 	Monday 23 August 2021 	_x86_64_	(4 CPU)

12:29:35  IST  CPU    %usr   %nice    %sys %iowait    %irq   %soft  %steal  %guest  %gnice   %idle
12:29:35  IST    0   18.16    0.01    3.94    8.68    0.00    0.27    0.00    0.00    0.00   68.93
To display the report of all processors, run:
mpstat -P ALL
Sample output:
Linux 4.4.0-148-generic (newpc) 	Monday 23 August 2021 	_x86_64_	(4 CPU)

12:45:50  IST  CPU    %usr   %nice    %sys %iowait    %irq   %soft  %steal  %guest  %gnice   %idle
12:45:50  IST  all   16.38    0.01    3.11    7.33    0.00    0.15    0.00    0.00    0.00   73.02
12:45:50  IST    0   16.28    0.01    3.58    7.76    0.00    0.25    0.00    0.00    0.00   72.12
12:45:50  IST    1   16.25    0.01    3.06    7.10    0.00    0.05    0.00    0.00    0.00   73.52
12:45:50  IST    2   16.38    0.01    2.87    7.39    0.00    0.24    0.00    0.00    0.00   73.11
12:45:50  IST    3   16.60    0.01    2.93    7.07    0.00    0.06    0.00    0.00    0.00   73.34
To display average CPU usage for 3 times at 2-second intervals:
mpstat -P ALL 2 3
Sample output:
Linux 4.4.0-148-generic (newpc) 	Monday 23 August 2021 	_x86_64_	(4 CPU)

12:47:58  IST  CPU    %usr   %nice    %sys %iowait    %irq   %soft  %steal  %guest  %gnice   %idle
12:48:00  IST  all   23.30    0.00    4.99    4.74    0.00    0.00    0.00    0.00    0.00   66.97
12:48:00  IST    0   29.02    0.00    5.18    6.74    0.00    0.00    0.00    0.00    0.00   59.07
12:48:00  IST    1   26.53    0.00    6.12    4.59    0.00    0.51    0.00    0.00    0.00   62.24
12:48:00  IST    2   22.96    0.00    3.57    2.04    0.00    0.00    0.00    0.00    0.00   71.43
12:48:00  IST    3   14.14    0.00    5.05    5.56    0.00    0.00    0.00    0.00    0.00   75.25

12:48:00  IST  CPU    %usr   %nice    %sys %iowait    %irq   %soft  %steal  %guest  %gnice   %idle
12:48:02  IST  all   21.58    0.00    5.87    5.11    0.00    0.13    0.00    0.00    0.00   67.31
12:48:02  IST    0   25.13    0.00    9.23    9.23    0.00    0.51    0.00    0.00    0.00   55.90
12:48:02  IST    1   28.72    0.00    7.18    8.21    0.00    0.00    0.00    0.00    0.00   55.90
12:48:02  IST    2   18.88    0.00    3.06    1.53    0.00    0.00    0.00    0.00    0.00   76.53
12:48:02  IST    3   13.85    0.00    4.10    1.03    0.00    0.00    0.00    0.00    0.00   81.03

12:48:02  IST  CPU    %usr   %nice    %sys %iowait    %irq   %soft  %steal  %guest  %gnice   %idle
12:48:04  IST  all   24.78    0.00    5.11    5.87    0.00    0.13    0.00    0.00    0.00   64.11
12:48:04  IST    0   30.37    0.00    3.66   10.47    0.00    0.00    0.00    0.00    0.00   55.50
12:48:04  IST    1   27.78    0.00    6.06    9.09    0.00    0.00    0.00    0.00    0.00   57.07
12:48:04  IST    2   23.23    0.00    5.56    1.01    0.00    0.00    0.00    0.00    0.00   70.20
12:48:04  IST    3   17.86    0.00    5.10    3.57    0.00    0.51    0.00    0.00    0.00   72.96

Average:     CPU    %usr   %nice    %sys %iowait    %irq   %soft  %steal  %guest  %gnice   %idle
Average:     all   23.22    0.00    5.33    5.24    0.00    0.09    0.00    0.00    0.00   66.13
Average:       0   28.15    0.00    6.04    8.81    0.00    0.17    0.00    0.00    0.00   56.82
Average:       1   27.67    0.00    6.45    7.30    0.00    0.17    0.00    0.00    0.00   58.40
Average:       2   21.69    0.00    4.07    1.53    0.00    0.00    0.00    0.00    0.00   72.71
Average:       3   15.28    0.00    4.75    3.40    0.00    0.17    0.00    0.00    0.00   76.40
3. Check CPU Usage with sar Command
The sar command is also used for collecting and reporting system activity information.
You can use the sar command with the -u option to track CPU performance. The following command will display CPU usage every 2 seconds.
sar -u 2
Sample output:
Linux 4.4.0-148-generic (newpc) 	Monday 23 August 2021 	_x86_64_	(4 CPU)

12:53:26  IST     CPU     %user     %nice   %system   %iowait    %steal     %idle
12:53:28  IST     all      5.30      0.00      2.02      2.52      0.00     90.16
12:53:30  IST     all      2.90      0.00      1.39      1.13      0.00     94.58
12:53:32  IST     all      3.57      0.00      2.04      0.76      0.00     93.63
The above command will run indefinitely. You can stop it using CTRL+C.
4. Check CPU Usage with iostat Command
The iostat displays information on device utilization and the system’s average CPU utilization since the last reboot.
Run the iostat command without any option will display the information about CPU utilization, device utilization, and network file system utilization.
iostat
You should see the following output:
Linux 4.4.0-148-generic (newpc) 	Monday 23 August 2021 	_x86_64_	(4 CPU)

avg-cpu:  %user   %nice %system %iowait  %steal   %idle
          16.41    0.01    3.31    6.83    0.00   73.44

Device:            tps    kB_read/s    kB_wrtn/s    kB_read    kB_wrtn
loop0             0.01         0.04         0.00        373          0
loop1             0.01         0.04         0.00        387          0
loop2             2.59         2.62         0.00      23279          0
loop3             0.00         0.01         0.00        116          0
loop4             0.01         0.02         0.00        143          0
loop5            28.67        28.70         0.00     255344          0
loop6             0.01         0.04         0.00        385          0
loop7             0.00         0.01         0.00        121          0
sda              34.36       383.67       600.72    3413776    5345096
Use the -c option to break the CPU utilization into user processes, system processes, I/O wait, and idle time.
iostat -c
Sample output:
Linux 4.4.0-148-generic (newpc) 	Monday 23 August 2021 	_x86_64_	(4 CPU)

avg-cpu:  %user   %nice %system %iowait  %steal   %idle
          16.40    0.01    3.31    6.82    0.00   73.46
5. Check CPU Usage with vmstat Command
The vmstat command will display the information about system processes, memory, swap, I/O, and CPU performance. It will display the average details since the last reboot.
Run the vmstat command without any options as shown below:
vmstat
Sample output:
procs -----------memory---------- ---swap-- -----io---- -system-- ------cpu-----
 r  b   swpd   free   buff  cache   si   so    bi    bo   in   cs us sy id wa st
 3  1 1028672 130972 124344 1212276   19   71   101   150  341  818 17  3 73  7  0
The following command will update vmstat report every 2 seconds:
vmstat 2
Sample output:
procs -----------memory---------- ---swap-- -----io---- -system-- ------cpu-----
 r  b   swpd   free   buff  cache   si   so    bi    bo   in   cs us sy id wa st
 2  1 1032572 233396 125196 1129256   19   70   100   149  345  830 17  3 73  7  0
 2  0 1032572 232976 125212 1129596    0    0     0   112 3051 8697 40 10 42  8  0
 0  1 1032572 233040 125224 1130468    0    0     0  1510 3109 8631 43  9 41  8  0
Press CTRL+C to close the vmstat.
Conclusion
In the above guide, we explained different methods to check CPU usage in Linux. These tools can help you to track processor usage and the performance of your system. Give it a try today on your VPS from Altantic.Net.