Table of Contents
- Step 1 - Add Grafana Repository
- Step 2 - Install and Configure Grafana
- Step 3 - Install and Configure Nginx
- Step 4 - Install and Configure Prometheus
- Step 5 - Create a Systemd Service File for Prometheus
- Step 6 - Install node_exporter
- Step 7 - Add node_exporter to Prometheus
- Step 8 - Access Prometheus Dashboard
- Conclusion
Grafana is a leading open-source analytics and visualization platform that excels in monitoring, analysis, and observability. Originally created by Torkel Ödegaard in 2014, Grafana has evolved into a robust tool widely adopted by organizations and individuals alike for visualizing time-series data from various sources. Its flexibility, extensibility, and user-friendly interface make it a preferred choice for monitoring and analyzing complex systems, infrastructure, applications, and IoT devices.
In this guide, we will explain how to install Grafana and Prometheus on Ubuntu 24.04.
Step 1 – Add Grafana Repository
First, install all the required dependencies using the following command.
apt install gnupg2 apt-transport-https software-properties-common wget
Next, download and add the Grafana GPG key.
wget -q -O - https://packages.grafana.com/gpg.key > grafana.key
cat grafana.key | gpg --dearmor | tee /etc/apt/trusted.gpg.d/grafana.gpg > /dev/null
Then, add the Grafana repository to your APT source file.
echo 'deb [signed-by=/etc/apt/trusted.gpg.d/grafana.gpg] https://packages.grafana.com/oss/deb stable main' | tee /etc/apt/sources.list.d/grafana.list
Next, update the repository index using the following command.
apt update
Step 2 – Install and Configure Grafana
Now you can install Grafana with the following command.
apt install grafana
Once Grafana is installed, reload the systemd daemon.
systemctl daemon-reload
Next, start the Grafana service using the following command.
systemctl start grafana-server
You can now check the status of Grafana using the following command.
systemctl status grafana-server
Output.
● grafana-server.service - Grafana instance
     Loaded: loaded (/lib/systemd/system/grafana-server.service; disabled; vendor preset: enabled)
     Active: active (running) since Fri 2025-05-09 09:07:55 UTC; 5ms ago
       Docs: http://docs.grafana.org
   Main PID: 57756 ((grafana))
      Tasks: 1 (limit: 4579)
     Memory: 256.0K
        CPU: 291us
     CGroup: /system.slice/grafana-server.service
             └─57756 "(grafana)"

May 09 09:07:55 ubuntu24 systemd[1]: Started Grafana instance.
Next, edit the Grafana configuration file.
nano /etc/grafana/grafana.ini
Change the following lines.
http_addr =  127.0.0.1

# The http port  to use
http_port = 3000

# The public facing domain name used to access grafana from a browser
domain = grafana.example.com
Save and close the file, then restart the Grafana service to apply the changes.
systemctl restart grafana-server
Step 3 – Install and Configure Nginx
First, install the Nginx package.
apt install nginx
Next, create an Nginx virtual host configuration file.
nano /etc/nginx/conf.d/grafana.conf
Add the following configurations.
# this is required to proxy Grafana Live WebSocket connections.
map $http_upgrade $connection_upgrade {
  default upgrade;
  '' close;
}

server {
  listen      80;
  server_name grafana.example.com;


  access_log /var/log/nginx/grafana-access.log;
  error_log /var/log/nginx/grafana-error.log;

  location / {
    proxy_set_header Host $http_host;
    proxy_pass http://localhost:3000/;
  }

  # Proxy Grafana Live WebSocket connections.
  location /api/live {
    rewrite  ^/(.*)  /$1 break;
    proxy_http_version 1.1;
    proxy_set_header Upgrade $http_upgrade;
    proxy_set_header Connection $connection_upgrade;
    proxy_set_header Host $http_host;
    proxy_pass http://localhost:3000/;
  }
}
Save and close the file, then restart the Nginx service to apply the changes.
systemctl restart nginx
Now, open your web browser and access Grafana using the URL http://grafana.example.com; you will see the Grafana login page.

Provide the Grafana default username and password as admin/admin, then click on the Login button. You will see the Grafana change password screen.
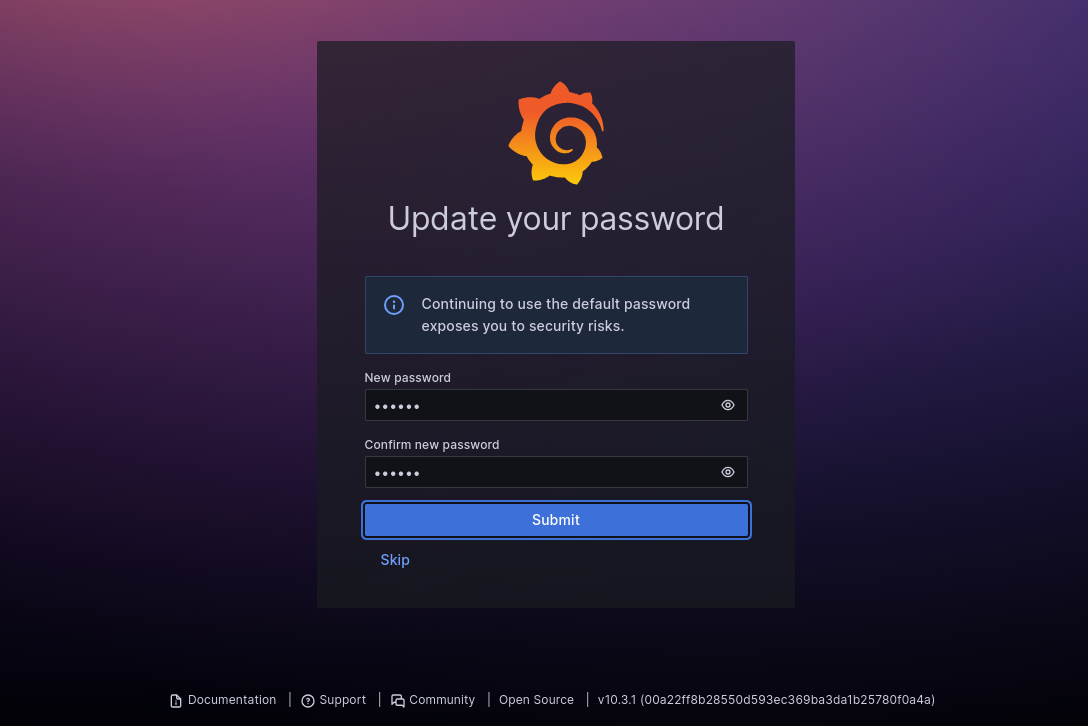
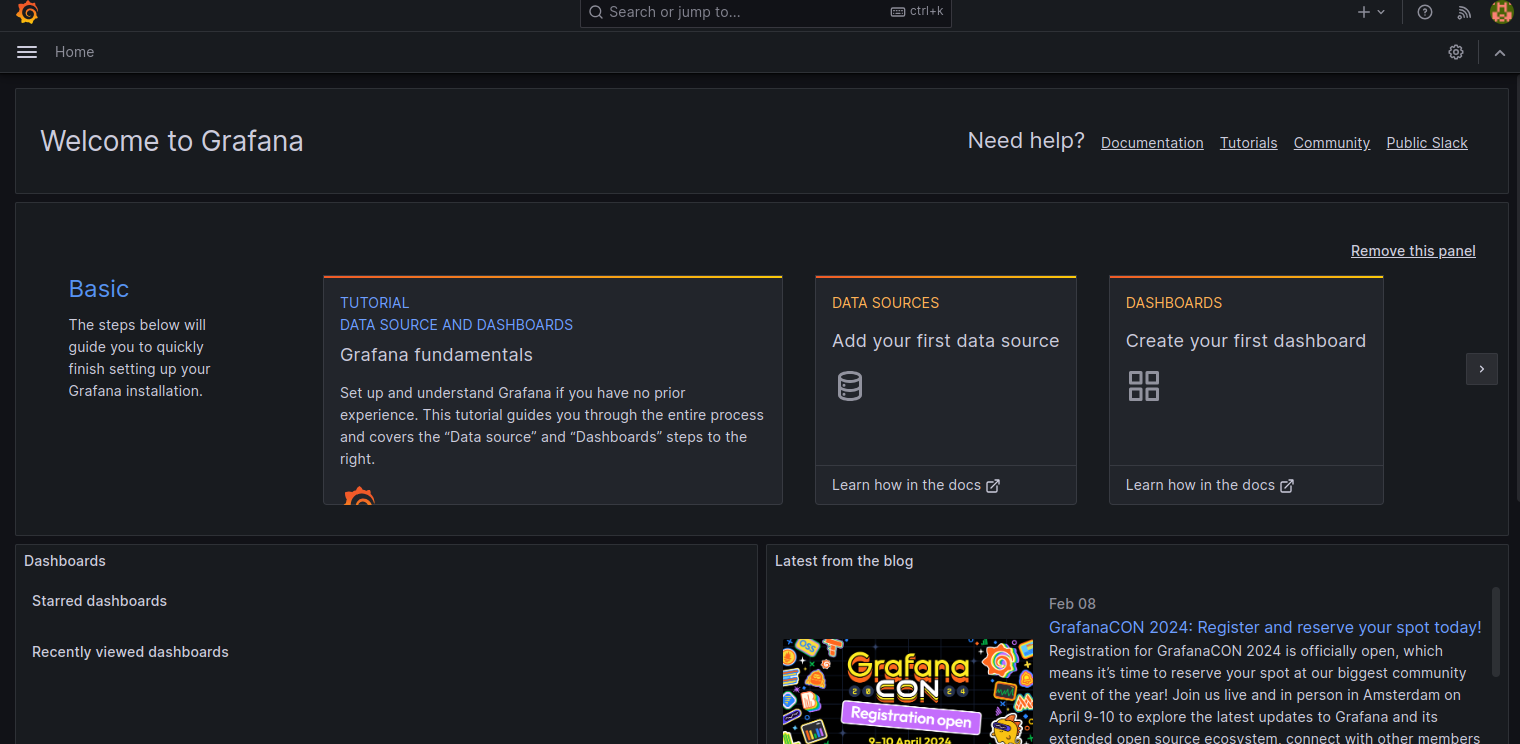
Set your new password and click on the Submit button. You will see the Grafana dashboard on the following screen.
Step 4 – Install and Configure Prometheus
First, add a user and group for Prometheus.
groupadd --system prometheus
useradd -s /sbin/nologin --system -g prometheus prometheus
Next, create the required directories for Prometheus.
mkdir /var/lib/prometheus
for i in rules rules.d files_sd; do mkdir -p /etc/prometheus/${i}; done
Next, download the latest version of Prometheus from the Git repo.
curl -s https://api.github.com/repos/prometheus/prometheus/releases/latest|grep browser_download_url|grep linux-amd64|cut -d '"' -f 4|wget -qi -
Once the download is completed, extract the downloaded file.
tar xvf prometheus*.tar.gz
Next, change the directory to Prometheus and copy all required files to desired locations.
cd prometheus*/
mv prometheus promtool /usr/local/bin/
mv prometheus.yml /etc/prometheus/
Set necessary permissions on the Prometheus directory.
for i in rules rules.d files_sd; do chown -R prometheus:prometheus /etc/prometheus/${i}; done
for i in rules rules.d files_sd; do chmod -R 775 /etc/prometheus/${i}; done
chown -R prometheus:prometheus /var/lib/prometheus/
Next, install the Apache utils package.
apt install apache2-utils -y
Next, add a user for Prometheus.
htpasswd -nB hitesh
Set your password as shown below:
New password:
Re-type new password:
hitesh:$2y$05$rAWBwQJAByNKU6FncX33p.uZ1tPTqqc6LHVP2yGm3ZFnSnhrvdpne
Next, create the Prometheus main configuration file.
nano /etc/prometheus/web.yml
Define your username and password.
basic_auth_users:
  hitesh: $2y$05$rAWBwQJAByNKU6FncX33p.uZ1tPTqqc6LHVP2yGm3ZFnSnhrvdpne
Next, change ownership of the Prometheus configuration file.
chown prometheus: /etc/prometheus/web.yml
Next, edit the Prometheus configuration file.
nano /etc/prometheus/prometheus.yml
Change the following lines:
scrape_configs:
  # The job name is added as a label `job=` to any timeseries scraped from this config.
  - job_name: "prometheus"

    # metrics_path defaults to '/metrics'
    # scheme defaults to 'http'.

    basic_auth:
      username: 'admin'
      password: 'uniquepass'

    static_configs:
      - targets: ["127.0.0.1:9090"]
Save and close the file when you are done.
Step 5 – Create a Systemd Service File for Prometheus
Next, create a systemd file to manage the Prometheus service.
nano /etc/systemd/system/prometheus.service
Add the following configuration.
[Unit]
Description=Prometheus
Documentation=https://prometheus.io/docs/introduction/overview/
Wants=network-online.target
After=network-online.target

[Service]
Type=simple
User=prometheus
Group=prometheus
ExecReload=/bin/kill -HUP $MAINPID
ExecStart=/usr/local/bin/prometheus \
  --config.file=/etc/prometheus/prometheus.yml \
  --storage.tsdb.path=/var/lib/prometheus \
  --web.listen-address=0.0.0.0:9090 \
  --web.config.file=/etc/prometheus/web.yml \

SyslogIdentifier=prometheus
Restart=always

[Install]
WantedBy=multi-user.target
Save the file, then reload the systemd daemon to apply the changes.
systemctl daemon-reload
Next, start and enable the Prometheus service.
systemctl start prometheus
systemctl enable prometheus
You can now check the status of the Prometheus service using the following command.
systemctl status prometheus
Output.
● prometheus.service - Prometheus
     Loaded: loaded (/etc/systemd/system/prometheus.service; disabled; vendor preset: enabled)
     Active: active (running) since Fri 2025-05-09 09:35:17 UTC; 3s ago
       Docs: https://prometheus.io/docs/introduction/overview/
   Main PID: 58652 (prometheus)
      Tasks: 7 (limit: 4579)
     Memory: 15.4M
        CPU: 59ms
     CGroup: /system.slice/prometheus.service
             └─58652 /usr/local/bin/prometheus --config.file=/etc/prometheus/prometheus.yml --storage.tsdb.path=/var/lib/prometheus --web.console.templates=/etc/promet>
Step 6 – Install node_exporter
The node_exporter is used to gather system metrics and expose an HTTP API that runs on the default TCP port ‘9100’.
First, download the latest version of node_exporter.
curl -s https://api.github.com/repos/prometheus/node_exporter/releases/latest| grep browser_download_url|grep linux-amd64|cut -d '"' -f 4|wget -qi -
Once the download is complete, extract the downloaded file.
tar -xvf node_exporter*.tar.gz
Next, navigate to the extracted directory and copy the node_exporter binary file to the system location.
cd  node_exporter*/
cp node_exporter /usr/local/bin
Now, verify the node_exporter version.
node_exporter --version
Output.
node_exporter, version 1.9.1 (branch: HEAD, revision: 7333465abf9efba81876303bb57e6fadb946041b)
  build user:       root@35918982f6d8
  build date:       20231112-23:53:35
  go version:       go1.23.7
  platform:         linux/amd64
  tags:             netgo osusergo static_build
Next, create a system file to manage the node_exporter service.
nano /etc/systemd/system/node_exporter.service
Add the following configurations.
[Unit]
Description=Node Exporter
Wants=network-online.target
After=network-online.target

[Service]
User=prometheus
ExecStart=/usr/local/bin/node_exporter

[Install]
WantedBy=default.target
Save the file, then reload the system daemon using the following command.
systemctl daemon-reload
Next, start the node_exporter service using the following command.
systemctl start node_exporter
You can verify the status of the node_exporter using the following command.
systemctl status node_exporter
Output.
● node_exporter.service - Node Exporter
     Loaded: loaded (/etc/systemd/system/node_exporter.service; disabled; vendor preset: enabled)
     Active: active (running) since Fri 2025-05-09 09:37:47 UTC; 5s ago
   Main PID: 58716 (node_exporter)
      Tasks: 4 (limit: 4579)
     Memory: 2.4M
        CPU: 7ms
     CGroup: /system.slice/node_exporter.service
             └─58716 /usr/local/bin/node_exporter
Step 7 – Add node_exporter to Prometheus
First, open the Prometheus configuration file.
nano /etc/prometheus/prometheus.yml
Add the following configuration under the scrape_configs section.
scrape_configs:
....
....
  - job_name: "node_exporter"

    static_configs:
      - targets: ["your-server-ip:9100"]
Save and close the file, then restart the Prometheus service to apply the changes.
systemctl restart prometheus
Step 8 – Access Prometheus Dashboard
Now, open your web browser and access Prometheus using the URL http://your-server-ip:9090. You will see the Prometheus login page.
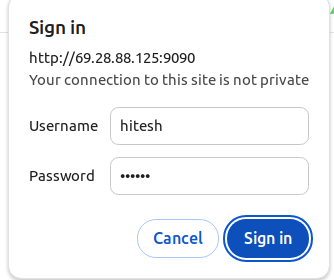
Provide your admin username and password and click on the Sign in. You will see the Prometheus dashboard.
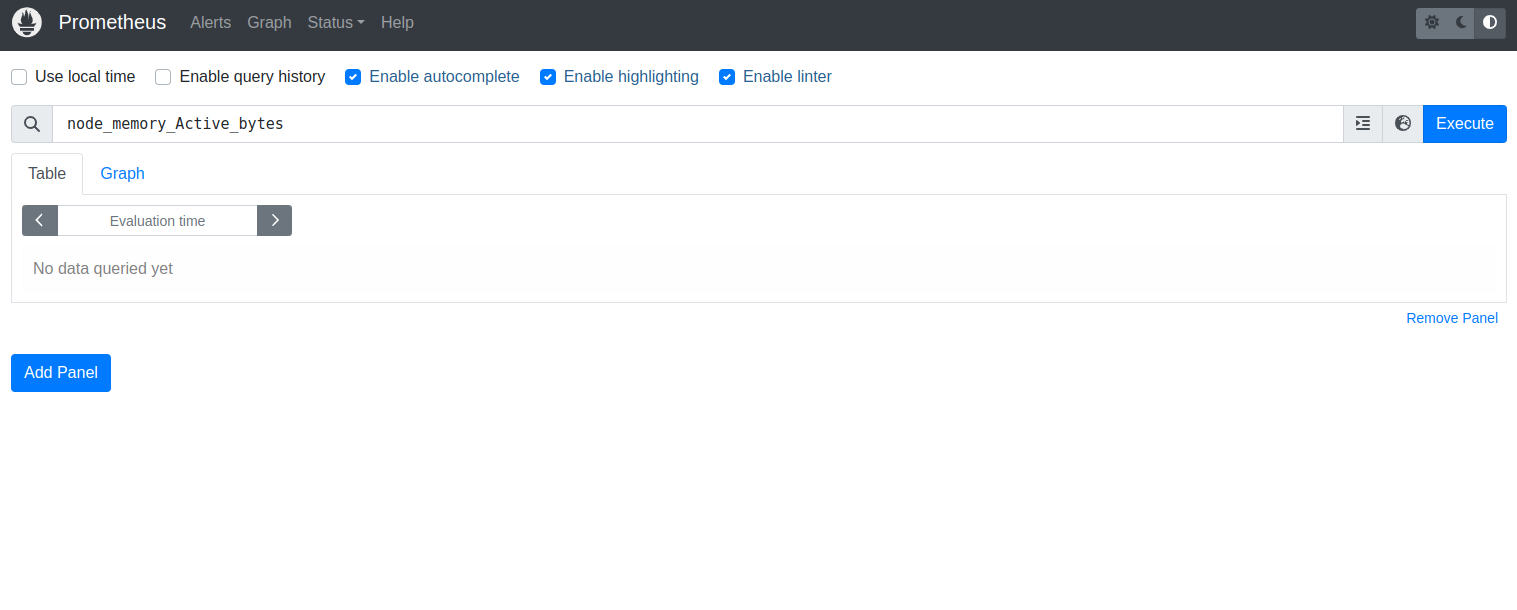
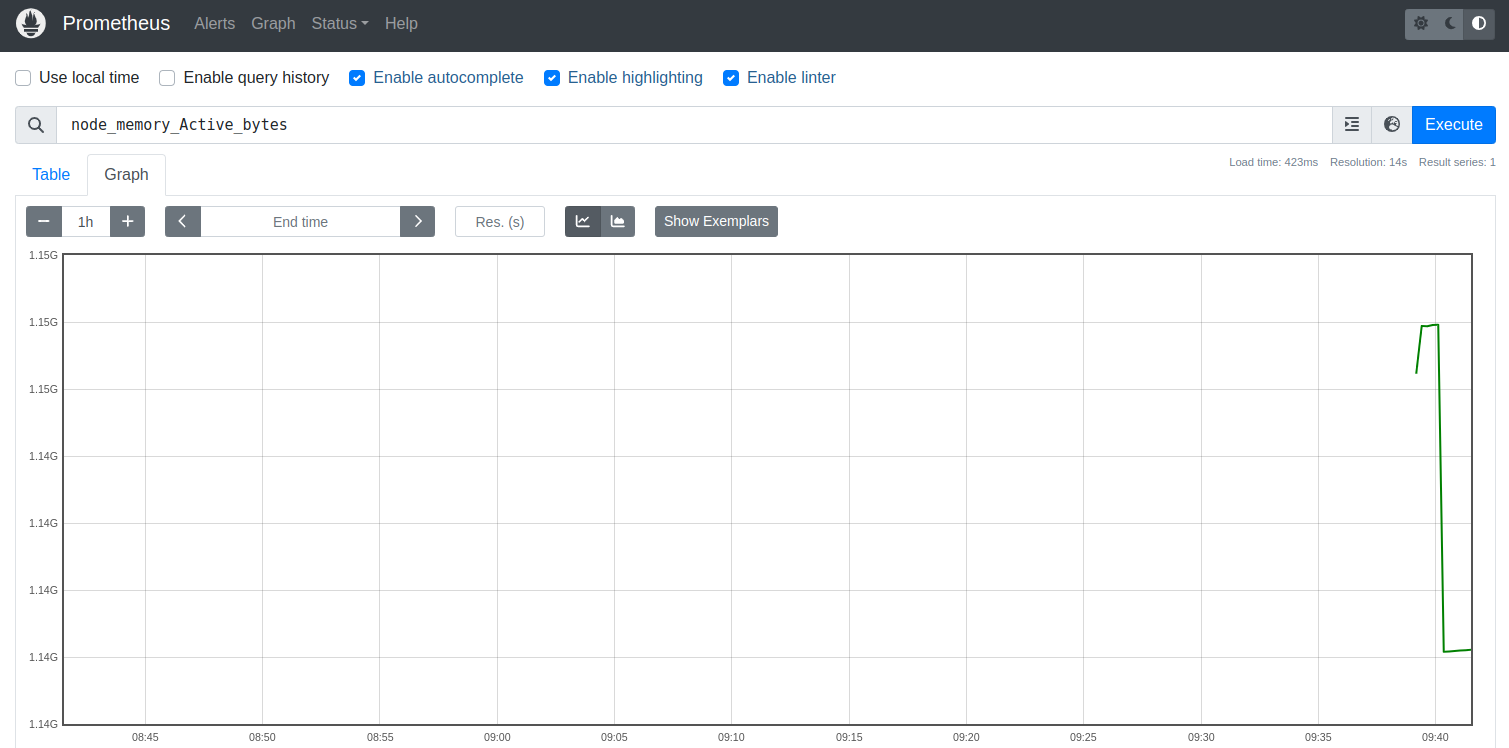
To verify whether the node_exporter is active or not, type the Prometheus query such as ‘node_memory_Active_bytes’ and click ‘Execute’. Then, you’ll receive the simple graph generated by Prometheus.
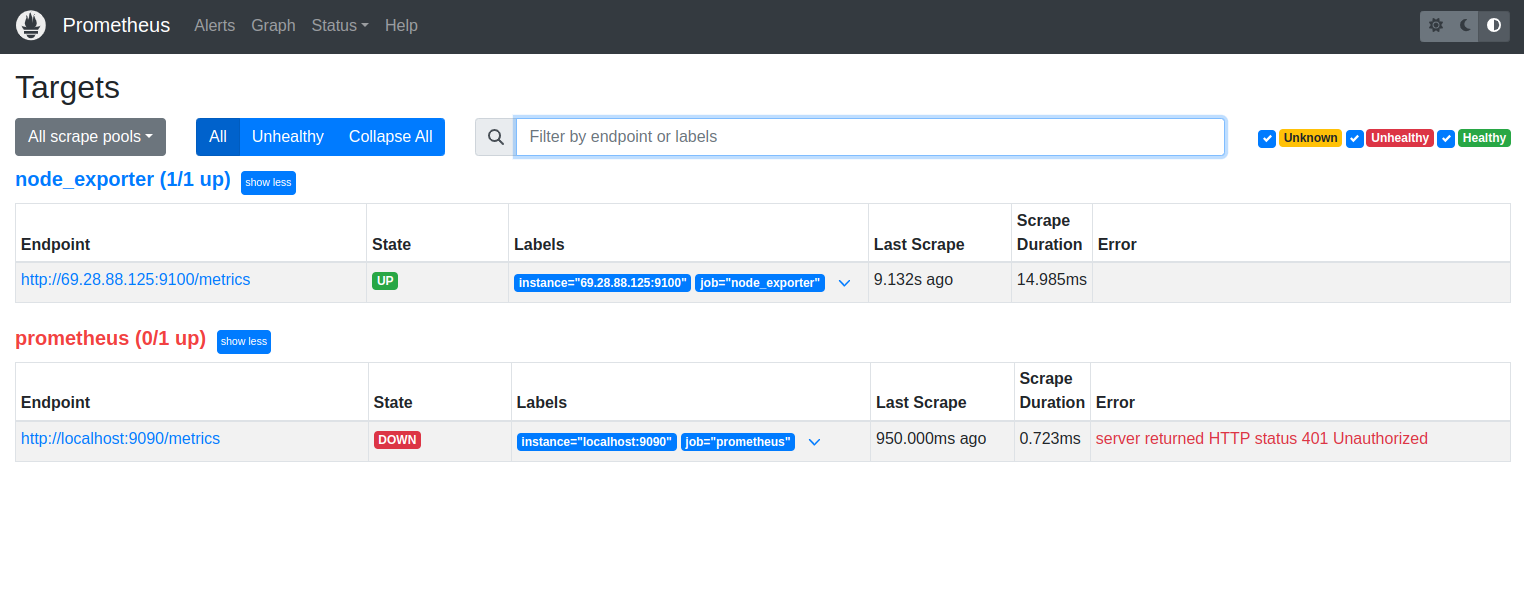
Now click on the ‘Status’ menu at the top and select ‘Targets’. You should see two different target scraps that are active and running. ‘Prometheus’ for gathering Prometheus server metrics, and the ‘node_exporter’ for gathering system metrics.
Conclusion
Throughout this guide, we’ve walked through the steps to install Grafana, configure data sources, create dashboards, and explore its rich features for monitoring and observability.
With Grafana, you can monitor system performance, track key metrics, visualize trends, and troubleshoot issues effectively, empowering you to make informed decisions and optimize your infrastructure, applications, and services. You can now deploy the Grafana and Prometheus monitoring stack on dedicated server hosting from Atlantic.Net!
* This post is for informational purposes only and does not constitute professional, legal, financial, or technical advice. Each situation is unique and may require guidance from a qualified professional.
Readers should conduct their own due diligence before making any decisions.