Prometheus is a free and open-source monitoring solution written in the Go language. It was developed by SoundCloud and adopted by CNCF in 2016. It collects metrics data from HTTP endpoints and stores that data in a time series database. Prometheus helps system administrators diagnose problems. It is an independent service and does not need to rely on remote services like network storage.
In this post, we will show you how to install Prometheus monitoring solution on Arch Linux.
Step 1 – Configure Repository
By default, the default repository is outdated in Arch Linux, so you will need to modify the default mirror list if you have not done so already. You can do it by editing the mirrorlist configuration file:
nano /etc/pacman.d/mirrorlist
Remove all lines and add the following lines:
## Score: 0.7, United States
Server = http://mirror.us.leaseweb.net/archlinux/$repo/os/$arch
## Score: 0.8, United States
Server = http://lug.mtu.edu/archlinux/$repo/os/$arch
Server = http://mirror.nl.leaseweb.net/archlinux/$repo/os/$arch
## Score: 0.9, United Kingdom
Server = http://mirror.bytemark.co.uk/archlinux/$repo/os/$arch
## Score: 1.5, United Kingdom
Server = http://mirrors.manchester.m247.com/arch-linux/$repo/os/$arch
Server = http://archlinux.dcc.fc.up.pt/$repo/os/$arch
## Score: 6.6, United States
Server = http://mirror.cs.pitt.edu/archlinux/$repo/os/$arch
## Score: 6.7, United States
Server = http://mirrors.acm.wpi.edu/archlinux/$repo/os/$arch
## Score: 6.8, United States
Server = http://ftp.osuosl.org/pub/archlinux/$repo/os/$arch
## Score: 7.1, India
Server = http://mirror.cse.iitk.ac.in/archlinux/$repo/os/$arch
## Score: 10.1, United States
Server = http://mirrors.xmission.com/archlinux/$repo/os/$arch
Save and close the file then update all the package indexes with the following command:
pacman -Syu
Step 2 – Install Prometheus Arch Linux
By default, the Prometheus package is included in the Arch Linux default repository. You can install it using the following command.
pacman -S prometheus
After installing Prometheus, start the Prometheus service and enable it to start at system reboot.
systemctl start prometheus
systemctl start prometheus
To verify the Prometheus service status, run the following command.
systemctl status prometheus
You should see the following output.
● prometheus.service - Prometheus service
     Loaded: loaded (/usr/lib/systemd/system/prometheus.service; disabled; preset: disabled)
     Active: active (running) since Mon 2023-02-06 08:17:38 UTC; 7s ago
   Main PID: 57007 (prometheus)
      Tasks: 6 (limit: 2362)
     Memory: 29.4M
     CGroup: /system.slice/prometheus.service
             └─57007 /usr/bin/prometheus --config.file=/etc/prometheus/prometheus.yml --storage.tsdb.path=/var/lib/prometheus/data

Feb 06 08:17:38 archlinux prometheus[57007]: ts=2023-02-06T08:17:38.749Z caller=tls_config.go:232 level=info component=web msg="Listening on">
Feb 06 08:17:38 archlinux prometheus[57007]: ts=2023-02-06T08:17:38.749Z caller=tls_config.go:235 level=info component=web msg="TLS is disabl>
Feb 06 08:17:38 archlinux prometheus[57007]: ts=2023-02-06T08:17:38.749Z caller=head.go:683 level=info component=tsdb msg="WAL segment loaded>
Feb 06 08:17:38 archlinux prometheus[57007]: ts=2023-02-06T08:17:38.749Z caller=head.go:720 level=info component=tsdb msg="WAL replay complet>
Feb 06 08:17:38 archlinux prometheus[57007]: ts=2023-02-06T08:17:38.751Z caller=main.go:1014 level=info fs_type=EXT4_SUPER_MAGIC
Feb 06 08:17:38 archlinux prometheus[57007]: ts=2023-02-06T08:17:38.751Z caller=main.go:1017 level=info msg="TSDB started"
Feb 06 08:17:38 archlinux prometheus[57007]: ts=2023-02-06T08:17:38.751Z caller=main.go:1197 level=info msg="Loading configuration file" file>
Feb 06 08:17:38 archlinux prometheus[57007]: ts=2023-02-06T08:17:38.786Z caller=main.go:1234 level=info msg="Completed loading of configurati>
Feb 06 08:17:38 archlinux prometheus[57007]: ts=2023-02-06T08:17:38.786Z caller=main.go:978 level=info msg="Server is ready to receive web re>
Feb 06 08:17:38 archlinux prometheus[57007]: ts=2023-02-06T08:17:38.786Z caller=manager.go:953 level=i
At this point, Prometheus is installed and listens on port 9090. You can verify it using the following command.
ss -antpl | grep prometheus
You will get the following output.
LISTEN 0 0 *:9090 *:* users:(("prometheus",pid=57007,fd=7))
Step 3 – Configure Nginx as a Reverse Proxy for Prometheus
It is always a good idea to use Nginx as a reverse proxy to access Prometheus at port 80.
First, install the Nginx package using the following command.
pacman -S nginx
Once installed, start and enable the Nginx service using the following command.
systemctl start nginx
systemctl enable nginx
Next, create a directory to store the Nginx configuration.
mkdir /etc/nginx/sites-enabled
Next, you will need to define your directory in the Nginx configuration file.
nano /etc/nginx/nginx.conf
Add the following lines below the line http{:
include sites-enabled/*;
server_names_hash_bucket_size 64;
Next, create an Nginx virtual host configuration file with the following command:
nano /etc/nginx/sites-enabled/prometheus.conf
Add the following configuration.
server {
    listen 80;

    server_name prometheus.example.com;

    location / {
        proxy_pass http://127.0.0.1:9090;
    }
}
Save and close the file, then verify the Nginx for any syntax configuration error:
nginx -t
You will get the following output:
nginx: the configuration file /etc/nginx/nginx.conf syntax is ok
nginx: configuration file /etc/nginx/nginx.conf test is successful
Finally, restart the Nginx service to apply the changes:
systemctl restart nginx
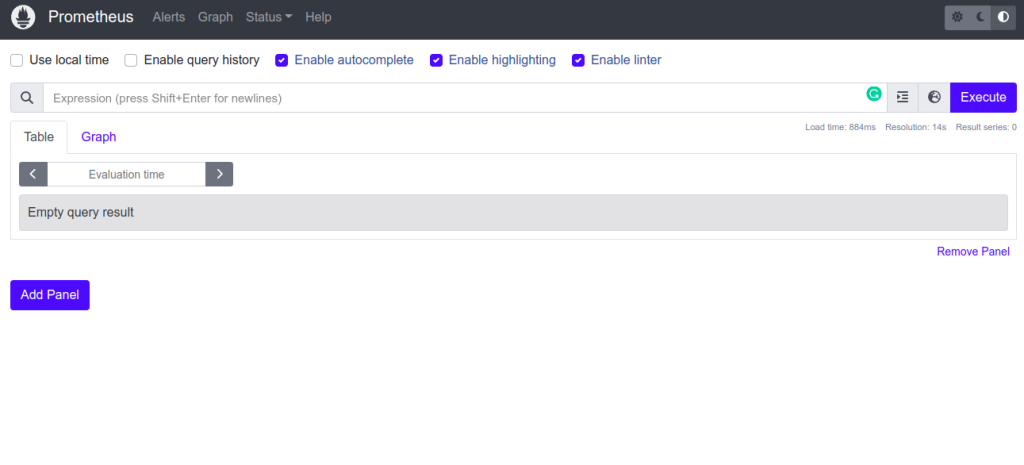
Step 4 – Access Prometheus Web UI
At this point, Prometheus is installed on your server. You can now access it using the URL http://prometheus.example.com. You should see the Prometheus dashboard on the following screen.
Conclusion
In this tutorial, we explained how to install Prometheus on Arch Linux. You can now implement the Prometheus monitoring tool in your server environment and start monitoring metrics of all servers and applications from the central location. You can test the Prometheus server on dedicated server hosting from Atlantic.Net!
* This post is for informational purposes only and does not constitute professional, legal, financial, or technical advice. Each situation is unique and may require guidance from a qualified professional.
Readers should conduct their own due diligence before making any decisions.