Prometheus is a free and open-source monitoring application used for event monitoring and alerting. It gathers, organizes, and stores metrics in a time-series database. It has gained in popularity and has been adopted by many organizations to monitor their infrastructure metrics. It is written in the Go language and uses HTTP pulls to gather metrics from remote hosts and applications. It uses Grafana to visualize data for monitoring and analysis.
In this post, we will show you how to install Prometheus on Oracle Linux 10.
Step 1 – Download Prometheus
Before starting, you will need to create a dedicated user for Prometheus. You can create it using the following command:
adduser -M -r -s /sbin/nologin prometheus
Next, create the required directories for Prometheus.
mkdir /var/lib/prometheus
for i in rules rules.d files_sd; do mkdir -p /etc/prometheus/${i}; done
Next, download the latest version of Prometheus from the Git repo.
curl -s https://api.github.com/repos/prometheus/prometheus/releases/latest|grep browser_download_url|grep linux-amd64|cut -d '"' -f 4|wget -qi -
Once the download is completed, extract the downloaded file.
tar xvf prometheus*.tar.gz
Next, change the directory to Prometheus and copy all required files to the desired locations.
cd prometheus*/
mv prometheus promtool /usr/local/bin/
mv prometheus.yml /etc/prometheus/
Set necessary permissions on the Prometheus directory.
for i in rules rules.d files_sd; do chown -R prometheus:prometheus /etc/prometheus/${i}; done
for i in rules rules.d files_sd; do chmod -R 775 /etc/prometheus/${i}; done
chown -R prometheus:prometheus /var/lib/prometheus/
Next, install the Apache package.
dnf install httpd -y
Next, add a user for Prometheus.
htpasswd -nB hitesh
Set your password as shown below:
New password:
Re-type new password:
hitesh:$2y$05$X/QVUxWLF3JOpkpj62e2uO1p4fBd6bOeozcbYmT6GuR44ZWu053k.
Next, create the Prometheus main configuration file.
nano /etc/prometheus/web.yml
Define your username and password.
basic_auth_users:
  hitesh: $2y$05$X/QVUxWLF3JOpkpj62e2uO1p4fBd6bOeozcbYmT6GuR44ZWu053k.
Next, change ownership of the Prometheus configuration file.
chown prometheus: /etc/prometheus/web.yml
Next, edit the Prometheus configuration file.
nano /etc/prometheus/prometheus.yml
Change the following lines:
scrape_configs:
  # The job name is added as a label `job=` to any timeseries scraped from this config.
  - job_name: "prometheus"

    # metrics_path defaults to '/metrics'
    # scheme defaults to 'http'.

    basic_auth:
      username: 'admin'
      password: 'uniquepass'

    static_configs:
      - targets: ["127.0.0.1:9090"]
Save and close the file when you are done.
Step 2 – Create a Systemd Service File for Prometheus
Next, create a systemd file to manage the Prometheus service.
nano /etc/systemd/system/prometheus.service
Add the following configuration.
[Unit]
Description=Prometheus
Documentation=https://prometheus.io/docs/introduction/overview/
Wants=network-online.target
After=network-online.target

[Service]
Type=simple
User=prometheus
Group=prometheus
ExecReload=/bin/kill -HUP $MAINPID
ExecStart=/usr/local/bin/prometheus \
  --config.file=/etc/prometheus/prometheus.yml \
  --storage.tsdb.path=/var/lib/prometheus \
  --web.listen-address=0.0.0.0:9090 \
  --web.config.file=/etc/prometheus/web.yml \

SyslogIdentifier=prometheus
Restart=always

[Install]
WantedBy=multi-user.target
Save the file, then reload the systemd daemon to apply the changes.
systemctl daemon-reload
Next, start and enable the Prometheus service.
systemctl start prometheus
systemctl enable prometheus
You can now check the status of the Prometheus service using the following command.
systemctl status prometheus
Output.
● prometheus.service - Prometheus
     Loaded: loaded (/etc/systemd/system/prometheus.service; enabled; preset: disabled)
     Active: active (running) since Fri 2025-12-05 23:26:18 EST; 2s ago
 Invocation: 87a225e1122a46dabfe803c1a3f8cc83
       Docs: https://prometheus.io/docs/introduction/overview/
   Main PID: 114921 (prometheus)
      Tasks: 7 (limit: 24812)
     Memory: 14M (peak: 14.2M)
        CPU: 54ms
     CGroup: /system.slice/prometheus.service
             └─114921 /usr/local/bin/prometheus --config.file=/etc/prometheus/prometheus.yml --storage.tsdb.path=/var/lib/prometheus --web.listen-address=0.0.0.0:9091 --web.config.fil>
Step 3 – Install node_exporter
Node exporter is used to gather system metrics and expose an HTTP API on the default TCP port ‘9100’.
First, download the latest version of node_exporter.
curl -s https://api.github.com/repos/prometheus/node_exporter/releases/latest| grep browser_download_url|grep linux-amd64|cut -d '"' -f 4|wget -qi -
Once the download is complete, extract the downloaded file.
tar -xvf node_exporter*.tar.gz
Next, navigate to the extracted directory and copy the node_exporter binary file to the system location.
cd  node_exporter*/
cp node_exporter /usr/local/bin
Now, verify the node_exporter version.
node_exporter --version
Output.
node_exporter, version 1.10.2 (branch: HEAD, revision: 654f19dee6a0c41de78a8d6d870e8c742cdb43b9)
  build user:       root@b29b4019149a
  build date:       20251025-20:05:32
  go version:       go1.25.3
  platform:         linux/amd64
  tags:             unknown
Next, create a system file to manage the node_exporter service.
nano /etc/systemd/system/node_exporter.service
Add the following configurations.
[Unit]
Description=Node Exporter
Wants=network-online.target
After=network-online.target

[Service]
User=prometheus
ExecStart=/usr/local/bin/node_exporter

[Install]
WantedBy=default.target
Save the file, then reload the system daemon using the following command.
systemctl daemon-reload
Next, start the node_exporter service using the following command.
systemctl start node_exporter
You can verify the status of the node_exporter using the following command.
systemctl status node_exporter
Output.
● node_exporter.service - Node Exporter
     Loaded: loaded (/etc/systemd/system/node_exporter.service; disabled; preset: disabled)
     Active: active (running) since Fri 2025-12-05 23:28:03 EST; 3s ago
 Invocation: 3c1c6e3e56934935995ef50ce2fe08b7
   Main PID: 115022 (node_exporter)
      Tasks: 4 (limit: 24812)
     Memory: 5.1M (peak: 5.3M)
        CPU: 14ms
     CGroup: /system.slice/node_exporter.service
             └─115022 /usr/local/bin/node_exporter
Step 4 – Add node_exporter to Prometheus
First, open the Prometheus configuration file.
nano /etc/prometheus/prometheus.yml
Add the following configuration under the scrape_configs section.
scrape_configs:
....
....
  - job_name: "node_exporter"

    static_configs:
      - targets: ["your-server-ip:9100"]
Save and close the file, then restart the Prometheus service to apply the changes.
systemctl restart prometheus
Step 5 – Access Prometheus Dashboard
Now, open your web browser and access Prometheus using the URL http://your-server-ip:9090. You will see the Prometheus login page.
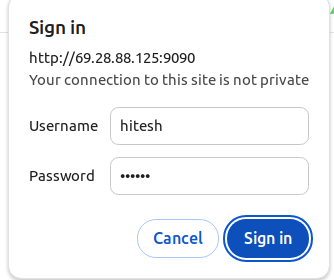
Provide your admin username and password and click on the Sign in. You will see the Prometheus dashboard.
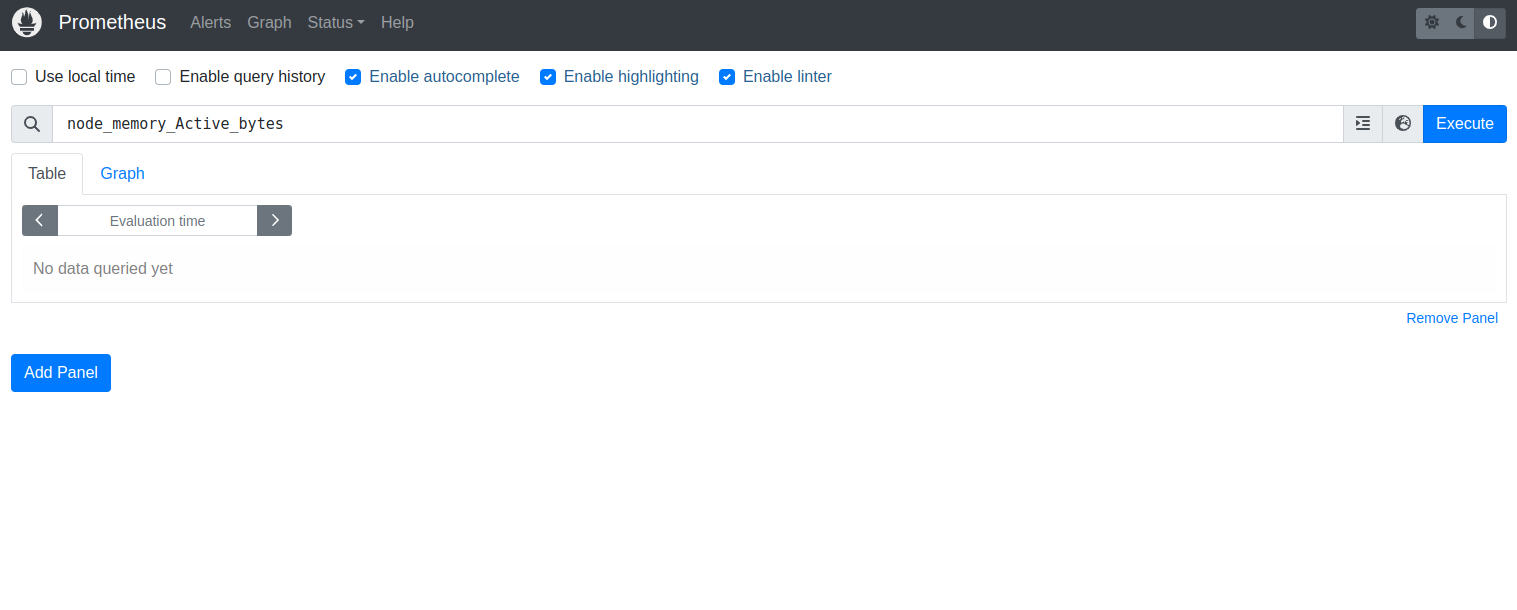
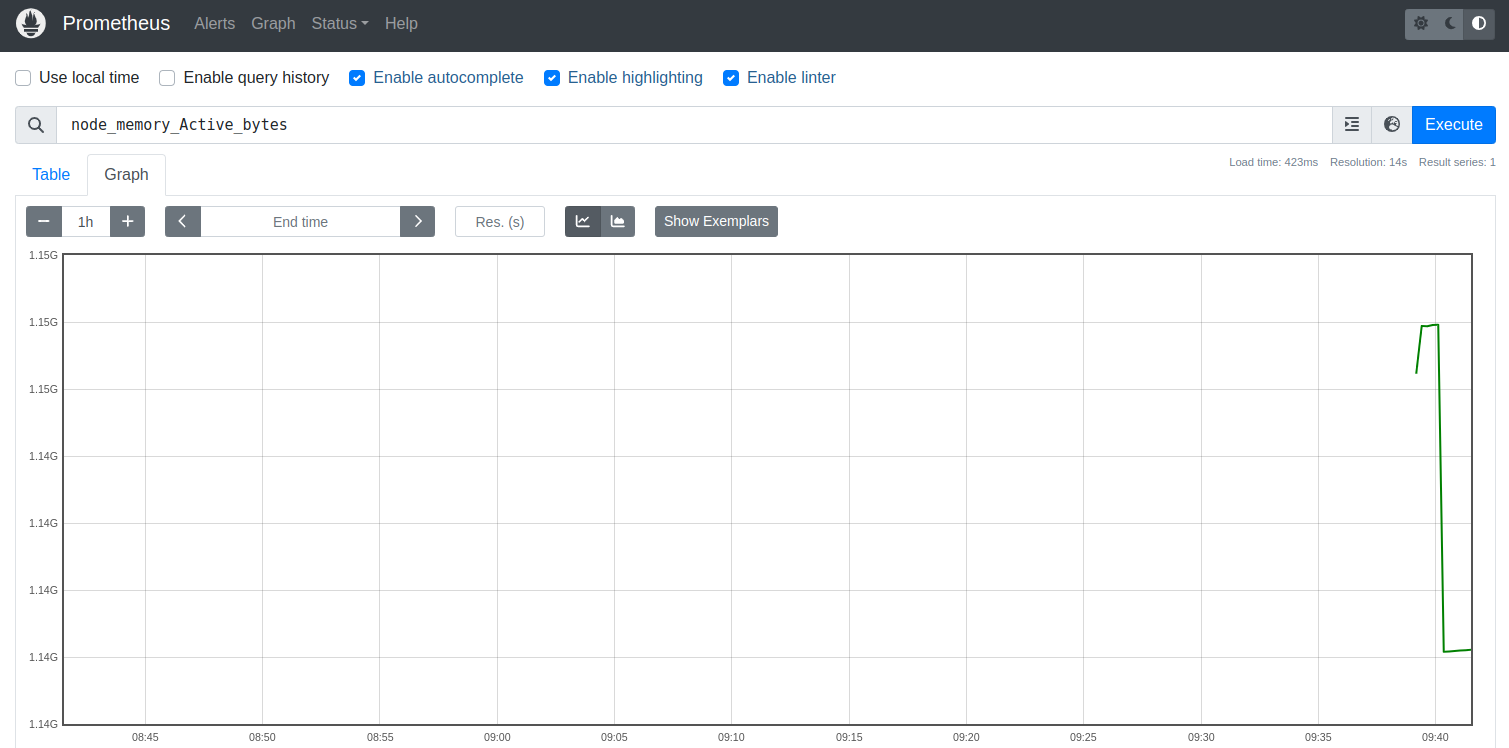
To verify whether the node_exporter is active or not, type the Prometheus query such as ‘node_memory_Active_bytes’ and click ‘Execute’. Then, you’ll receive the simple graph generated by Prometheus.
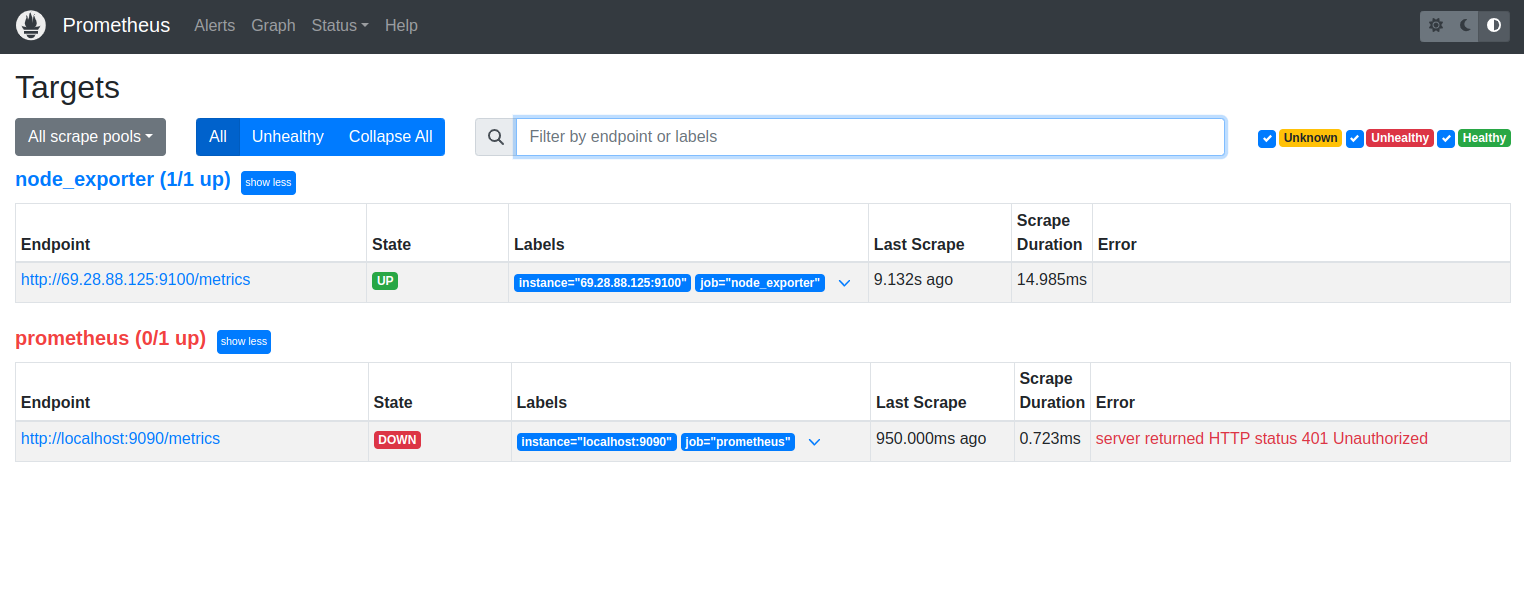
Now click on the ‘Status’ menu at the top and select ‘Targets’. You should see two different target scraps that are active and running. ‘Prometheus’ for gathering Prometheus server metrics, and the ‘node_exporter’ for gathering system metrics.
Conclusion
In this post, we explained how to install Prometheus on Oracle Linux 10. We also explained how to add Node Exporter to Prometheus and run the query. I hope this guide will help you to implement your own monitoring system in your organization. Give it a try on dedicated server hosting from Atlantic.Net!
* This post is for informational purposes only and does not constitute professional, legal, financial, or technical advice. Each situation is unique and may require guidance from a qualified professional.
Readers should conduct their own due diligence before making any decisions.