Table of Contents
If you are a webmaster, you may often be concerned with the performance of your web applications. You might ask questions like, “how do I perform load testing of my application?” or “will my application be able to handle a lot of users?” In these cases, Apache Bench can be a great help. Apache Bench is a free and open-source tool to measure the performance of a web server with a simple, easy-to-use command-line interface; it can help you understand how your current Apache installation performs.
In this tutorial, we will show you how to install and use Apache Bench on Linux.
Step 1 – Install Apache Bench
Apache Bench is a part of the Apache webserver package, so you don’t need to install the Apache Bench if the Apache Web Server is installed on your system.
For Ubuntu/Debian operating system, install the Apache Bench tool with the following command:
apt-get install apache2-utils -y
For RHEL/CentOS operating system, install the Apache Bench tool with the following command:
yum install httpd-tools -y
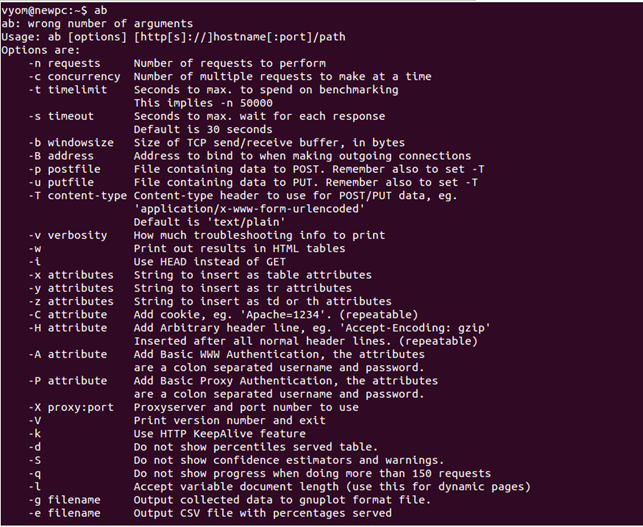
You can display all options available with Apache Bench tool using the following command:
ab
You should see the following screen:

A brief explanation of the most commonly used options is shown below:
- -n: Specify the number of connection requests sent to the webserver.
- -c: Specify the number of concurrent connection requests sent to the webserver.
- -t: Specify the number of seconds the ab command should continue sending requests.
Note: Sometimes you may get a “connection timed out” error. The reason for this is your connection request blocked by a firewall or the Apache webserver wasn’t able to handle further requests.
Step 2 – Running a Stress Test
At this point, the Apache Bench tool is installed. Now,you can perform a stress test against your webserver locally or using the domain name.
Let’s perform a stress test against your Apache web server by sending 800 requests over 300 concurrent connections.
ab -n 800 -c 300 http://your-domain-name/
This will perform for 800 requests with a concurrency of 300 as shown below:
This is ApacheBench, Version 2.3 <$Revision: 1807734 $>
Copyright 1996 Adam Twiss, Zeus Technology Ltd, http://www.zeustech.net/
Licensed to The Apache Software Foundation, http://www.apache.org/
Benchmarking localhost (be patient)
Completed 100 requests
Completed 200 requests
Completed 300 requests
Completed 400 requests
Completed 500 requests
Completed 600 requests
Completed 700 requests
Completed 800 requests
Finished 800 requests
Server Software:        Apache/2.4.29
Server Hostname:        localhost
Server Port:            80
Document Path:          /
Document Length:        10918 bytes
Concurrency Level:      300
Time taken for tests:   0.459 seconds
Complete requests:      800
Failed requests:        0
Total transferred:      8953600 bytes
HTML transferred:       8734400 bytes
Requests per second:    1743.53 [#/sec] (mean)
Time per request:       172.064 [ms] (mean)
Time per request:       0.574 [ms] (mean, across all concurrent requests)
Transfer rate:          19056.29 [Kbytes/sec] received
Connection Times (ms)
              min  mean[+/-sd] median   max
Connect:        0    6   7.8      0      20
Processing:     8   92 124.3     44     437
Waiting:        4   92 124.4     43     437
Total:         22   98 128.9     44     453
Percentage of the requests served within a certain time (ms)
  50%     44
  66%     50
  75%     53
  80%     56
  90%    435
  95%    445
  98%    450
  99%    452
 100%    453 (longest request)
In the above output, you can see Apache has handled 1743.53 requests per second, and it took a total 0.459 seconds to serve the total requests.
Let’s perform another stress test against your Nginx web server and compare it with Apache result by sending 800 requests over 300 concurrent connections.
ab -n 800 -c 300 http://your-domain-name/
You should see the following output:
This is ApacheBench, Version 2.3 <$Revision: 1807734 $>
Copyright 1996 Adam Twiss, Zeus Technology Ltd, http://www.zeustech.net/
Licensed to The Apache Software Foundation, http://www.apache.org/
Benchmarking localhost (be patient)
Completed 100 requests
Completed 200 requests
Completed 300 requests
Completed 400 requests
Completed 500 requests
Completed 600 requests
Completed 700 requests
Completed 800 requests
Finished 800 requests
Server Software:        nginx/1.14.0
Server Hostname:        localhost
Server Port:            80
Document Path:          /
Document Length:        10918 bytes
Concurrency Level:      300
Time taken for tests:   0.184 seconds
Complete requests:      800
Failed requests:        0
Total transferred:      8930400 bytes
HTML transferred:       8734400 bytes
Requests per second:    4354.95 [#/sec] (mean)
Time per request:       68.887 [ms] (mean)
Time per request:       0.230 [ms] (mean, across all concurrent requests)
Transfer rate:          47474.91 [Kbytes/sec] received
Connection Times (ms)
              min  mean[+/-sd] median   max
Connect:        1   12   7.5      9      32
Processing:     5   33  12.8     30      56
Waiting:        4   26  12.9     22      49
Total:         15   46  13.6     46      70
Percentage of the requests served within a certain time (ms)
  50%     46
  66%     56
  75%     58
  80%     60
  90%     64
  95%     66
  98%     70
  99%     70
 100%     70 (longest request)
In the above output, you can see Apache has handled 4354.95 requests per second, and it took a total 0.184 seconds to serve the total requests.
You can see that Nginx can handle more requests than Apache. After comparing the result of both servers, you will get an idea of which one to choose for your web application.
Conclusion
In the above guide, we learned how to test web server performance with Apache Bench. You can now explore the Apache Bench tool and run it with different options to measure the performance of your webserver; try it today on VPS Hosting from Atlantic.Net!