Table of Contents
- Introduction
- Prerequisites
- Install the Cacti Packages
- Installing Cacti on Ubuntu 14.04
- Set Up the SNMP Daemon
- Initial Cacti Monitoring
- Add a Cacti Graph Monitoring Network Traffic
- Monitoring Disk Usage on Cacti
- Monitoring Connectivity via Ping on Cacti
- Poll SNMP data from a Remote Host on Cacti
- Manage Graphs on Cacti
- Manage users on Cacti
Introduction
Cacti is a web-based tool for monitoring and graphing, designed as an easy-to-use front-end for the data logging software RRDTool.
Cacti allows you to graph data–such as system load or network traffic–polled over predetermined intervals. It most commonly polls network utilization data via Simple Network Management Protocol (SNMP). You can also use custom shell scripts and executables to collect data.
This guide will show you how to install and perform a basic setup to begin using Cacti on your server.
We will use example.com in this guide. Replace it with the domain name or IP address you have configured on your server.
Prerequisites
- This guide covers installation on Ubuntu 14.04 (or later) server. You can run Cacti on a different flavor of GNU/Linux, but some of the distribution-specific steps outlined below will differ. If you do not have an Ubuntu server, Atlantic.Net offers a wide range of industry leading VPS hosting solutions.
Install the Cacti Packages
Before you begin, make sure your system is updated. From the command line, type:
sudo apt-get update
sudo apt-get upgrade
Proceed to install Cacti and the SNMP daemon.
sudo apt-get install cacti snmpd
The package management system will install all the dependencies required. You will likely get a few prompts during the installation of these packages and dependencies.
The MySQL database server is one of these dependencies. If MySQL is not already installed on your server, then the installer will prompt you for a password for the root MySQL user. Remember to choose a unique, secure password, different from the server user’s. Keep this password handy. You’ll need it again later during this installation.
The package libphp-adodb (a PHP database abstraction layer library) will also be installed as part of the dependencies required. The installer will show you a warning message telling you about a change in the installation path for that library: “Configuring libphp-adodb – WARNING: include path for php has changed!” You can safely acknowledge the notification pressing Enter to continue with the installation.
The installer then will ask you to choose the web server for which Cacti will be automatically configured. Select Apache or Lighttpd, as you prefer (you can also skip this step and configure your web server later). In this example, we’ll choose to configure apache2.
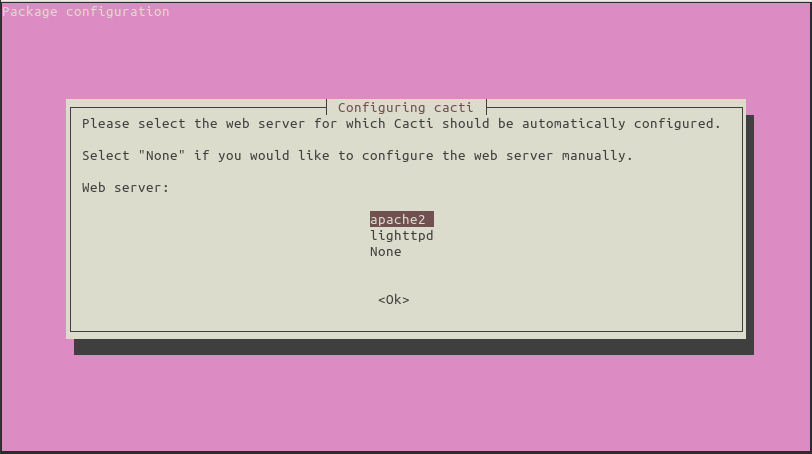 Automatic web server configuration
In the next step, the installer will offer you to set up the database automatically. Select Yes.
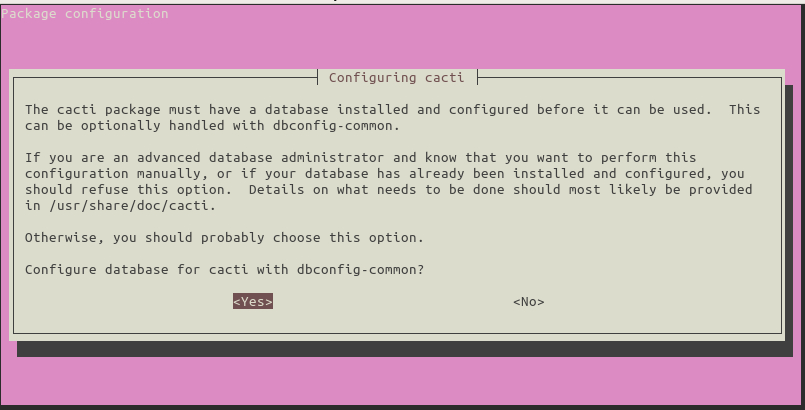 Automatic database configuration
The installer will ask you for the MySQL administrator (root) password. Input the MySQL root password and select Ok
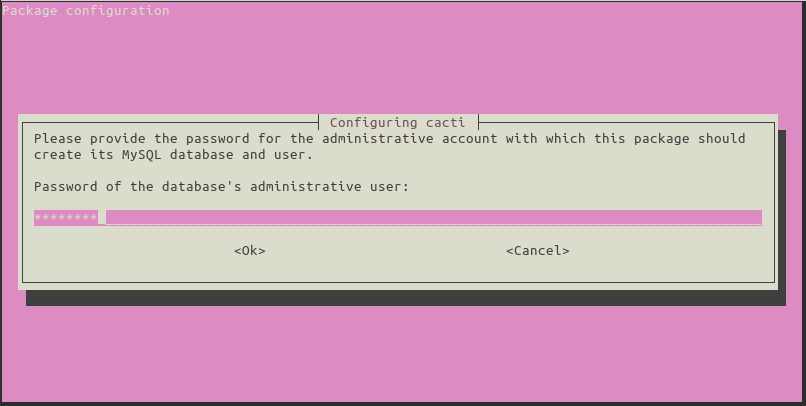 Enter the password for the root MySQL user
The next step is to provide the password Cacti will use to connect to the database server. You can provide your own new password, or leave it blank and let the installer generate a random one for you.
Usually you will not need to connect directly to the database with the cacti account, so a random password would suffice.
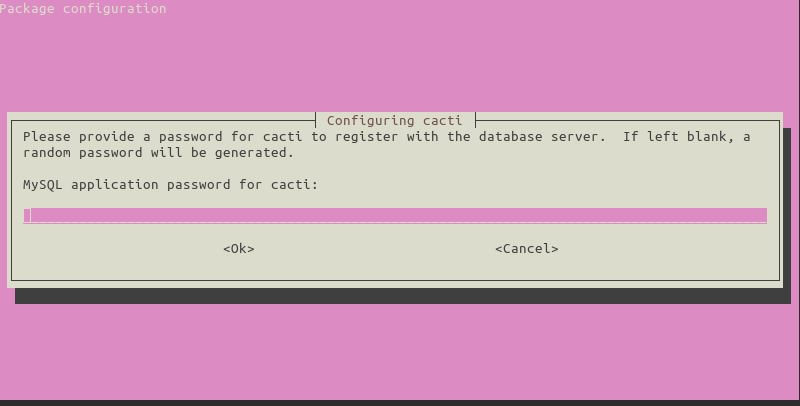 Leave Password Blank for cacti User To Generate a Random Password
At this point, Cacti is installed, but before using it, you first need to set it up.
.
Installing Cacti on Ubuntu 14.04
From a web browser, go to http://example.com/cacti. You will see the web setup wizard. Click Next.
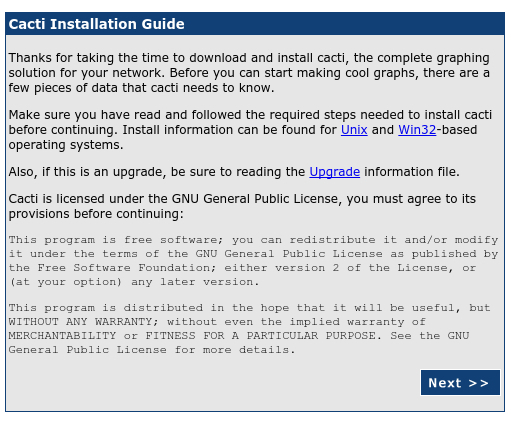 Web setup wizard welcome page
On the next screen, select New Install and click Next.
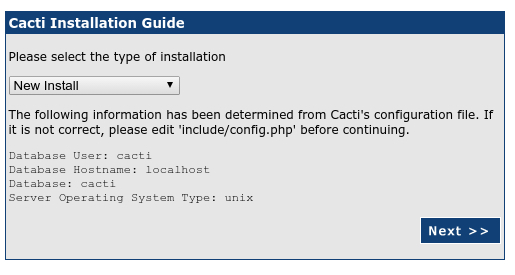 Web setup wizard – New Install
Cacti will now check for the packages it needs to run properly. Make sure all the checks appear with an “OK” status, and then click Finish.
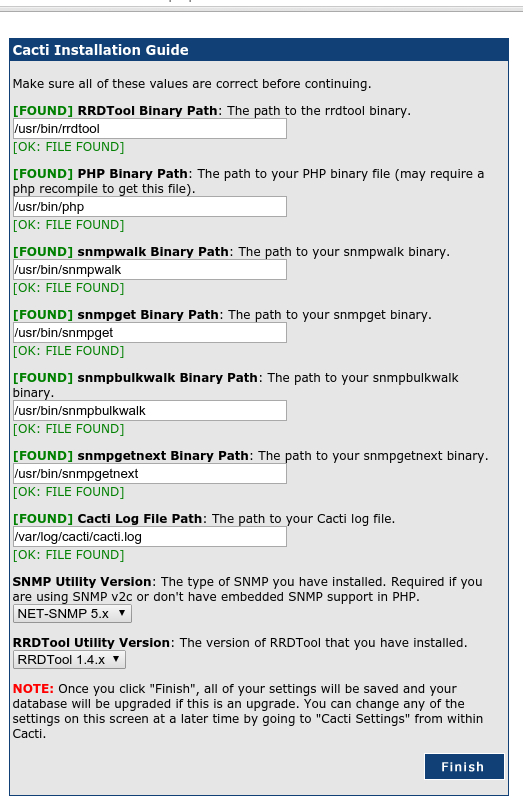 Web setup wizard – Checks before installing
The next page is the login page. The first time you log into Cacti, use admin as username and password.
The system will ask you to change the password for the admin account. After you choose the new password (and enter it again in the second field to confirm), the system automatically will log you in as the “admin” user.
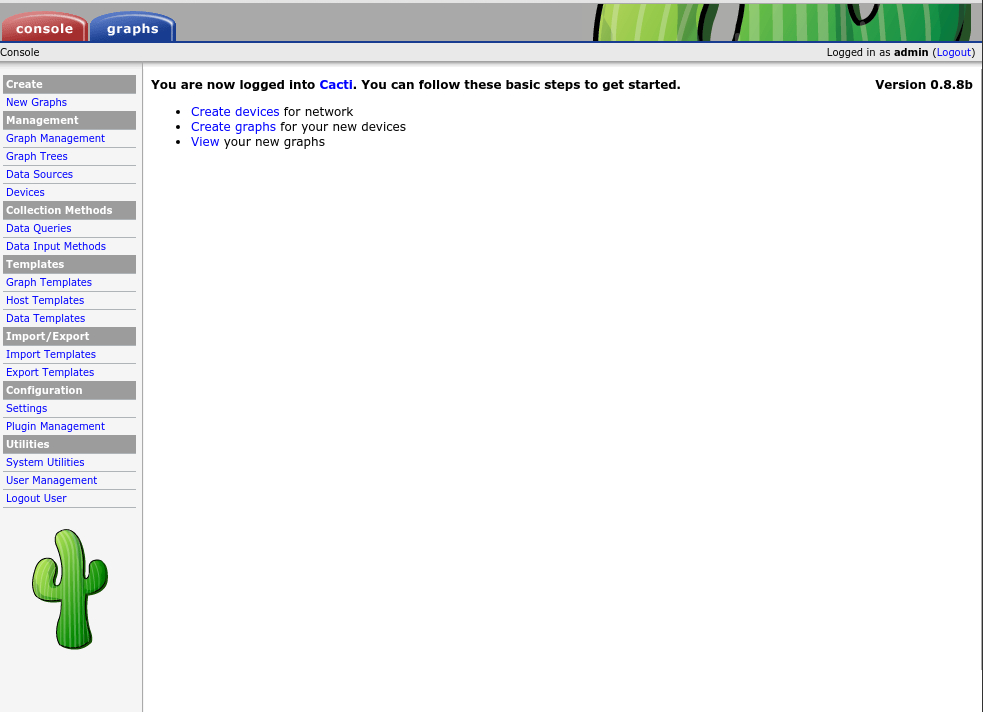 Cacti page upon first login
Cacti is ready to use.
.
Set Up the SNMP Daemon
Before setting up the polling of data in the Cacti web interface, we’ll need to configure the SNMP daemon running on the server.
SNMP is a powerful protocol and describing its features and capabilities exceeds the purpose of this guide. For our needs, we will just enable full access to SNMP resources for the localhost (that is, the server).
Using your preferred text editor, open the configuration file /etc/snmp/snmpd.conf.
sudo nano /etc/snmp/snmpd.conf
Uncomment (take out the initial #) the following line inside that file:
rocommunity public localhost
Optionally, you can also modify the contact and location information about your server. This information shows up along with other data such as hostname, kernel version, and system uptime in the Cacti notification area when you check your server details.
Edit the
sysLocationandsysContactvalues under the system information section. Change the text in the right column without changing the variable names on the left. By default, the following values appear on that section of the configuration file:sysLocation Sitting on the Dock of the Bay sysContact Me me@example.org
Save your modifications and close the text editor. Reboot the daemon to apply your changes.
sudo service snmpd restart
.
Initial Cacti Monitoring
Even without having done any configuration yet, Cacti is running and already polling information from your server.
If you wait for a couple of minutes (to give Cacti time to collect data) and then go to the Graphs tab in the Cacti web interface, you will see four graphs already there: Memory Usage, Load Average, Logged in Users, and Processes.
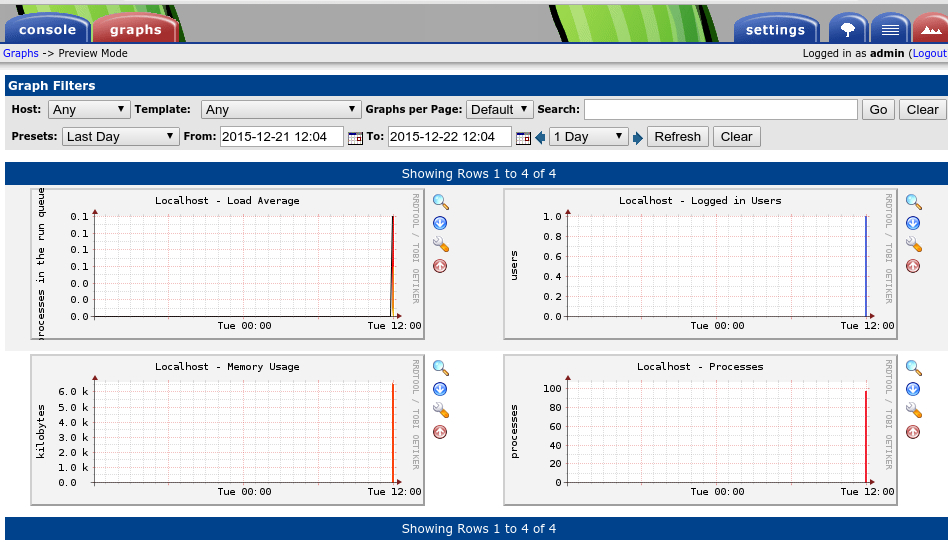 Cacti Page showing graphs
At first, all the options and features available could seem intimidating–do not let this overwhelm you, though! Instead, let’s see how to add more graphs.
Add a Cacti Graph Monitoring Network Traffic
Go to the Console tab, in the upper left. On the left panel beneath, under Management click Devices.
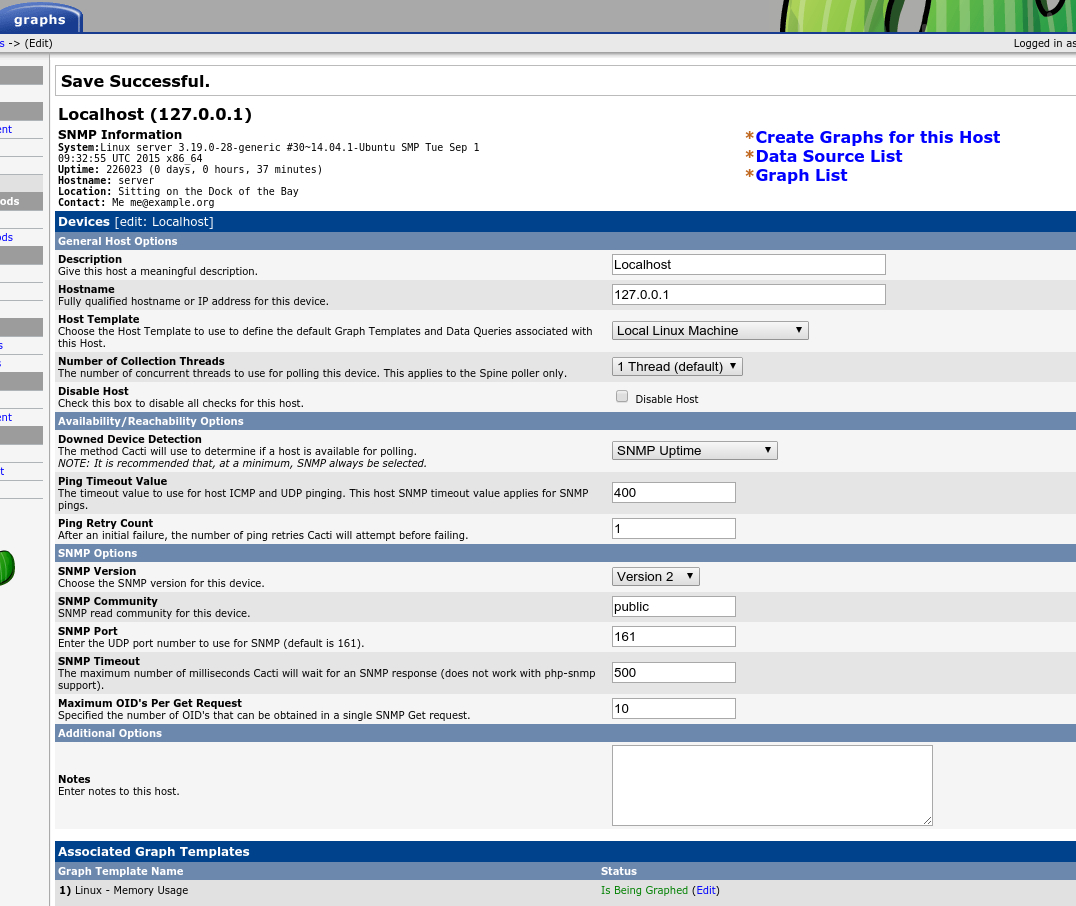
Just to the right, select Localhost. This page will show you properties related to your server.
In the SNMP Options section, click the drop-down menu next to SNMP version and select Version 2. Click Save in the lower right.
If all is working right, on the top left of the page will appear a notification area with a message showing SNMP information with data such as uptime and hostname of your server, confirming the SNMP polling was successful.
 Cacti page after setting up the SNMP parameters for the Localhost
Without leaving that page, look at the bottom for the Associated Data Queries section.
From the drop down menu next to Add Data Query, select SNMP – Interface Statistics.
Click Add and then Save.
Still in the same page but at the top, click on Create Graphs for this Host. Cacti will take you to a new page with available data sources to generate graphs.
Under Data Query [SNMP – Interface Statistics] select the interface to monitor (for example, eth0).
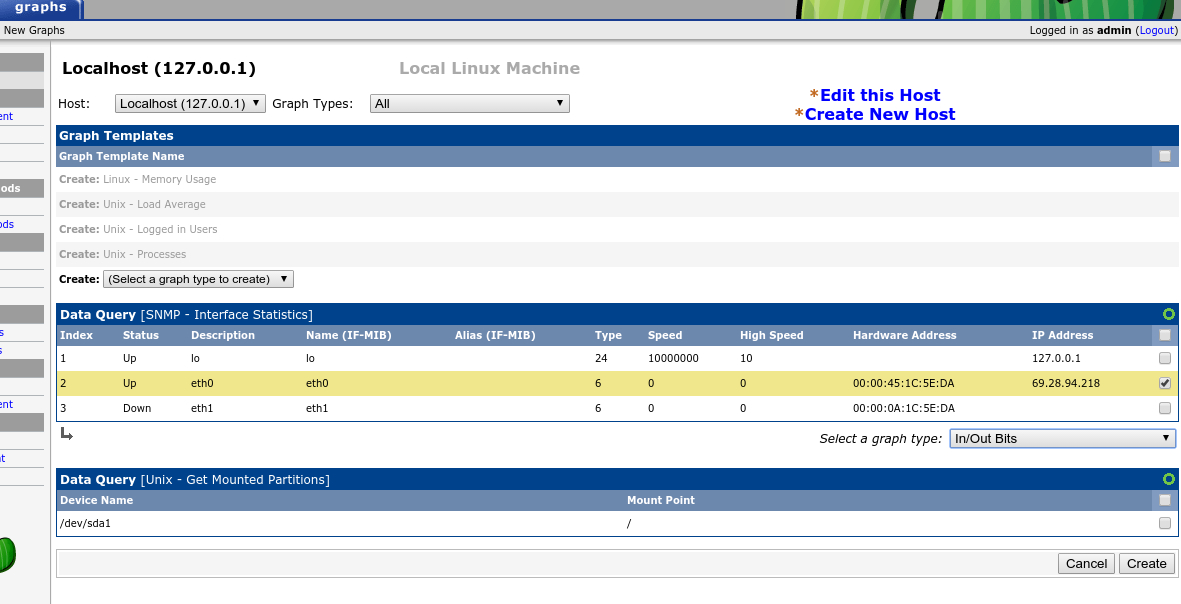 Cacti page showing network interfaces available for monitoring
Click Create.
The same window will reload. Check the notification area on the top left for the confirmation message: Created graph: Localhost - Traffic – eth0.
Give Cacti a couple of minutes to begin gathering and graphing data. Then go to the Graphs tab to see the new data you just added.
.
Monitoring Disk Usage on Cacti
Let’s add a graph showing server disk (or partition) usage.
Go to the Console tab. On the left panel, under Management click Devices. On the right page, select Localhost.
Click Create Graph for this Host.
Go to Data Query [Unix – Get Mounted Partitions] section and check the partition you want to monitor (for example, /dev/sda1).
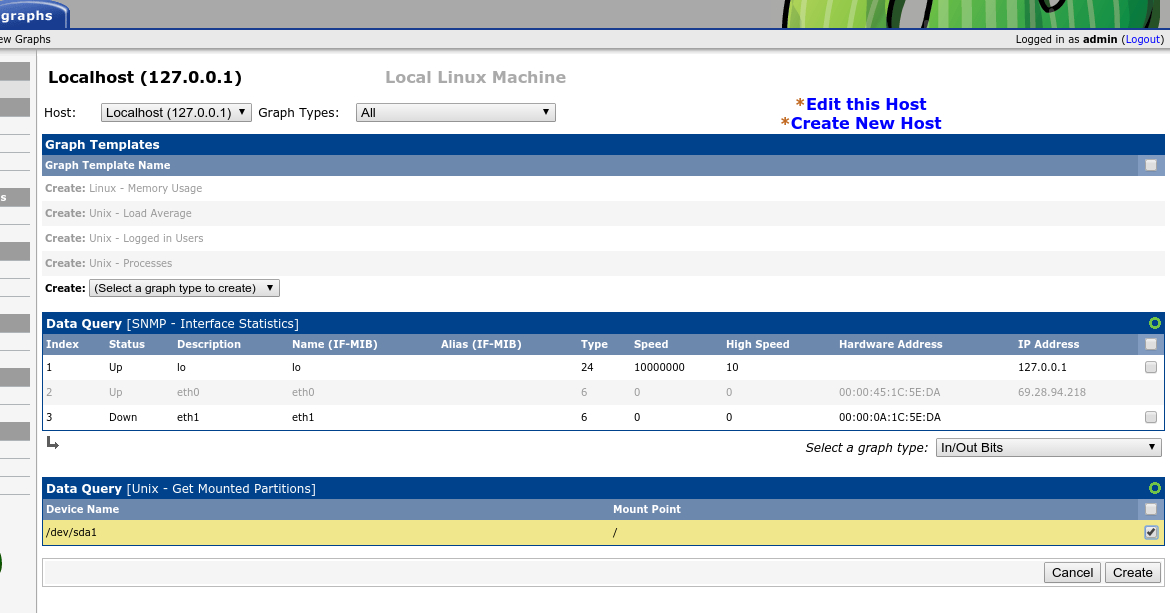 Cacti page showing storage partitions available for monitoring
Click Create, and check success message on the notification area: Created graph: Localhost - Disk Space - /dev/sda1.
Go to the Graphs tab to check. Remember to give Cacti a few minutes to collect and process the initial data.
.
Monitoring Connectivity via Ping on Cacti
You can also use Cacti to monitor ping response times to remote servers.
Go to the Console tab. On the left panel, under Management, click Devices.
In previous steps, we have used the Localhost device already present on the page. Now we will create a new device for the remote server we want to ping.
Click on Add on the far right of the Devices header.
Input a description for the host you will monitor–for example, Google Public DNS Server. Then its hostname or IP–8.8.8.8 in this same example.
In the Availability/Reachability Options section, select the type of Downed Device Detection. Choose Ping from the drop-down menu. For Ping Method, select ICMP Ping.
In the SNMP options section, select Not in use in the drop-down menu for SNMP Version.
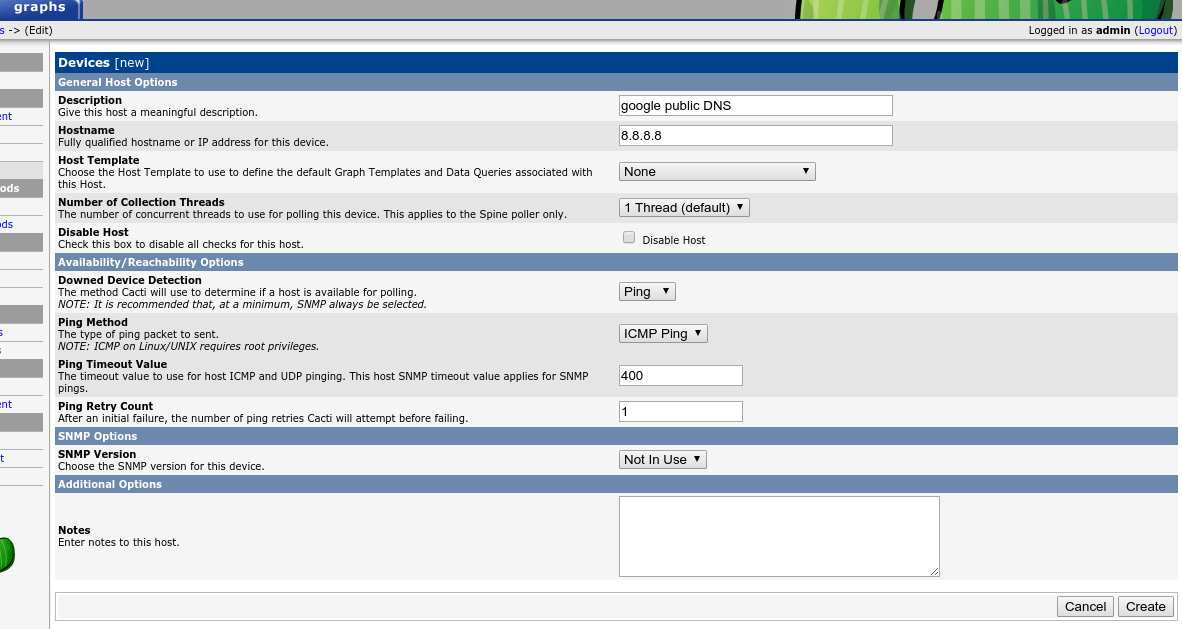 Cacti page showing parameters to ping a remote host
Click Create. The page will reload, and a few extra sections will appear at the bottom.
In the Associated Graph Template section, from the Add Graph Template drop-down menu, select Unix – Ping Latency and click the Add button at the bottom right of this particular section.
Click Save.
Now, click on Create Graphs for this Host.
In the Graph Templates section, check the box to the right of Create: Unix – Ping Latency, and click Create.
A new page will show up. Select the color of the graph and, optionally, enter whatever legend text you desire, and then click Create.
In the notification area on top, you can see if the graph was created successfully. If so, after a few minutes, go to the Graphs tab to check your new graph.
Initially, until you organize the way to display the graphs (see the section Manage Graphs below), this new graph will not appear along with the other graphs you already have for localhost.
To be able to see this remote ping graph, you should change the viewing mode from the default Tree view to Preview view. Use the icons on the top right area of the page, next to the settings tab. To select the Preview View, click on the icon furthest right that looks like a mountain range.
.
Poll SNMP data from a Remote Host on Cacti
Now, let’s use Cacti and SNMP to monitor and graph resources from another server.
On the Remote Server
Install the SNMP daemon (shown here for Ubuntu 14.04). On the command line type:
sudo apt-get install snmpd
Edit the SNMP daemon configuration file /etc/snmp/snmpd.conf to enable the remote server to accept the connection from your Cacti server.
Use the IP address of your Cacti server to permit connections just from that IP address.
rocommunity cacti 192.168.0.52
The
cactiword that appears in the second field is called an SNMP Community string. It is like a password, and you can choose any word you want. If you choose a different word, remember to use it when you configure the SNMP connection in Cacti.
Still in the same configuration file, enable access to the SNMP daemon from remote hosts. Comment out the line that restricts access only to localhost (127.0.0.1) and uncomment the line that enables access from the Internet.
#agentAddress udp:127.0.0.1:161
agentAddress udp:161,udp6:[::1]:161
You may find it helpful to also change the
sysLocationandsysContactinformation (as above) as well.
Save changes and restart snmpd.
sudo service snmpd restart
Those changes are enough for the remote server to work answering SNMP queries from your Cacti server.
In the Cacti Web Interface
Go to the Console tab. On the left panel, under Management click Devices. Click on Add.
In the General Host Options section, enter a description for the remote server and its hostname or IP address.
For Host template select ucd/net SNMP Host.
In the Availability/Reachability Options section, for Downed Device Detection select Ping and SNMP uptime. For Ping Method, ICMP Ping.
In the SNMP Options section, select for SNMP Version Version 2 and enter the SNMP Community you configured in your remote host (cacti, in our example).
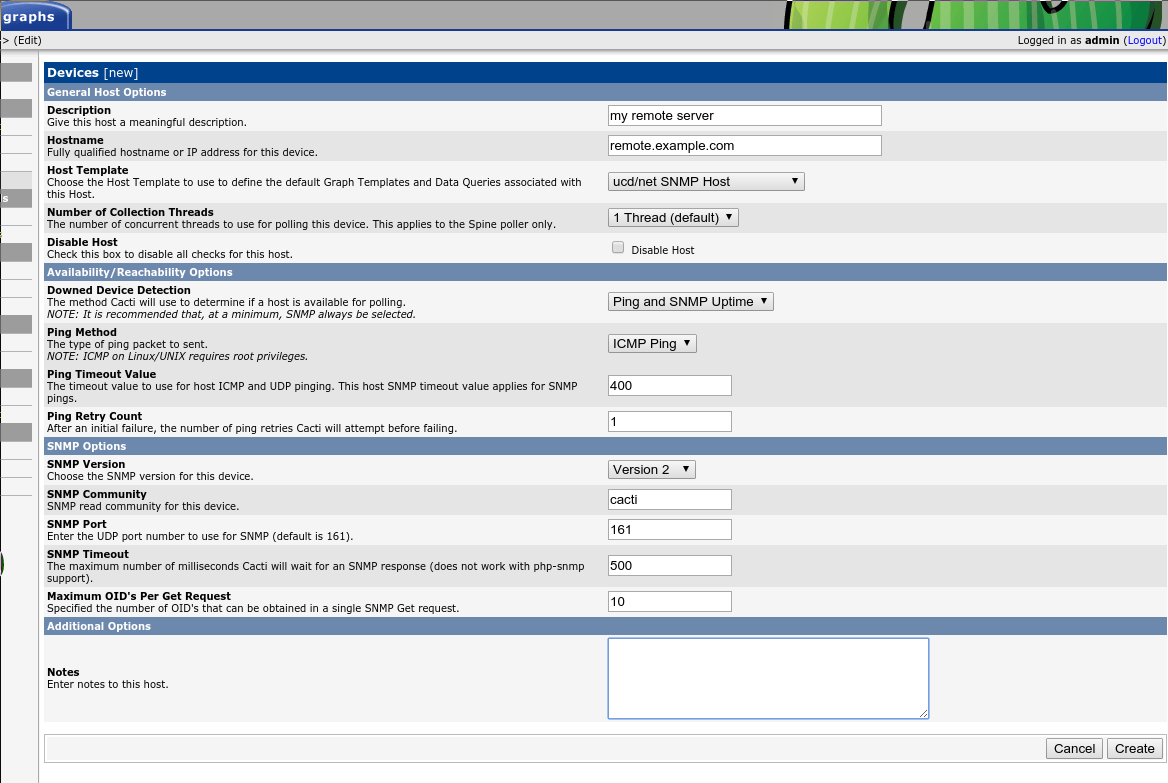 Cacti page showing the parameters to connect to remote server using SNMP
Click Create, and check the notification area for information about a successful SNMP connection to the remote host and ping results.
Now, click Create Graphs for this Host.
A list will appear, showing all the available data sources from the remote host. Check all the items you want to monitor and then click on Create.
In a few minutes, in the Graphs tab, Cacti will begin to show the new graphs.
Manage Graphs on Cacti
You can organize the way Cacti displays graphs by grouping them under Trees.
At first, from the Graphs tab, there is a “Default Tree” with just Localhost under it.
In this example, we will create two more branches to group our graphs: my remote server and remote Pings.
Go to the Console tab. On the left panel, under Management click Graph Trees. Click Add (on the far right).
Give a name Name for the branch. In this case, my remote server.
Select the ordering method you prefer and click Create.
According to the Cacti official help, the ordering methods work as follows:
- Manual Ordering (No Sorting): You may determine the order as you wish.
- Alphabetical Ordering: All subtrees ordered alphabetically unless otherwise specified.
- Natural Ordering: ie. ab1, ab2, ab7, ab10, ab20.
- Numeric Ordering: Leading zeroes are not taken into account when ordering numerically, i.e. 01, 02, 4, 04.
After a save successful appears in the notification area, a section called Tree items appears. Click Add (on the far right).
In the Tree Items section, click on the drop-down menu for Tree Item Type and select Host.
In the Tree Item Value section, choose from the Host drop-down menu my remote server and click Create.
Now we’ll add another branch.
Go back to the Console tab. On the left panel, under Management click Graph Trees. Click Add (on the far right).
Provide a Name for this new branch, in this case, pings.
As above, select the ordering method you prefer and click Create.
After a save successful appears in the notification area, a section called Tree items appears. Click Add (on the far right).
In the Tree Items section, click on the drop-down menu for Tree Item Type and select Host.
In Tree Item value section, choose the host to include (google dns server, in this example) and click Create.
Go to the Graph tab. Toward the top right, choose the tree view (the tree icon).
Now you can see your Tree to navigate between your graphs.
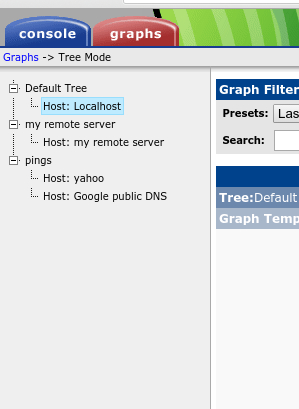 Cacti tree view with new hosts
Note that we’ve added a separate host for yahoo in this example using the same steps as above.
.
Manage users on Cacti
Until now, we’ve been making all of these setting changes under the admin account. You can create other accounts with restricted permissions.
Let’s create a user that just needs to monitor the data but should not make any changes in the settings.
Go to the Console tab and select User Management under Utilities. Click Add (on the far right).
Input the username and password for the new account. Do not forget to check the Enabled box.
In the Realm Permissions section below, select only the item View Graphs. Click Create.
The page will reload itself, and now a couple of tabs will appear next to the Realm Permissions section. Go to the Graph permissions tab.
You can assign permissions by Graph, Device, Graph Template or Tree.
For this example, we will restrict the user to see only data related to the localhost and my remote server hosts.
Under the Graph Permission (by Device) section, select Localhost in the Add Host drop-down menu and click Add.
Repeat the last step, selecting my remote server and Add it, too.
Finally, in the Default Policy drop-down menu that appears above and to the right of the hosts you added, select Allow. Click Save at the bottom of the page.
With this setup, the new account only will be able to see the graphs related to the localhost and the remote virtual private server and will not see any other graphs.
Log out from Cacti and log in again using the new account. You will see just the graphs you enabled and the Console tab will not appear.
Since we gave the user only Permissions (by Device), initially no graphs will appear in this (Tree) view. This user can see graphs by changing the view to Preview view (the mountain icon in the upper right). To allow this user to see the navigation tree, assign the corresponding Tree Permissions (located under the Graph Permissions tab).
.
Learn More
Congratulations, your Cacti basic setup is done! Please check back here for new updates, or check out our related articles below.
.
.
* This post is for informational purposes only and does not constitute professional, legal, financial, or technical advice. Each situation is unique and may require guidance from a qualified professional.
Readers should conduct their own due diligence before making any decisions.