Introduction
The ELK stack is a popular set of tools consisting of Elasticsearch, Logstash, and Kibana. These three tools form a software stack that can function as an extremely powerful centralized network data analytics and server log visualization tool. The ELK stack is also designed to be very capable of scaling out across multiple servers for load balancing. In this how-to we will be installing all components of the ELK stack onto a single server.
Prerequisites
- A server running Debian 8. If you do not have a server already, Atlantic.Net offers reliable VPS hosting servers you can spin up in under 30 seconds.
Other operating systems are supported, but this article concentrates on Debian 8.
Installing ELK Stack on Debian 8
Doing work as the root user is generally discouraged from a security standpoint. Using sudo allows you to execute commands that require root privileges from a non-root user. By default, Debian does not include the sudo package, so we’ll be installing it.
apt-get install sudo
You will then need to add the standard user account to the sudo group that you want to be able to execute root privilege commands. Replace <username> with the username of the account.
adduser <username> sudo
Log out and log back in with your new user, and we can continue.
The first time you use
sudoin a session will prompt you for the current user’s password.
Installing Elasticsearch
Let’s start off the process by installing Java on our server.
Elasticsearch, the data indexing and search component of the ELK stack, requires Java to run. We’ll be installing the OpenJDK 7 release, however, you can install any JRE listed on the support matrix for Elasticsearch.
First, we will need to update the package lists on our server.
sudo apt-get update
Now we can install the JRE.
sudo apt-get install openjdk-7-jre
This installation may take a while as there are a lot of dependencies for APT to sort through.
Once that has finished, we can install Elasticsearch. The version of Elasticsearch in the official Debian repositories is very old and not supported by newer versions of Kibana, so we are going to add the elastic.co repository to our server and install Elasticsearch from there.
Download and install the repository signing key for elastic.co.
wget -qO - https://packages.elastic.co/GPG-KEY-elasticsearch | sudo apt-key add -
Next we can add the repository to the /etc/apt/sources.list.d/ directory.
echo "deb http://packages.elastic.co/elasticsearch/2.x/debian stable main" | sudo tee -a /etc/apt/sources.list.d/Elasticsearch-2.x.list
At this point we need to update the package lists again, which will add the newer version of Elasticsearch from the elastic.co repository to the package lists.
sudo apt-get update
Now, we can install Elasticsearch.
sudo apt-get install elasticsearch
We will also need to configure the Elasticsearch service to launch on system startup.
sudo systemctl daemon-reload
sudo systemctl enable elasticsearch.service
That’s it! Now you can start the Elasticsearch service.
sudo systemctl start elasticsearch.service
And ensure that it is active.
systemctl status elasticsearch.service
Elasticsearch Configuration
In our case it is not necessary, but if you will have Kibana and Elasticsearch running on different servers (as many ELK deployments do), then you will need to edit the Elasticsearch config file, /etc/elasticsearch/elasticsearch.yml on the Elasticsearch server, and add the following two lines anywhere in the file:
http.cors.allow-origin: "/.*/"
http.cors.enabled: true
To the same file, add a line to name the Elasticsearch cluster. The default name is elasticsearch.
cluster.name: elasticcluster
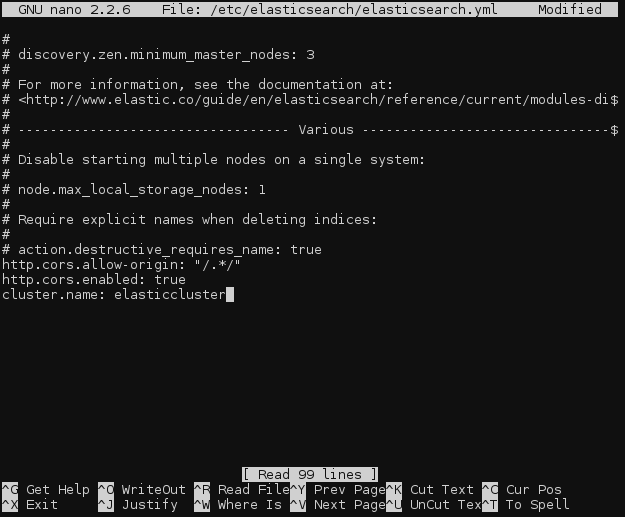
Be sure not to add any blank lines or spaces to the configuration file, as YAML files are whitespace sensitive.
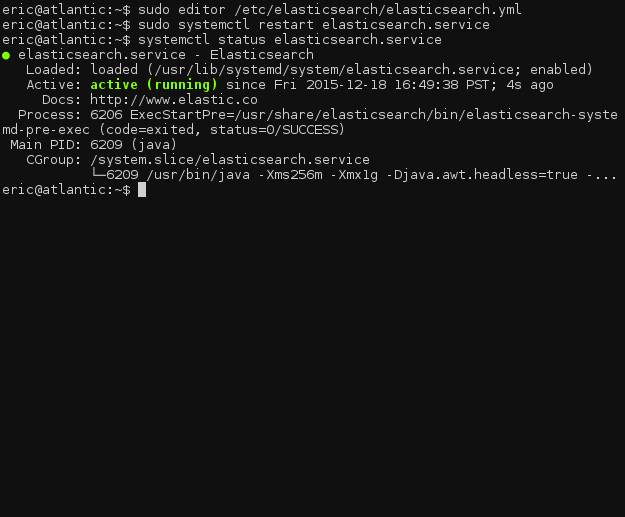
And then restart the Elasticsearch daemon.
sudo systemctl restart elasticsearch.service
Once again, ensure that the daemon is running successfully.
systemctl status elasticsearch.service
Installing Logstash
We can install Logstash, the log shipping and transformation component of the ELK stack, in very much the same way as Elasticsearch.
If you have been following this how-to, you will already have added the Elastic.co package signing key. Thus we can skip that part and immediately add the Elastic.co logstash repository to our /etc/apt/sources.list.d/.
echo "deb http://packages.elastic.co/logstash/2.0/debian stable main" | sudo tee -a /etc/apt/sources.list
And, of course, update the package lists.
sudo apt-get update
Next, we can install Logstash.
sudo apt-get install logstash
As with Elasticsearch, we will need to enable Logstash at system startup.
sudo systemctl daemon-reload
sudo systemctl enable logstash.service
Now we can start Logstash.
sudo systemctl start logstash.service
And ensure that it is running.
systemctl status logstash.service
Now we can move on to configuring it!
Logstash Configuration
Logstash uses configuration files located in /etc/logstash/conf.d. We will need to create three new files in that directory since there is no default configuration.
cd /etc/logstash/conf.d
sudo touch 01-input.conf 10-syslog.conf 30-lumberjack-output.conf
We will use the first file, 01-input.conf, to specify how Lumberjack will listen for incoming logs.
Open the file for editing (substituting the text editor you prefer, if you have a preference).
sudo editor 01-input.conf
Add the following block:
input {
  lumberjack {
    port => 5000
    type => "logs"
    ssl_certificate => "/etc/ssl/certs/logstash-forwarder.crt"
    ssl_key => "/etc/ssl/logstash-forwarder.key"
  }
}
Save and close the file.
Don’t worry about the SSL certificates quite yet. We will be generating them shortly.
Next, we need to add a filter configuration to 10-syslog.conf. A filter can match against incoming messages (logs) and apply transformations to the data before indexing them in Elasticsearch.
Open the file in your editor,
sudo editor 10-syslog.conf
and add the following:
filter {
  if [type] == "syslog" {
    grok {
      match => { "message" => "%{SYSLOGTIMESTAMP:syslog_timestamp} %{SYSLOGHOST:syslog_hostname} %{DATA:syslog_program}(?:\[%{POSINT:syslog_pid}\])?: %{GREEDYDATA:syslog_message}" }
      add_field => [ "received_at", "%{@timestamp}" ]
      add_field => [ "received_from", "%{host}" ]
    }
    syslog_pri { }
    date {
      match => [ "syslog_timestamp", "MMM  d HH:mm:ss", "MMM dd HH:mm:ss" ]
    }
  }
}
This filter intercepts any incoming logs that match the standard syslog format, and then adds a timestamp and hostname field to each message. It also extracts some information from the log message such as the syslog PID, which program generated the message, and the syslog message itself.
A new filter will need to be written for every new type of log you want to use with Logstash/Elasticsearch.
Finally, we can go to our output configuration file, 30-lumberjack-output.conf. This file will contain a simple output block specifying that indexed messages should be sent to Elasticsearch, and the cluster name.
Open the file in your editor.
sudo editor 30-lumberjack-output.conf
Add the following block:
output {
  elasticsearch {
    hosts => ["localhost"]
  }
}
Now we’ll get to generating the SSL certificates for your ELK stack.
Generate SSL Certificates
The Lumberjack protocol that Logstash uses to communicate log messages is designed to be secure from end to end, and SSL is a hard requirement. Don’t worry, though, it is quite simple to generate the certificates.
Because we are using an IP address rather than a hostname for the servers directive in /etc/logstash-forwarder.conf, we will need to add an IP SAN field to the generated SSL certificate. Include one by adding a subjectAltName line to the OpenSSL config file, /etc/ssl/openssl.cnf.
sudo editor /etc/ssl/openssl.cnf
Locate the line containing [ v3_ca ], and insert the following line under it. (Replace the 127.0.0.1 with the IP address of your Logstash server, if Logstash is installed on a separate server.)
[ v3_ca ]
subjectAltName = IP:127.0.0.1
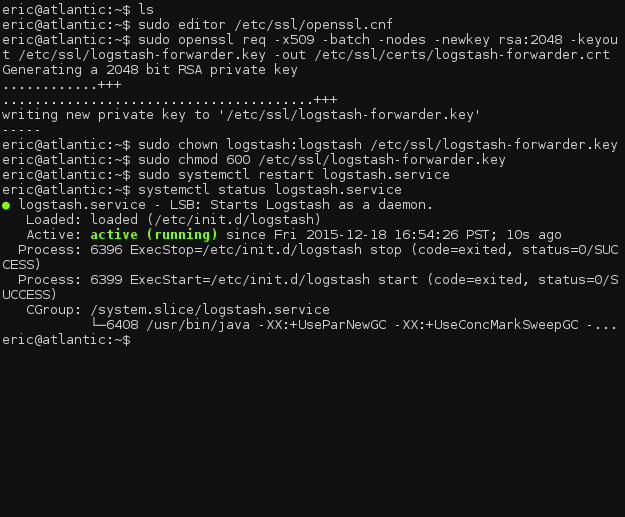
Save and close the file. We can now generate the SSL certificate.
sudo openssl req -x509 -batch -nodes -newkey rsa:2048 -keyout /etc/ssl/logstash-forwarder.key -out /etc/ssl/certs/logstash-forwarder.crt

sudo chown logstash:logstash /etc/ssl/logstash-forwarder.key
sudo chmod 600 /etc/ssl/logstash-forwarder.key
Now, restart logstash and check if it has started correctly.
sudo systemctl restart logstash.service
systemctl status logstash.service
Even if it has started, check the log files at /var/log/logstash/logstash.* and ensure that there are no errors during startup.
Installing Logstash-Forwarder
Now that we have installed the server-side component of Logstash, we need to install the Logstash-Forwarder client on every server whose logs you want to monitor.
In this tutorial, we will be installing Logstash-Forwarder on the same server running the rest of ELK, but normally Logstash-Forwarder would run on other servers.
First, we will once again need to add a new repository to the system.
echo "deb http://packages.elasticsearch.org/logstashforwarder/debian stable main" | sudo tee -a /etc/apt/sources.list.d/logstash-forwarder.list
And, again, update the package lists.
sudo apt-get update
Now, we can install Logstash-Forwarder.
sudo apt-get install logstash-forwarder
After the install is complete, open the configuration file for Logstash-Forwarder.
sudo editor /etc/logstash-forwarder.conf
Erase the existing default configuration, and add the following block:
{
  "network": {
    "servers": [ "127.0.0.1:5000" ],
    "timeout": 15,
    "ssl ca": "/etc/ssl/certs/logstash-forwarder.crt"
  },
  "files": [
    {
      "paths": [ "/var/log/syslog", "/var/log/auth.log" ],
      "fields": { "type": "syslog" }
    }
  ]
}
This configuration will check /var/log/syslog and /var/log/auth.log for new entries and then will tag each outgoing message from those files with syslog in the type field.
If you are installing Logstash-Forwarder on a separate host, be sure to change the
serversdirective to include the IP address of the remote server. Also, ensure that you copy the SSL certificate file to the correct location on the remote server.
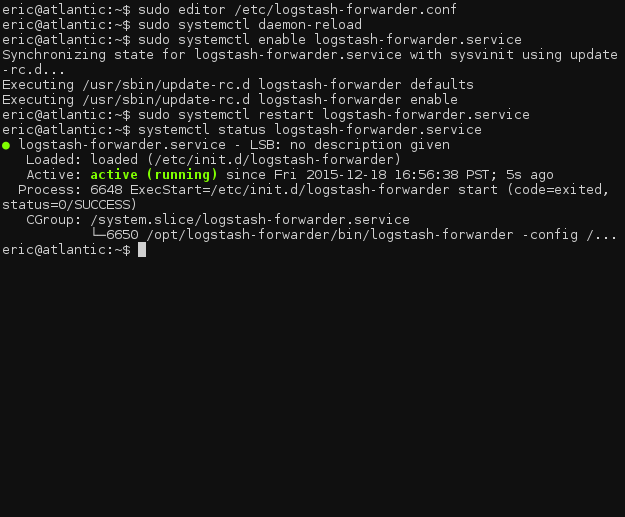
Now, we will enable Logstash-Forwarder on boot.
sudo systemctl daemon-reload
sudo systemctl enable logstash-forwarder.service
Finally, we can restart the Logstash-Forwarder service to apply the configuration changes.
sudo systemctl restart logstash-forwarder.service
If the daemon starts okay, we can move forward to setting up Kibana and getting the full ELK stack up and running.
systemctl status logstash-forwarder.service
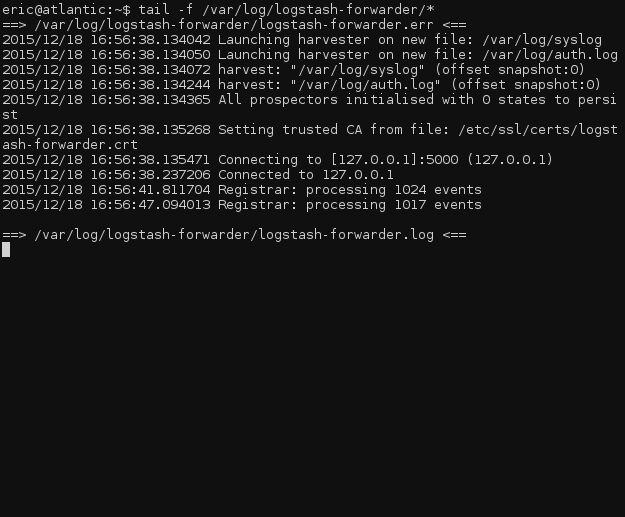
To check if logstash-forwarder is working, watch the log file for events being processed.
tail -f /var/log/logstash-forwarder/*
Installing Kibana
Unfortunately, as of the writing of this article, elastic.co does not offer any packaged versions of Kibana, leaving daemon management to the user. We will need to create a systemd service file and manually install Kibana.
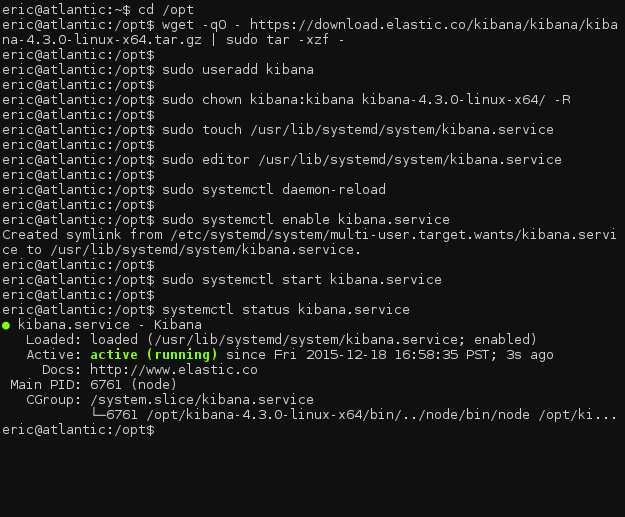
Navigate to the /opt directory and download Kibana.
cd /opt
wget -qO - https://download.elastic.co/kibana/kibana/kibana-4.3.0-linux-x64.tar.gz | sudo tar -xzf -
We will need to create a new user for Kibana to run as and set ownership of the program directory.
sudo useradd kibana
sudo chown kibana:kibana kibana-4.3.0-linux-x64/ -R
Following this step, we can create the systemd service file.
sudo touch /usr/lib/systemd/system/kibana.service
Add the service definition to the file.
sudo editor /usr/lib/systemd/system/kibana.service

[Unit]
Description=kibana
Documentation=http://www.elastic.co
Wants=network-online.target
After=network-online.target

[Service]
User=kibana
Group=kibana
ExecStart=/opt/kibana-4.3.0-linux-x64/bin/kibana
Restart=always
StandardOutput=null
# Connects standard error to journal
StandardError=journal

[Install]
WantedBy=multi-user.target
We now need to reload all systemd units, and then enable the Kibana service.
sudo systemctl daemon-reload
sudo systemctl enable kibana.service
Now, we can start Kibana.
sudo systemctl start kibana.service
Double check to make sure it is running, and we are off!
systemctl status kibana.service
Kibana Configuration
The main Kibana configuration file will be located at /opt/kibana-4.3.0-linux-x64/config/kibana.yml. The default options should suffice for this how-to, but you can change the settings as needed for your configuration.
Navigate to your server’s IP address in a web browser, at port 5601, to access the Kibana initialization page. Kibana will ask you to configure an index pattern; select received_at for the time-field name and press Create.
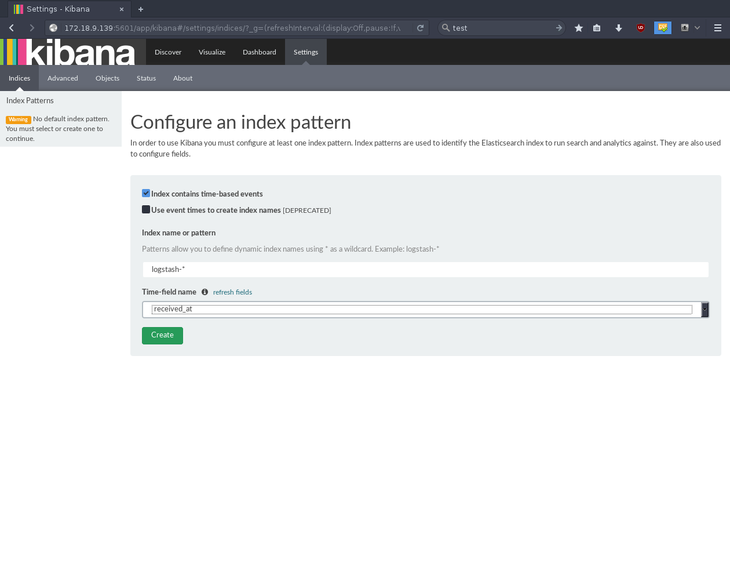
That’s it! Your ELK stack components–Elasticsearch, Logstash, and Kibana–are installed and operational.
Where To Go Next
Thank you for following along on for this tutorial on installing the ELK stack on Debian 8. Please check back with us again for related articles, and to test drive one of our blazing-fast VPS servers.