Monit is a free, lightweight, low-resource usage monitoring solution for Linux-based operating systems. It is easy to set up and can monitor different services, CPU usage, memory usage, uptime, load, and more. It also restarts any services automatically if it fails. If there are problems, one or more recipients will be informed by email. You can configure Monit to monitor server applications, network connections and services, harddisks, sha1 checksum of files, size change, timestamp, folder change, and more.
This post will show you how to install the Monit monitoring tool on Fedora.
Step 1 – Install Monit
By default, the Monit package is included in the Fedora default repo. You can install it easily using the following command.
dnf install monit
Once the Monit is installed, you can run it using the following command.
monit
Output.
 New Monit id: d6c8428d05bae2b22aabf013036d2919
 Stored in '/root/.monit.id'
Starting Monit 5.30.0 daemon with http interface at [localhost]:2812
You can now check basic system information using the following command.
monit status
Output.
Monit 5.30.0 uptime: 0m

System 'fedora'
  status                       OK
  monitoring status            Monitored
  monitoring mode              active
  on reboot                    start
  load average                 [0.50] [0.25] [0.15]
  cpu                          0.0%usr 0.0%sys 0.0%nice 0.0%iowait 0.0%hardirq 0.0%softirq 0.0%steal 0.0%guest 0.0%guestnice
  memory usage                 282.6 MB [14.3%]
  swap usage                   0 B [0.0%]
  uptime                       15m
  boot time                    Tue, 06 Jun 2023 12:46:10
  filedescriptors              1888 [0.0% of 9223372036854775807 limit]
  data collected               Tue, 06 Jun 2023 13:01:05
Step 2 – Configure Monit
Next, you must edit the Monit configuration file to set an admin password, enable the web UI, and allow outside access.
nano /etc/monitrc
Change the following lines.
set httpd port 2812
    #use address localhost => only accept connection from localhost (drop if you use M/Monit)
    use address 0.0.0.0
    allow 0.0.0.0/0
    allow admin:monit
Save and close the file, then reload the Monit to apply the changes.
monit reload
Step 3 – Access Monit Web UI
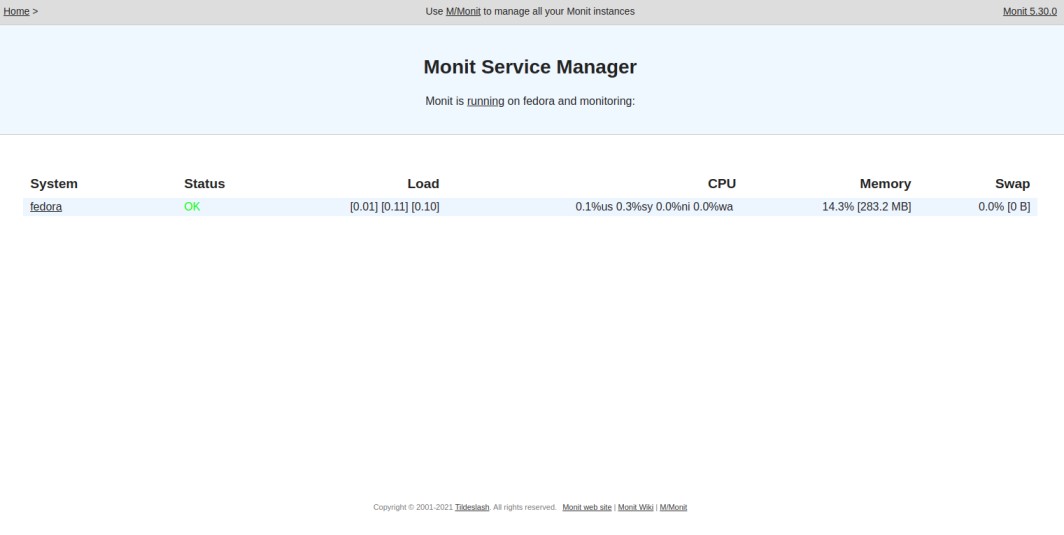
At this point, Monit is installed and listens on port 2812. Now, open your web browser and access the Monit web dashboard using the URL http://your-server-ip:2812. You should see the Monit monitoring dashboard on the following screen.
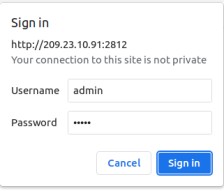
Provide your Monit admin username and password and click the Sign in button. You should see the Monit dashboard on the following screen.
Step 4 – Monitor Nginx with Monit
To monitor a service, you will need to configure Monit for that service. In this section, we will configure Monit to monitor the Nginx service.
First, install the Nginx package using the following command.
dnf install nginx
Next, start and enable the Nginx service to start at system reboot.
systemctl start nginx
systemctl enable nginx
Next, create a new Monit configuration file.
nano /etc/monit.d/nginx-monitor
Add the following configurations.
check process nginx with pidfile /run/nginx.pid
start program "/usr/bin/systemctl start nginx.service"
stop program "/usr/bin/systemctl stop nginx.service"
if failed port 80 protocol http then restart
Save and close the file, then verify Monit for any syntax errors.
monit -t
Output.
Control file syntax OK
Next, reload the Monit service to implement the changes.
monit reload
Next, monitor the Nginx service via the command line.
monit status
You should see the Nginx service status in the following output.
Monit 5.30.0 uptime: 2m

Process 'nginx'
  status                       OK
  monitoring status            Monitored
  monitoring mode              active
  on reboot                    start
  pid                          2201
  parent pid                   1
  uid                          0
  effective uid                0
  gid                          0
  uptime                       0m
  threads                      1
  children                     1
  cpu                          -
  cpu total                    -
  memory                       0.1% [1.2 MB]
  memory total                 0.3% [6.1 MB]
  security attribute           kernel
  filedescriptors              13 [1.3% of 1024 limit]
  total filedescriptors        30
  read bytes                   0 B/s [0 B total]
  disk read bytes              0 B/s [0 B total]
  disk read operations         0.0 reads/s [0 reads total]
  write bytes                  0 B/s [0 B total]
  disk write bytes             0 B/s [0 B total]
  disk write operations        0.0 writes/s [0 writes total]
  port response time           0.882 ms to localhost:80 type TCP/IP protocol HTTP
  data collected               Tue, 06 Jun 2023 13:06:21

System 'fedora'
  status                       OK
  monitoring status            Monitored
  monitoring mode              active
  on reboot                    start
  load average                 [0.78] [0.34] [0.18]
  cpu                          0.9%usr 0.9%sys 0.0%nice 0.0%iowait 0.1%hardirq 0.1%softirq 2.4%steal 0.0%guest 0.0%guestnice
  memory usage                 287.2 MB [14.5%]
  swap usage                   0 B [0.0%]
  uptime                       20m
  boot time                    Tue, 06 Jun 2023 12:46:10
  filedescriptors              1920 [0.0% of 9223372036854775807 limit]
  data collected               Tue, 06 Jun 2023 13:06:21
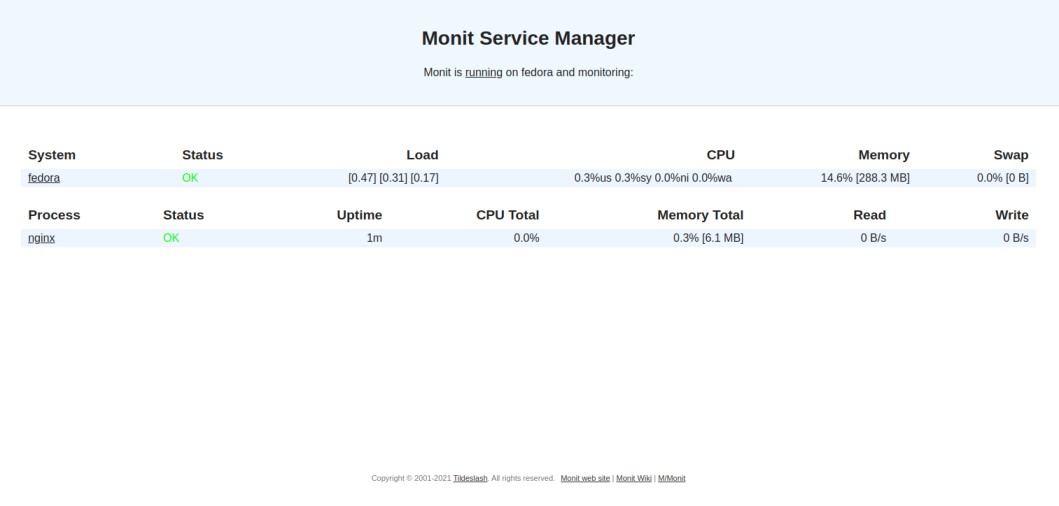
You can also open the Monit dashboard to monitor Nginx via a web browser.
Step 5 – Verify Monit Functionality
One of the best advantages of Monit is that it can start any service automatically if it stops. Let’s stop the Nginx service using the following command to test it.
systemctl stop nginx
Next, verify the log file to check whether the Monit starts the Nginx service.
tail -f /var/log/messages
The following output indicates that the Nginx service is started automatically by Monit.
Jun  6 13:07:51 fedora monit[1263]: 'nginx' process is not running
Jun  6 13:07:51 fedora monit[1263]: 'nginx' trying to restart
Jun  6 13:07:51 fedora monit[1263]: 'nginx' start: '/usr/bin/systemctl start nginx.service'
Jun  6 13:07:51 fedora systemd[1]: Starting The nginx HTTP and reverse proxy server...
Jun  6 13:07:51 fedora nginx[2242]: nginx: the configuration file /etc/nginx/nginx.conf syntax is ok
Jun  6 13:07:51 fedora nginx[2242]: nginx: configuration file /etc/nginx/nginx.conf test is successful
Jun  6 13:07:51 fedora systemd[1]: Started The nginx HTTP and reverse proxy server.
Jun  6 13:07:51 fedora audit[1]: SERVICE_START pid=1 uid=0 auid=4294967295 ses=4294967295 subj=kernel msg='unit=nginx comm="systemd" exe="/usr/lib/systemd/systemd" hostname=? addr=? terminal=? res=success'
You can also check the Nginx active status with the following command.
systemctl status nginx
Output.
● nginx.service - The nginx HTTP and reverse proxy server
     Loaded: loaded (/usr/lib/systemd/system/nginx.service; disabled; vendor preset: disabled)
     Active: active (running) since Tue 2023-06-06 13:07:51 EDT; 22s ago
    Process: 2241 ExecStartPre=/usr/bin/rm -f /run/nginx.pid (code=exited, status=0/SUCCESS)
    Process: 2242 ExecStartPre=/usr/sbin/nginx -t (code=exited, status=0/SUCCESS)
    Process: 2243 ExecStart=/usr/sbin/nginx (code=exited, status=0/SUCCESS)
   Main PID: 2244 (nginx)
      Tasks: 2 (limit: 2328)
     Memory: 2.2M
        CPU: 80ms
     CGroup: /system.slice/nginx.service
             ├─2244 nginx: master process /usr/sbin/nginx
             └─2245 nginx: worker process

Jun 06 13:07:51 fedora systemd[1]: Starting The nginx HTTP and reverse proxy server...
Jun 06 13:07:51 fedora nginx[2242]: nginx: the configuration file /etc/nginx/nginx.conf syntax is ok
Jun 06 13:07:51 fedora nginx[2242]: nginx: configuration file /etc/nginx/nginx.conf test is successful
Jun 06 13:07:51 fedora systemd[1]: Started The nginx HTTP and reverse proxy server.
Conclusion
This post explained how to install and configure the Monit monitoring solution on Fedora Linux. You can now add more services to Monit and start monitoring them from the central dashboard. You can deployMonit monitoring solution on VPS hosting from Atlantic.Net!
* This post is for informational purposes only and does not constitute professional, legal, financial, or technical advice. Each situation is unique and may require guidance from a qualified professional.
Readers should conduct their own due diligence before making any decisions.