Prometheus is a free, open-source software solution that provides monitoring and alerting functionality for cloud-native environments. It gathers metrics from different target sources, organizes them, displays the results, and can trigger alerts when specified conditions are matched. It is designed for monitoring, recording, and processing any purely numeric time series in the Kubernetes environment. If you are looking for an open-source and web-based monitoring solution, then Prometheus is your best option.
This post will show you how to install the Prometheus server on Fedora.
Step 1 – Install Prometheus
First, install some required dependencies using the following command.
dnf install curl wget nano
Next, visit the Prometheus official website and download the latest version of Prometheus using the following command.
wget https://github.com/prometheus/prometheus/releases/download/v2.44.0/prometheus-2.44.0.linux-amd64.tar.gz
Once the download is completed, extract the downloaded file with the following command.
tar -xvf prometheus-2.44.0.linux-amd64.tar.gz
Next, rename the extracted directory using the following command.
mv prometheus-2.44.0.linux-amd64 prometheus-files
Step 2 – Configure Prometheus
First, create a dedicated user to run Prometheus.
useradd --no-create-home --shell /bin/false prometheus
Next, create the required directories for Prometheus.
mkdir /etc/prometheus
mkdir /var/lib/prometheus
Next, change the ownership of the Prometheus directory.
chown prometheus:prometheus /etc/prometheus
chown prometheus:prometheus /var/lib/prometheus
Next, copy Prometheus tools to the system location.
cp prometheus-files/prometheus /usr/local/bin/
cp prometheus-files/promtool /usr/local/bin/
Then, change the ownership of the Prometheus tools binary.
chown prometheus:prometheus /usr/local/bin/prometheus
chown prometheus:prometheus /usr/local/bin/promtool
Next, copy other required configuration files to the Prometheus directory and change their ownership.
cp -r prometheus-files/consoles /etc/prometheus
cp -r prometheus-files/console_libraries /etc/prometheus
chown -R prometheus:prometheus /etc/prometheus/consoles
chown -R prometheus:prometheus /etc/prometheus/console_libraries
Next, create a Prometheus configuration file using the following command.
nano /etc/prometheus/prometheus.yml
Add the following configuration.
global:
  scrape_interval: 10s

scrape_configs:
  - job_name: 'prometheus'
    scrape_interval: 5s
    static_configs:
      - targets: ['localhost:9090']
Save and close the file, then change the file ownership.
chown prometheus:prometheus /etc/prometheus/prometheus.yml
Step 3 – Create a Systemd Service File
Creating a systemd service file to manage the Prometheus service is a good idea. You can make it using the following command.
nano /etc/systemd/system/prometheus.service
Add the following lines.
[Unit]
Description=Prometheus
Wants=network-online.target
After=network-online.target

[Service]
User=prometheus
Group=prometheus
Type=simple
ExecStart=/usr/local/bin/prometheus \
    --config.file /etc/prometheus/prometheus.yml \
    --storage.tsdb.path /var/lib/prometheus/ \
    --web.console.templates=/etc/prometheus/consoles \
    --web.console.libraries=/etc/prometheus/console_libraries

[Install]
WantedBy=multi-user.target
Save and close the file, then reload the systemd daemon to apply the configuration changes.
systemctl daemon-reload
Next, restart the Prometheus service.
systemctl start prometheus
You can now verify the Prometheus active status using the following command.
systemctl status prometheus
Output:
● prometheus.service - Prometheus
     Loaded: loaded (/etc/systemd/system/prometheus.service; disabled; vendor preset: disabled)
     Active: active (running) since Tue 2023-06-06 03:33:07 EDT; 4s ago
   Main PID: 28510 (prometheus)
      Tasks: 7 (limit: 4666)
     Memory: 67.7M
        CPU: 497ms
     CGroup: /system.slice/prometheus.service
             └─28510 /usr/local/bin/prometheus --config.file /etc/prometheus/prometheus.yml --storage.tsdb.path /var/lib/prometheus/ --web.console.templates=/etc/prome>

Jun 06 03:33:07 fedora prometheus[28510]: ts=2023-06-06T07:33:07.985Z caller=head.go:669 level=info component=tsdb msg="On-disk memory mappable chunks replay completed>
Jun 06 03:33:07 fedora prometheus[28510]: ts=2023-06-06T07:33:07.985Z caller=head.go:677 level=info component=tsdb msg="Replaying WAL, this may take a while"
Jun 06 03:33:07 fedora prometheus[28510]: ts=2023-06-06T07:33:07.985Z caller=head.go:748 level=info component=tsdb msg="WAL segment loaded" segment=0 maxSegment=0
Jun 06 03:33:07 fedora prometheus[28510]: ts=2023-06-06T07:33:07.985Z caller=head.go:785 level=info component=tsdb msg="WAL replay completed" checkpoint_replay_duratio>
Jun 06 03:33:07 fedora prometheus[28510]: ts=2023-06-06T07:33:07.988Z caller=main.go:1037 level=info fs_type=XFS_SUPER_MAGIC
Jun 06 03:33:07 fedora prometheus[28510]: ts=2023-06-06T07:33:07.988Z caller=main.go:1040 level=info msg="TSDB started"
Jun 06 03:33:07 fedora prometheus[28510]: ts=2023-06-06T07:33:07.988Z caller=main.go:1220 level=info msg="Loading configuration file" filename=/etc/prometheus/promethe>
Jun 06 03:33:08 fedora prometheus[28510]: ts=2023-06-06T07:33:08.028Z caller=main.go:1257 level=info msg="Completed loading of configuration file" filename=/etc/promet>
Jun 06 03:33:08 fedora prometheus[28510]: ts=2023-06-06T07:33:08.028Z caller=main.go:1001 level=info msg="Server is ready to receive web requests."
Jun 06 03:33:08 fedora prometheus[28510]: ts=2023-06-06T07:33:08.028Z caller=manager.go:995 level=info component="rule manager" msg="Starting rule manager..."
Step 4 – Access Prometheus Web UI
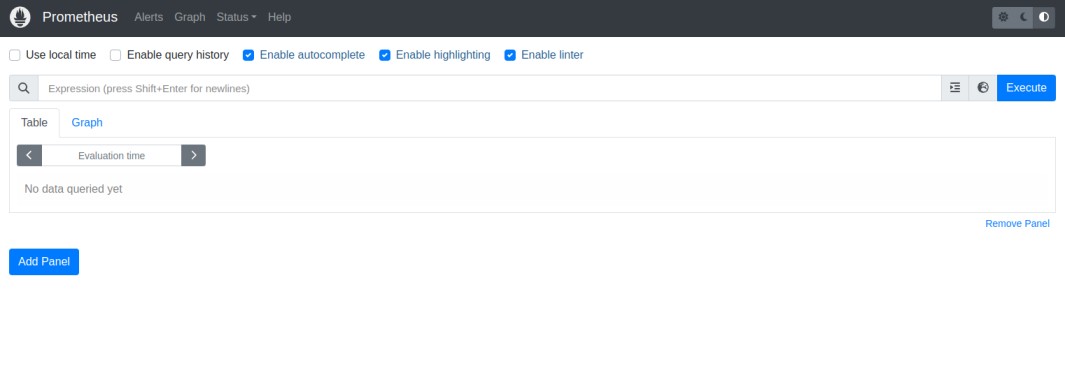
At this point, Prometheus is installed and listening on port 9090. Now, open your web browser and access the Prometheus dashboard using the URL
http://prometheus-server-ip:9090/graph. You should see the Prometheus dashboard on the following screen.
Conclusion
In this post, we learned how to install the Prometheus monitoring solution on Fedora. You can now explore Prometheus and start monitoring your cloud-native applications using Prometheus. Try to install and deploy Prometheus monitoring on VPS hosting from Atlantic.Net!
* This post is for informational purposes only and does not constitute professional, legal, financial, or technical advice. Each situation is unique and may require guidance from a qualified professional.
Readers should conduct their own due diligence before making any decisions.