A TIG stack is a collection of open-source tools including Telegraf, InfluxDB, and Grafana. It is one of the most popular tools for montoring a wide panel of data sources.
Telegraf is a server agent used for collecting and aggregating data and reporting metrics. It is highly scalable and allows users to access metrics from the system.
Grafana is an open-source data visualization tool that supports various time series datastores including Prometheus, Elasticsearch, and InfluxDB.
InfluxDB is an open-source database used to store data and expose it to the Grafana dashboard. It can automate sensors and devices in real-time.
In this tutorial, we will learn how to install the TIG stack on Ubuntu 20.04 server.
Step 1 – Install Telegraf
First, you will need to install Telegraf in your system. By default, Telegraf is not available in the Ubuntu 20.04 standard repository, so you will need to add the InfluxData repo to your system.
First, install the required dependencies using the following command:
apt-get install gnupg2 software-properties-common -y
Next, import the GPG key with the following command:
wget -qO- https://repos.influxdata.com/influxdb.key | apt-key add -
Next, activate the lsb-release and add the InfluxData repository with the following command:
source /etc/lsb-release
echo "deb https://repos.influxdata.com/${DISTRIB_ID,,} ${DISTRIB_CODENAME} stable" | tee
/etc/apt/sources.list.d/influxdb.list
Next, update the repository and install Telegraf with the following command:
apt-get update -y
apt-get install telegraf
Once the installation is completed, start and enable the Telegraf service with the following command:
systemctl enable --now telegraf
systemctl start telegraf
Next, verify the status of Telegraf using the following command:
systemctl status telegraf
You should get the following output:
-
telegraf.service - The plugin-driven server agent for reporting metrics into InfluxDB
Loaded: loaded (/lib/systemd/system/telegraf.service; enabled; vendor preset: enabled)
Active: active (running) since Sat 2020-10-10 09:46:53 UTC; 23s ago
Docs: https://github.com/influxdata/telegraf
Main PID: 105155 (telegraf)
Tasks: 8 (limit: 4691)
Memory: 17.4M
CGroup: /system.slice/telegraf.service
└─105155 /usr/bin/telegraf -config /etc/telegraf/telegraf.conf -config-directory
/etc/telegraf/telegraf.d
105155]: 2020-10-10T09:46:53Z I! Loaded outputs: influxdb
Step 2 – Install InfluxDB
We have added the InfluxData repo in the previous step, so you can install InfluxDB by just running the following command:
apt-get install influxdb -y
Once InfluxDB has been installed, start the InfluxDB service and enable it to start at system reboot with the following command:
systemctl enable --now influxdb
systemctl start influxdb
Next, verify the status of the InfluxDB service using the following command:
systemctl status influxdb
You should get the following output:
-
influxdb.service - InfluxDB is an open-source, distributed, time series database
Loaded: loaded (/lib/systemd/system/influxdb.service; enabled; vendor preset: enabled)
Active: active (running) since Sat 2020-10-10 09:48:22 UTC; 13s ago
Docs: https://docs.influxdata.com/influxdb/
Main PID: 105724 (influxd)
Tasks: 10 (limit: 4691)
Memory: 10.3M
CGroup: /system.slice/influxdb.service
└─105724 /usr/bin/influxd -config /etc/influxdb/influxdb.conf
Step 3 – Install Grafana
By default, the latest version of Grafana is not available in the Ubuntu 20.04 server, so you will need to add the Grafana repository to your system.
First, import the Grafana key with the following command:
wget -q -O - https://packages.grafana.com/gpg.key | apt-key add -
Next, add the Grafana repository with the following command:
add-apt-repository "deb https://packages.grafana.com/oss/deb stable main"
Once the repository is added, update the repository and install the latest version of Grafana using the following command:
apt-get update -y
apt-get install grafana -y
Once Grafana has been installed, reload the systemd daemon with the following command:
systemctl daemon-reload
Next, start the Grafana service and enable it to start at system reboot with the following command:
systemctl enable --now grafana-server
systemctl start grafana-server
Next, verify the status of the Grafana service with the following command:
systemctl status grafana-server
You should get the following output:
-
grafana-server.service - Grafana instance
Loaded: loaded (/lib/systemd/system/grafana-server.service; enabled; vendor preset: enabled)
Active: active (running) since Sat 2020-10-10 09:50:26 UTC; 44s ago
Docs: http://docs.grafana.org
Main PID: 106788 (grafana-server)
Tasks: 8 (limit: 4691)
Memory: 19.4M
CGroup: /system.slice/grafana-server.service
└─106788 /usr/sbin/grafana-server --config=/etc/grafana/grafana.ini --
pidfile=/var/run/grafana/grafana-server.pid --packaging=deb>
Step 4 – Configure InfluxDB
Next, you will need to configure the InfluxDB database to store the metrics collected by Telegraf agent. First, connect the InfluxDB with the following command:
influx
You should get the following output:
Connected to http://localhost:8086 version 1.8.3
InfluxDB shell version: 1.8.3
Next, create a database and user with the following command:
> create database telegrafdb
> create user telegraf with password 'password'
> grant all on telegrafdb to telegraf
Next, verify the database using the following command:
> show databases
You should get the following output:
name: databases
name
----
telegraf
_internal
telegrafdb
Next, verify the users by using the following command:
> show users
You should get the following output:
user admin
---- -----
telegraf false
Next, exit from the InfluxDB console with the following command:
>exit
Step 5 – Configure Telegraf Agent to Collect System Metrics
Next, you will need to configure the Telegraf agent to collect system metrics. Here, we will configure the Telegraf agent to collect system metrics including memory usage, system processes, disk usage, system load, system uptime, and logged in users.
You can generate a custom Telegraf configuration file with the following command:
telegraf config -input-filter cpu:mem:swap:system:processes:disk -output-filter influxdb >
/etc/telegraf/telegraf.conf
Once the configuration file is generated, edit the configuration file:
nano /etc/telegraf/telegraf.conf
Define your InfluxDB database details:
[[outputs.influxdb]]
urls = ["http://127.0.0.1:8086"]
database = "telegrafdb"
username = "telegraf"
password = "password"
Save and close the file, then restart the Telegraf service to apply the configuration changes:
systemctl restart telegraf
Next, you will need to verify whether the data appears or not. You can run the configuration test using the following command:
telegraf --config /etc/telegraf/telegraf.conf --test
If everything is correct, you should see the following output:
2020-10-10T09:57:58Z I! Starting Telegraf 1.15.3
> mem,host=ubuntu2004
active=1144344576i,available=3518758912i,available_percent=85.25516847152974,buffered=164
536320i,cached=2911133696i,commit_limit=2559074304i,committed_as=1576108032i,dirty=6144
0i,free=731619328i,high_free=0i,high_total=0i,huge_page_size=2097152i,huge_pages_free=0i,hug
e_pages_total=0i,inactive=1903452160i,low_free=0i,low_total=0i,mapped=218427392i,page_table
s=3502080i,shared=651264i,slab=326660096i,sreclaimable=277262336i,sunreclaim=49397760i,sw
ap_cached=24576i,swap_free=495136768i,swap_total=495411200i,total=4127326208i,used=3200
36864i,used_percent=7.754096668677951,vmalloc_chunk=0i,vmalloc_total=35184372087808i,vm
alloc_used=6316032i,write_back=0i,write_back_tmp=0i 1602323878000000000
> system,host=ubuntu2004 load1=0,load15=0.05,load5=0.08,n_cpus=2i,n_users=4i 1602323878000000000
> disk,device=sda1,fstype=ext4,host=ubuntu2004,mode=rw,path=/
free=95962320896i,inodes_free=6365813i,inodes_total=6553600i,inodes_used=187787i,total=105
619841024i,used=5238685696i,used_percent=5.176515404753021 1602323878000000000
> diskio,host=ubuntu2004,name=sda1
io_time=351028i,iops_in_progress=0i,merged_reads=2995i,merged_writes=420522i,read_bytes=5
23574272i,read_time=3572i,reads=11978i,weighted_io_time=287724i,write_bytes=13355402240i,
write_time=574952i,writes=587911i 1602323878000000000
> diskio,host=ubuntu2004,name=sda
io_time=353848i,iops_in_progress=0i,merged_reads=2995i,merged_writes=420522i,read_bytes=5
25794304i,read_time=3581i,reads=12094i,weighted_io_time=288784i,write_bytes=13355402240i,
write_time=593845i,writes=641651i 1602323878000000000
> kernel,host=ubuntu2004
boot_time=1602216148i,context_switches=13167299i,entropy_avail=2803i,interrupts=8104602i,pr
ocesses_forked=107054i 1602323878000000000
> system,host=ubuntu2004 uptime=107730i 1602323878000000000
> system,host=ubuntu2004 uptime_format="1 day, 5:55" 1602323878000000000
Step 6 – Setup Grafana Data Source
Next, you will need to access the Grafana dashboard and add a data source to display the InfluxDB and Telegraf metrics.
You can access the Grafana Dashboard using the URL http://your-server-ip:3000/. You should see the Grafana login page:

Provide default username as admin and password as admin then click on the login button. You should see the password reset screen:

Note: Since Grafana version 7.2.2, many users have reported the default admin and password does not work. If this is the case, type the following on your server command prompt:
grafana-cli admin reset-admin-password mynewpassword
Provide your new password and click on the Submit button to change the default password. You should see the Grafana dashboard on the following page:
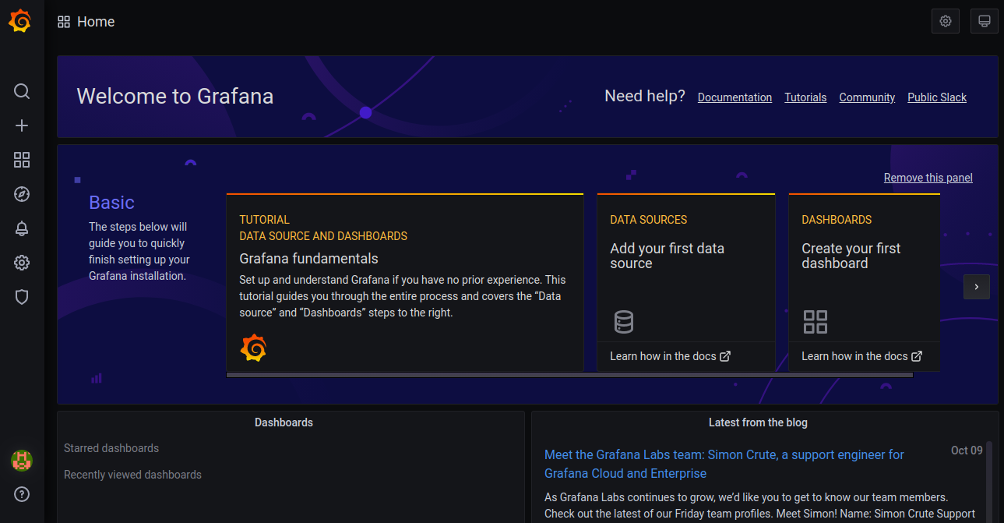
To add the data source, click on the Add your first data source. You should see the following screen:
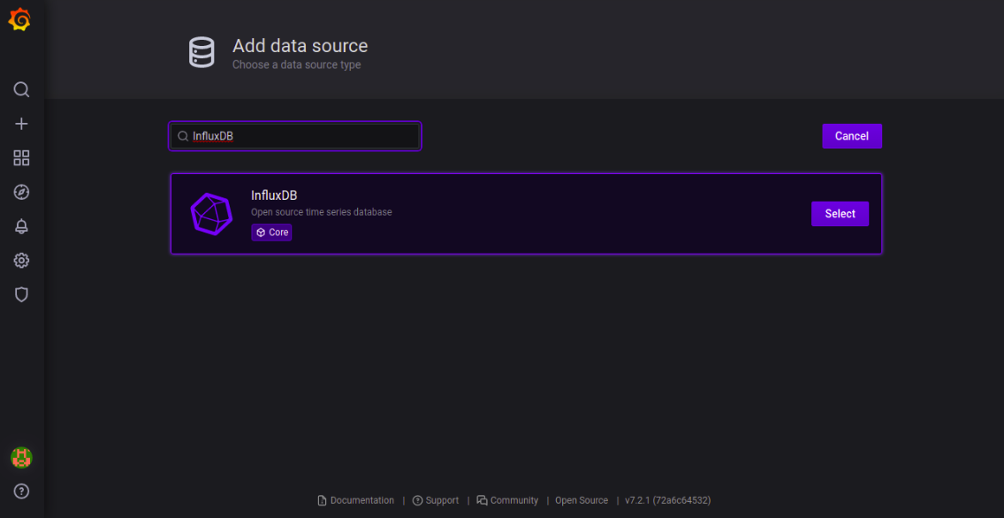
Search for InfluxDB and click on the Select button. You should see the following page:
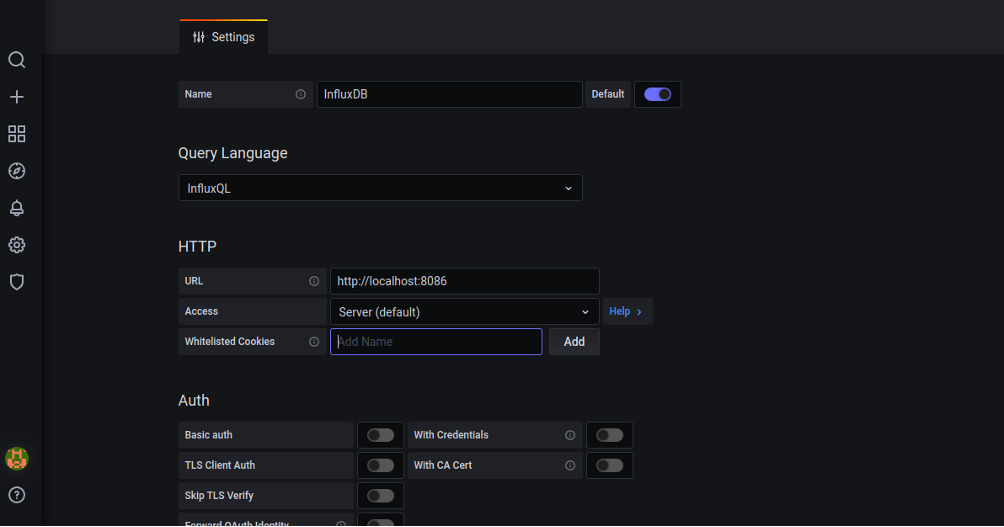
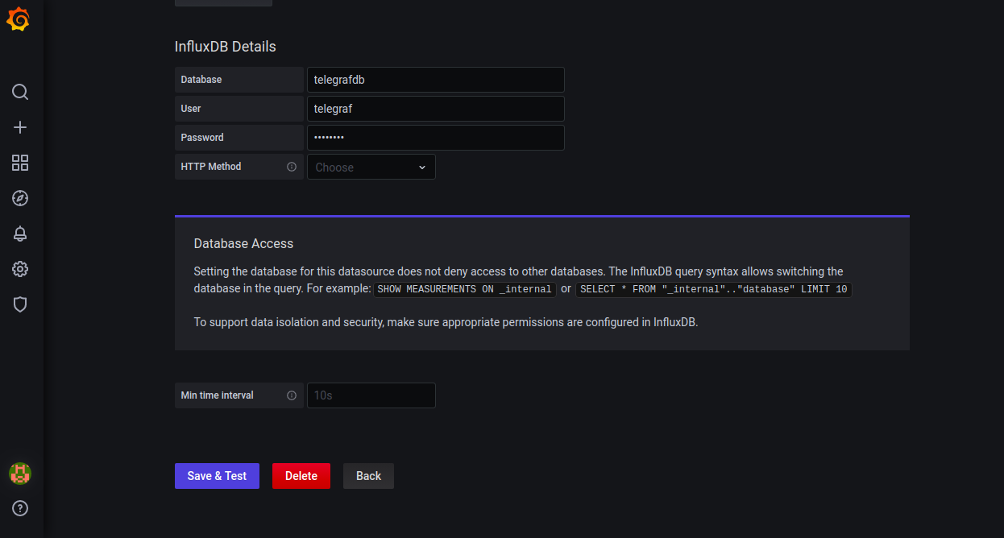
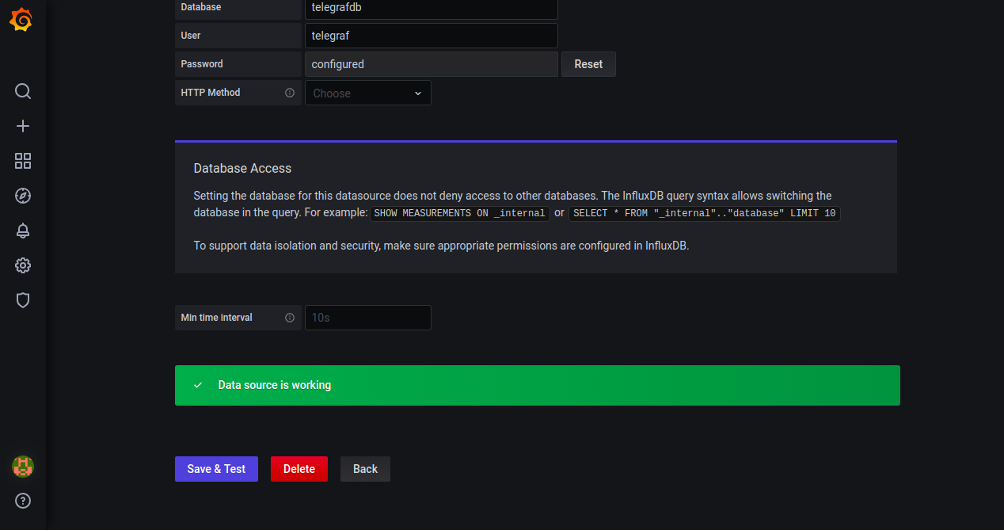
Set the name of the InfluxDB, select InfluxQL in Query Language, define the URL of the InfluxDB data source, provide InfluxDB database details, and click on the Save & Test button. Once the test is successful, you should see the following page:
Step 7 – Setup Grafana Dashboard
At this point, we have added InfluxDB as a data source to the Grafana server. Next, you will need to import the Grafana dashboard.
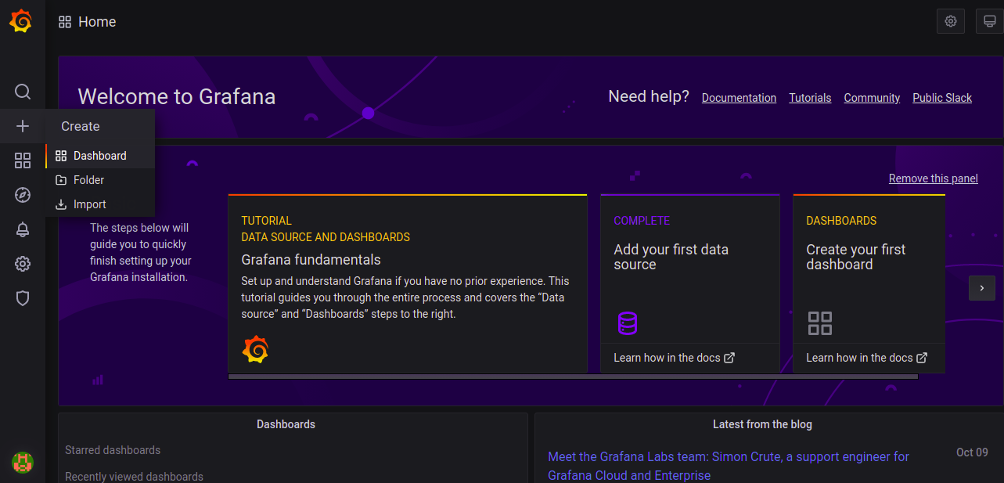
On the Grafana Dashboard, click on the ‘+’ menu on the left panel and click the ‘Import‘ button. You should see the following page:
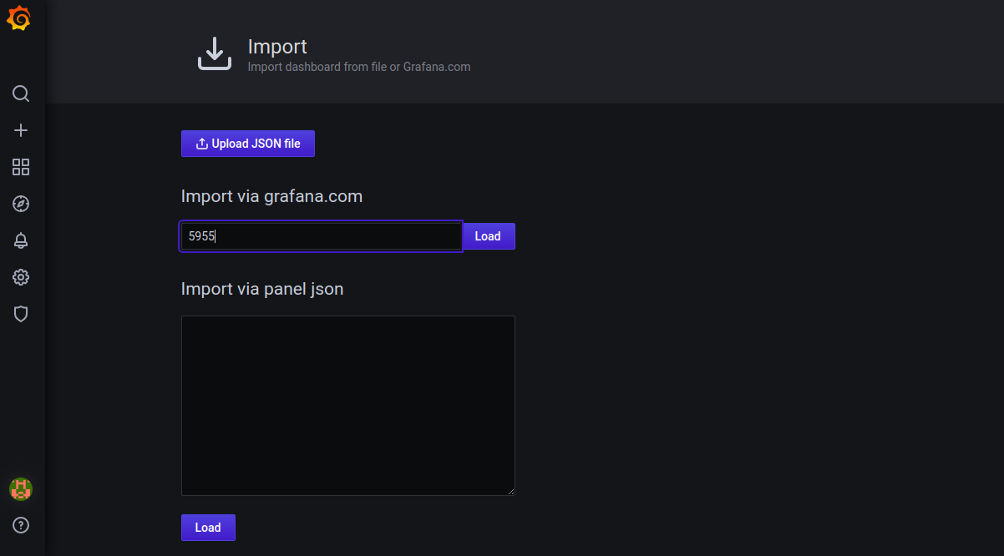
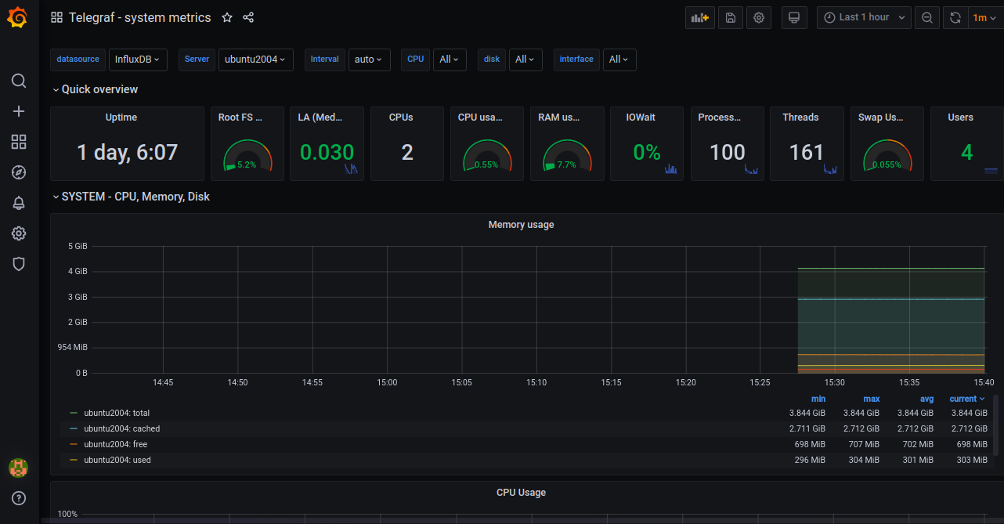
Type Grafana ID 5955 and click on the Load button to load the dashboard as shown below.
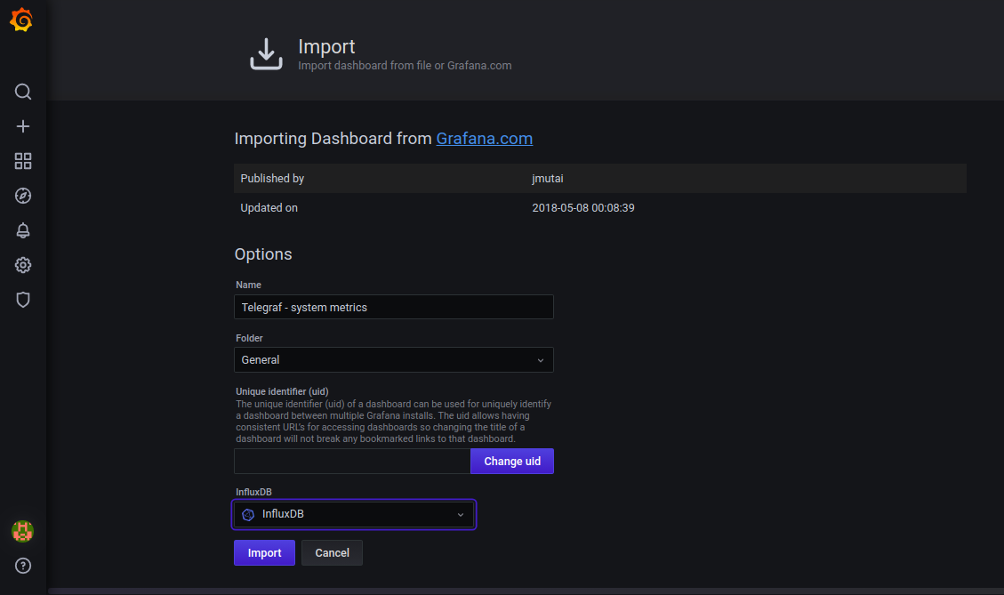
Select InfluxDB and click on the Import button. You should see the Grafana Dashboard showing the system metrics collected by the Telegraf agent:
Conclusion
Congratulations! You have successfully installed and configured a TIG stack on Ubuntu 20.04 server. You can now explore the Dashboard and start monitoring your server using the TIG stack. Try it on VPS Hosting from Atlantic.Net today!
* This post is for informational purposes only and does not constitute professional, legal, financial, or technical advice. Each situation is unique and may require guidance from a qualified professional.
Readers should conduct their own due diligence before making any decisions.