If you are a Linux system administrator, then monitoring the server load is necessary to maintain stable performance. The server load is an average of the amount of computational work that a computer system performs. It can be defined as an average load over a specific interval of time. If your server load is higher, it will become very slow, sometimes resulting in a shutdown.
In simple terms, the server load refers to the incoming traffic, login requests, hits, and whether the server is available for all users. There are many tools available in Linux for monitoring server load. Monitoring the server load through the command line can save your time and gives you an accurate value of the server load.
In this post, we will show you how to check server load in Linux.
Using Uptime Command
uptime is a very useful command in Linux that shows how long the system has been running. It also shows you a number of users together with load averages.
You can run the uptime command as shown below:
uptime
You will get the following output:
17:23:38 up 24 min, 1 user, load average: 0.81, 0.74, 0.78
A brief explanation of the above output is shown below:
- Your server is up from 24 minutes.
- Load average over the last 1 minute is 0.81
- Load average over the last 5 minutes is 0.74
- Load average over the last 15 minutes is 0.78
Also Read
How to Check Linux CPU Usage or Utilization
Using Vmstat Command
The vmstat command is a built-in monitoring utility in Linux. It shows you information about memory, system processes, paging, interrupts, block I/O, disk, and CPU scheduling.
For Ubuntu and Debian-based operating systems, install the Vmstat tool using the following command:
apt-get install sysstat -y
For CentOS, RHEL, Fedora, and Rocky Linux operating systems, install the Vmstat tool using the following command:
dnf install epel-release -y
dnf install sysstat -y
You can simply run it as shown below:
vmstat
You should get the following output:
procs -----------memory---------- ---swap-- -----io---- -system-- ------cpu-----
 r  b   swpd   free   buff  cache   si   so    bi    bo   in   cs us sy id wa st
 2  0      0 2392476 253040 1871552    0    0   548    92 1860 1569 15  4 76  5  0
In the above output, under the CPU column, “us” means resources used by the user, “sy” means resources used by the system, and “id” means the percentage of idle resources.
You can also run vmstat in a specific interval of time to see the loads in real-time.
vmstat 2 5
This command will call vmstat 5 times with an interval of 2 seconds between each call.
procs -----------memory---------- ---swap-- -----io---- -system-- ------cpu-----
 r  b   swpd   free   buff  cache   si   so    bi    bo   in   cs us sy id wa st
 3  0      0 2442280 253900 1833564    0    0   467    85 1847 1480 14  4 78  5  0
 0  0      0 2441988 253900 1833564    0    0     0     0 8250 2927  8  3 89  0  0
 1  0      0 2441804 253908 1833564    0    0     0    26 10561 2438  4  3 92  1  0
 1  0      0 2441404 253916 1833588    0    0    12    20  352  425  1  0 97  2  0
 1  0      0 2449468 253916 1825388    0    0     0     0  324  380  1  1 98  0  0
Using Top Command
The top command is a built-in Linux command that shows a real-time view of running processes, load average, CPU, and memory usage.
Run the top command as shown below:
top
You should see the following output:
top - 17:37:26 up 38 min,  1 user,  load average: 0.90, 0.92, 0.84
Tasks: 331 total,   1 running, 283 sleeping,   0 stopped,   0 zombie
%Cpu(s): 11.6 us,  2.7 sy,  0.0 ni, 85.5 id,  0.2 wa,  0.0 hi,  0.0 si,  0.0 st
KiB Mem :  7580260 total,  2385556 free,  3105780 used,  2088924 buff/cache
KiB Swap:  2097148 total,  2097148 free,        0 used.  3930244 avail Mem

  PID USER      PR  NI    VIRT    RES    SHR S  %CPU %MEM     TIME+ COMMAND
 2314 vyom      20   0 3470536 215568  97432 S  10.9  2.8   1:28.77 gnome-shell
 2161 vyom      20   0  979252  81892  52560 S   6.3  1.1   0:51.52 Xorg
 3334 vyom      20   0  750476  52016  30808 S   3.6  0.7   0:20.63 gedit
 3272 vyom      20   0  795964  37960  28272 S   1.7  0.5   0:01.73 gnome-terminal-
Also Read
Install Ntopng to Monitor Network Traffic on Ubuntu 20.04
Using Glances Tool
Glances is a cross-platform and command-line system monitoring tool written in Python. It can monitor CPU, Load Average, Memory, Network Interfaces, Disk I/O, Processes, and File System space utilization.
For Ubuntu and Debian-based operating system, install the Glances tool using the following command:
apt-get install glances -y
For CentOS, RHEL, Fedora, and Rocky Linux operating systems, install the Glances tool using the following command:
dnf install epel-release -y
dnf install glances -y
Now, run the Glances tool as shown below
glances
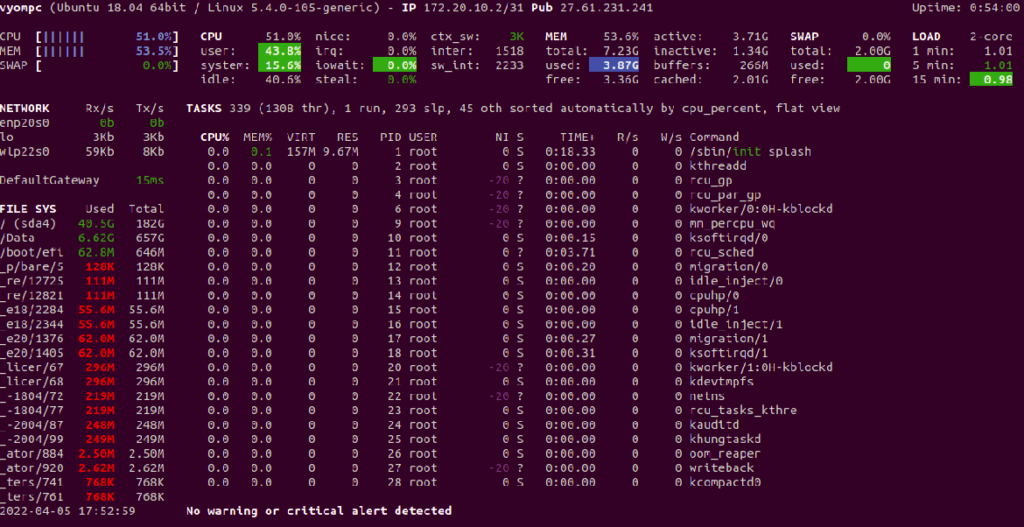
You will get the following screen:
You can also monitor Glances via a web browser. To do so, run the Glances tool with –w option:
glances -w
This will start Glances on port 61208:
Glances web server started on http://0.0.0.0:61208/
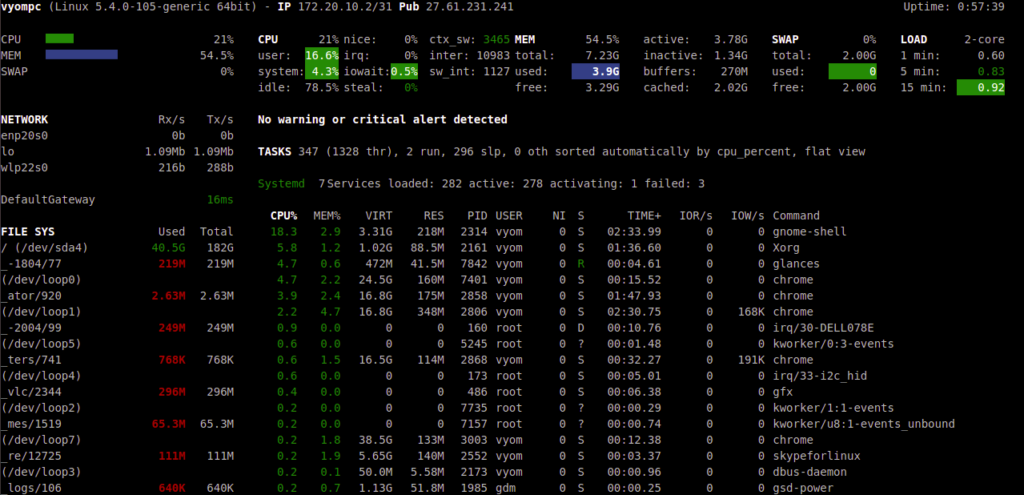
You can now access Glances via a web browser using the URL http://your-server-ip:61208. You should see the following screen:
Conclusion
In the above guide, we explained how to check server load using different tools. You can now choose any tools as per your requirement. Try it on VPS hosting from Atlantic.Net!
Read More About Load Balancing
- Load Balanced Servers from Atlantic.Net
- How Load Balancing Servers Works
* This post is for informational purposes only and does not constitute professional, legal, financial, or technical advice. Each situation is unique and may require guidance from a qualified professional.
Readers should conduct their own due diligence before making any decisions.