Ganglia is a free, open-source, scalable distributed monitoring tool designed for high-performance computing systems. It runs on all major operating systems and can handle clusters with 2000 nodes. Ganglia uses RRDtool for data storage and visualization, XML for data representation and XDR for compact, portable data transport. It comes with a simple and easy to use web interface that can be used to display live statistics and metrics, such as average CPU load and network utilization for multiple systems.
In this tutorial, we will explain how to install Ganglia monitoring server and client on Ubuntu 18.04.
Step 1 – Install Apache, MariaDB and PHP
Before starting, LAMP server must be installed in your system. If not installed, you can install it with the following command:
apt-get install apache2 mariadb-server php libapache2-mod-php php-mbstring php-curl php-zip
php-gd php-mysql php-curl unzip wget -y
Once installed, edit the php.ini file and tweak some settings:
nano /etc/php/7.2/apache2/php.ini
Change the following lines:
memory_limit = 256M
upload_max_filesize = 100M
max_execution_time = 360
max_input_vars = 1500
date.timezone = America/Chicago
Save and close the file, then restart the Apache service to apply the changes.
systemctl restart apache2
Step 2 – Install Ganglia Server
By default, Ganglia is available in the Ubuntu 18.04 default repository. You can install it with other required packages using the following command:
apt-get install ganglia-monitor rrdtool gmetad ganglia-webfrontend -y
Note: You will be asked to automatically restart apache2 – select YES.
Once all the packages are installed, start the Ganglia service and enable it to start at boot with the following command:
systemctl start ganglia-monitor
systemctl start gmetad
systemctl enable ganglia-monitor
systemctl enable gmetad
Step 3 – Configure Ganglia Server
First, you will need to edit the /etc/ganglia/gmetad.conf file and define your master server.
nano /etc/ganglia/gmetad.conf
Find the following line:
data_source "my cluster" localhost
Replace it with the following line:
data_source "mycluster" 50 localhost your-server-ip:8649
Save and close the file.
Next, edit the /etc/ganglia/gmond.conf file as shown below:
nano /etc/ganglia/gmond.conf
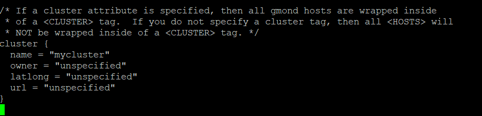
Change the following section:
cluster {
name = "mycluster"
owner = "unspecified"
latlong = "unspecified"
url = "unspecified"
}

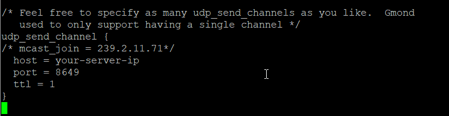
udp_send_channel {
/* mcast_join = 239.2.11.71*/
host = your-server-ip
port = 8649
ttl = 1
}

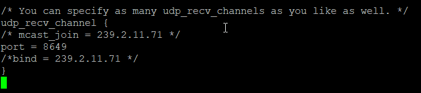
udp_recv_channel {
/* mcast_join = 239.2.11.71 */
port = 8649
/*bind = 239.2.11.71 */
}

Save and close the file when you are finished.
Next, you will need to copy the Ganglia configuration file to the Apache virtual host directory.
You can copy it with the following command:
cp /etc/ganglia-webfrontend/apache.conf /etc/apache2/sites-enabled/ganglia.conf
Next, restart the Ganglia and Apache services to apply the changes:
systemctl restart ganglia-monitor
systemctl restart gmetad
systemctl restart apache2
Step 4 – Install and Configure Ganglia Client
Next, you will need to install and configure the Ganglia client on the client system so that you can monitor it from the Ganglia server.
On the Ganglia client system, install the Ganglia client package with the following command:
apt-get install ganglia-monitor -y
Once installed, edit the /etc/ganglia/gmond.conf file and define the Ganglia server details:
nano /etc/ganglia/gmond.conf
Change the following section by adding your server IP:
udp_send_channel {
/* mcast_join = 239.2.11.71*/
host = your-server-ip
port = 8649
ttl = 1
}
Save and close the file, then restart the Ganglia service to apply the changes:
systemctl restart ganglia-monitor
Step 5 – Access Ganglia Dashboard
Now, open your web browser and access the Ganglia dashboard using the URL http://your-server-ip/ganglia
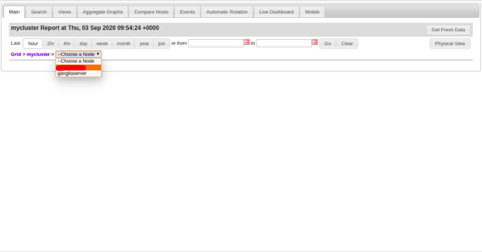
You should see the following screen:
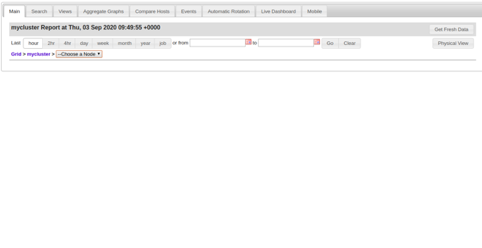
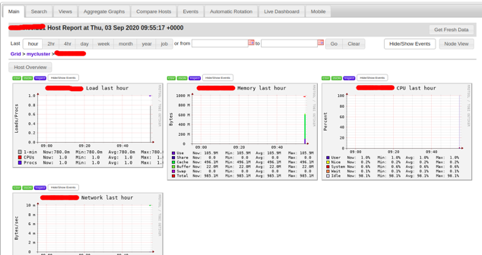
Now, click on the “Choose a Node” and select your server. You should see detailed information about your server in the following screen:
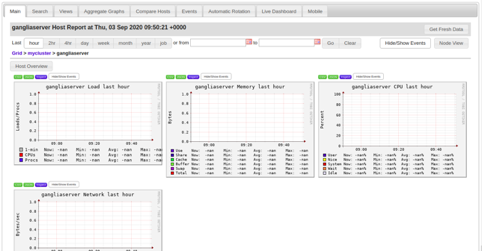
Next, click on the “Choose a Node” and select your client. You should see detailed information about your client in the following screen:
Conclusion
Congratulations! You have successfully installed Ganglia monitoring server and client on Ubuntu 18.04. You can now add more clients and start monitoring from the Ganglia dashboard. This process can also be completed on a VPS Hosting account from Atlantic.Net!
* This post is for informational purposes only and does not constitute professional, legal, financial, or technical advice. Each situation is unique and may require guidance from a qualified professional.
Readers should conduct their own due diligence before making any decisions.