Table of Contents
- Why It Is Worth Validating Storage Performance Up Front
- The Metrics That Matter Most
- “SSD” Still Does Not Tell You Enough
- How to Benchmark a Cloud Server Properly
- Example Results From a Tested Atlantic.Net Cloud Server Environment
- Questions Worth Asking Before You Commit
- What You Should Look For in a Provider Response
- Final Thoughts
For databases, logging stacks, indexing engines, analytics pipelines, and other disk-heavy applications, storage performance can become the real bottleneck long before CPU or RAM does. It’s critical to understand exactly what the server’s underlying performance is. Two cloud server plans can look similar on paper and behave very differently under sustained random I/O.
This is why it’s essential to validate server storage performance before you commit.
This guide explains how to evaluate cloud server disk performance in a practical way, what to ask a provider before buying, and which benchmark data is actually useful when deciding whether a plan can support your workload.
Why It Is Worth Validating Storage Performance Up Front
Most cloud server product pages do a reasonable job listing vCPU, RAM, and storage capacity. What they often do not show is the information that matters most to performance-sensitive buyers:
- 4K random read and write IOPS
- latency at p99 and p99.9
- whether performance is capped per disk or per plan
- whether results are based on burst behavior or steady-state testing
- whether the published figures are general platform claims or plan-specific measurements
That gap matters because a storage layer that looks fine in a generic plan comparison can still perform poorly for real workloads, especially under random access or sustained write pressure.
Validating storage before purchase reduces the risk of picking the wrong plan, discovering limitations after deployment, and then having to migrate again.
The Metrics That Matter Most
You do not need every possible storage metric to make a sensible buying decision, but you do need the right ones.
Random Read IOPS
Random read IOPS is one of the most useful indicators for database-heavy and lookup-heavy workloads. It gives you a clearer picture of how well a platform handles many small reads rather than large sequential transfers.
For most buyers, this should be tested at a 4K block size, because that is a common reference point and makes results easier to compare.
Latency
Latency matters just as much as raw IOPS, and often more.
Average latency can hide outliers. That is why percentile latency matters:
- p50 shows typical responsiveness
- p99 shows how the platform behaves near the tail
- p99.9 shows whether rare slow operations are becoming a real problem
A storage platform can produce impressive top-line IOPS while still feeling inconsistent in production if tail latency is unstable.
Random Write Performance
Write performance matters for more than just bulk data ingestion. It also affects logging, journaling, cache backends, and transactional workloads.
A provider may have strong read performance and still show materially higher write latency, so it is worth testing both.
“SSD” Still Does Not Tell You Enough
“SSD” is a useful starting point, but it does not tell you:
- whether the storage is NVMe or another SSD class
- whether the storage is local or backed by a shared storage layer
- whether IOPS limits apply at the disk level
- whether performance is designed to burst or remain stable over time
Buyers with performance-sensitive applications should look past the label and focus on measured results.
How to Benchmark a Cloud Server Properly
If a provider can offer a short evaluation window or hourly billing, the most reliable way to validate storage is to benchmark the actual plan you intend to use.
A good baseline test should:
- use a repeatable tool such as fio
- run with direct I/O where appropriate
- record block size, queue depth, runtime, and job count
- separate read and write tests
- include percentile latency, not just throughput or averages
For practical pre-purchase validation, a simple test set usually includes:
- 4K random read
- 4K random write
- percentile latency reporting
- additional low-queue-depth testing if the workload is latency-sensitive
Example Results From a Tested Atlantic.Net Cloud Server Environment
To make this more practical, here is what a tested Atlantic.Net Cloud Server in USA-EAST-1 (Orlando) produced using fio 3.36 with 4K block size, direct I/O, iodepth=64, numjobs=1, and a 60-second runtime. These figures give buyers a clearer picture of what measured Cloud Server storage performance looks like when test conditions are properly stated.
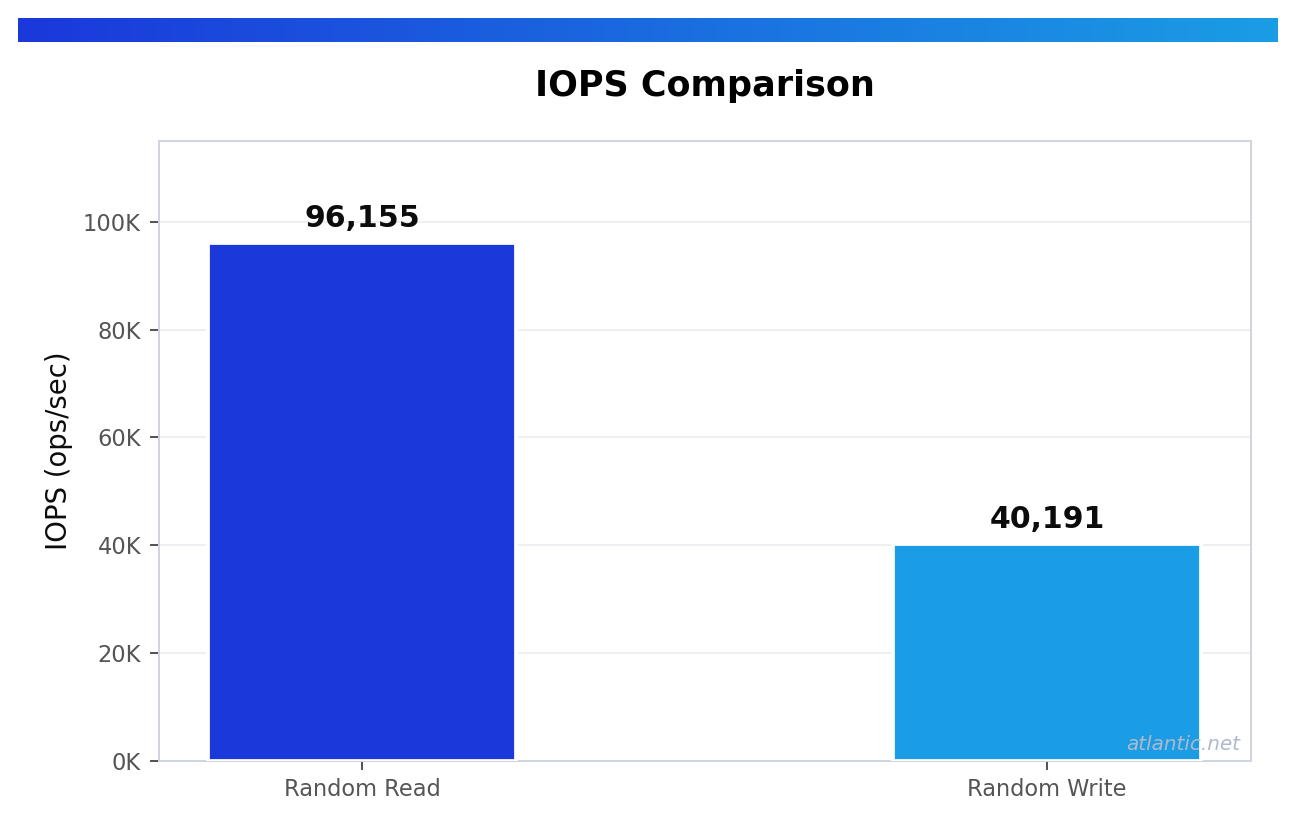
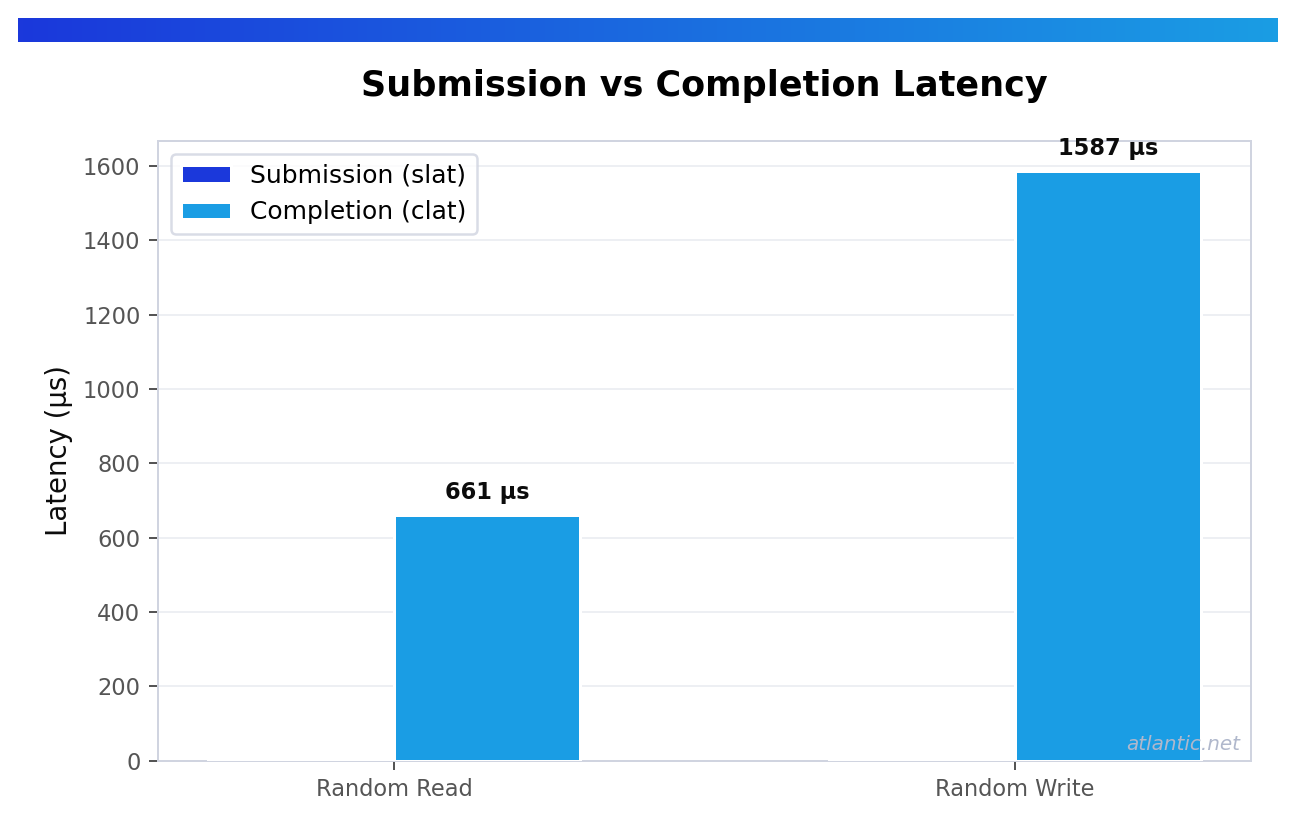
4K Random Read
The tested Atlantic.Net environment delivered about 96,155 random read IOPS, with read latency of roughly:
- p50: 0.659 ms
- p99: 0.733 ms
- p99.9: 1.729 ms
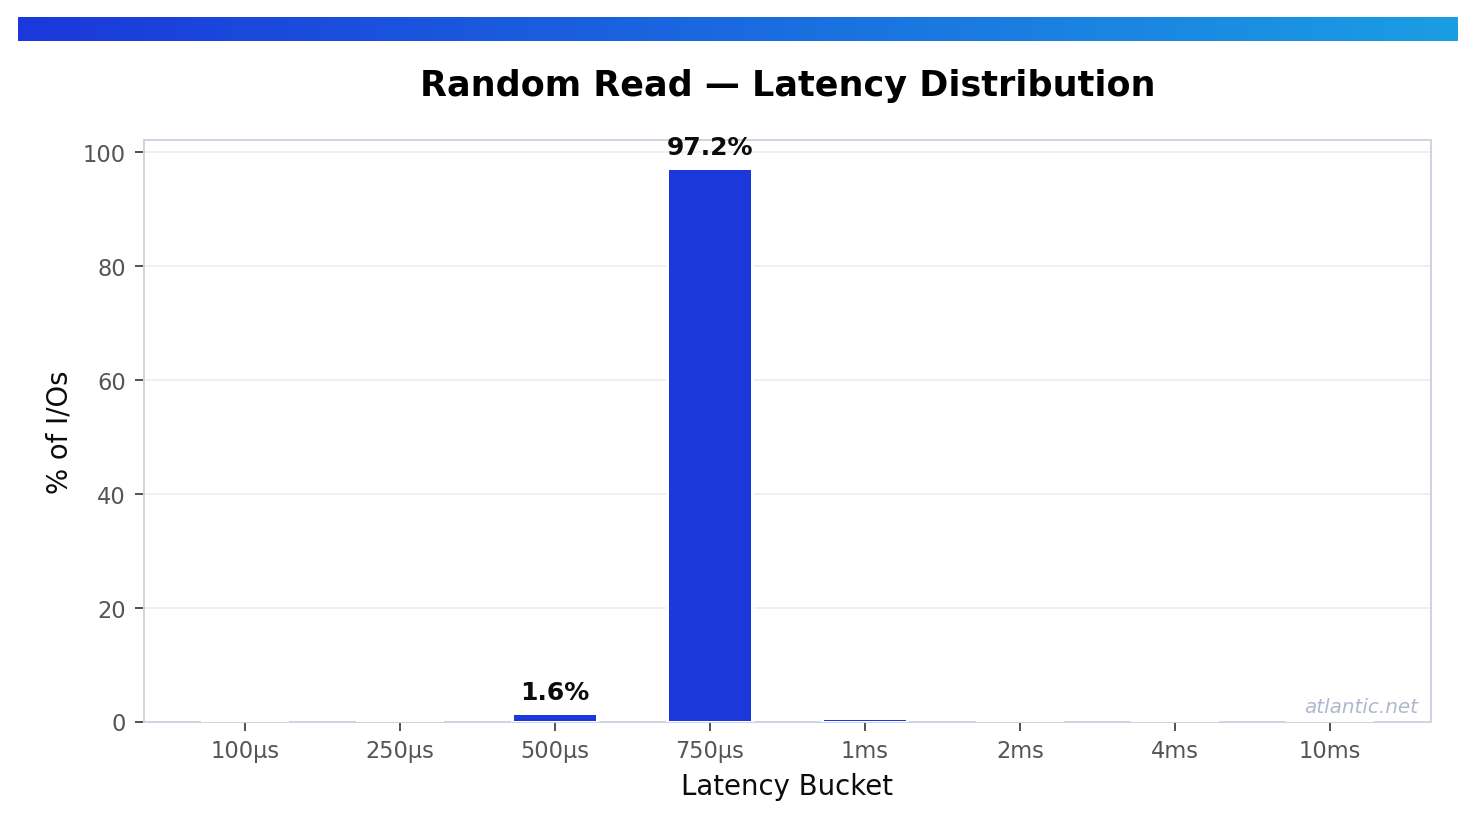
That is a strong result for a VPS benchmark. For buyers running read-heavy databases, search workloads, caching layers, or other lookup-driven applications, this level of random read performance shows that a well-tested VPS environment can deliver both high throughput and low tail latency.
4K Random Write
The same Atlantic.Net test environment delivered about 40,191 random write IOPS, with write latency of roughly:
- p50: 1.581 ms
- p99: 3.719 ms
- p99.9: 13.304 ms
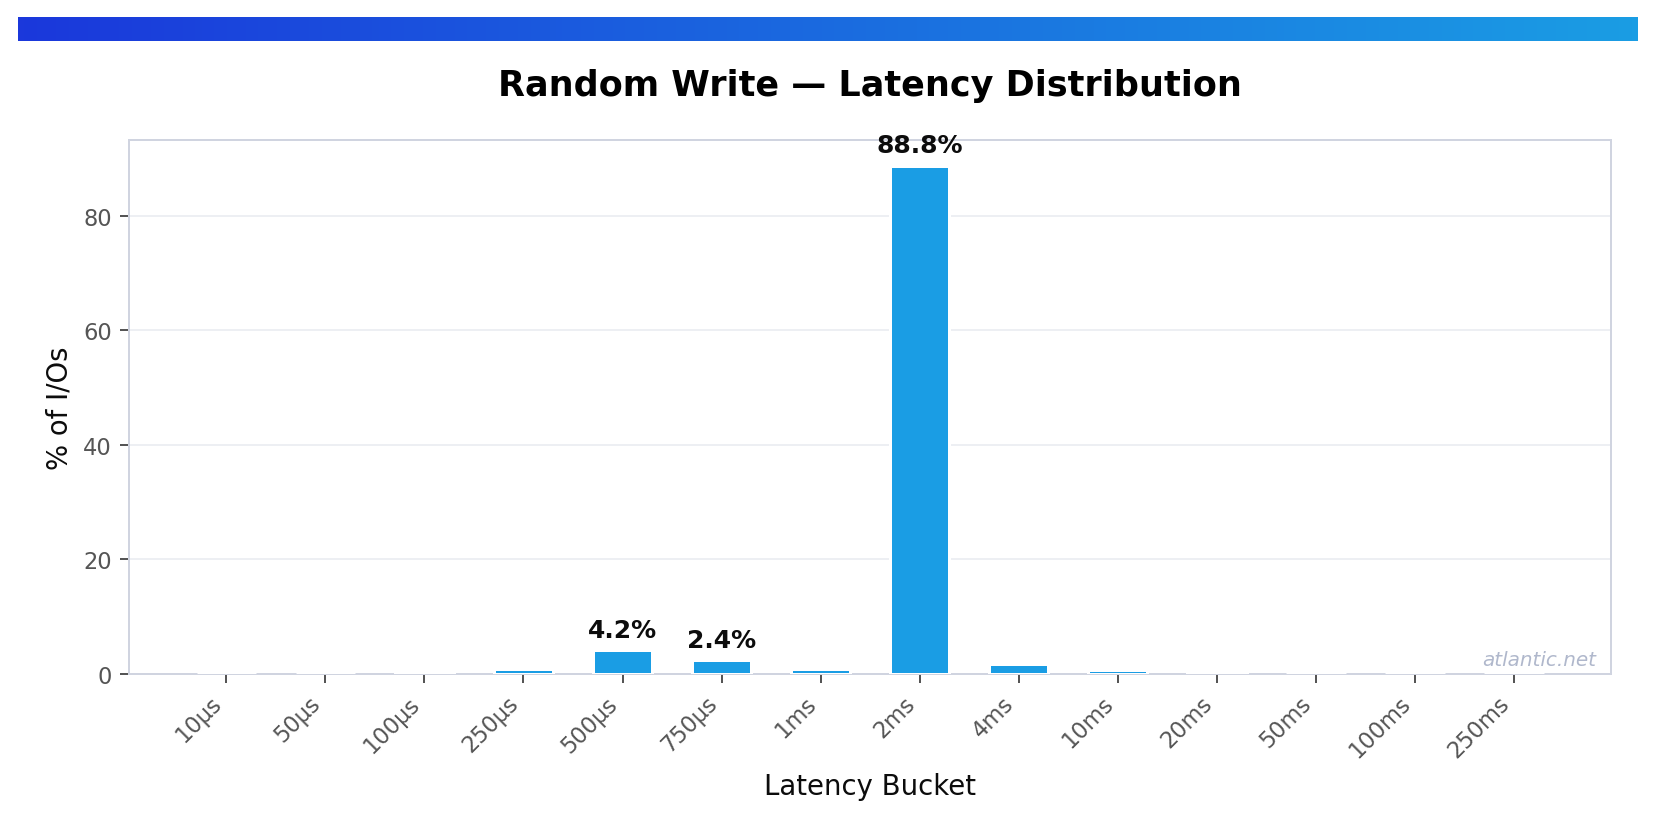
That is still solid write performance for a VPS test, but it also highlights an important reality: write behavior often differs materially from read behavior. For logging platforms, write-heavy databases, and journaled workloads, that is exactly why both directions should be benchmarked before making a final decision.
What These Results Actually Tell You
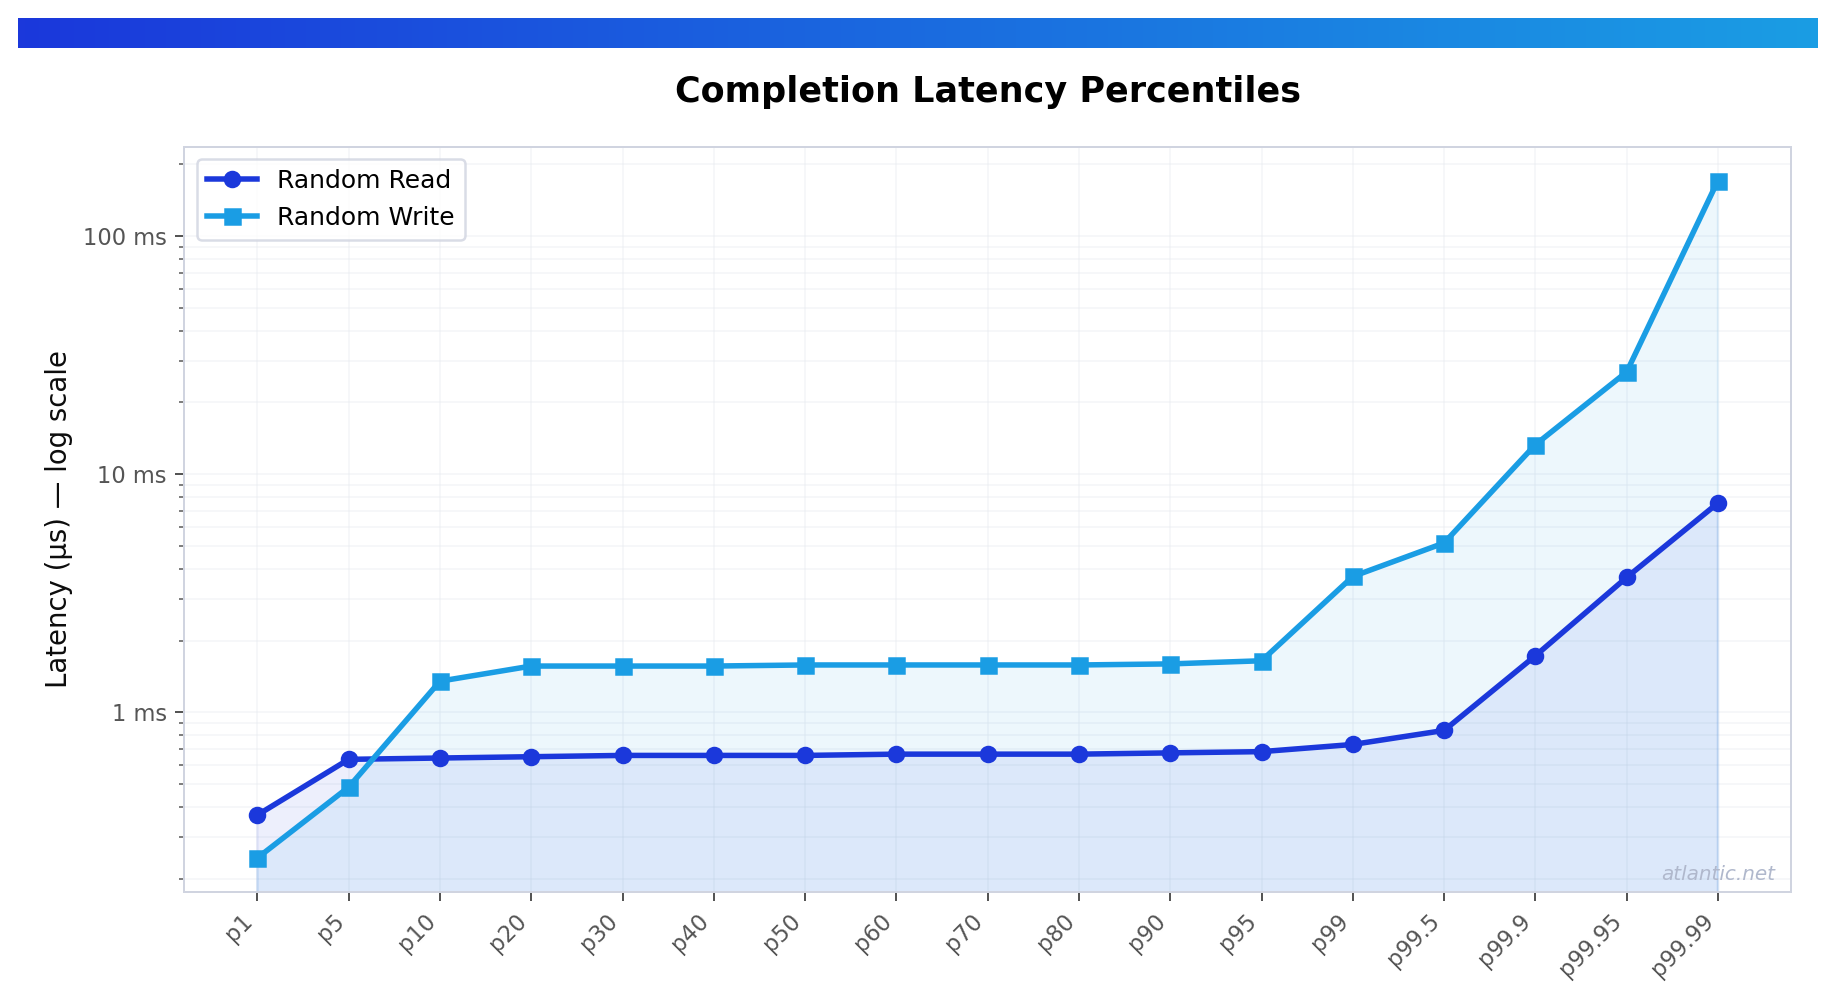
The benchmark above supports several useful conclusions.
First, the tested Atlantic.Net VPS environment showed very strong 4K random read performance. At roughly 96K read IOPS with p99.9 read latency under 2 ms, it would be a credible fit for many read-heavy workloads where responsiveness and steady random access matter.
Second, it showed good random write throughput, but with a noticeably heavier latency tail on writes than on reads. That does not make the platform unsuitable. It simply reinforces the point that serious buyers should evaluate storage against their own workload profile rather than relying on a single headline number.
Third, the benchmark is useful because the test conditions are clear. Without the block size, queue depth, direct I/O setting, runtime, and region, the numbers would be much less valuable for comparison. That is also why provider responses backed by measured results are far more useful than generic “fast SSD” claims.
Questions Worth Asking Before You Commit
Even with benchmark data, buyers should still ask a provider for a few practical details:
- what exact plan was tested
- whether IOPS are limited per disk or by plan
- whether performance is best-effort or guaranteed
- whether the published numbers are from a real plan or a broad platform average
- whether the tested region matches the intended deployment region
For performance-sensitive projects, those details matter as much as the benchmark itself.
What You Should Look For in a Provider Response
A good provider response should include:
- the exact plan or nearest equivalent tested
- the region tested
- 4K random read and write results
- percentile latency
- whether any IOPS cap applies
- whether performance is best-effort or otherwise policy-limited
- the benchmark method used
The more specific the response, the easier it is to judge whether a plan is genuinely suitable for your workload.
Final Thoughts
Cloud server disk performance should not be judged solely by storage labels.
If your project depends on strong random I/O and predictable latency, ask for measured results, review the test settings, and compare the numbers to your workload rather than relying on generic product-page language.
A short benchmark on the actual plan is ideal. If that is not available, plan-specific fio data is still far more useful than a vague promise of “fast SSD storage.”
What to know more? Did you know you can deploy a Cloud Server directly from the Atlantic.Net Cloud console? Try it now, deploy a server in your local region, and witness the breakneck performance of the ACP Cloud.
* This post is for informational purposes only and does not constitute professional, legal, financial, or technical advice. Each situation is unique and may require guidance from a qualified professional.
Readers should conduct their own due diligence before making any decisions.