Grafana is a free and open-source data visualization and monitoring tool used for monitoring and visualizing metrics from remote machines. It can be used with Prometheus, InfluxDB, Graphite, and ElasticSearch to gather metrics and display them on the user-friendly dashboard. Grafana allows you to share the generated graphs as snapshots with other users. You can also write your own plugins from scratch to integrate several different data sources.
In this post, we will show you how to install Grafana on Oracle Linux 10.
Step 1 – Add a Grafana Repo
By default, the Grafana package is not included in the Oracle Linux default repo, so you will need to create a new one for Grafana. You can create it with the following command:
nano /etc/yum.repos.d/grafana.repo
Add the following lines:
[grafana]
name=grafana
baseurl=https://packages.grafana.com/oss/rpm
repo_gpgcheck=1
enabled=1
gpgcheck=1
gpgkey=https://packages.grafana.com/gpg.key
sslverify=1
sslcacert=/etc/pki/tls/certs/ca-bundle.crt
Save and close the file, then verify the added repo using the following command:
dnf repolist
You should see the following output:
repo id                                    repo name
grafana                                    grafana
ol8_UEKR6                                  Latest Unbreakable Enterprise Kernel Release 6 for Oracle Linux 10 (x86_64)
ol8_appstream                              Oracle Linux 10 Application Stream (x86_64)
ol8_baseos_latest                          Oracle Linux 10 BaseOS Latest (x86_64)
Next, verify the Grafana package information using the following command:
dnf info grafana -y
You should see the following output:
Name : grafana
Version : 12.3.0
Release : 1
Architecture : x86_64
Size : 184 M
Source : grafana-12.3.0-1.src.rpm
Repository : grafana
Summary : Grafana
URL : https://grafana.com
License : AGPLv3
Description : Grafana
Step 2 – Install Grafana
Now, run the following command to install the Grafana package on your server.
dnf install grafana -y
Once the Grafana is installed, start the Grafana service and enable it to start at system reboot:
systemctl start grafana-server
systemctl enable grafana-server
You can also check the status of the Grafana service with the following command:
systemctl status grafana-server
You should see the following output:
● grafana-server.service - Grafana instance
Loaded: loaded (/usr/lib/systemd/system/grafana-server.service; disabled; preset: disabled)
Active: active (running) since Fri 2025-12-05 06:54:19 EST; 30s ago
Invocation: 90666f347af44677a6ad85cf0ab8e476
Docs: http://docs.grafana.org
Main PID: 64657 (grafana)
Tasks: 8 (limit: 24812)
Memory: 443M (peak: 445.2M)
CPU: 3.097s
CGroup: /system.slice/grafana-server.service
└─64657 /usr/share/grafana/bin/grafana server --config=/etc/grafana/grafana.ini --pidfile=/var/run/grafana/grafana-server.pid --packaging=rpm cfg:default.paths.logs=/var/>1-04:00 level=info msgy default, Grafana listens on port 3000. You can check it with the following command:
ss -antpl | grep 3000
You should see the following output:
LISTEN 0 128 *:3000 *:* users:(("grafana-server",pid=7063,fd=9))
Step 3 – Configure Nginx as a Reverse Proxy for Grafana
It is recommended to configure Nginx as a reverse proxy so you can access the Grafana without specifying port 3000.
First, install the Nginx server with the following command:
dnf install nginx -y
Once the Nginx package is installed, create an Nginx virtual host configuration file for Grafana:
nano /etc/nginx/conf.d/grafana.conf
Add the following lines:
server {
        server_name grafana.example.com;
        listen 80 ;
        access_log /var/log/nginx/grafana.log;

        location / {
                proxy_pass http://localhost:3000;
                proxy_set_header Host $http_host;
                proxy_set_header X-Forwarded-Host $host:$server_port;
                proxy_set_header X-Forwarded-Server $host;
                proxy_set_header X-Forwarded-For $proxy_add_x_forwarded_for;
        }
}
Save and close the file, then edit the Nginx main configuration file:
nano /etc/nginx/nginx.conf
Add the following line below http {:
server_names_hash_bucket_size 64;
Save and close the file, then verify the Nginx configuration file:
nginx -t
If your configuration is correct, you will see the message output ‘syntax is ok’ as below.
nginx: the configuration file /etc/nginx/nginx.conf syntax is ok
nginx: configuration file /etc/nginx/nginx.conf test is successful
Finally, start and enable the Nginx service:
systemctl start nginx
systemctl enable nginx
You can also check the Nginx status using the following command:
systemctl status nginx
You will get the following output:
● nginx.service - The nginx HTTP and reverse proxy server
Loaded: loaded (/usr/lib/systemd/system/nginx.service; disabled; preset: disabled)
Drop-In: /etc/systemd/system/nginx.service.d
└─php-fpm.conf
Active: active (running) since Fri 2025-12-05 06:56:07 EST; 4min 15s ago
Invocation: 97efc99d02ca43948d6e6662d71e6d63
Process: 64808 ExecStartPre=/usr/bin/rm -f /run/nginx.pid (code=exited, status=0/SUCCESS)
Process: 64810 ExecStartPre=/usr/sbin/nginx -t (code=exited, status=0/SUCCESS)
Process: 64812 ExecStart=/usr/sbin/nginx (code=exited, status=0/SUCCESS)
Main PID: 64814 (nginx)
Tasks: 3 (limit: 24812)
Memory: 5.5M (peak: 18.2M)
CPU: 71ms
CGroup: /system.slice/nginx.service
├─64814 "nginx: master process /usr/sbin/nginx"
├─64815 "nginx: worker process"
└─64816 "nginx: worker process"
Step 4 – Access Grafana Dashboard
At this point, Grafana is installed and running. You can now access the Grafana dashboard using the URL http://grafana.example.com. You should see the Grafana login page:
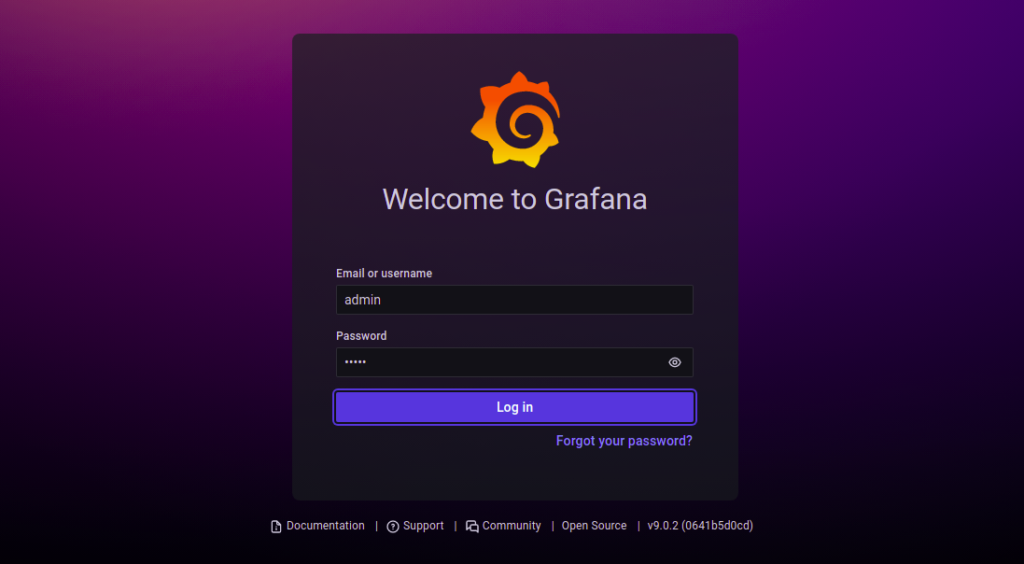
Provide the default username and password as admin then click on the Log in button. You should see the change password screen:
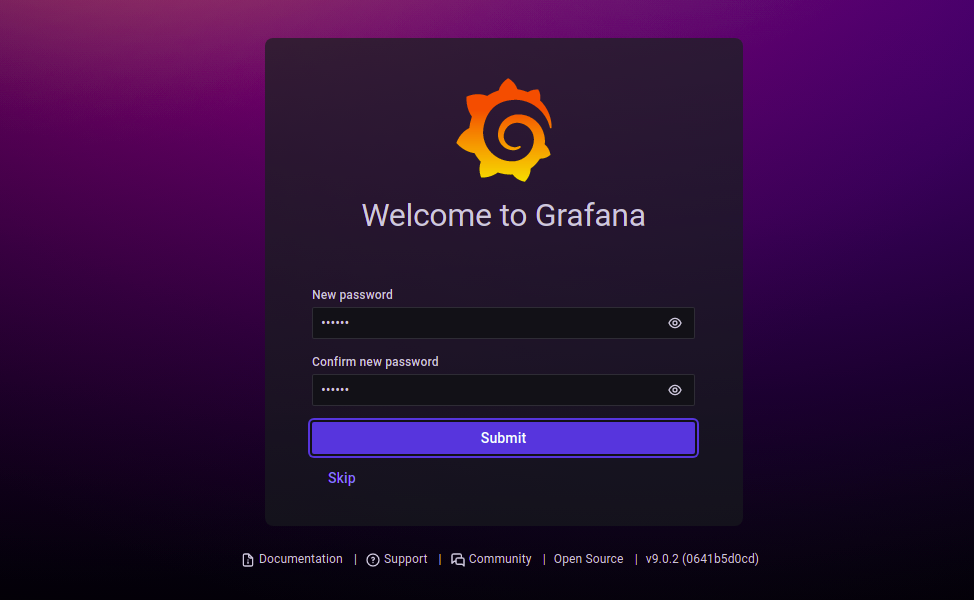
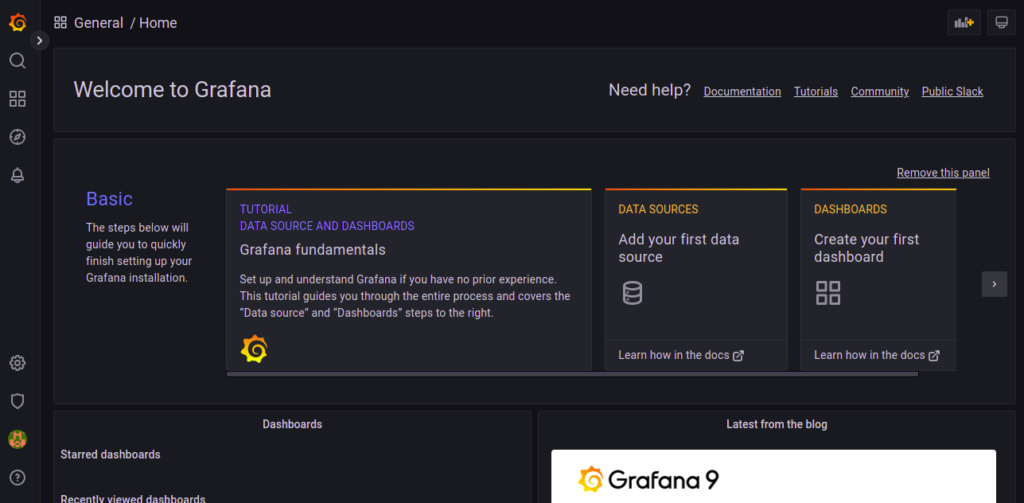
Change your default admin password and click on the Change Password button. You should see the Grafana dashboard on the following page:
Conclusion
In this post, we explained how to install Grafana with Nginx as a reverse proxy on Oracle Linux 10. You can now add external data sources to Grafana and start monitoring them from the web-based interface. For more information, visit the Grafana documentation page. Give it a try on your dedicated server from Atlantic.Net!
* This post is for informational purposes only and does not constitute professional, legal, financial, or technical advice. Each situation is unique and may require guidance from a qualified professional.
Readers should conduct their own due diligence before making any decisions.