If you are a system administrator managing a Linux server, you want a simple tool that helps to monitor your server. Darkstat is a network traffic monitoring tool that calculates and reports usage statistics sent over the HTTP server. It is a lightweight, simple, and real-time network statistics tool with an integrated webserver. Darkstat supports IPv6 protocol and asynchronous reverse DNS resolution.
In this post, we will show you how to install and use Darkstat Network Traffic Analyzer in Linux.
Step 1 – Install Darkstat
By default, Darkstat is included in the default repository of all major Linux operating systems.
For Ubuntu and Debian operating systems, install Darkstat with the following command:
apt-get install darkstat -y
For CentOS and RHEL operating systems, install Darkstat with the following command:
dnf install darkstat -y
Once the Darkstat package is installed, you can proceed to the next step.
Step 2 – Configure Darkstat
Next, you will need to edit the Darkstat main configuration file and define your network interface, port, and listening IP address:
nano /etc/darkstat/init.cfg
Change the following lines:
START_DARKSTAT=yes
INTERFACE="-i eth0"
DIR="/var/lib/darkstat"
PORT="-p 666"
BINDIP="-b 0.0.0.0"
DAYLOG="--daylog darkstat.log"
Save and close the file when you are finished, then restart the Darkstat service to apply the changes:
systemctl restart darkstat
You can now check the status of the Darkstat with the following command:
systemctl status darkstat
You should see the following output:
● darkstat.service - LSB: start darkstat monitoring system at boot time
     Loaded: loaded (/etc/init.d/darkstat; generated)
     Active: active (running) since Sun 2021-08-15 07:40:05 UTC; 6s ago
       Docs: man:systemd-sysv-generator(8)
    Process: 6092 ExecStart=/etc/init.d/darkstat start (code=exited, status=0/SUCCESS)
      Tasks: 2 (limit: 2353)
     Memory: 792.0K
     CGroup: /system.slice/darkstat.service
             ├─6100 /usr/sbin/darkstat -i eth0 -p 666 --chroot /var/lib/darkstat --pidfile /var/run/darkstat.pid -b 0.0.0.0 --daylog darkstat.>
             └─6101 /usr/sbin/darkstat -i eth0 -p 666 --chroot /var/lib/darkstat --pidfile /var/run/darkstat.pid -b 0.0.0.0 --daylog darkstat.>

Aug 15 07:40:05 ubuntu2004 systemd[1]: Starting LSB: start darkstat monitoring system at boot time...
Aug 15 07:40:05 ubuntu2004 darkstat[6092]:  * Starting darkstat network daemon : darkstat
Aug 15 07:40:05 ubuntu2004 darkstat[6092]:  * done
Aug 15 07:40:05 ubuntu2004 darkstat[6092]:    ...done.
Aug 15 07:40:05 ubuntu2004 systemd[1]: Started LSB: start darkstat monitoring system at boot time.
Step 3 – Access Darkstat Web UI
At this point, Darkstat is running and listening on port 666. You can check it with the following command:
ss -antpl | grep 666
You should see the following output:
LISTEN 0 128 0.0.0.0:666 0.0.0.0:* users:(("darkstat",pid=6100,fd=8))
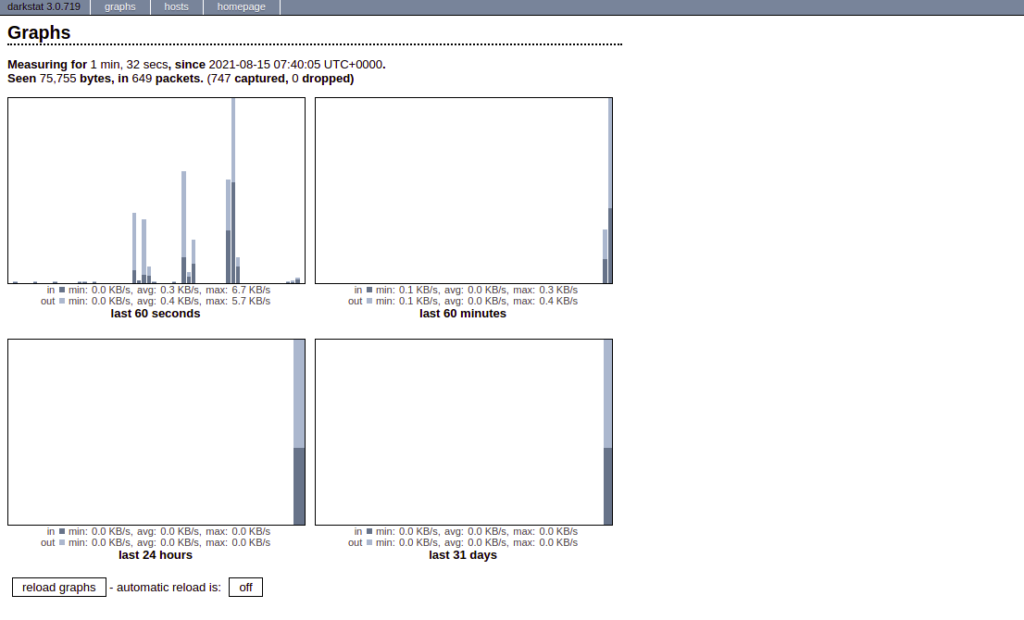
Now, open your web browser and access the Darkstat web interface using the URL http://your-server-ip:666. You should see the following screen:
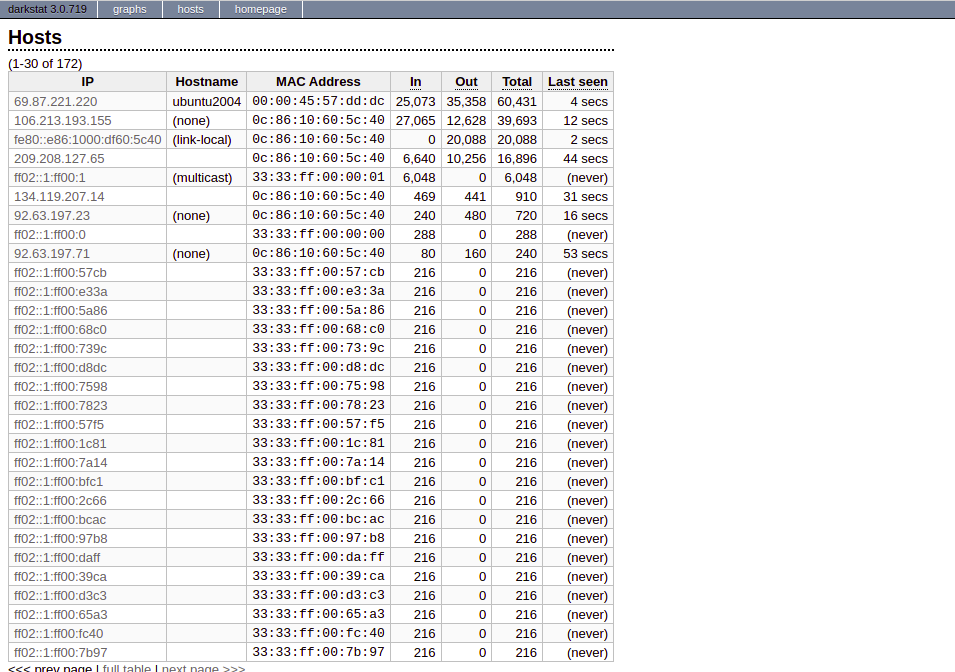
Now, click on the hosts tab. You’ll get a list of all hosts on the network that have attempted to reach the server:
Conclusion
In this guide, we explained how to install and use Darkstat in Linux to capture network traffic over the HTTP. Hopefully this tool will help you to make your Linux server admin job easier; try it out on your Atlantic.Net VPS hosting account!
* This post is for informational purposes only and does not constitute professional, legal, financial, or technical advice. Each situation is unique and may require guidance from a qualified professional.
Readers should conduct their own due diligence before making any decisions.