Table of Contents
- What Is Disk Throughput?
- What Are Disk IOPS?
- The Mechanics of SSD Performance: Garbage Collection and Write Amplification
- The Hidden Cost of Latency
- Deep Dive: Queue Depth and Interface Logic
- RAID Configurations and Independent Disks
- How Does Atlantic.Net Compare?
- Selecting the Right Drive for Specific Situations
- Performance Characteristics Checklist
- The Bottom Line
Whether your server runs an application, a website, a database, a file server, or any other service, storage performance is frequently the most overlooked aspect of a server environment. Yet, the speed of your storage system is often the primary factor in delivering a responsive product to your users.
To ensure your infrastructure meets business demands, you must understand the technical metrics that define speed: disk throughput and disk IOPS (Input/Output Operations Per Second). Furthermore, understanding other factors about the underlying storage technology—from traditional hard disk drives to modern solid state drives—allows you to select the optimal performance tier for your workload.
What Is Disk Throughput?
Disk throughput is the measurement of how fast your storage device can read or write data per second. You have likely seen this number when examining specifications for a hard drive (HDD) or a new solid-state disk (SSD). This metric is typically measured in MB/s (megabytes per second).
Throughput measures the sheer volume of data moved. It is the bandwidth of your storage pipe. For example, if you copy a large video file from one folder to another, the speed at which that progress bar moves is your throughput.
Throughput measures are heavily influenced by the interface used. Traditional hard disk drives and SATA SSDs use the SATA interface, which was originally designed for spinning disks. The SATA interface has a theoretical limit of 600 MB/s. In contrast, NVMe SSDs connect directly to the PCIe bus, bypassing the legacy SATA bottleneck and allowing for significantly high throughput.
Comparative Storage Performance by Device Type
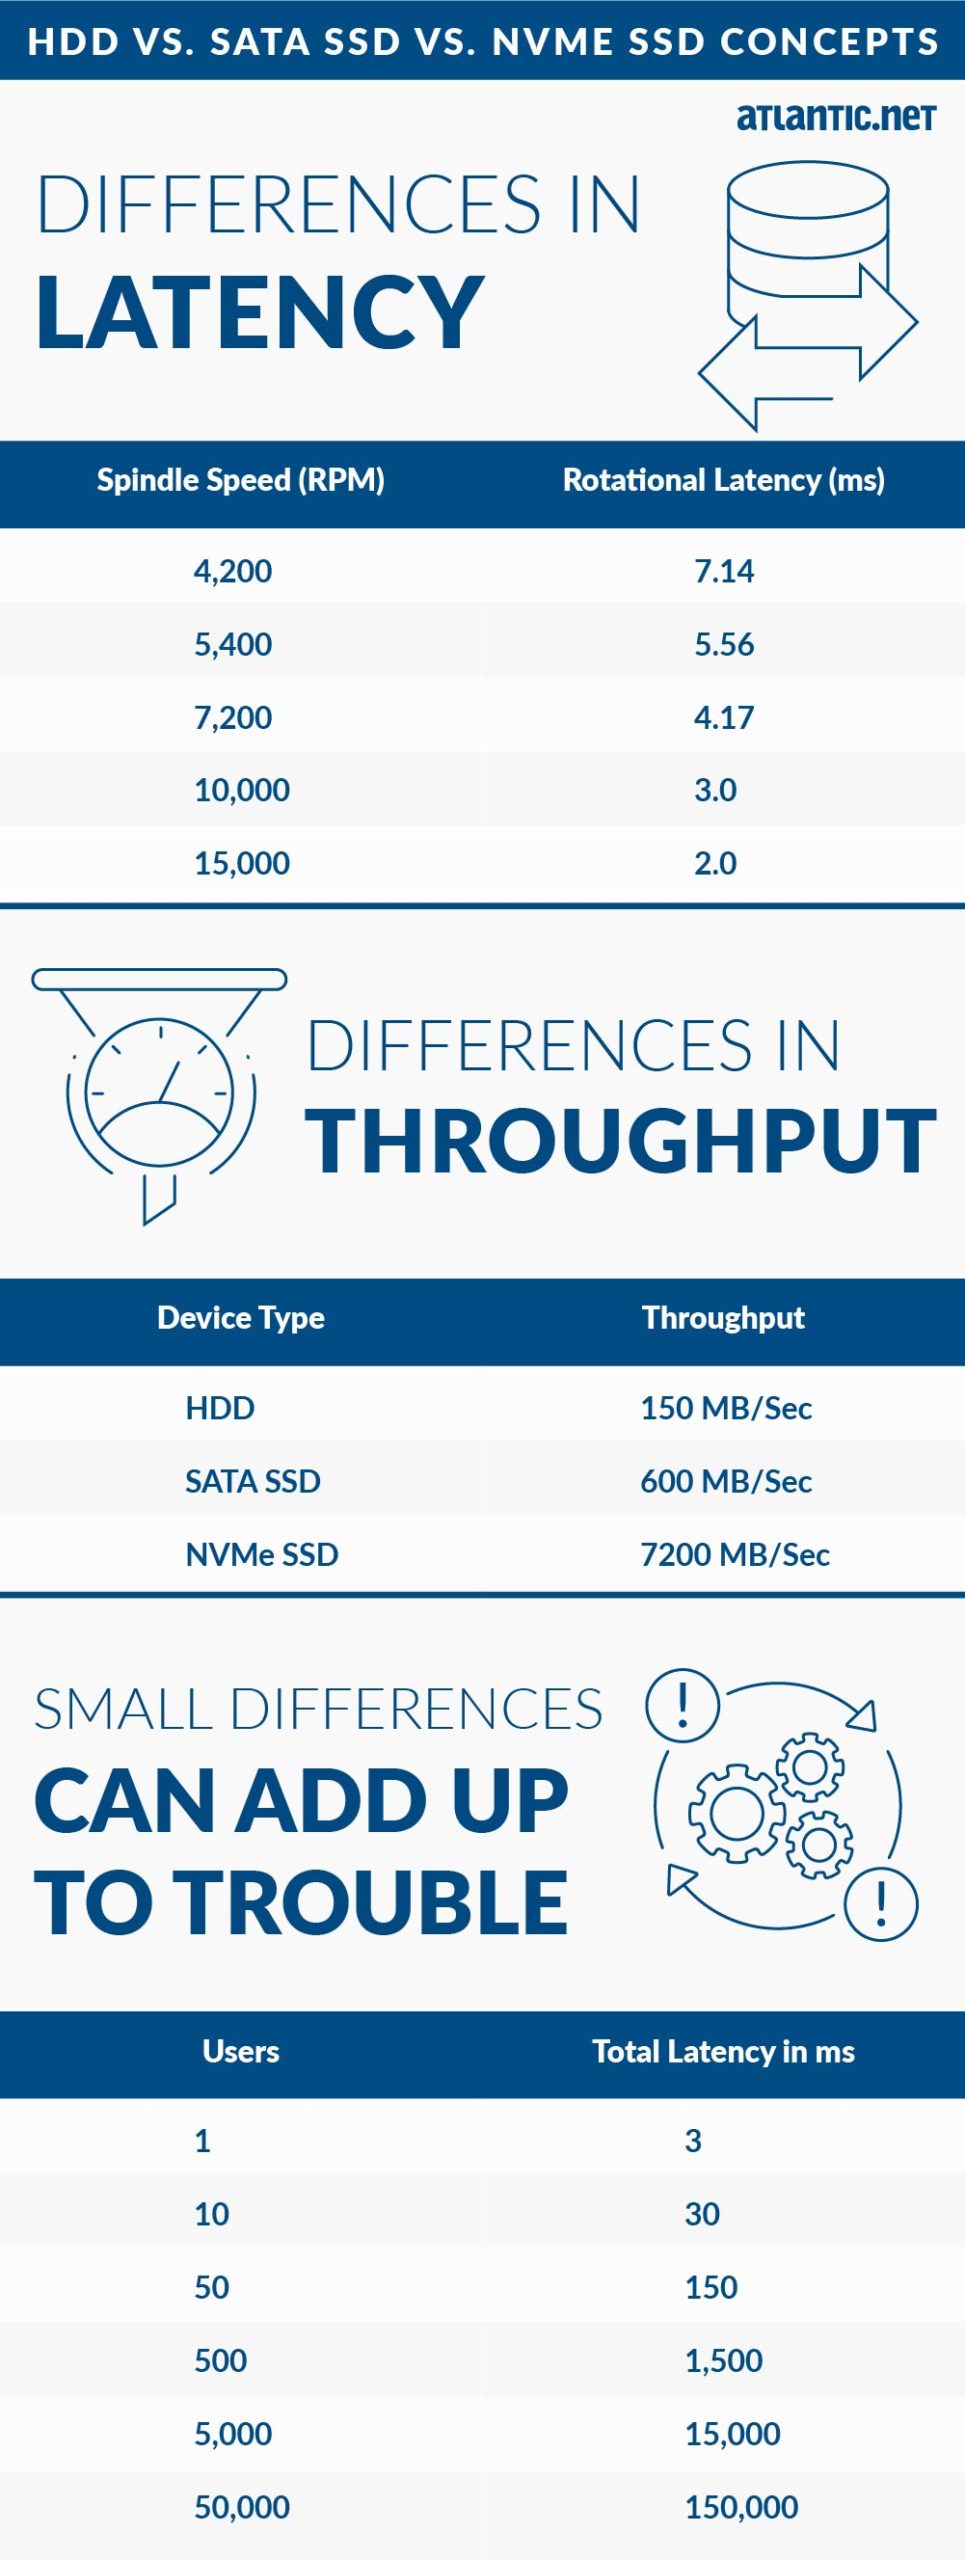
To visualize the difference storage technology makes, consider the maximum sustained transfer rates for common enterprise drives:
- HDD: ~150 MB/sec
- SATA SSD: ~600 MB/sec
- NVMe SSD: ~7200 MB/sec
Even if a drive is rated for a specific maximum speed, actual performance varies based on the application, data block size, number of users, and server load. Sequential operations (like streaming media) usually reach these maximums, while random operations (like database queries) often yield lower throughput.
What Are Disk IOPS?
IOPS (Input/Output Operations Per Second) is a specific measurement of HDD or SSD performance that tracks the number of individual read/write operations a storage device can complete in one second.
While throughput focuses on the volume of data (MB/s), IOPS measures the number of actions. Think of throughput as the speed of a car (mph) and IOPS as the number of passengers the car can drop off at different houses in an hour.
There is a direct mathematical relationship between these two metrics that system architects must calculate to avoid bottlenecks. The formula is:
Throughput (MB/s) = IOPS times Block Size (KB) / 1024
This equation reveals why high IOPS does not always equal high throughput. If your application writes data in tiny 4KB chunks (common in databases), you might achieve high IOPS but low total throughput. Conversely, writing large 1MB files (common in video rendering) yields high throughput but a low IOPS count. Understanding the “Block Size” of your specific application is the only way to accurately predict real-world performance.
Higher IOPS numbers matter significantly for transactional workloads. An increased IOPS value ensures that when a doctor pulls medical records, an accountant accesses receipts, and an internal ticketing system archives old files simultaneously, the system remains responsive.
Each of these actions generates write operations and read requests. The total IOPS capability of your storage array determines whether these requests are served instantly or placed in a queue, causing lag.
Why IOPS Performance Numbers Matter
IOPS performance depends on the mechanical or electronic nature of the drive.
- HDDs: Rely on spinning platters and a moving actuator arm. The physical limitation of moving the head to the correct sector creates a ceiling of roughly 400 IOPS for 15K RPM drives.
- SATA SSDs: Use flash memory, removing moving parts. An enterprise Intel S4510 SATA SSD can deliver roughly 97,000 random read IOPS.
- NVMe SSDs: Utilize the NVMe protocol, designed specifically for flash drives. An Intel Optane DC P5800X can achieve up to 1.5 million IOPS on both IOPS (read and write) metrics.
The Mechanics of SSD Performance: Garbage Collection and Write Amplification
While SSDs are faster than HDDs, they face a unique challenge known as “Write Amplification.” Unlike magnetic drives, SSDs cannot simply overwrite existing data. They must first erase the entire block of memory before writing new data. This process, combined with “Garbage Collection” (the drive’s internal maintenance), can cause performance inconsistencies under heavy sustained loads.
Enterprise-grade SSDs used by premium providers mitigate this via “Overprovisioning”—reserving a percentage of the flash storage for controller operations. This ensures that even when the drive is nearly full, there are enough empty blocks available to maintain high IOPS without the latency spikes associated with the erase-before-write cycle.
The Hidden Cost of Latency
Latency is the delay before a data transfer begins following an instruction. In storage, it defines how long the processor waits for the drive to locate the data. Low latency is essential for a snappy user experience.
Mechanical Latency in HDDs
In traditional hard disk drives, latency is physical. The disk must rotate to the correct position (rotational latency), and the head must move to the correct track (seek time). Spindle speed, measured in Revolutions Per Minute (RPM), directly dictates this delay.
| Spindle Speed (RPM) | Rotational Latency (ms) |
| 4,200 | 7.14 |
| 5,400 | 5.56 |
| 7,200 | 4.17 |
| 10,000 | 3.0 |
| 15,000 | 2.0 |
Electronic Latency in SSDs
Solid state drives eliminate mechanical delays. A standard enterprise SATA SSD might have a latency of 36 microseconds (0.036 ms), while an NVMe drive can reach as low as 5 microseconds. This massive reduction in latency allows for faster data access and better performance for end-users.
Small Differences Accumulate
In a single-user environment, a few milliseconds might seem negligible. However, in cloud computing environments with virtual machines serving hundreds or thousands of users, these delays compound.
Consider a scenario where the average number of users increases. If the storage system cannot clear the queue depth fast enough, requests stack up.
| Concurrent Users | Total Latency (ms) | Impact |
| 1 | 3 | Negligible |
| 50 | 150 | Noticeable |
| 500 | 1,500 | 1.5 Second Delay |
| 5,000 | 15,000 | 15 Second Delay |
As the user count rises, a suboptimal performance tier like HDD storage creates a bottleneck that no amount of CPU or RAM can fix. Data intensive applications require the low latency of SSDs to prevent the system from locking up under load.
This is frequently exacerbated by the “Noisy Neighbor” effect in multi-tenant cloud environments. If a provider places your VM on the same physical storage array as another client running a high-load database, your IOPS availability drops as the queue fills up with their requests. High-performance hosting mitigates this by using storage technologies capable of handling massive queue depths, ensuring one neighbor’s activity does not degrade your service.
Deep Dive: Queue Depth and Interface Logic
A critical but often ignored factor in storage performance is queue depth. This refers to the number of pending I/O requests a storage controller can handle at one time.
SATA SSDs are limited by the AHCI (Advanced Host Controller Interface) standard, which supports a single command queue with a depth of 32 commands. If your workload performance demands more than 32 simultaneous operations, the drive becomes a bottleneck.
NVMe SSDs use the NVMe protocol, which supports up to 64,000 queues, each with a capacity of 64,000 commands. NVMe reduces CPU overhead by streamlining the interrupt handling process. While AHCI requires uncacheable register reads to issue commands, NVMe uses a streamlined “doorbell” system. This advanced controller logic allows NVMe drives to process parallel requests efficiently, making them the ideal IOPS solution for modern multi-core servers. Focusing solely on the drive speed without considering the interface (SATA vs. NVMe) can lead to poor architectural decisions.
RAID Configurations and Independent Disks
To achieve higher IOPS and reliable performance, enterprise servers often use a Redundant Array of Independent Disks (RAID). A RAID configuration combines multiple disks into a single logical unit.
- RAID 0: Stripes data across disks. It increases sequential IOPS and maximum sustained bandwidth but offers no redundancy.
- RAID 1: Mirrors data. It provides high availability and good read speeds but does not increase write speed efficiently.
- RAID 10: Combines mirroring and striping. It offers better performance for random IOPS and high redundancy, making it a preferred choice for database servers.
- RAID 5/6: Uses parity. While cost-effective, the calculation of parity data adds latency to write operations, effectively lowering the write IOPS potential compared to RAID 10. This is known as the “Write Penalty,” where a single write request forces the controller to read the data, read the parity, calculate the new parity, and then write both back to the disk.
When planning your storage solution, remember that adding more data disks in a RAID 0 or 10 array generally increases your total IOPS capacity, as the controller can read from multiple sources simultaneously.
How Does Atlantic.Net Compare?
When evaluating cloud computing providers, you must look beyond the marketing usage of “SSD.” Not all SSD hosting is equal. Storage vendors often throttle IOPS or use lower-grade hardware to save costs.
Atlantic.Net built its cloud offering with a focus on performance characteristics and redundancy. Independent benchmarks reveal significant differences when comparing Atlantic.Net standard performance benchmark against AWS and Azure.
Input Output Operations Per Second Comparison
IOPS numbers act as the primary benchmark for transactional speed.
- Atlantic.Net: Averages 9,525 IOPS per server.
- AWS: Averages 3,020 IOPS per server.
- Azure: Averages 446 IOPS per server.
Atlantic.Net provides IOPS capabilities that are up to 215% higher than AWS and over 2000% higher than Azure standard tiers.
Throughput Comparison
High throughput is essential for large files, backups, and streaming.
- Sequential Disk Writes: Atlantic.Net averages 192.92 MB/s, compared to AWS at 129.8 MB/s and Azure at 65.71 MB/s.
- Random Disk Writes: Atlantic.Net averages 34.63 MB/s, outpacing AWS (12.70 MB/s) and Azure (22.38 MB/s).
This data demonstrates that for the same cost, Atlantic.Net offers a storage drive infrastructure that processes more data faster, avoiding the performance bottlenecks common in restrictive public cloud environments.
Selecting the Right Drive for Specific Situations
Not every workload requires an NVMe SSD delivering a million IOPS. Choosing the correct storage technology depends on your specific IOPS requirements and throughput measures.
1. Archival and Backup (HDD)
Traditional hard disk drives remain relevant for cold storage. If you need to store terabytes of archived data that users essentially never access, the high latency and low random read IOPS of HDDs are acceptable trade-offs for the low cost per gigabyte.
2. General Web Hosting (SATA SSD)
For standard web servers, corporate intranets, or dev/test environments, SATA SSDs provide a massive upgrade over HDDs. They eliminate mechanical seek times and offer enough input output operations per second to handle moderate traffic without lag.
3. Mission-Critical Databases (NVMe SSD)
For data intensive applications, e-commerce platforms, and high-frequency trading, NVMe SSDs are the standard. The ability to handle a massive queue depth and deliver extremely low latency ensures that outstanding IOs never stall the CPU. If your performance required metric involves thousands of concurrent transactions, NVMe is the only logical choice.
Performance Characteristics Checklist
When auditing your current infrastructure or planning a new deployment, evaluate these critical metric points:
- Workload Type: Is it sequential (streaming/backup) or random (database/email)?
- Block Size: Data block size affects performance. Small blocks (4k) stress IOPS; large blocks (64k+) stress throughput.
- Read/Write Mix: A system doing 90% writes (like a log server) needs a different RAID configuration than one doing 90% reads (like a web server).
- Interface Limits: Ensure your backplane supports the speed of your drives. Putting an NVMe drive in a SATA-limited path (via adapters) results in suboptimal performance.
- Driver Support: specialized storage drivers (like VirtIO for KVM) are necessary to pass the physical speed of the disk through to the virtual machines.
The Bottom Line
Storage performance is not just a spec sheet number; it is the foundation of user satisfaction. While HDDs range lowest in cost, their mechanical nature makes them unsuitable for modern, high-traffic applications. Solid state drives, particularly those using the NVMe interface, outperform HDDs by orders of magnitude in both random IOPS and sequential IOPS numbers.
If your business relies on how fast data is processed, high-speed databases, or real-time application delivery, you must prioritize IOPS input output operations and throughput measures.
Atlantic.Net offers storage solutions designed to eliminate the guesswork. With high availability architecture and performance that consistently beats major competitors, we ensure your data processed metrics never hit a wall. Whether you need the raw speed of NVMe or the density of SATA, our platform delivers the ideal IOPS value for your budget.
* This post is for informational purposes only and does not constitute professional, legal, financial, or technical advice. Each situation is unique and may require guidance from a qualified professional.
Readers should conduct their own due diligence before making any decisions.