Dstat is a versatile tool used for monitoring several system resources such as CPU, Memory, Network, Processes, and more. It is a great replacement for older tools such as vmstat, iostat, mpstat, netstat, and ifstat. It displays system resources in a real-time. Dstat is written in Python and allows you to export a generated result in an Excel sheet If you are looking for an all-in-one system resource monitoring tool, then Dstat is the right choice for you.
In this post, we will show you how to install and use the Dstat monitoring tool on Arch Linux.
Step 1 – Configure Repository
By default, the default repository is outdated in Arch Linux, so you will need to modify the default mirror list. You can do it by editing the mirror list configuration file:
nano /etc/pacman.d/mirrorlist
Remove all lines and add the following lines:
## Score: 0.7, United States
Server = http://mirror.us.leaseweb.net/archlinux/$repo/os/$arch
## Score: 0.8, United States
Server = http://lug.mtu.edu/archlinux/$repo/os/$arch
Server = http://mirror.nl.leaseweb.net/archlinux/$repo/os/$arch
## Score: 0.9, United Kingdom
Server = http://mirror.bytemark.co.uk/archlinux/$repo/os/$arch
## Score: 1.5, United Kingdom
Server = http://mirrors.manchester.m247.com/arch-linux/$repo/os/$arch
Server = http://archlinux.dcc.fc.up.pt/$repo/os/$arch
## Score: 6.6, United States
Server = http://mirror.cs.pitt.edu/archlinux/$repo/os/$arch
## Score: 6.7, United States
Server = http://mirrors.acm.wpi.edu/archlinux/$repo/os/$arch
## Score: 6.8, United States
Server = http://ftp.osuosl.org/pub/archlinux/$repo/os/$arch
## Score: 7.1, India
Server = http://mirror.cse.iitk.ac.in/archlinux/$repo/os/$arch
## Score: 10.1, United States
Server = http://mirrors.xmission.com/archlinux/$repo/os/$arch
Save and close the file, then update all the package indexes with the following command:
pacman -Syu
Step 2 – Install Dstat
By default, the Dstat utility is included in the Arch Linux default repository. You can install it using the following command.
pacman -S dstat
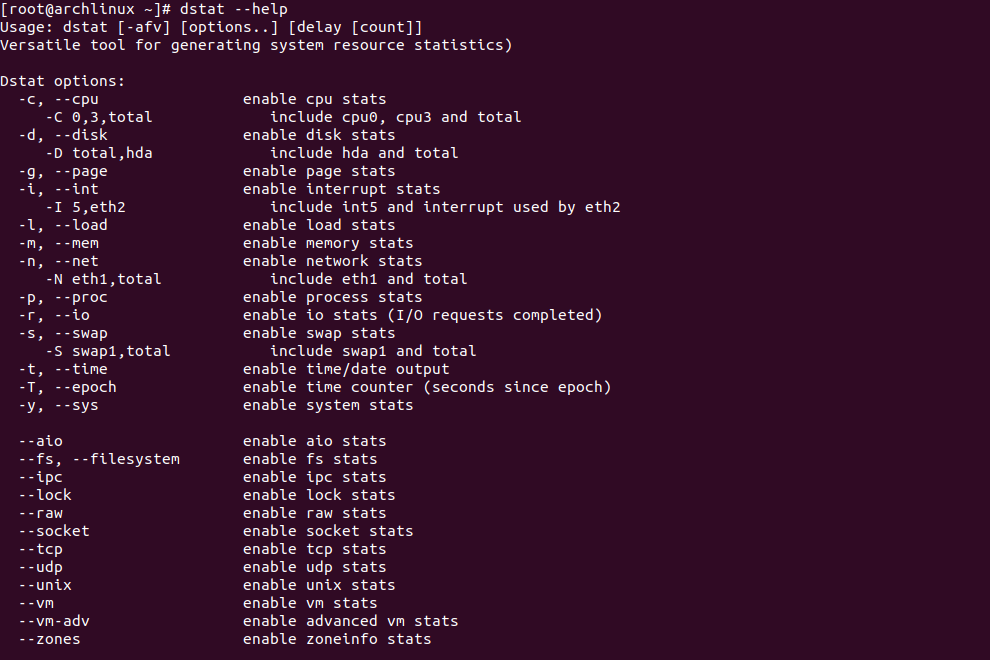
Once Dstat is installed, you can see all Dstat options with the following command.
dstat --help
You should see the following screen.
Step 3 – How to Use Dstat to Monitor System Resources.
To display the CPU usage information, run the following command.
dstat -c
You should see the following screen.
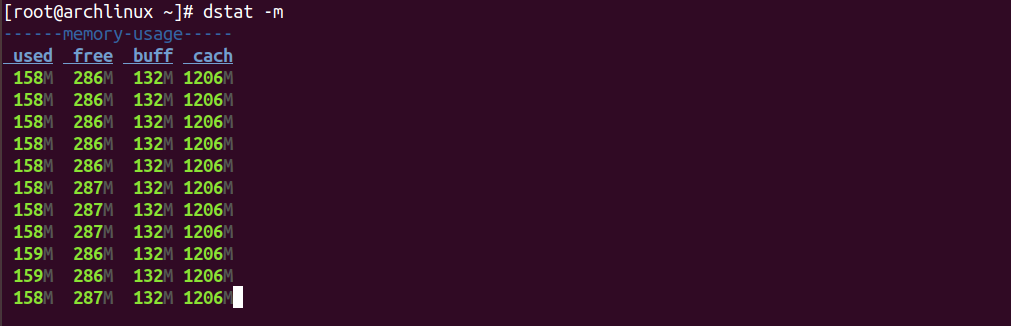
To display the memory usage information, run the following command.
dstat -m
You should see the following screen.
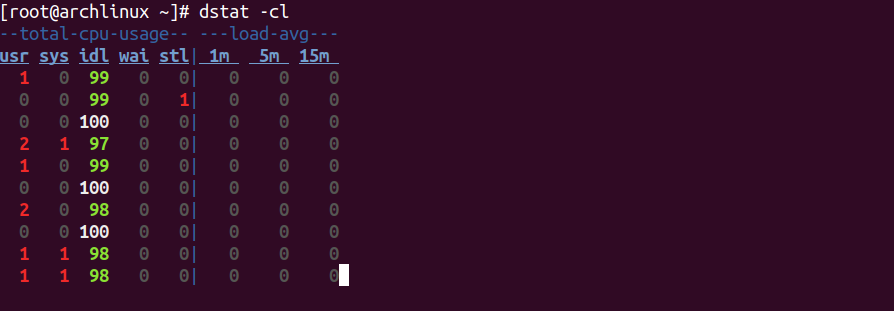
To display CPU usage with load average, run the following command.
dstat -cl
You should see the following screen.
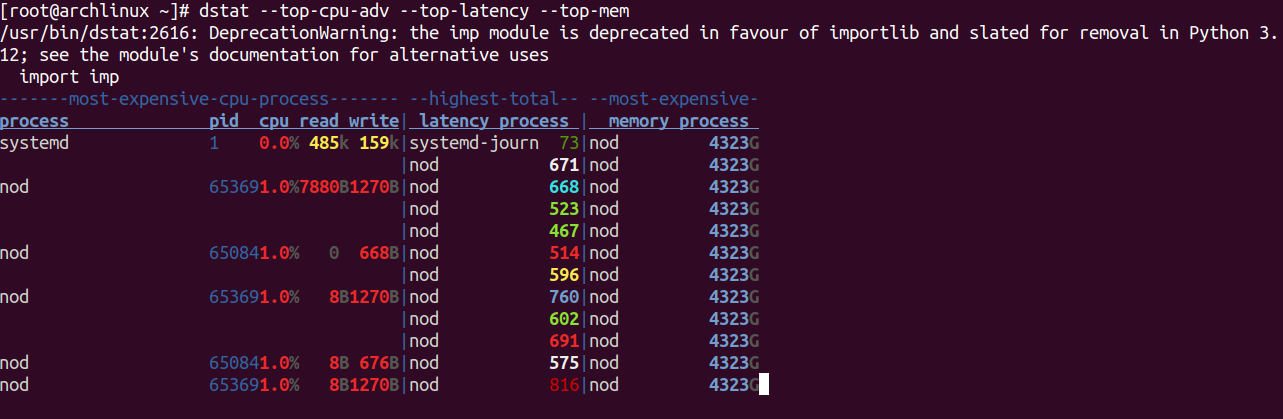
To display the most expensive CPU process with the most expensive memory process, run the following command.
dstat --top-cpu-adv --top-latency --top-mem
You should see the following screen.
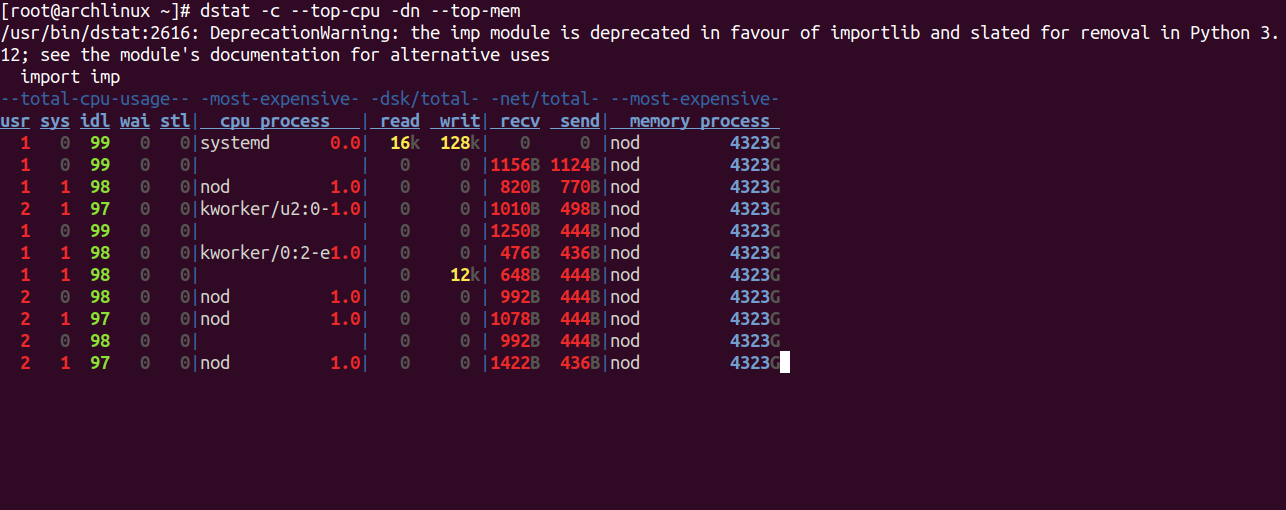
To display to CPU and Memory consuming processes, run the following command.
dstat -c --top-cpu -dn --top-mem
You should see the following screen.
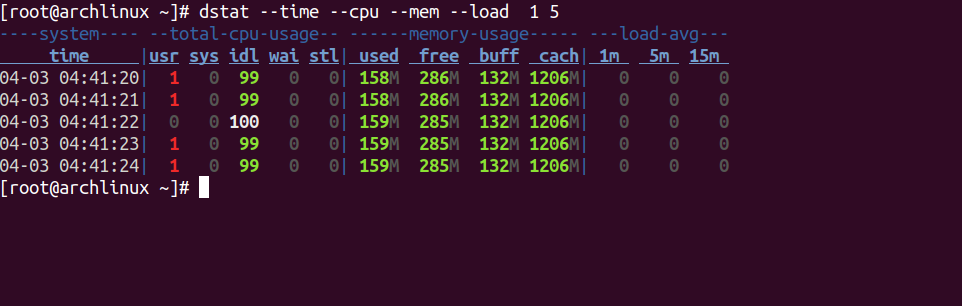
If you want to display the time, CPU, mem, and system load stats with a one-second delay between 5 updates, run the following command.
dstat --time --cpu --mem --load 1 5
You should see the following screen.
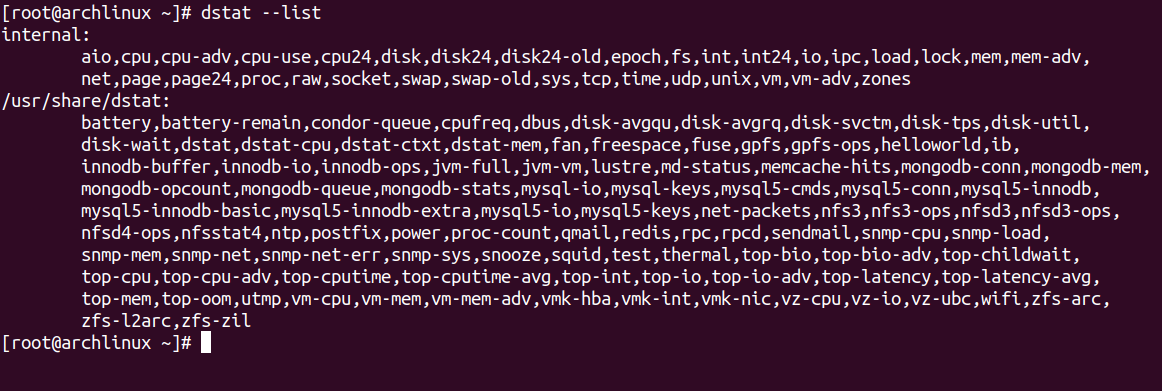
To list all available Dstat plugins, run the following command.
dstat --list
You should see all plugins on the following screen.
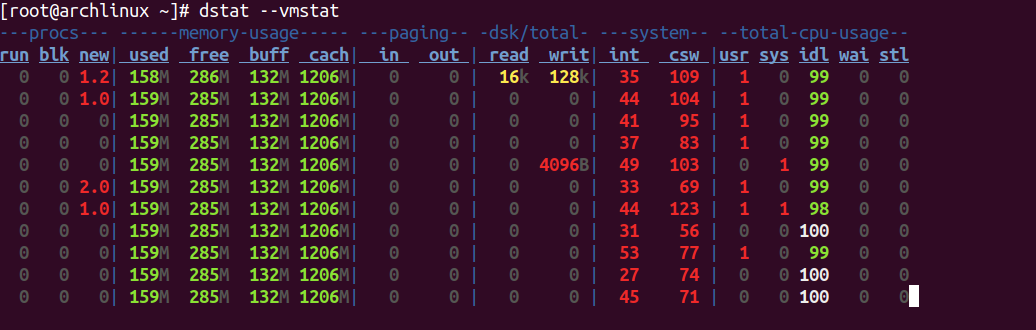
To display information in vmstat format, use the following command:
dstat --vmstat
You should see the following screen.
To display the output without color, run the following command.
dstat --nocolor
Conclusion
In this post, we showed you how to install and use Dstat to monitor server performance and system resources via the command line. You can now use Dstat on dedicated server hosting from Atlantic.Net!
* This post is for informational purposes only and does not constitute professional, legal, financial, or technical advice. Each situation is unique and may require guidance from a qualified professional.
Readers should conduct their own due diligence before making any decisions.