Netdata is a scalable, distributed, real-time monitoring tool for Linux-based operating systems. It is used to monitor CPU, Memory, Processes, Network bandwidth, Database, and more via a web-based interface. It helps system administrators to find and troubleshoot system-related issues. It is written in C, Python, Javascript and can be installed on all major Linux operating systems.
This guide will show you how to install the Netdata monitoring tool on Fedora.
Step 1 – Install Netdata
Netdata package is included in the Fedora default repository. You can install it easily using the following command.
dnf install netdata -y
Once Netdata is installed, you can start the Netdata service and enable it to start at system reboot with the following command.
systemctl start netdata
systemctl enable netdata
To check the status of Netdata, use the following command.
systemctl status netdata
Output:
● netdata.service - Real time performance monitoring
     Loaded: loaded (/usr/lib/systemd/system/netdata.service; disabled; vendor preset: disabled)
     Active: active (running) since Fri 2023-06-23 23:57:02 EDT; 4s ago
    Process: 3549 ExecStartPre=/bin/mkdir -p /var/cache/netdata (code=exited, status=0/SUCCESS)
    Process: 3550 ExecStartPre=/bin/chown -R netdata:netdata /var/cache/netdata (code=exited, status=0/SUCCESS)
    Process: 3551 ExecStartPre=/bin/mkdir -p /var/run/netdata (code=exited, status=0/SUCCESS)
    Process: 3552 ExecStartPre=/bin/chown -R netdata:netdata /var/run/netdata (code=exited, status=0/SUCCESS)
   Main PID: 3553 (netdata)
      Tasks: 31 (limit: 2328)
     Memory: 41.9M
        CPU: 1.637s
     CGroup: /system.slice/netdata.service
             ├─3553 /usr/sbin/netdata -P /var/run/netdata/netdata.pid -D
             ├─3555 /usr/sbin/netdata --special-spawn-server
             ├─3681 /usr/bin/bash /usr/libexec/netdata/plugins.d/tc-qos-helper.sh 1
             ├─3682 /usr/libexec/netdata/plugins.d/apps.plugin 1
             ├─3689 /usr/bin/python3 /usr/libexec/netdata/plugins.d/python.d.plugin 1
             └─3690 /usr/libexec/netdata/plugins.d/nfacct.plugin 1
By default, Netdata listens on port 19999. You can check it with the following command.
ss -antpl | grep 19999
Output.
LISTEN 0      4096        127.0.0.1:19999      0.0.0.0:*    users:(("netdata",pid=3553,fd=7))
LISTEN 0      4096            [::1]:19999         [::]:*    users:(("netdata",pid=3553,fd=6))
Step 2 – Configure Netdata
By default, Netdata can be accessed only from the local host, so if you want to access Netdata from the remote system then you will need to edit the Netdata configuration file and bind it with the server IP.
nano /etc/netdata/netdata.conf
Find the following line.
bind to = localhost
And replace it with the following line.
bind to = your-server-ip
Save and close the file, then restart the Netdata service to apply the changes.
systemctl restart netdata
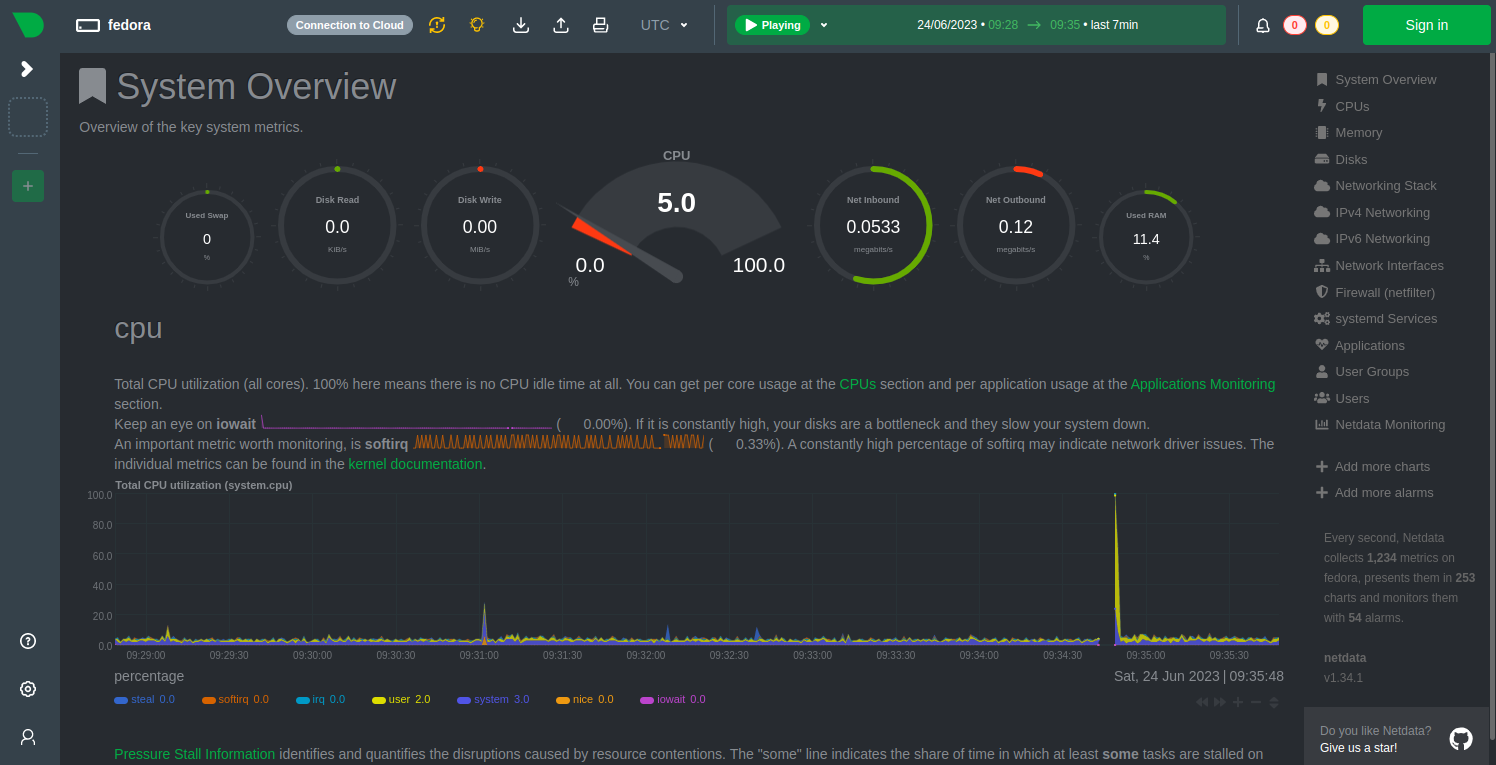
Step 3 – Monitor System Performance with Netdata
Now, open your web browser and access the Netdata web UI using the URL http://your-server-ip:19999. You should see the Netdata dashboard.
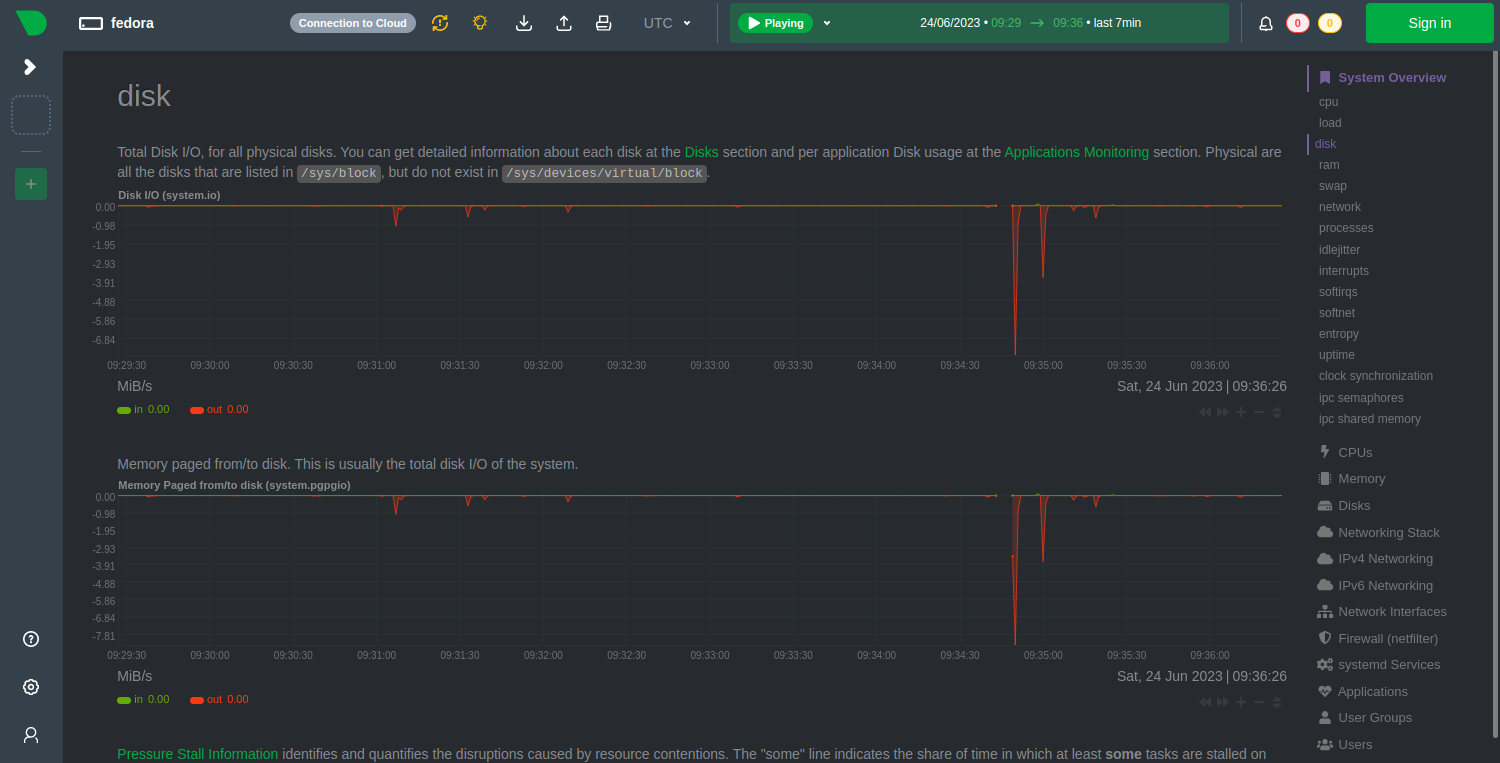
Disk
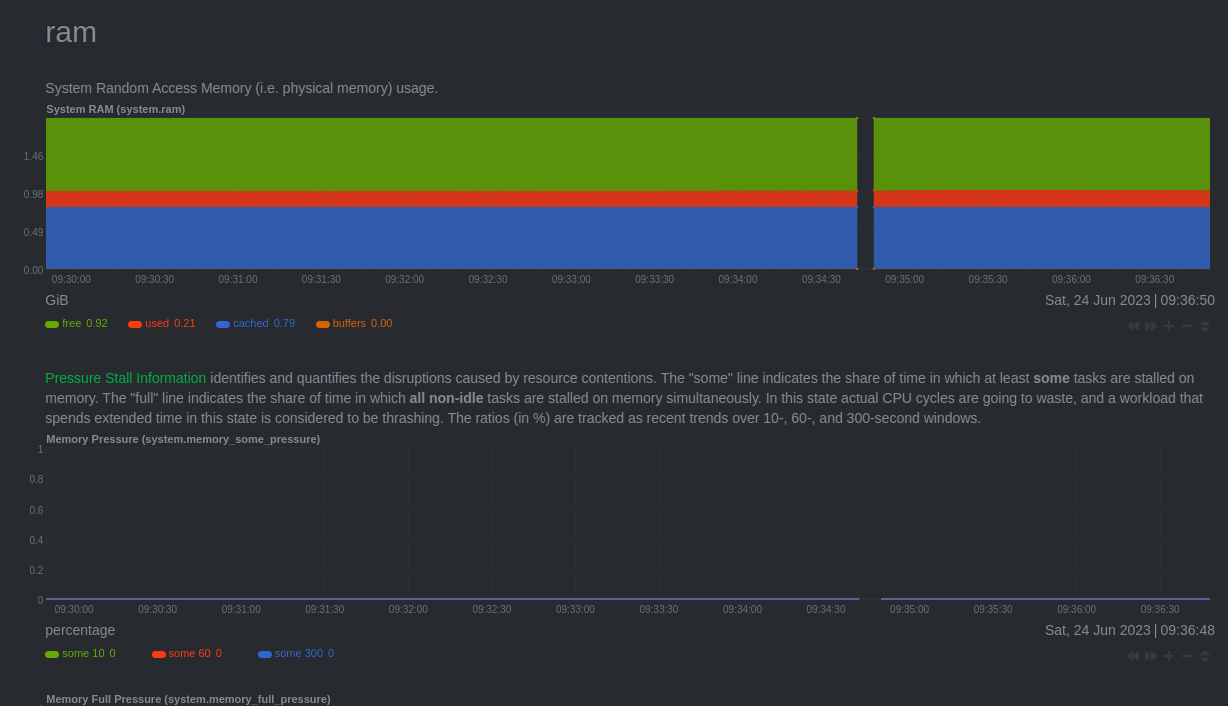
RAM
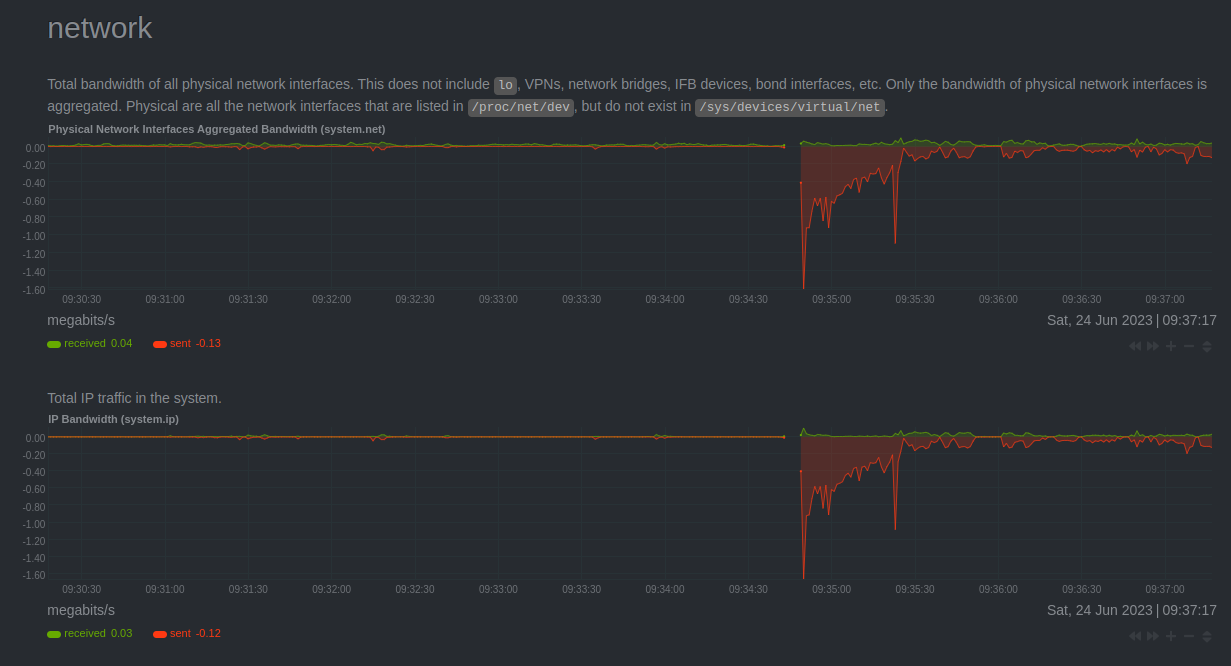
Network
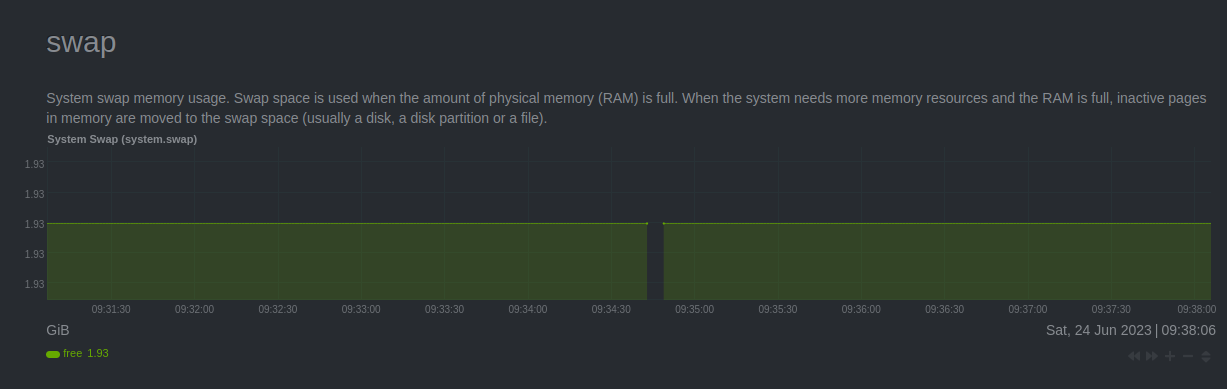
Swap
Conclusion
In this post, we explained how to install the Netdata monitoring tool on Fedora. We also showed you how to enable remote access for Netdata. You can now implement Netdata on your server to monitor all major system metrics via a central dashboard. Now, use Netdata to monitor system performance on dedicated server hosting from Atlantic.Net!
* This post is for informational purposes only and does not constitute professional, legal, financial, or technical advice. Each situation is unique and may require guidance from a qualified professional.
Readers should conduct their own due diligence before making any decisions.