Prometheus is an open-source monitoring and alerting tool that records real-time metrics in a time-series database. It is written in Go and uses a powerful query language (PromQL) to collect the matrics. Prometheus has its own storage system to store and manage collected real-time metrics. It allows you to keep track of CPU usage, memory utilization, network IO wait time, and more. Prometheus was originally developed by SoundCloud and adopted by various companies later.
In this post, we will show you how to install the Prometheus system monitoring tool on Ubuntu 20.04.
Step 1 – Create Prometheus System Users and Directory
It is recommended to create a dedicated user to run Prometheus. You can create users for both Prometheus and Node exporter using the command below:
useradd --no-create-home --shell /bin/false prome
useradd --no-create-home --shell /bin/false node_exporter
Next, create a directory to store the Prometheus configuration file:
mkdir /etc/prometheus
mkdir /var/lib/prometheus
Next, change the ownership of the created directories using the following command:
chown -R prome:prome /var/lib/prometheus/
chown -R prome:prome /etc/prometheus
Step 2 – Install Prometheus and Configure
First, download the latest version of Prometheus from the GitHub repository.
wget https://github.com/prometheus/prometheus/releases/download/v2.31.1/prometheus-2.31.1.linux-amd64.tar.gz
Once the download is completed, extract the downloaded file using the command below:
tar -xvzf prometheus-2.31.1.linux-amd64.tar.gz
Next, copy the Prometheus binary file, configuration file, and other necessary directories:
cp prometheus-2.31.1.linux-amd64/prometheus /usr/local/bin/
cp prometheus-2.31.1.linux-amd64/promtool /usr/local/bin/
cp -r prometheus-2.31.1.linux-amd64/consoles /etc/prometheus
cp -r prometheus-2.31.1.linux-amd64/console_libraries /etc/prometheus
cp prometheus-2.31.1.linux-amd64/prometheus.yml /etc/prometheus/
Next, change the ownership of all directories and files:
chown prome:prome /usr/local/bin/prometheus
chown prome:prome /usr/local/bin/promtool
chown -R prome:prome /etc/prometheus/consoles
chown -R prome:prome /etc/prometheus/console_libraries
You can now verify the Prometheus installation using the following command:
prometheus --version
You should get the Prometheus version in the following output:
prometheus, version 2.31.1 (branch: HEAD, revision: 411021ada9ab41095923b8d2df9365b632fd40c3)
  build user:       root@9419c9c2d4e0
  build date:       20211105-20:35:02
  go version:       go1.17.3
  platform:         linux/amd64
Step 3 – Create a Prometheus Systemd Service File
Next, create a Prometheus systemd service file to manage Prometheus.
nano /etc/systemd/system/prometheus.service
Add the following lines:
[Unit]
Description=Prometheus
Wants=network-online.target
After=network-online.target

[Service]
Type=simple
User=prome
Group=prome
ExecReload=/bin/kill -HUP \$MAINPID
ExecStart=/usr/local/bin/prometheus \
  --config.file=/etc/prometheus/prometheus.yml \
  --storage.tsdb.path=/var/lib/prometheus \
  --web.console.templates=/etc/prometheus/consoles \
  --web.console.libraries=/etc/prometheus/console_libraries \
  --web.listen-address=0.0.0.0:9090 \
  --web.external-url=

SyslogIdentifier=prometheus
Restart=always

[Install]
WantedBy=multi-user.target
Save and close the file, then reload the systemd daemon with the following command:
systemctl daemon-reload
Next, start and enable the Prometheus service using the following command:
systemctl start prometheus
systemctl enable prometheus
You can check the status of the Prometheus service using the following command:
systemctl status prometheus
You will get the following output:
● prometheus.service - Prometheus
     Loaded: loaded (/etc/systemd/system/prometheus.service; disabled; vendor preset: enabled)
     Active: active (running) since Fri 2021-11-26 04:39:35 UTC; 3s ago
       Docs: https://prometheus.io/docs/introduction/overview/
   Main PID: 14903 (prometheus)
      Tasks: 6 (limit: 2353)
     Memory: 17.3M
     CGroup: /system.slice/prometheus.service
             └─14903 /usr/local/bin/prometheus --config.file=/etc/prometheus/prometheus.yml --storage.tsdb.path=/var/lib/prometheus --web.con>

Nov 26 04:39:35 ubuntu2004 prometheus[14903]: ts=2021-11-26T04:39:35.124Z caller=head.go:479 level=info component=tsdb msg="Replaying on-disk>
Nov 26 04:39:35 ubuntu2004 prometheus[14903]: ts=2021-11-26T04:39:35.124Z caller=head.go:513 level=info component=tsdb msg="On-disk memory ma>
Nov 26 04:39:35 ubuntu2004 prometheus[14903]: ts=2021-11-26T04:39:35.124Z caller=head.go:519 level=info component=tsdb msg="Replaying WAL, th>
Nov 26 04:39:35 ubuntu2004 prometheus[14903]: ts=2021-11-26T04:39:35.124Z caller=head.go:590 level=info component=tsdb msg="WAL segment loade>
Nov 26 04:39:35 ubuntu2004 prometheus[14903]: ts=2021-11-26T04:39:35.125Z caller=head.go:596 level=info component=tsdb msg="WAL replay comple>
Nov 26 04:39:35 ubuntu2004 prometheus[14903]: ts=2021-11-26T04:39:35.127Z caller=main.go:866 level=info fs_type=EXT4_SUPER_MAGIC
Nov 26 04:39:35 ubuntu2004 prometheus[14903]: ts=2021-11-26T04:39:35.127Z caller=main.go:869 level=info msg="TSDB started"
Nov 26 04:39:35 ubuntu2004 prometheus[14903]: ts=2021-11-26T04:39:35.127Z caller=main.go:996 level=info msg="Loading configuration file" file>
Nov 26 04:39:35 ubuntu2004 prometheus[14903]: ts=2021-11-26T04:39:35.128Z caller=main.go:1033 level=info msg="Completed loading of configurat>
Nov 26 04:39:35 ubuntu2004 prometheus[14903]: ts=2021-11-26T04:39:35.128Z caller=main.go:811 level=info msg="Server is ready to receive web r>
At this point, Prometheus is started and listens on port 9090. You can check it using the following command:
ss -antpl | grep 9090
You will get the following output:
LISTEN 0 4096 *:9090 *:* users:(("prometheus",pid=14903,fd=7))
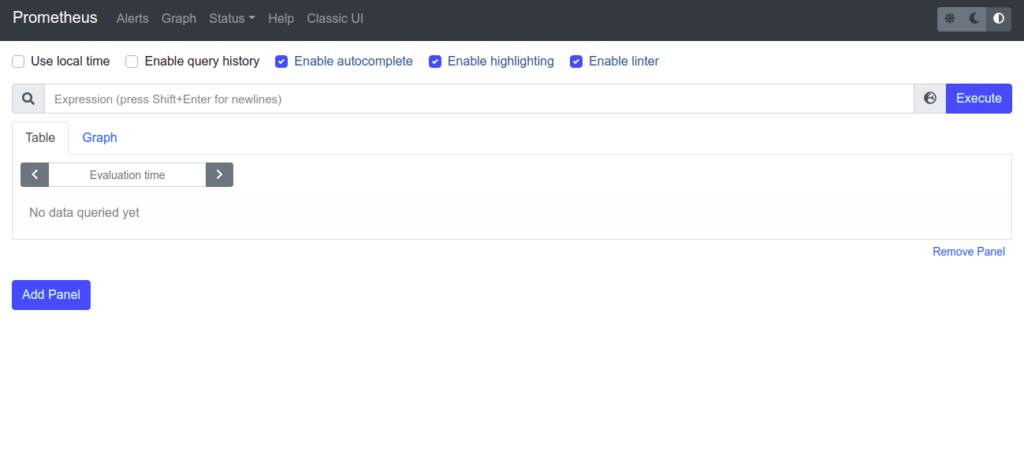
Step 4 – Access Prometheus Web Interface
Now, open your web browser and access the Prometheus web interface using the URL http://your-server-ip:9090. You should see the Prometheus dashboard on the following screen:
Conclusion
Congratulations! You have successfully installed the Prometheus system monitoring tool on Ubuntu 20.04. You can now add your application or services and start monitoring them from the Prometheus dashboard. Try it on dedicated hosting from Atlantic.Net!
* This post is for informational purposes only and does not constitute professional, legal, financial, or technical advice. Each situation is unique and may require guidance from a qualified professional.
Readers should conduct their own due diligence before making any decisions.