Uptime-Kuma is a free, open-source, self-hosted monitoring tool written in Nodejs. It provides a web-based interface and supports multiple notification methods including Webhooks, Telegram, Discord, Gotify, Slack, Pushover, Email (SMTP), and more. Uptime-Kumacan monitor the uptime of remote hosts or servers via TCP, Ping, and HTTPS. If you are looking for a tool to monitor the uptime of remote servers, then Uptime-Kuma is the best tool for you.
In this post, we will show you how to install the Uptime-Kuma uptime monitoring tool on Ubuntu 20.04.
Step 1 – Install Nodejs
Uptime-Kuma is written in Node.js, so you will need to install Node.js to your server.
First, install the necessary dependencies using the following command.
apt-get install -y ca-certificates curl gnupg
Next, download the Node.js GPG key.
mkdir -p /etc/apt/keyrings
curl -fsSL https://deb.nodesource.com/gpgkey/nodesource-repo.gpg.key | gpg --dearmor -o /etc/apt/keyrings/nodesource.gpg
Next, add the NodeSource repo to the APT source list.
echo "deb [signed-by=/etc/apt/keyrings/nodesource.gpg] https://deb.nodesource.com/node_18.x nodistro main" | tee /etc/apt/sources.list.d/nodesource.list
Then, update the repository index and install the Ndoe.js with the following command.
apt update
apt-get install -y nodejs
Next, verify the Node.js version using the following command.
node -v
Output.
v18.19.0
Step 2 – Install Uptime-Kuma
You can download the latest version of Uptime-Kuma from the GitHub repository using the following command:
git clone https://github.com/louislam/uptime-kuma.git
Once the download is completed, change the directory to uptime-kuma and set up it with the following command:
cd uptime-kuma/
npm run setup
Step 3 – Run Uptime-Kuma with pm2
pm2 is a process manager for Node.js. It allows you to run Node.js applications and keep them alive. You can install pm2 using the NPM as shown below:
npm install pm2@latest -g
Once the pm2 is installed, change the directory to uptime-kuma and run it using the following command:
pm2 start npm --name uptime-kuma -- run start-server -- --port=3001 --hostname=127.0.0.1
You will get the following output:
[PM2] Spawning PM2 daemon with pm2_home=/root/.pm2
[PM2] PM2 Successfully daemonized
[PM2] Starting /usr/bin/npm in fork_mode (1 instance)
[PM2] Done.
┌─────┬────────────────┬─────────────┬─────────┬─────────┬──────────┬────────┬──────┬───────────┬──────────┬──────────┬──────────┬──────────┐
│ id  │ name           │ namespace   │ version │ mode    │ pid      │ uptime │ ↺    │ status    │ cpu      │ mem      │ user     │ watching │
├─────┼────────────────┼─────────────┼─────────┼─────────┼──────────┼────────┼──────┼───────────┼──────────┼──────────┼──────────┼──────────┤
│ 0   │ uptime-kuma    │ default     │ N/A     │ fork    │ 14381    │ 0s     │ 0    │ online    │ 0%       │ 20.2mb   │ root     │ disabled │
└─────┴────────────────┴─────────────┴─────────┴─────────┴──────────┴────────┴──────┴───────────┴──────────┴──────────┴──────────┴──────────┘
You can check the application logs using the following command:
pm2 logs
You will get the following output:
0|uptime-k | Database Patched Successfully
0|uptime-k | JWT secret is not found, generate one.
0|uptime-k | Stored JWT secret into database
0|uptime-k | No user, need setup
0|uptime-k | Adding route
0|uptime-k | Adding socket handler
0|uptime-k | Init the server
0|uptime-k | Listening on 3001
Next, enable the Node.js application to start after the system reboot:
pm2 startup
Output:
/etc/systemd/system/pm2-root.service
Command list
[ 'systemctl enable pm2-root' ]
[PM2] Writing init configuration in /etc/systemd/system/pm2-root.service
[PM2] Making script booting at startup...
[PM2] [-] Executing: systemctl enable pm2-root...
Created symlink /etc/systemd/system/multi-user.target.wants/pm2-root.service → /etc/systemd/system/pm2-root.service.
[PM2] [v] Command successfully executed.
+---------------------------------------+
[PM2] Freeze a process list on reboot via:
$ pm2 save

[PM2] Remove init script via:
$ pm2 unstartup systemd
Next, save your application state using the following command:
pm2 save
Step 4 – Configure Apache as a Reverse Proxy for Uptime-Kuma
Next, you will need to install and configure the Apache as a reverse proxy for Uptime-Kuma.
First, install the Apache package with the following command:
apt-get install apache2 -y
Once the Apache web server is installed, enable the required modules with the following command:
a2enmod ssl proxy proxy_ajp proxy_wstunnel proxy_http rewrite deflate headers proxy_balancer proxy_connect proxy_html
Next, create a virtual host configuration file for Uptime-Kuma:
nano /etc/apache2/sites-available/uptime-kuma.conf
Add the following lines:
<VirtualHost *:80>
  ServerName kuma.example.com

  ProxyPass / http://localhost:3001/
  RewriteEngine on
  RewriteCond %{HTTP:Upgrade} websocket [NC]
  RewriteCond %{HTTP:Connection} upgrade [NC]
  RewriteRule ^/?(.*) "ws://localhost:3001/$1" [P,L]
</VirtualHost>
Save and close the file, then activate the Apache virtual host configuration file with the following command:
a2ensite uptime-kuma
Finally, restart the Apache service to apply the changes:
systemctl restart apache2
Step 5 – Access Uptime-Kuma Web Interface
Now, open your web browser and access the Uptime-Kuma web interface using the URL http://kuma.example.com. You should see the following screen:
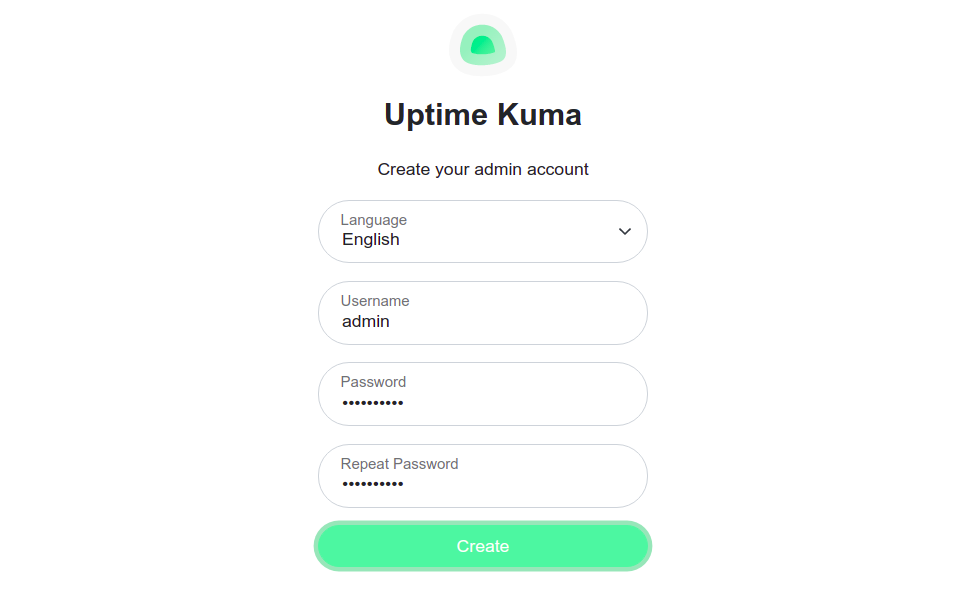
Here, create your administrative user, set your password, and click on the Create button. You will be redirected to the Kuma dashboard screen:
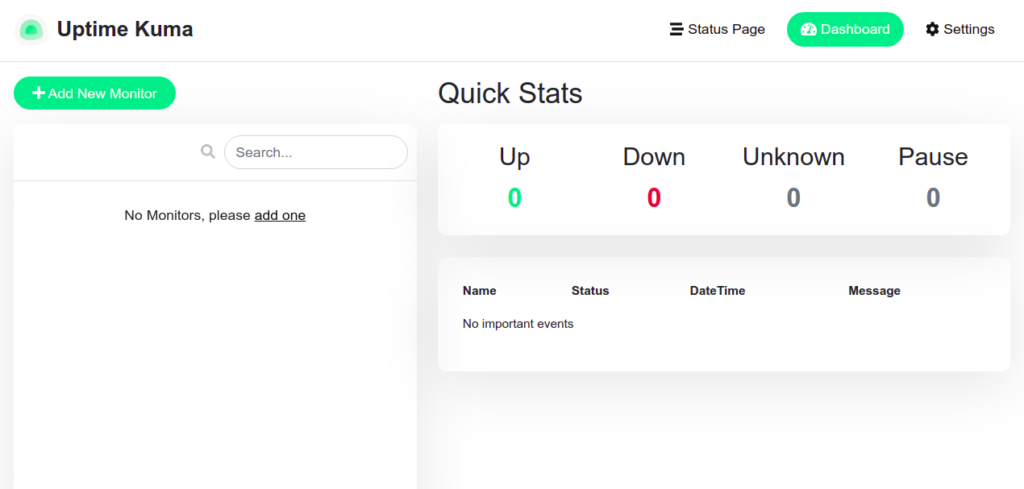
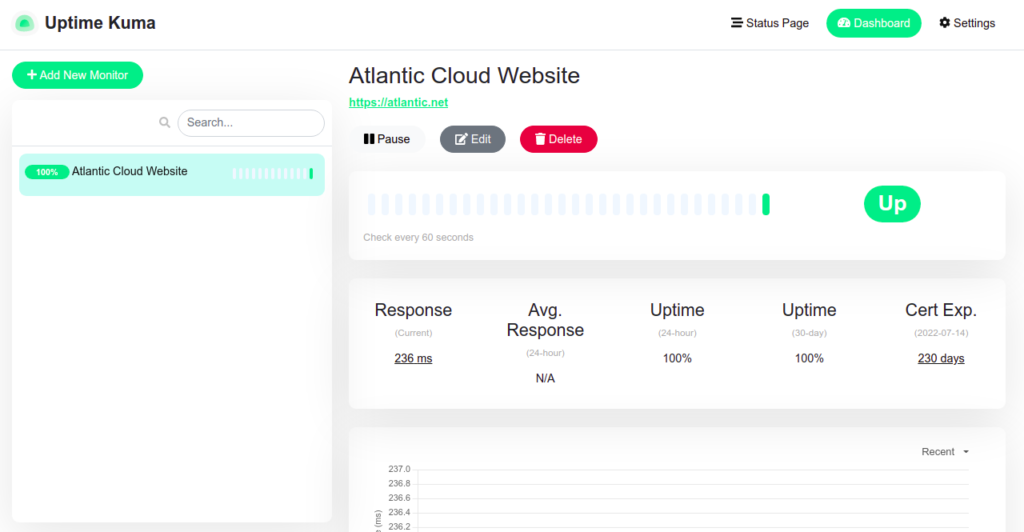
Now, click on the Add New Monitor to add a remote host that you want to monitor. You should see the following screen:
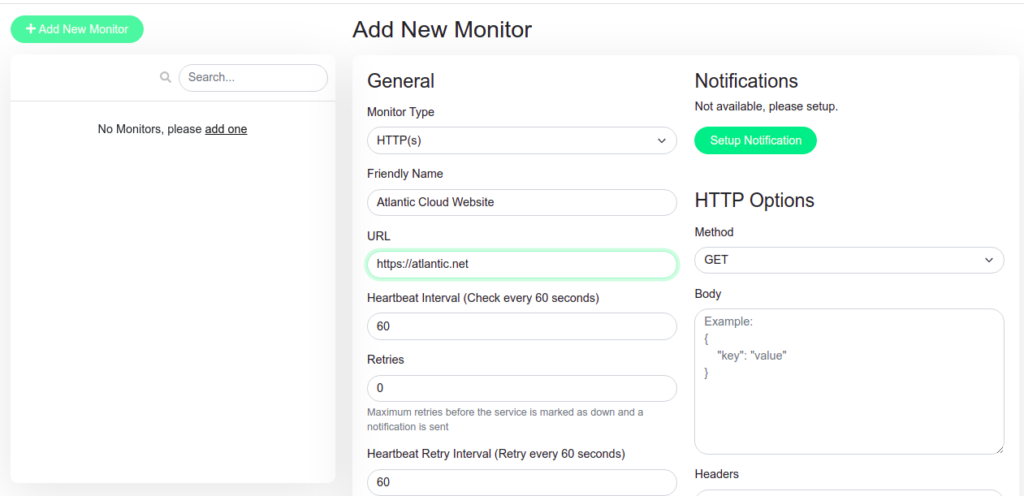
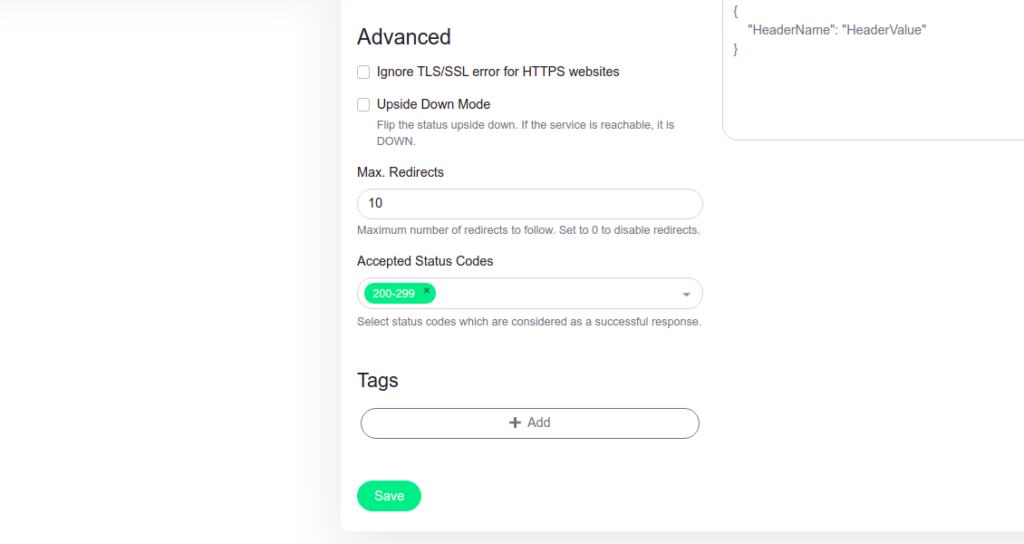
Provide all necessary information and click on the Save button. You should see the Uptime of your remote host on the following screen:
Conclusion
Congratulations! You have successfully installed Uptime-Kuma uptime monitoring tool on Ubuntu 20.04. You can now add more remote hosts and monitor them from a single location. Try it on dedicated hosting from Atlantic.Net!
* This post is for informational purposes only and does not constitute professional, legal, financial, or technical advice. Each situation is unique and may require guidance from a qualified professional.
Readers should conduct their own due diligence before making any decisions.