Node.js is an open-source JavaScript runtime environment built on Chrome’s V8. It is mainly used to execute JavaScript code outside a web browser. It uses an asynchronous, event-driven model, perfect for data-intensive applications.
After deploying a Node.js application, you may need a tool to monitor your application. This is where PM2 can help. PM2 is a popular process manager used for managing and monitoring Node.js applications. It allows you to monitor Node.js applications via CLI and a web-based dashboard.
In this post, we will show you how to install and use PM2 to monitor Node.js applications.
Step 1 – Install Nodejs
First, install the necessary dependencies using the following command.
apt-get install -y ca-certificates curl gnupg
Next, download the Node.js GPG key.
mkdir -p /etc/apt/keyrings
curl -fsSL https://deb.nodesource.com/gpgkey/nodesource-repo.gpg.key | gpg --dearmor -o /etc/apt/keyrings/nodesource.gpg
Next, add the NodeSource repo to the APT source list.
echo "deb [signed-by=/etc/apt/keyrings/nodesource.gpg] https://deb.nodesource.com/node_18.x nodistro main" | tee /etc/apt/sources.list.d/nodesource.list
Then, update the repository index and install the Ndoe.js with the following command.
apt update
apt-get install -y nodejs
Next, verify the Node.js version using the following command.
node -v
Output.
v18.19.0
Step 2 – Create a Simple Nodejs Application
Next, you will need a Node.js application that you want to monitor using PM2. First, create a directory for your application.
mkdir app
Next, create an application file.
cd app
nano app.js
Add the following code:
const http = require('http');

const hostname = 'localhost';
const port = 3000;

const server = http.createServer((req, res) => {
  res.statusCode = 200;
  res.setHeader('Content-Type', 'text/plain');
  res.end('Your Nodejs App is Working!\n');
});

server.listen(port, hostname, () => {
  console.log(`Server running at http://${hostname}:${port}/`);
});
Save and close the file when you are done.
Step 3 – Install and Use PM2 to Manage Nodejs Application
First, install PM2 using the following command.
npm install pm2 -g
Next, start the Node.js application using PM2.
pm2 start app.js
Output.
[PM2] Spawning PM2 daemon with pm2_home=/root/.pm2
[PM2] PM2 Successfully daemonized
[PM2] Starting /root/app/app.js in fork_mode (1 instance)
[PM2] Done.
┌────┬────────┬─────────────┬─────────┬─────────┬──────────┬────────┬──────┬───────────┬──────────┬──────────┬──────────┬──────────┐
│ id │ name   │ namespace   │ version │ mode    │ pid      │ uptime │ ↺    │ status    │ cpu      │ mem      │ user     │ watching │
├────┼────────┼─────────────┼─────────┼─────────┼──────────┼────────┼──────┼───────────┼──────────┼──────────┼──────────┼──────────┤
│ 0  │ app    │ default     │ N/A     │ fork    │ 55173    │ 0s     │ 0    │ online    │ 0%       │ 33.0mb   │ root     │ disabled │
└────┴────────┴─────────────┴─────────┴─────────┴──────────┴────────┴──────┴───────────┴──────────┴──────────┴──────────┴──────────┘
You can now list your application using the following command.
pm2 list
Output
┌────┬────────┬─────────────┬─────────┬─────────┬──────────┬────────┬──────┬───────────┬──────────┬──────────┬──────────┬──────────┐
│ id │ name   │ namespace   │ version │ mode    │ pid      │ uptime │ ↺    │ status    │ cpu      │ mem      │ user     │ watching │
├────┼────────┼─────────────┼─────────┼─────────┼──────────┼────────┼──────┼───────────┼──────────┼──────────┼──────────┼──────────┤
│ 0  │ app    │ default     │ N/A     │ fork    │ 55173    │ 16s    │ 0    │ online    │ 0%       │ 51.2mb   │ root     │ disabled │
└────┴────────┴─────────────┴─────────┴─────────┴──────────┴────────┴──────┴───────────┴──────────┴──────────┴──────────┴──────────┘
To stop and delete the application, run the following command.
pm2 stop app.js
pm2 delete app.js
To reload the application after making changes, run the following command.
pm2 reload app.js
To add the application at system startup, run the following command.
pm2 startup
To check the application log, run the following command.
pm2 logs
Output.
PM2        | 2023-07-30T10:23:06: PM2 log: BUS socket file      : /root/.pm2/pub.sock
PM2        | 2023-07-30T10:23:06: PM2 log: Application log path : /root/.pm2/logs
PM2        | 2023-07-30T10:23:06: PM2 log: Worker Interval      : 30000
PM2        | 2023-07-30T10:23:06: PM2 log: Process dump file    : /root/.pm2/dump.pm2
PM2        | 2023-07-30T10:23:06: PM2 log: Concurrent actions   : 2
PM2        | 2023-07-30T10:23:06: PM2 log: SIGTERM timeout      : 1600
PM2        | 2023-07-30T10:23:06: PM2 log: ===============================================================================
PM2        | 2023-07-30T10:23:06: PM2 log: App [app:0] starting in -fork mode-
PM2        | 2023-07-30T10:23:06: PM2 log: App [app:0] online
PM2        | 2023-07-30T10:23:36: PM2 log: Process 0 in a stopped status, starting it
PM2        | 2023-07-30T10:23:36: PM2 log: Stopping app:app id:0
PM2        | 2023-07-30T10:23:36: PM2 log: App [app:0] exited with code [0] via signal [SIGINT]
PM2        | 2023-07-30T10:23:37: PM2 log: pid=55173 msg=process killed
PM2        | 2023-07-30T10:23:37: PM2 log: App [app:0] starting in -fork mode-
PM2        | 2023-07-30T10:23:37: PM2 log: App [app:0] online

/root/.pm2/logs/app-error.log last 15 lines:
/root/.pm2/logs/app-out.log last 15 lines:
0|app      | Server running at http://localhost:3000/
0|app      | Server running at http://localhost:3000/
Step 4 – Monitor Nodejs Application Using PM2 Dashboard
PM2 also provides a web-based dashboard that allows you to monitor and diagnose Node.js applications in real-time.
To use the PM2 dashboard, go to https://app.pm2.io, then sign up as shown in the following screenshot.
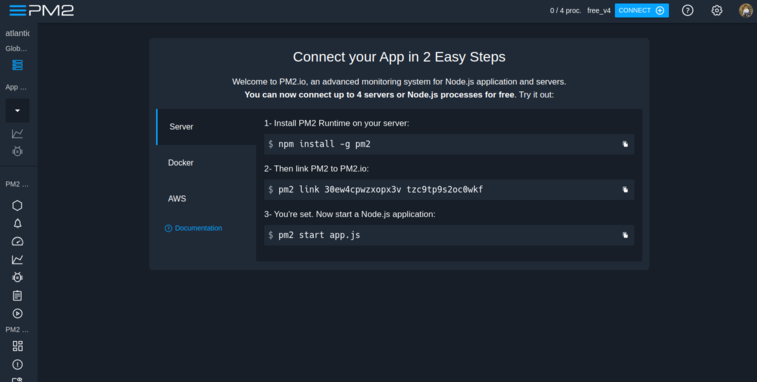
After the successful login, copy the pm2 link command from the above screenshot and run it on your server.
pm2 link 30ew4cpwzxopx3v tzc9tp9s2oc0wkf
You will see the following output:
[PM2 I/O] Using: Public key: tzc9tp9s2oc0wkf | Private key: 30ew4cpwzxopx3v | Machine name: fedora-e930
[+] PM2+ activated!
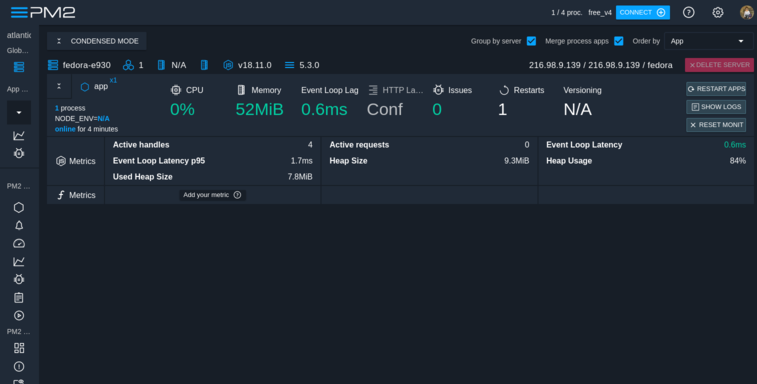
Now, refresh the PM2 dashboard page. You should see that your server is connected and showing a list of all your Nodejs applications in expanded mode.
Step 5 – Monitor Nodejs Using pm2-server-monit
You can also use the pm2-server-monit module to monitor your application’s CPU, disk, and memory usage, network speed, and other key aspects of your server.
You can install the pm2-server-monit module with the following command.
pm2 install pm2-server-monit
Output:
⇆ PM2+ activated | Instance Name: fedora-e930 | Dash: https://app.pm2.io/#/r/tzc9tp9s2oc0wkf
┌────┬─────────────────────┬─────────────┬─────────┬─────────┬──────────┬────────┬──────┬───────────┬──────────┬──────────┬──────────┬──────────┐
│ id │ name                │ namespace   │ version │ mode    │ pid      │ uptime │ ↺    │ status    │ cpu      │ mem      │ user     │ watching │
├────┼─────────────────────┼─────────────┼─────────┼─────────┼──────────┼────────┼──────┼───────────┼──────────┼──────────┼──────────┼──────────┤
│ 0  │ app                 │ default     │ N/A     │ fork    │ 55202    │ 5m     │ 1    │ online    │ 0%       │ 52.4mb   │ root     │ disabled │
└────┴─────────────────────┴─────────────┴─────────┴─────────┴──────────┴────────┴──────┴───────────┴──────────┴──────────┴──────────┴──────────┘
Module
┌────┬──────────────────────────────┬───────────────┬──────────┬──────────┬──────┬──────────┬──────────┬──────────┐
│ id │ module                       │ version       │ pid      │ status   │ ↺    │ cpu      │ mem      │ user     │
├────┼──────────────────────────────┼───────────────┼──────────┼──────────┼──────┼──────────┼──────────┼──────────┤
│ 1  │ pm2-server-monit             │ 3.0.0         │ 55367    │ online   │ 0    │ 0%       │ 26.9mb   │ root     │
└────┴──────────────────────────────┴───────────────┴──────────┴──────────┴──────┴──────────┴──────────┴──────────┘
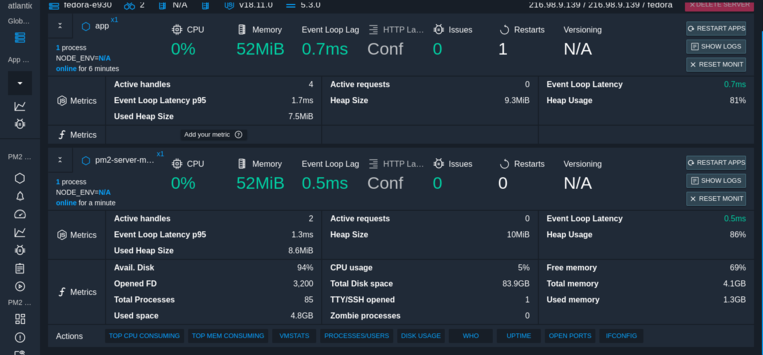
Once installed, go back to your PM2 dashboard. You should see your server’s key metrics on the following screen.
If you want to remove your server from the PM2 dashboard, run the following command:
pm2 unlink
Output:
[PM2 I/O] Permanently disable agent...
[PM2 I/O] Agent interaction ended
Conclusion
In this post, we showed you how to install Node.js, create a Node.js application and then manage it via the command line. Then, we explained how to install the PM2 dashboard and monitor your application via a web-based dashboard. You can now deploy the Node.js application on virtual private server hosting from Atlantic.Net! and start monitoring it using the PM2 dashboard.
* This post is for informational purposes only and does not constitute professional, legal, financial, or technical advice. Each situation is unique and may require guidance from a qualified professional.
Readers should conduct their own due diligence before making any decisions.